Page 1
ENVIRONMENTALHEALTH PERSPECTIVES
Note to readers with disabilities: EHP will provide a 508-conformant version of this article upon final publication. If you require a 508-conformant version before then, please contact [email protected] . Our staff will work with you to assess and meet your accessibility needs within 3 working days.
http://www.ehponline.org
ehpIngested Nitrate and Breast Cancer in the Spanish Multicase-Control Study on Cancer (MCC-Spain)
Nadia Espejo-Herrera, Esther Gracia-Lavedan, Marina Pollan, Nuria Aragonés, Elena Boldo, Beatriz Perez-Gomez, Jone M. Altzibar, Pilar Amiano, Ana Jiménez Zabala, Eva Ardanaz, Marcela Guevara, Antonio J. Molina,
Juan Pablo Barrio, Ines Gómez-Acebo, Adonina Tardón, Rosana Peiró, Ma Dolores Chirlaque, Margarita Palau,
Montse Muñoz, Laia Font-Ribera, Gemma Castaño-Vinyals, Manolis Kogevinas, and Cristina M. Villanueva
http://dx.doi.org/10.1289/ehp.1510334
Received: 12 June 2015Accepted: 22 February 2016
Advance Publication: 4 March 2016
Page 2
Environ Health Perspect DOI: 10.1289/ehp.1510334 Advance Publication: Not Copyedited
1
Ingested Nitrate and Breast Cancer in the Spanish Multicase-
Control Study on Cancer (MCC-Spain)
Nadia Espejo-Herrera1,2,3, Esther Gracia-Lavedan1,2,3, Marina Pollan4,5,3, Nuria Aragonés4,5,3,
Elena Boldo4,5,3, Beatriz Perez-Gomez4,5,3, Jone M. Altzibar6,3, Pilar Amiano6,3, Ana Jiménez
Zabala6, Eva Ardanaz7,3,8, Marcela Guevara7,3,8, Antonio J. Molina 9, Juan Pablo Barrio9, Ines
Gómez-Acebo10,3, Adonina Tardón11,3, Rosana Peiró12,3, Ma Dolores Chirlaque13,14,3, Margarita
Palau15, Montse Muñoz16, Laia Font-Ribera1,17,2,3, Gemma Castaño-Vinyals1,17,2,3, Manolis
Kogevinas1,17,2,3, and Cristina M. Villanueva1,17,2,3
1Centre for Research in Environmental Epidemiology (CREAL), Barcelona, Spain;
2Departament de Ciències Experimentals i de la Salut, Universitat Pompeu Fabra. Barcelona,
Spain; 3CIBER Epidemiología y Salud Pública (CIBERESP), Madrid, Spain; 4Cancer and
Environmental Epidemiology Unit, National Centre for Epidemiology, Carlos III Institute of
Health, Madrid, Spain; 5Cancer Epidemiology Research Group, Oncology and Hematology Area,
IIS Puerta De Hierro, Madrid, Spain; 6Public Health Division of Gipuzkoa, Biodonostia
Research Institute, San Sebastian, Spain; 7Navarra Public Health Institute, Pamplona, Spain.
8Navarra Institute for Health Research (IdiSNA) Pamplona, Spain; 9Research Group in Gene-
Environment-Health Interactions (GIIGAS), University of Leon, León, Spain; 10IDIVAL,
University of Cantabria, Santander, Spain; 11Oncology Institute IUOPA, Universidad de Oviedo,
Asturias, Spain; 12Centre for Research in Public Health. Valencia, Spain; 13Department of
Epidemiology, Murcia Health Council, IMIB-Arrixaca, Murcia, Spain; 14Department of Health
and Social Sciences, Universidad de Murcia, Murcia, Spain; 15Division of Public Health Quality
Page 3
Environ Health Perspect DOI: 10.1289/ehp.1510334 Advance Publication: Not Copyedited
2
and Innovation. Health Ministry of Spain, Madrid, Spain; 16Translational Genomics and Targeted
Therapeutics in Solid Tumors (IDIBAPS), Hospital Clinic, Barcelona, Spain; 17IMIM (Hospital
del Mar. Medical RESEARCH Institute), Barcelona, Spain
Address correspondence to Cristina M. Villanueva, Centre for Research in Environmental
Epidemiology (CREAL), Doctor Aiguader, 88. 08003 Barcelona, Spain. Telephone: +34
932147344. E-mail address: [email protected]
ORCID: 0000-0002-0783-1259
Running title: Ingested nitrate and breast cancer
Acknowledgments and funding: We acknowledge the institutions and local governments that
provided environmental data in study municipalities, the personnel involved in the recruitment
process, and the participants of the MCC-Spain study. This study was funded by the “Acción
Transversal del Cáncer del Consejo de Ministros del 11/10/2007”, from the “Instituto de Salud
Carlos III-FEDER” (PI08/1770, PI08/0533, PI11/00226), ISCIII FIS grants. NEH receives
financial support for the PhD program from the “Agència de Gestió d’Ajuts Universitaris i de
Recerca (AGAUR FI-DGR 2013) Generalitat de Cataluña”.
Competing financial interests: The authors declare they have no actual or potential competing
financial interests.
Page 4
Environ Health Perspect DOI: 10.1289/ehp.1510334 Advance Publication: Not Copyedited
3
ABSTRACT
Background: Ingested nitrate leads to endogenous formation of N-nitroso compounds that
are breast carcinogens in animals, but human evidence is limited.
Objective: We evaluated ingested nitrate as a risk factor for breast cancer (BC) in a
multicase-control study.
Methods: Hospital-based incident BC cases and population-based controls were recruited
in eight Spanish regions in 2008-2013, providing residential and water consumption from
age 18 years, and information on known BC risk factors. Long-term nitrate levels (1940-
2010) were estimated and linked with residential histories and water consumption to
calculate waterborne ingested nitrate (mg/day). Dietary ingested nitrate (mg/day) was
calculated using food frequency questionnaires and published dietary nitrate contents.
Interactions with endogenous nitrosation factors and other variables were evaluated. A
total of 1245 cases and 1520 controls were included in the statistical analysis.
Results: Average ±SD waterborne ingested nitrate ranged from 2.9 ±1.9 to 13.5 ±7.5
mg/day and dietary ingested nitrate ranged from 88.5 ±48.7 to 154 ±87.8 mg/day, among
regions. Waterborne ingested nitrate was not associated with BC overall, but among
postmenopausal women, those with both high nitrate (>6 vs. <2.6 mg/day) and red meat
intake (≥20 vs. <20 g/day) were more likely to be cases than women with low nitrate and
low red meat intake (adjusted odds ratio= 1.64; 95% confidence interval: 1.08, 2.49; overall
interaction p value= 0.17). No association was found with dietary nitrate.
Conclusions: Waterborne ingested nitrate was associated with BC only among
postmenopausal women with high red meat consumption. Dietary nitrate was not associated
with BC, regardless of the animal or vegetable source, or menopausal status.
Page 5
Environ Health Perspect DOI: 10.1289/ehp.1510334 Advance Publication: Not Copyedited
4
INTRODUCTION
Breast cancer (BC) is the first cause of cancer mortality and the most common cancer
among women worldwide. In Spain, 25,215 new cases are annually diagnosed (Ferlay et al.
2013) with increasing incidence rates during the last decades (Pollán et al. 2009). Several
risk factors have been identified, including sex, age, nulliparity, short breastfeeding,
menstrual and reproductive history, high body mass index (particularly in post-menopausal
women), physical inactivity, high alcohol or energy intake, use of drugs with estrogenic
action, exposure to ionizing radiation, specific genetic factors, family history of BC,
previous diagnosis of non-malignant breast diseases and high mamographic density
(Hankinson et al. 2004; Romieu et al. 2015; Stewart 2014). Established risk factors explain
around 50% of the incidence variation of this tumor, and other environmental exposures
may partly explain the remaining variation (Brody et al. 2007).
Nitrate is a frequent contaminant in drinking water worldwide, related to excessive
fertilizers´ use or sewage (Wakida and Lerner 2005). Humans are exposed to nitrate
through diet and drinking water ingestion. The maximum contaminant level in drinking
water (50 mg/L as nitrate ion NO3- or 10 mg/L of nitrate-N) (EU 1998; WHO 2008) was
established to prevent acute health effects in children (methemoglobinemia), but the effects
of long-term exposure to lower levels, including cancer risk, are not well established (Ward
et al. 2005).
Ingested nitrate is classified as a probable human carcinogen in conditions of endogenous
nitrosation (IARC 2010). This process involves the conversion of nitrate into nitrite, and
the synthesis of N-nitroso compounds (NOCs) in the gastrointestinal tract. The intake of
Page 6
Environ Health Perspect DOI: 10.1289/ehp.1510334 Advance Publication: Not Copyedited
5
antioxidant vitamins and the use of non-steroidal anti-inflammatory drugs (NSAIDs) inhibit
endogenous nitrosation, while meat intake, and inflammatory gastrointestinal conditions
promote it (Ward et al. 2005). NOCs are potent carcinogens for several animal species
(Lijinsky et al. 1992). Some NOCs, like the N-methyl-N-nitrosourea (MNU), are used to
induce BC in experimental animal studies, and young rats exposed to MNU were more
susceptible to develop breast tumors (Tsubura et al. 2011). In cellular studies, low doses of
nitrite and nitrate were able to mimic estradiol and activated estrogen receptors, suggesting
a potential role of these anions in breast cancer´s etiology or progression (Veselik et al.
2008).
Despite the evidence in animals, few epidemiologic studies have evaluated the association
between nitrate exposure or its derivatives and BC. Relevant available studies were
conducted in the United States of America (Brody et al. 2006; Weyer et al. 2001), and did
not find associations between waterborne or dietary ingested nitrate and BC. A recent
cohort study of postmenopausal women in the US reported that BC was increased in the
highest versus lowest quintile of water nitrate intake among women who also had folate
ingestion of ≥400 µg/day, but did not find any association with dietary nitrate (Inoue-Choi
et al. 2012). The authors of previous studies attributed their null associations to limitations
in the exposure assessment (i.e. lack of data on water daily intake), the co-existence of
antioxidants (i.e. vitamin C) in main dietary sources of nitrate (vegetables), and the lack of
evaluation of nitrate intake from specific dietary sources such as animal foods and
processed meat. In summary, human evidence relating nitrate exposure and BC is limited
and inconclusive. Studies evaluating different exposure windows, including individual
Page 7
Environ Health Perspect DOI: 10.1289/ehp.1510334 Advance Publication: Not Copyedited
6
water consumption information, endogenous nitrosation factors and other covariables, are
required to enhance the available evidence.
We aimed to evaluate ingested nitrate through drinking water and diet as a risk factor for
breast cancer (BC) in a population-based Multi Case-Control Study conducted in Spain
(MCC-Spain).
METHODS
Study design and population
This study is part of the MCC-Spain study, aimed to evaluate the influence of
environmental exposures on common tumors in Spain (e.g. female breast or colorectal).
Study population was recruited between 2008 and 2013 in eight Spanish provinces (see
Table 1). Cases were identified shortly after the diagnosis (average: 3.2 months, SD 4.2)
through an active search by periodical visits to the collaborating hospital departments (i.e.
gynecology, oncology, general surgery, radiotherapy, and pathology departments).
Participant hospitals were the reference centers for oncologic diseases in each study area.
Only incident cases diagnosed within the recruitment period, without malignant BC
history, aged between 20 and 85 years-old, residing in the hospitals´ catchment areas for at
least 6 months prior to recruitment, and being able to answer the epidemiological
questionnaire (Castaño-Vinyals et al. 2015) were included. All cases had histological
confirmation, and included all malignant BC (International Classification of Diseases 10th
Revision [ICD-10]: C50), and frequent in situ breast cancers (ICD-10:D05.1, D05.7).
Population-based controls were frequency-matched to cases by age, sex and region,
ensuring to have at least one control of the same sex and 5-year interval age for each case.
Page 8
Environ Health Perspect DOI: 10.1289/ehp.1510334 Advance Publication: Not Copyedited
7
Eligible controls were randomly selected from administrative records of primary care
health centers located within hospitals’ catchment areas. For each control needed, five
potential participants of similar age, sex and hospital catchment area were randomly
selected from the lists of general practitioners. If contact with the first person of this list
was not achieved (after at least five tries at different times of the day), or if he/she refused
to participate, the following person of the list was approached. The study protocol was
approved by the ethical review board from each participating center and women signed an
informed consent before recruitment.
Questionnaires and response rates
A structured computerized questionnaire was administered by trained personnel in face-to-
face interviews (http://www.mccspain.org). Collected data included: a) Sociodemographic
characteristics; b) Lifetime residential history; c) The water type consumed in each
residence (municipal/bottled/well/other); d) The amount of water intake at home, including
water per-se, coffee, tea and other water-based beverages; e) Smoking habits; f) History of
gastric ulcer and use of NSAIDs; g) Gynecologic and reproductive history; h) Use of oral
contraceptives (OC), or hormonal replacement therapy (HRT); and g) Physical activity.
Anthropometric measurements were self-reported (weight, height) or measured (waist and
hip circumference) during the interview. Histological type and estrogen receptors data were
available for cases. Average response rates differed among regions and were 71% among
cases and 53% among controls, overall (Castaño-Vinyals et al. 2015). In total, 1585 cases
and 1822 controls were recruited and answered the questionnaire.
Page 9
Environ Health Perspect DOI: 10.1289/ehp.1510334 Advance Publication: Not Copyedited
8
Dietary information, corresponding to one year previous to recruitment, or previous to
diagnosis among cases, was collected using a validated food frequency questionnaire (FFQ)
(Martin-Moreno et al. 1993). The FFQ comprised 140 food items, including regional
Spanish products, and was either administered during the interview or self-administered
and returned by mail. Instructions to complete the FFQ were provided during the interview.
The FFQ was used to estimate the average daily intake of vegetables, fruits, meat, dairy
products and alcoholic beverages.
Dietary nitrate and nutrient estimates
Published food composition tables (Farran et al. 2008) were used to calculate the daily
intake of energy and nutrients (vitamins C, D, E and folate). Dietary nitrate intake (mg/day)
was estimated based on average intake of food items (g/day) and published nitrate content
(mg/100g) in food items including vegetables (EFSA 2008), animal products, and others
(Griesenbeck et al. 2009; Jakszyn et al. 2004). Nitrate contents were assigned to the
following food items: 21 vegetables (including tubers), 13 fruits, 17 animal sources
(including red, white, processed meat and dairy products), frequently consumed foodstuff
(bread, rice, and pasta), and one alcoholic beverage (beer). For calculations, “red meat”
included: beef, lamb and pork meat; “Processed meat” included: bacon, hot dogs, smoked
ham, Spanish cured ham and other cured sausages.
Nitrate levels in drinking water
We collected environmental data from municipalities covering 80% of person-years in each
area. We sent a standardized questionnaire to local authorities and water companies,
ascertaining current and historical nitrate measurements in water of municipal distribution
Page 10
Environ Health Perspect DOI: 10.1289/ehp.1510334 Advance Publication: Not Copyedited
9
systems, and water source characteristics (surface/groundwater proportion). Monitoring
levels (2004-2010) were provided by the SINAC (Sistema de Información Nacional en
Aguas de Consumo). Measurements below the quantification limits (QL) (5% of
measurements) were imputed half of the QL value. If the QL was missing, the measurement
was imputed half of the most frequent QL reported (1.0 mg/L).
We measured nitrate levels in samples of the most consumed bottled water brands in Spain
(Espejo-Herrera et al. 2013). Nitrate levels in wells and springs, not covered by the
municipal water distribution system, were measured in September 2013 (unpublished data).
A total of 28 water samples were collected in 21 municipalities of León region, where non-
municipal water consumption was the highest among our study areas (26% of controls in
the longest residence).
Estimation of long-term nitrate levels in drinking water
We calculated annual average nitrate levels back to 1940 by water zone (defined as a
geographical area supplied by water with a homogeneous source and quality), that usually
corresponded to municipality. We calculated annual averages based on available nitrate
measurements. For years without measurements, we assigned the averaged total
measurements available in the water zone, as long as water source remained constant. In
case of changes in water source, the ground water percentage was used as a weight to
modulate the estimations, assuming that nitrate levels were higher at higher ground water
proportions. In municipalities without any nitrate measurement (covering 0.5% of the total
person-years), we imputed the levels of neighboring municipalities supplied with similar
ground water proportion ± 10%.
Page 11
Environ Health Perspect DOI: 10.1289/ehp.1510334 Advance Publication: Not Copyedited
10
Individual exposure variables
We linked nitrate levels in drinking water (measured and imputed) and residential histories
by year and municipality covering the exposure window from age 18 years to 2 years
before the study interview (from now referred as “adult life” or “long-term exposure”). To
calculate waterborne ingested nitrate (mg/day), we assigned nitrate levels (mg/L NO3-) in
drinking water year-by-year according to the water type consumed. Nitrate levels in
municipal water (residential levels) were assigned for tap water consumption. Levels in the
sampled bottled waters were averaged using the sales frequency of each brand as a weight.
This weighted average (6.1 mg/L of NO3-) was assigned when drinking bottled water
consumption was reported. Levels in well water samples from León (range: 0.5- 93 mg/L)
were assigned to women reporting well water consumption in this area, according to the
postal code of the residence. Nitrate levels in well water were not available for other areas,
and waterborne ingested nitrate was considered missing for years when well water
consumption was reported among women from those areas (range: 0.6% to 8.2% of
controls in the longest residence). The annual nitrate estimates were averaged and
multiplied by the average daily water intake at home (1.3±0.7 L/day in cases, 1.2±0.7 L/day
in controls). Water intakes above the 99th percentile (4L/day), considered non plausible,
were treated as missing values in the analyses. We also calculated the average waterborne
ingested nitrate in two alternative exposure periods: from 15 to 2 years before the interview
(“recent” exposure), and from age 18 to 30 years (“early adulthood” exposure).
In a subset from Barcelona with information on water type changes within residences, 86%
of subjects reporting bottled water consumption in the last residence, actually switched
Page 12
Environ Health Perspect DOI: 10.1289/ehp.1510334 Advance Publication: Not Copyedited
11
from municipal to bottled water after the year 2000. Potential misclassification of the water
type consumed (municipal/bottled), particularly in recent residences was a concern. To
address this, we calculated an alternative variable for waterborne ingested nitrate in adult
life. We assumed that women reporting bottled water consumption and living during at
least 10 years in the last residence (or in the previous one), actually consumed municipal
water before the year 2000, and bottled water thereafter.
Statistical analyses
The population analyzed (1245 cases, 1520 controls) included women with data on
waterborne ingested nitrate covering at least 70% of the main exposure period (from age 18
to 2 years before the interview), and data on daily water intake. We estimated odds ratios
(OR) and 95% confidence intervals (CI) of BC for categorized nitrate intake using
unconditional logistic regression. Categories of exposure (quartiles or tertiles) were
specifically defined for pre and post-menopausal women, according to the distribution in
controls. Basic models were adjusted for age (continuous), study area, and education (3
categories: primary or less, high school, and university or more). Several potential
confounders were explored separately for pre and post-menopausal women, including:
smoking (yes/no 5 years before recruitment), average leisure physical activity since age 16
to 2 years before the interview (measured in metabolic equivalents of task
(METS)/hour/week), body mass index (BMI), family history of malignant BC in any blood
relative (yes/no), NSAIDs use (yes/no), age at menarche, age at menopause (continuous
variables in years and categorized). Menopause and age at menopause were defined
according to the date of the last regular menstrual period. Age at first birth, nulliparity
Page 13
Environ Health Perspect DOI: 10.1289/ehp.1510334 Advance Publication: Not Copyedited
12
(yes/no), parity (number of births), total months of breastfeeding (categorized), OC and
HRT use (never/ever), intake of alcohol (no/yes at age 30 years), intake of energy and
folate (tertiles), and endogenous nitrosation modulators (intake of vitamin C, vitamin E, red
meat, and processed meat) were also explored as potential confounders. Only established
BC risk factors (Stewart 2014), and variables that changed the risk estimates >10% were
included in the adjustment (age, study area, education, BMI, family history of BC, age at
first birth, use of OC, energy intake and age at menopause for postmenopausal women). For
each model covariate, missing data in categorical variables were classified as a separate
category in multivariate analyses. Trend p-values were derived from a likelihood ratio test
(LRT) comparing a model with the categorical nitrate variable as an ordinal variable (0, 1,
2), with a model that excluded the variable.
We used generalized additive models (GAMs) to evaluate the exposure-response
relationship between waterborne nitrate intake and BC by study area. We stratified analyses
for waterborne ingested nitrate by relevant covariates, including endogenous nitrosation
factors (intake of vitamin C, vitamin E, red meat, and processed meat), folate intake and
smoking. Strata of continuous variables were defined according to the distribution in
controls (≤ or > median). We compared the multivariate models with and without the
interaction term using a LRT, and p values <0.10 were considered indicative of
multiplicative interaction. Analyses by histological type (ductal ICD-10: C50, and other in
situ tumors ICD-10: D05.1, D05.7), and estrogen receptor (ER) status were also conducted.
In sensitivity analyses, we used the alternative variables of waterborne ingested nitrate. We
also excluded women with missing data in covariables, and women with missing or lower
interview quality. Interview quality was assessed by the interviewers as unsatisfactory,
Page 14
Environ Health Perspect DOI: 10.1289/ehp.1510334 Advance Publication: Not Copyedited
13
questionable, reliable or high quality interview, based on the completeness of the
information provided. All statistical analyses were performed using STATA version 12.0
(Stata Corp, College Station, TX).
RESULTS
General characteristics of the study population are shown in table 1. Compared to controls,
cases showed higher frequency of family history of BC, age at menopause >50 years, age at
first birth >30 years, higher intake of energy, red meat, processed meat, lower intake of
vitamin C and nulliparity, with statistically significant differences (p value <0.05 in Chi2
test). Among women analyzed, 24.6% (N=679) were premenopausal and 75.4% (N=2086)
postmenopausal. Women with nitrate levels in drinking water assigned for <70% of the
residential history in adult life, and those without information on daily water intake were
excluded from the analyses. In comparison to the excluded, women analyzed showed a
higher proportion of controls (55% vs. 47%), and post-menopausal women (75.4% vs.
63.9%), were older, showed a lower proportion of university education, nulliparity, and
lower intake of vitamins C and E, while levels of waterborne ingested nitrate were similar
(see Supplemental Material, Table S1).
Figure 1 shows average ingested nitrate levels in adult life, among cases and controls.
Waterborne ingested levels (mean± SD) ranged from 2.9 ±1.9 to 13.5±7.5 mg/day, among
areas (Figure 1A), and were higher among post vs. premenopausal women (6.74 ±7.1 vs.
5.12 ±5.6 mg/day p value= <0.001 for U-Mann Whitney test). Ingested levels during
alternative exposure periods (from 15 to 2 years before study interview and from age 18 to
30 years) were similar to levels presented in Figure 1A (results not shown). Dietary
Page 15
Environ Health Perspect DOI: 10.1289/ehp.1510334 Advance Publication: Not Copyedited
14
ingested levels (mean ±SD) ranged from 88.5 ±48.7 to 154 ±87.8 mg/day, among areas
(Figure 1B), and were higher among post vs. premenopausal women (129.0 ±86.2 vs. 109.7
±62.1 mg/day p value <0.001 for T test). On average, 6.0 % ±7.0 of the total dietary nitrate
derived from animal sources, 84.7%±12.1 from vegetables, and the remaining proportion
from other food products (e.g. grains). Ingested nitrate from animal sources (mean ±SD:
5.5±2.9 mg/day) was higher among pre vs. postmenopausal women (5.9 ±2.7 vs. 5.2 ±3.0
mg/day p value <0.0001 for T test), but ingested nitrate from vegetable sources (mean ±SD:
110±79.6 mg/day), was lower among pre vs. postmenopausal women (96.5 ±60.4 vs. 115.0
±84.5 mg/day p value <0.0001 for T test) (results not shown).
Table 2 shows the association between waterborne ingested nitrate and BC. Among
postmenopausal women, fully adjusted OR (95%CI) was 1.29 (0.92, 1.81) for >8.8 mg/day
compared to the lowest intake levels (<2.3 mg/day). After excluding postmenopausal
women with missing or unreliable interview quality (N=118), OR (95%CI) was 1.32 (0.93,
1.86) for >8.8 vs. <2.3 mg/day. Among premenopausal women, fully adjusted OR (95%CI)
was 1.14 (0.67, 1.94) for >6.3 mg/day compared to the lowest intake levels (<1.8 mg/day),
and results were similar after excluding premenopausal women with unreliable interviews
(N=10). Results were also similar when waterborne exposure from age 18 to 2 years before
study interview was defined assuming bottled water use after 2000, for exposures from 15
to 2 years before study interview, and from age 18-30 years (see Supplemental Material,
Table S2). . Exposure-response curves among study areas did not show associations except
at the highest levels where estimates were extremely imprecise (see Supplemental Material.
Figure S1).
Page 16
Environ Health Perspect DOI: 10.1289/ehp.1510334 Advance Publication: Not Copyedited
15
Table 3 shows the associations between waterborne ingested nitrate and BC for post-
menopausal women, across categories of relevant covariables. BC was inversely associated
with high vitamin C+E intake (>181 mg/day) versus low vitamin C+E intake among
women with low waterborne nitrate intake (<2.6 mg/day) (OR= 0.60; 95%CI: 0.39, 0.92),
and the overall interaction p value was 0.08. However, there was no evidence that vitamin
C+E intake modified the odds of BC among those in the second or third tertile of
waterborne nitrate. This inverse association was not observed when vitamin C and E were
analyzed separately. BC was more common among women with the highest waterborne
nitrate (>6 mg/day) and highest red meat intake (>20 g/day) than among women with low
waterborne nitrate (<2.6 mg/day) and low red meat intake (OR= 1.64; 95% CI: 1.08, 2.49).
BC was not increased in women with high waterborne nitrate and low red meat intake
(OR= 1.08; 95% CI: 0.72, 1.47), but the overall interaction between nitrate and red meat
intake was not significant (LRT p-value= 0.17). Results for processed meat followed a
similar pattern. BC was also more common among women with the highest waterborne
nitrate intake and smoking history (OR= 1.48; 95% CI: 0.99, 2.21) than among women
with low waterborne nitrate without smoking history, but the overall interaction was not
significant (LRT p-value= 0.12)
Stratified analyses among premenopausal women resulted in less precise estimates of
associations, due to smaller numbers of observations. Most of the ORs observed across
strata were close to 1, and overall interactions were not significant (LRT p-values >0.10)
(see Supplemental Material, Table S3).
Page 17
Environ Health Perspect DOI: 10.1289/ehp.1510334 Advance Publication: Not Copyedited
16
Among all BC cases, 951 (76.4 %) were ductal (ICD-10 C50), 162 (13.0 %) were other
malignant and in situ cancers (ICD-10: D05.1, D05.7), and 132 (10.6 %) were undefined.
Regarding ER status, 990 (79.5 %) were positive, 218 (17.5 %) were negative and 37 (2.9
%) had missing ER status. Stratified analyses among pre and postmenopausal women
combined, showed similar ORs for ductal and others/undefined tumors, as well as for
positive or negative ER cancers (see Supplemental Material, Table S4).
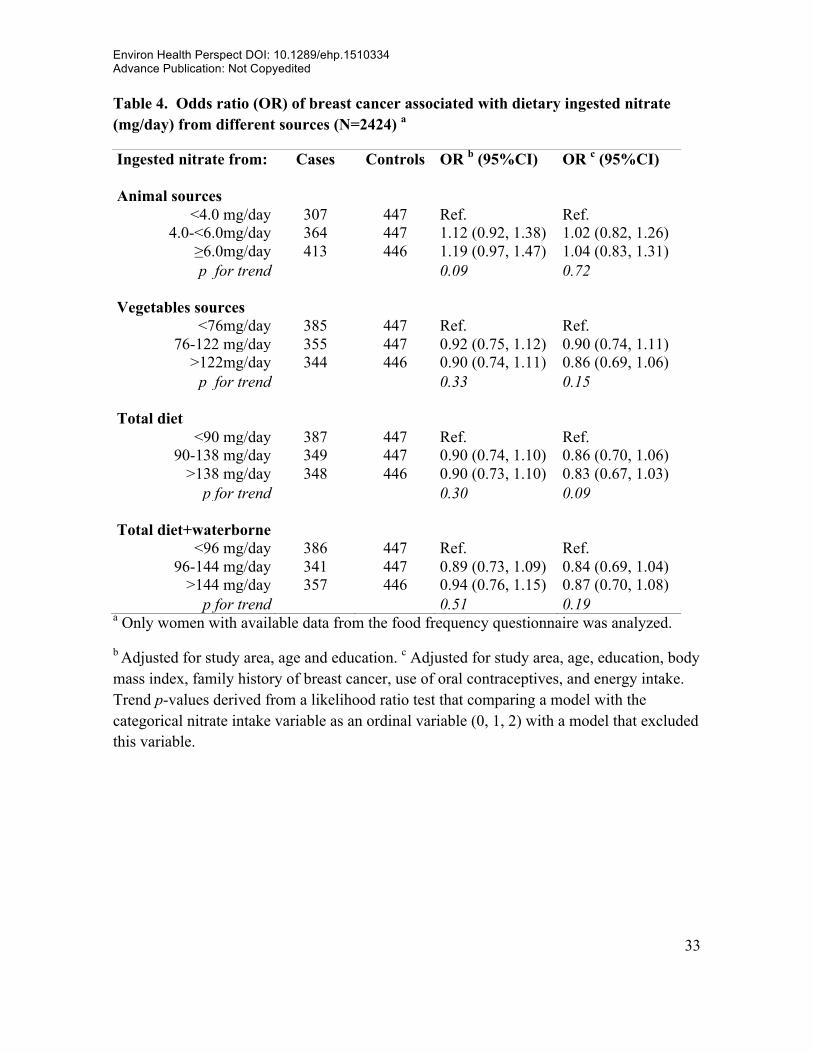
Overall, BC was not associated with dietary nitrate from animal or vegetable sources
(Table 4). The ORs reported were similar after adjusting for endogenous nitrosation factors
(intake of vitamin C, vitamin E, red and processed meat)and other covariables listed in
Table 1 (data not shown), or after excluding women with lower interview quality (N=128
among pre and postmenopausal women). Similar results were observed in analyses for pre
and postmenopausal women separately (see Supplemental Material, Table S5).
DISCUSSION
Average waterborne ingested nitrate levels from age 18 to 2 years before the interview was
6.2 ±6.2 mg/day among controls, and 6.6 ±7.4 among cases. These levels were not
associated with BC, overall. However BC in postmenopausal women was significantly
increased (p <0.05) in women with waterborne nitrate in the highest tertile and high red
meat intake compared with waterborne nitrate in the lowest tertile and low red meat intake.
Dietary ingested nitrate (mean ±SD: 125.7 ±80.3 mg/day in controls, and 123.2 ±82.3
mg/day in cases) was not associated with BC among pre or postmenopausal women,
regardless of the vegetable or animal source.
Page 18
Environ Health Perspect DOI: 10.1289/ehp.1510334 Advance Publication: Not Copyedited
17
To our knowledge, this is the first case-control study on ingested nitrate and BC in a
European population. Most previous studies of waterborne nitrate exposure and BC have
reported null associations (Brody et al. 2006; Weyer et al. 2001). A recent cohort study
conducted in postmenopausal women from Iowa (N=2,875 BC cases in total), suggested an
association between BC and waterborne nitrate intake in interaction with folate intake
(Inoue-Choi et al. 2012). Individual data on daily water intake was not available in that
study, but estimated waterborne nitrate intake levels were higher than levels in our study
(median: 20 mg/day vs. 3.8mg/day), as well as the folate intake (median: 350 µg/day vs.
300 µg/day). We did not confirm an interaction with folate, probably due to the differences
in nitrate and folate intake levels, and other differences, including cancer subtypes
evaluated.
Stratified analyses by endogenous nitrosation factors (intake of vitamin C, vitamin E, red
and processed meat), and other variables (listed in Table 1), did not show significant
differences across categories, the CIs were overlapped and included the null value. BC
was more frequent among postmenopausal women with highest waterborne nitrate and red
meat intake than among women with low waterborne nitrate intake and low red meat
intake, and the overall interaction p-value was >0.10. However, this joint effect is plausible,
since red meat contains amines, amides, and heme iron that may increase endogenous
formation of NOCs (Bingham et al. 2002). The combined intake of vitamins C and E
seems to exert a protective effect, limited to postmenopausal women in the lowest tertile of
waterborne nitrate intake. These findings require confirmation in future studies, since
multiple stratifications were conducted and chance may not be ruled out.
Page 19
Environ Health Perspect DOI: 10.1289/ehp.1510334 Advance Publication: Not Copyedited
18
The associations between waterborne ingested nitrate and BC were slightly higher in
postmenopausal than in premenopausal women. However, insufficient statistical power,
due to small sample size, may partly explain the null results among premenopausal women.
We did not find an interaction between menopausal status and nitrate intake (p value=0.63)
(data not shown), but we evaluated these groups separately, since differences by
menopausal status have been observed with other risk factors, such as body mass index
(Cheraghi et al. 2012). These differences may be attributed to endogenous hormonal
production and other not well established factors. BC is a heterogeneous disease with
potential different etiologies in pre and postmenopausal women; therefore the evaluation of
risk factors among these subgroups may have relevant public health implications.
The evaluation of BC´s association with nitrate and other environmental pollutants in
different exposure periods is required, since there is evidence suggesting that early
exposure (e.g. before the first full-term pregnancy) might be the most relevant for inducing
breast carcinogenesis (Brody et al. 2007). Although we evaluated three different exposure
periods, we did not observe differences on the associations, probably due to high
correlations between exposure levels at different periods. In addition, we did not evaluate
early life exposure due to lack of data. This evaluation is warranted in future studies,
particularly in settings with more available historical nitrate measurements in drinking
water.
Dietary ingested nitrate levels in this study were lower than levels observed in previous
studies on this topic (Inoue-Choi et al. 2012), and may partly explain the lack of
statistically significant associations. Our results suggested an inverse association between
Page 20
Environ Health Perspect DOI: 10.1289/ehp.1510334 Advance Publication: Not Copyedited
19
BC and ingested nitrate from vegetable sources. Vegetables contain endogenous nitrosation
inhibitors (e.g. vitamins C and E), which may explain these results. Previous studies (Hord
et al. 2009), suggested beneficial health effects of nitrate from vegetables sources, which
might also explain these results. Further research is needed to confirm these effects and to
understand the underlying mechanisms.
Potential exposure misclassification is a concern in our study since most of the long-term
nitrate levels in drinking water were imputed, particularly before 1980, and water intake
outside home was not accounted. However, the reported amount of water consumed at
work (mean ±SD: 0.2±0.3 L/day) and other places (0.01±0.05 L/day) was smaller than at
home (1.2±0.7 L/day), and minor bias is expected. We conducted sensitivity analyses
excluding women with lowest interview quality, and slightly higher ORs were found,
particularly among postmenopausal women. Changes on water type consumed, particularly
in recent residences, may lead to exposure misclassification. To address this, we calculated
an alternative variable of waterborne ingested nitrate, as explained in the Methods section.
In the analysis of this alternative variable, few women (N=4 postmenopausal and N=6
premenopausal) changed exposure categories, so the associations observed (see
Supplemental Material, Table S2) were similar to the main results. Potential confounding
by other environmental contaminants with estrogenic action and correlated to nitrate in
drinking water may occur, although available data on selected pesticides (i.e. simazine,
atrazine, terbutilazine and others), showed levels below or around the quantification limit.
Waterborne nitrite exposure was not evaluated either, since measurements available
showed unquantifiable or extremely low levels.
Page 21
Environ Health Perspect DOI: 10.1289/ehp.1510334 Advance Publication: Not Copyedited
20
Dietary nitrate estimations may also be prone to error, since nitrate content in some food
items was not available, and other relevant data including vegetables´ storage and
processing (i.e. washing, peeling and cooking), was not collected. Dietary nitrite intake was
not evaluated, but this would not be a major limitation, since the main exposure route is
through endogenous nitrate´s reduction (IARC 2010). Finally, as dietary information was
collected with a FFQ, ingested nitrate misclassification due to recall bias may be a concern.
The matched case-control design by area of residence may lead to overmatching in
environmental studies, and this may have occurred in this study. However, overmatching
would not affect the validity of results (Agudo and González 1999). Controls had higher
education level than general population, which may hamper the external validity of results.
The heterogeneity of effects between some of the study areas may also be a limitation for
the combined analyses.
A main strength of this study was the availability of detailed individual information on
residential history, water consumption habits, and relevant covariables. Despite the
limitations, the environmental data collected enabled us to evaluate BC associations for a
long-term exposure window (from age 18 to 2 years before study interview), in recent
years, and in early adulthood. The information provided by the FFQ allowed us to evaluate
nitrate ingestion from different dietary sources and to evaluate several potential
confounders and effect modifiers that were not previously evaluated, including endogenous
nitrosation modulators.
In conclusion, waterborne nitrate ingestion at the exposure levels observed was not
associated with BC overall. However, BC was more common among postmenopausal
Page 22
Environ Health Perspect DOI: 10.1289/ehp.1510334 Advance Publication: Not Copyedited
21
women with the highest waterborne nitrate and red meat intake than among women with
low waterborne nitrate and low red meat intake. Dietary nitrate was not associated with
BC, regardless of the exposure source or the menopausal status.
Page 23
Environ Health Perspect DOI: 10.1289/ehp.1510334 Advance Publication: Not Copyedited
22
REFERENCES
Agudo A, González C. 1999. Secondary matching: a method for selecting controls in case-
control studies on environmental risk factors. Int J Epidemiol 28(6):1130-1133.
Bingham S, Hughes R, Cross A. 2002. Effect of white versus red meat on endogenous N-
nitrosation in the human colon and further evidence of a dose response. J Nutr
132(11 Suppl):3522S-3525S.
Brody J, Aschengrau A, McKelvey W, Swartz C, Kennedy T, Rudel R. 2006. Breast cancer
risk and drinking water contaminated by wastewater: a case control study. Environ
Health 5:28.
Brody J, Moysich K, Humblet O, Attfield K, Beehler G, Rudel R. 2007. Environmental
pollutants and breast cancer: epidemiologic studies. Cancer 109(12 Suppl):2667-
2711.
Castaño-Vinyals G, Aragonés N, Pérez-Gómez B, Martín V, Llorca J, Moreno V, et al.
2015. Population-based multicase-control study in common tumors in Spain (MCC-
Spain): rationale and study design. In: Gac Sanit, doi:
10.1016/j.gaceta.2014.1012.1003.
Cheraghi Z, Poorolajal J, Hashem T, Esmailnasab N, Doosti Irani A. 2012. Effect of body
mass index on breast cancer during premenopausal and postmenopausal periods: a
meta-analysis. PLoS One 7(12):e51446.
Page 24
Environ Health Perspect DOI: 10.1289/ehp.1510334 Advance Publication: Not Copyedited
23
EFSA. 2008. Opinion of the scientific panel on contaminants in the food chain on a request
from the European Commission to perform a scientific risk assessment on nitrate in
vegetables. The EFSA Journal 689:1-79.
Espejo-Herrera N, Kogevinas M, Castaño-Vinyals G, Aragonés N, Boldo E, Ardanaz E, et
al. 2013. Nitrate and trace elements in municipal and bottled water in Spain. Gac
Sanit 27(2):156-160.
EU. 1998. Directive 98/83/EC on the quality of water intended for human consumption:
CELEX-EUR Official Journal 32-54.
Farran A, Zamora R, Cervera P. 2008. [Tablas de composición de alimentos del Centre
d’Ensenyament Superior de Nutrició i Dietètica (CESNID)]. Barcelona: McGraw-
Hill/Interamericana Spain S. A.
Ferlay J, Steliarova-Foucher E, Lortet-Tieulent J, Rosso S, Coebergh J, Comber H, et al.
2013. Cancer incidence and mortality patterns in Europe: estimates for 40 countries
in 2012. European Journal of Cancer 49(6):1374-1403.
Griesenbeck J, Steck M, Huber JJ, Sharkey J, Rene A, Brender J. 2009. Development of
estimates of dietary nitrates, nitrites, and nitrosamines for use with the Short Willet
Food Frequency Questionnaire. Nutr J 8:16.
Hankinson S, Colditz G, Willett W. 2004. Towards an integrated model for breast cancer
etiology: the lifelong interplay of genes, lifestyle, and hormones. Breast Cancer Res
6(5):213-218.
Page 25
Environ Health Perspect DOI: 10.1289/ehp.1510334 Advance Publication: Not Copyedited
24
Hord N, Tang Y, Bryan N. 2009. Food sources of nitrates and nitrites: the physiologic
context for potential health benefits. Am J Clin Nutr 90(1):1-10.
IARC. 2010. Working Group on the Evaluation of Carcinogenic Risks to Humans. IARC
monographs on the evaluation of carcinogenic risks to humans. Ingested nitrate and
nitrite, and cyanobacterial peptide toxins. IARC Monogr Eval Carcinog Risks Hum
94:1-412.
Inoue-Choi M, Ward M, Cerhan J, Weyer P, Anderson K, Robien K. 2012. Interaction of
nitrate and folate on the risk of breast cancer among postmenopausal women. Nutr
Cancer 64(5):685-694.
Jakszyn P, Agudo A, Ibáñez R, García-Closas R, Pera G, Amiano P, et al. 2004.
Development of a food database of nitrosamines, heterocyclic amines, and
polycyclic aromatic hydrocarbons. J Nutr 134(8):2011-2014.
Lijinsky W, Kovatch RM, Saavedra JE. 1992. Carcinogenesis and mutagenesis by N-
nitroso compounds having a basic center. Cancer Lett 63(2):101-107.
Martin-Moreno J, Boyle P, Gorgojo L, Maisonneuve P, Fernandez-Rodriguez J, Salvini S,
et al. 1993. Development and validation of a food frequency questionnaire in Spain.
Int J Epidemiol 22(3):512-519.
Pollán M, Pastor-Barriuso R, Ardanaz E, Argüelles M, Martos C, Galcerán J, et al. 2009.
Recent changes in breast cancer incidence in Spain, 1980-2004. J Natl Cancer Inst
101(22):1584-1591.
Page 26
Environ Health Perspect DOI: 10.1289/ehp.1510334 Advance Publication: Not Copyedited
25
Romieu I, Scoccianti C, Chajes V, de Batlle J, Biessy C, Dossus L, et al. 2015. Alcohol
intake and breast cancer in the European Prospective investigation into Cancer and
Nutrition. Int J Cancer: doi: 10.1002/ijc.29469.
Stewart B, Wild CP. 2014. World Cancer Report 2014. Lyon: International Agency for
Research on Cancer.
Tsubura A, Lai Y, Mik iH, Sasaki T, Uehara N, Yuri T, et al. 2011. Review: Animal
models of N-Methyl-N-nitrosourea-induced mammary cancer and retinal
degeneration with special emphasis on therapeutic trials. In Vivo 25(1):11-22.
Veselik D, Divekar S, Dakshanamurthy S, Storchan G, Turner J, Graham K, et al. 2008.
Activation of estrogen receptor-alpha by the anion nitrite. Cancer Res 68(10):3950-
3958.
Wakida F, Lerner D. 2005. Non-agricultural sources of groundwater nitrate: a review and
case study. Water Res 39(1):3-16.
Ward MH, deKok TM, Levallois P, Brender J, Gulis G, Nolan BT, et al. 2005. Workgroup
report: Drinking-water nitrate and health--recent findings and research needs.
Environ Health Perspect 113(11):1607-1614.
Weyer P, Cerhan J, Kross B, Hallberg G, Kantamneni J, Breuer G, et al. 2001. Municipal
drinking water nitrate level and cancer risk in older women: the Iowa Women's
Health Study. Epidemiology 12(3):327-338.
Page 27
Environ Health Perspect DOI: 10.1289/ehp.1510334 Advance Publication: Not Copyedited
26
WHO. 2008. Nitrate and nitrite. Published in: Guidelines for drinking water quality
incorporating 1st and 2nd addenda Recommendations. Geneve: World Health
Organization.
Page 28
Environ Health Perspect DOI: 10.1289/ehp.1510334 Advance Publication: Not Copyedited
27
Table 1. Characteristics of the study population (1245 cases a and 1520 controls
Characteristic Cases Controls p value* n (%) n (%) Study area
Asturias 62 (5.0) 107 (7.0) Barcelona 256 (20.6) 342 (22.5) Cantabria 103 (8.3) 134 (8.8) Gipuzkoa 171 (13.7) 246 (16.2)
León 155 (12.4) 168 (11.0) Madrid 274 (22.0) 311 (20.5)
Navarra 171 (13.7) 158 (10.4) Valencia 53 (4.3) 54 (3.6)
Age Mean (SD) 56.7 (12.3) 59.8 (12.9)
Range 23- 85 24-85 ≤50 430 (34.5) 417 (27.4)
51-60 352 (28.3) 354 (23.3) 61-70 284 (22.8) 379 (24.9)
>70 179 (14.4) 370 (24.3)
Education
<Primary school 184 (14.8) 266 (17.5) Primary school 416 (33.4) 483 (31.8)
Secondary school 410 (32.9) 461 (30.3) University 235 (18.9) 310 (20.4)
Body mass index <18.5 22 (1.8) 32 (2.1)
18.5-24.9 555 (44.6) 717 (47.2) 25-29.9 442 (35.5) 498 (32.8)
≥30 226 (18.2) 273 (18.0) 0.40
Family history of BC a
No 816 (67.5) 1,189 (81.4) Yes 393 (32.5) 271 (18.6) <0.001
Missing 36 60
Menopausal status
Premenopausal 332 (26.7) 347 (22.8) Postmenopausal 913 (73.3) 1,173 (77.2) 0.02
Age at menopause b, Mean (SD) 48.9 (5.2) 48.6 (5.2)
Range 28-59 22-62 ≤50 years 460 (57.9) 634 (64.4) >50 years 335 (42.1) 351 (35.6) 0.01
Missing 450 535
Page 29
Environ Health Perspect DOI: 10.1289/ehp.1510334 Advance Publication: Not Copyedited
28
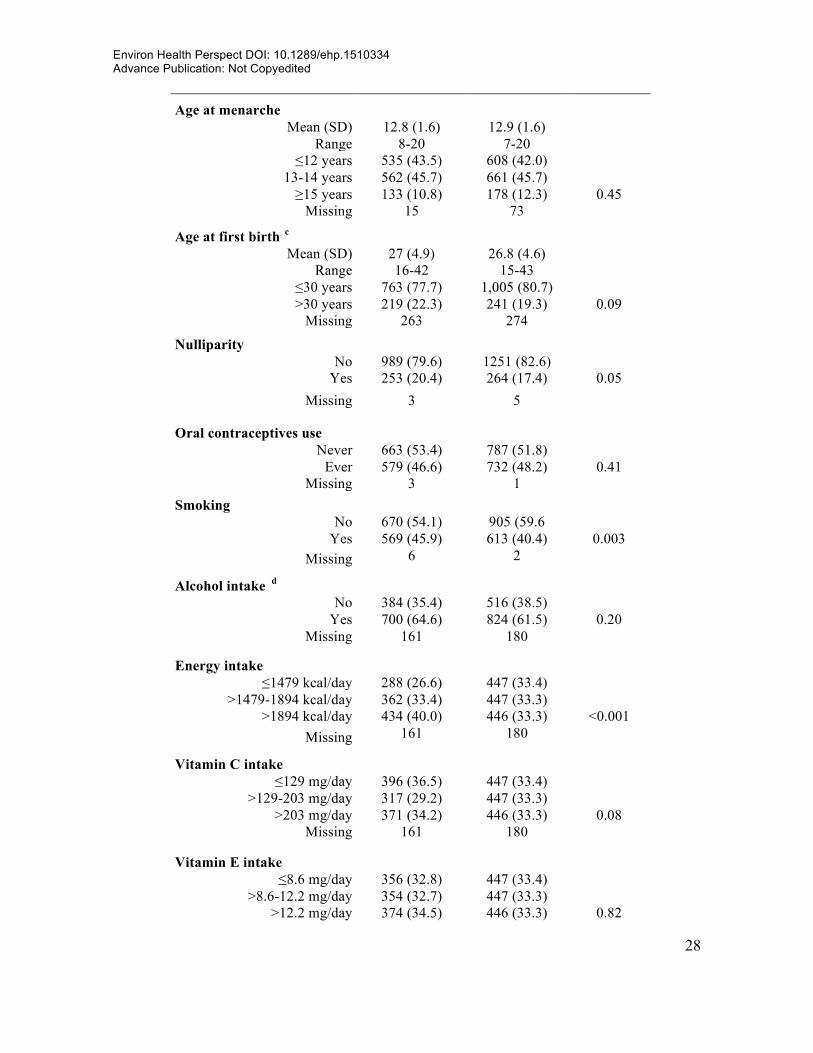
Age at menarche Mean (SD) 12.8 (1.6) 12.9 (1.6)
Range 8-20 7-20 ≤12 years 535 (43.5) 608 (42.0)
13-14 years 562 (45.7) 661 (45.7) ≥15 years 133 (10.8) 178 (12.3) 0.45
Missing 15 73
Age at first birth c
Mean (SD) 27 (4.9) 26.8 (4.6) Range 16-42 15-43
≤30 years 763 (77.7) 1,005 (80.7) >30 years 219 (22.3) 241 (19.3) 0.09
Missing 263 274
Nulliparity No 989 (79.6) 1251 (82.6)
Yes 253 (20.4) 264 (17.4) 0.05 Missing 3 5
Oral contraceptives use Never 663 (53.4) 787 (51.8)
Ever 579 (46.6) 732 (48.2) 0.41 Missing 3 1
Smoking No 670 (54.1) 905 (59.6
Yes 569 (45.9) 613 (40.4) 0.003 Missing 6 2
Alcohol intake d
No 384 (35.4) 516 (38.5) Yes 700 (64.6) 824 (61.5) 0.20
Missing 161 180
Energy intake
≤1479 kcal/day 288 (26.6) 447 (33.4) >1479-1894 kcal/day 362 (33.4) 447 (33.3)
>1894 kcal/day 434 (40.0) 446 (33.3) <0.001 Missing 161 180
Vitamin C intake
≤129 mg/day 396 (36.5) 447 (33.4) >129-203 mg/day 317 (29.2) 447 (33.3)
>203 mg/day 371 (34.2) 446 (33.3) 0.08 Missing 161 180
Vitamin E intake
≤8.6 mg/day 356 (32.8) 447 (33.4) >8.6-12.2 mg/day 354 (32.7) 447 (33.3)
>12.2 mg/day 374 (34.5) 446 (33.3) 0.82
Page 30
Environ Health Perspect DOI: 10.1289/ehp.1510334 Advance Publication: Not Copyedited
29
Missing 161 180
Folate intake ≤252 µg/L 335 (30.9) 447 (33.4)
>252-340 µg/L 370 (34.1) 447 (33.3) >340 µg/L 379 (35.0) 446 (33.3) 0.42
Missing 161 180 Vegetables intake e
≤422 g/day 393 (36.3) 447 (33.4) >422-642 g/day 340 (31.4) 447 (33.3)
>642 g/day 351 (32.4) 446 (33.3) 0.31 Missing 161 180
Red meat intake ≤16 g/day 311 (28.7) 447 (33.4)
>16-29 g/day 346 (31.9) 447 (33.3) >29 g/day 427 (39.4) 446 (33.3) 0.01
Missing 161 180
Processed meat intake ≤5.2 g/day 293 (27.0) 447 (33.4)
>5.2-13.4 g/day 360 (33.2) 447 (33.3) >13.4 g/day 431 (39.8) 446 (33.3) 0.001
Missing 161 180 Interview quality
Unsatisfactory 3 (0.2) 1(0.1) Questionable 92 (7.5) 87 (6.1)
Reliable 562 (46.0) 736 (51.8) High quality 564 (46.2) 596 (42.0) 0.02
Missing 24 100 Histological type
Ductal 951 (76.4) Others 162 (13.0)
Undefined 132 (10.6)
Estrogen receptors
Positive 990 (79.5) Negative 218 (17.5)
Undefined 37 (2.9) a Breast cancer cases. b Distribution only among postmenopausal women. c Distribution among non-nulliparous women. d Alcohol intake from age 30 to 40 years. e Vegetables intake include vegetables and fruits. *p-value for Chi square test.
Page 31
Environ Health Perspect DOI: 10.1289/ehp.1510334 Advance Publication: Not Copyedited
30
Table 2. Waterborne ingested nitrate from age 18 years to 2 years before study interview and breast cancer associations by menopausal status. Odds ratios (OR) and 95% confidence intervals (CI)
Menopausal status Cases Controls OR a (95%CI) OR b (95%CI) Cases c Controls c OR b (95%CI) Postmenopausal 913 1173 888 1080
<2.3 mg/day 227 294 Ref. Ref. 222 289 Ref. ≥2.3-4.0 mg/day 232 293 1.06 (0.82, 1.36) 1.09 (0.84, 1.41) 229 285 1.11 (0.86, 1.45) >4.0-8.8 mg/day 222 293 1.08 (0.82, 1.41) 1.07 (0.81, 1.42) 213 263 1.10 (0.83, 1.46)
>8.8 mg/day 232 293 1.28 (0.92, 1.77) 1.29 (0.92, 1.81) 224 243 1.32 (0.93, 1.86) p for trend 0.19 0.20 0.16
Cases Controls OR a (95%CI) OR d (95%CI) Cases c Controls c OR d (95%CI) Premenopausal 332 347 330 339
<1.8 mg/day 72 87 Ref. Ref. 72 86 Ref. ≥1.8-3.1 mg/day 87 87 1.24 (0.79, 1.92) 1.31 (0.83, 2.06) 86 86 1.28 (0.81, 2.02) >3.1-6.3 mg/day 85 87 1.08 (0.68, 1.72) 1.03 (0.64, 1.66) 85 85 0.99 (0.61, 1.60)
>6.3 mg/day 88 86 1.11 (0.66, 1.86) 1.14 (0.67, 1.94) 87 82 1.05 (0.61, 1.80) p for trend 0.78 0.80 0.97
Cases Controls OR a (95%CI) OR b (95%CI) Cases c Controls c OR b (95%CI) Pre+Postmenopausal 1245 1520 1218 1419
<2.2 mg/day 319 380 Ref. Ref. 315 374 Ref. ≥2.2-3.8 mg/day 303 380 0.96 (0.77, 1.19) 0.98 (0.79, 1.23) 298 373 0.98 (0.78, 1.22) >3.8-8.1 mg/day 316 380 1.04 (0.83, 1.31) 1.01 (0.80, 1.28) 308 351 1.01 (0.80, 1.28)
>8.1 mg/day 307 380 1.09 (0.83, 1.43) 1.08 (0.82, 1.43) 297 321 1.08 (0.81, 1.44) p for trend 0.53 0.64 0.63
a Adjusted for: study area, age and education. b Adjusted for: study area, age, education, body mass index, family history of breast cancer, age at first birth, age at menopause, use of oral contraceptives and energy intake. c Women with unreliable interviews or missing data on interview quality (N=118 postmenopausal and N=10 premenopausal) were excluded. d Age at menopause was excluded from the adjustment for premenopausal women. Trend p-values derived from a likelihood ratio test that comparing a model with the categorical nitrate intake variable as an ordinal variable (0, 1, 2) with a model that excluded this variable.
Page 32
Environ Health Perspect DOI: 10.1289/ehp.1510334 Advance Publication: Not Copyedited
31
Table 3. Interaction of waterborne ingested nitrate from age 18 to 2 years before study interview with relevant dietary covariables and breast cancer associations among postmenopausal women a
Waterborne Ingested nitrate
Cases Controls OR (95% CI) Cases Controls OR b (95% CI) Interaction p value*
Vitamin C <170 mg/day ≥170 mg/day <2.6 mg/day 140 162 Ref. 104 161 0.73 (0.51, 1.05)
≥2.6-6.0 mg/day 118 169 0.88 (0.62, 1.24) 153 171 1.08 (0.77, 1.52) >6.0 mg/day 146 185 1.19 (0.80, 1.77) 136 183 1.06 (0.72, 1.58) 0.10
Vitamin E <10 mg/day ≥10 mg/day <2.6 mg/day 131 170 Ref. 113 153 0.84 (0.58, 1.22)
≥2.6-6.0 mg/day 132 160 1.18 (0.83, 1.67) 139 180 0.94 (0.65, 1.34) >6.0 mg/day 123 186 1.16 (0.77, 1.74) 159 182 1.25 (0.82, 1.88) 0.41
Vitamin C+E <181 mg/day ≥181 mg/day <2.6 mg/day 142 161 Ref. 102 162 0.60 (0.39, 0.92)
≥2.6-6.0 mg/day 116 167 0.94 (0.62, 1.42) 155 173 1.09 (0.73, 1.63) >6.0 mg/day 145 185 1.17 (0.73, 1.89) 137 183 1.02 (0.64, 1.64) 0.08
Folate <300 µg/day ≥300 µg/day <2.6 mg/day 143 169 Ref. 101 154 0.74 (0.52, 1.07)
≥2.6-6.0 mg/day 116 173 0.89 (0.63, 1.25) 155 167 1.09 (0.78, 1.54) >6.0 mg/day 135 174 1.19 (0.80, 1.77) 147 194 1.09 (0.73, 1.62) 0.13
Red meat <20 g/day ≥20 g/day <2.6 mg/day 104 151 Ref. 140 172 1.03 (0.72, 1.47)
≥2.6-6.0 mg/day 119 160 1.13 (0.78, 1.63) 152 180 1.17 (0.82, 1.67) >6.0 mg/day 124 205 1.08 (0.71, 1.62) 158 163 1.64 (1.08, 2.49) 0.17
Processed meat <7.2 g/day ≥7.2 g/day <2.6 mg/day 118 180 126 143 1.09 (0.76, 1.56)
≥2.6-6.0 mg/day 116 165 1.12 (0.79, 1.60) 153 175 1.24 (0.88, 1.75) >6.0 mg/day 100 171 1.14 (0.76, 1.70) 182 197 1.62 (1.08, 2.44) 0.46
Smoking No Yes <2.6 mg/day 161 226 Ref. 118 141 Ref.
≥2.6-6.0 mg/day 188 247 1.12 (0.84, 1.51) 116 147 0.93 (0.66, 1.32) >6.0 mg/day 197 296 1.13 (0.80, 1.60) 128 115 1.48 (0.99, 2.21) 0.12
Page 33
Environ Health Perspect DOI: 10.1289/ehp.1510334 Advance Publication: Not Copyedited
32
a Only women with complete information on dietary covariables (N=1828) or smoking (N=2080) were analyzed. b Adjusted for: study area, age, education, body mass index, family history of breast cancer, age at menopause, age at first birth, oral contraceptives use, and energy intake. *p-value for overall interaction calculated by comparing the multivariate models with and without the interaction term using a likelihood ratio test
Page 34
Environ Health Perspect DOI: 10.1289/ehp.1510334 Advance Publication: Not Copyedited
33
Table 4. Odds ratio (OR) of breast cancer associated with dietary ingested nitrate (mg/day) from different sources (N=2424) a
Ingested nitrate from: Cases Controls OR b (95%CI) OR c (95%CI)
Animal sources <4.0 mg/day 307 447 Ref. Ref.
4.0-<6.0mg/day 364 447 1.12 (0.92, 1.38) 1.02 (0.82, 1.26) ≥6.0mg/day 413 446 1.19 (0.97, 1.47) 1.04 (0.83, 1.31) p for trend 0.09 0.72
Vegetables sources <76mg/day 385 447 Ref. Ref.
76-122 mg/day 355 447 0.92 (0.75, 1.12) 0.90 (0.74, 1.11) >122mg/day 344 446 0.90 (0.74, 1.11) 0.86 (0.69, 1.06)
p for trend 0.33 0.15
Total diet <90 mg/day 387 447 Ref. Ref.
90-138 mg/day 349 447 0.90 (0.74, 1.10) 0.86 (0.70, 1.06) >138 mg/day 348 446 0.90 (0.73, 1.10) 0.83 (0.67, 1.03)
p for trend 0.30 0.09
Total diet+waterborne <96 mg/day 386 447 Ref. Ref.
96-144 mg/day 341 447 0.89 (0.73, 1.09) 0.84 (0.69, 1.04) >144 mg/day 357 446 0.94 (0.76, 1.15) 0.87 (0.70, 1.08)
p for trend 0.51 0.19 a Only women with available data from the food frequency questionnaire was analyzed.
b Adjusted for study area, age and education. c Adjusted for study area, age, education, body mass index, family history of breast cancer, use of oral contraceptives, and energy intake. Trend p-values derived from a likelihood ratio test that comparing a model with the categorical nitrate intake variable as an ordinal variable (0, 1, 2) with a model that excluded this variable.
Page 35
Environ Health Perspect DOI: 10.1289/ehp.1510334 Advance Publication: Not Copyedited
34
Figure legend
Figure 1. Ingested nitrate levels (mg/day) through drinking water from age 18 to 2 years
before the interview (A) and diet (B) among study areas. Women with waterborne ingested
levels >44 mg/day (N=6) or with dietary ingested levels >476 mg/day (N=7) were excluded
from the graphics. Boxes extend from the 25th to the 75th percentile. Horizontal bars
represent the median, whiskers indicate the 10th and 90th, and outliers are represented as
points.
Page 36
Environ Health Perspect DOI: 10.1289/ehp.1510334 Advance Publication: Not Copyedited
35
Figure 1.