Initial Environmental Examination (Draft) Project Number: 470471-002 February 2016 People’s Republic of China: Fujian Farmland Sustainable Utilization and Demonstration Project Prepared by the Fujian Provincial Department of Agriculture (Fujian Provincial Agricultural Affair Office) for the Asian Development Bank
Transcript
Initial Environmental Examination (Draft) Project Number: 470471-002 February 2016
People’s Republic of China: Fujian Farmland Sustainable Utilization and Demonstration Project Prepared by the Fujian Provincial Department of Agriculture (Fujian Provincial Agricultural Affair Office) for the Asian Development Bank
I
CURRENCY EQUIVALENTS (as of 25 November 2015)
Currency unit – Yuan (CNY)
CNY1.00 = $0.1565
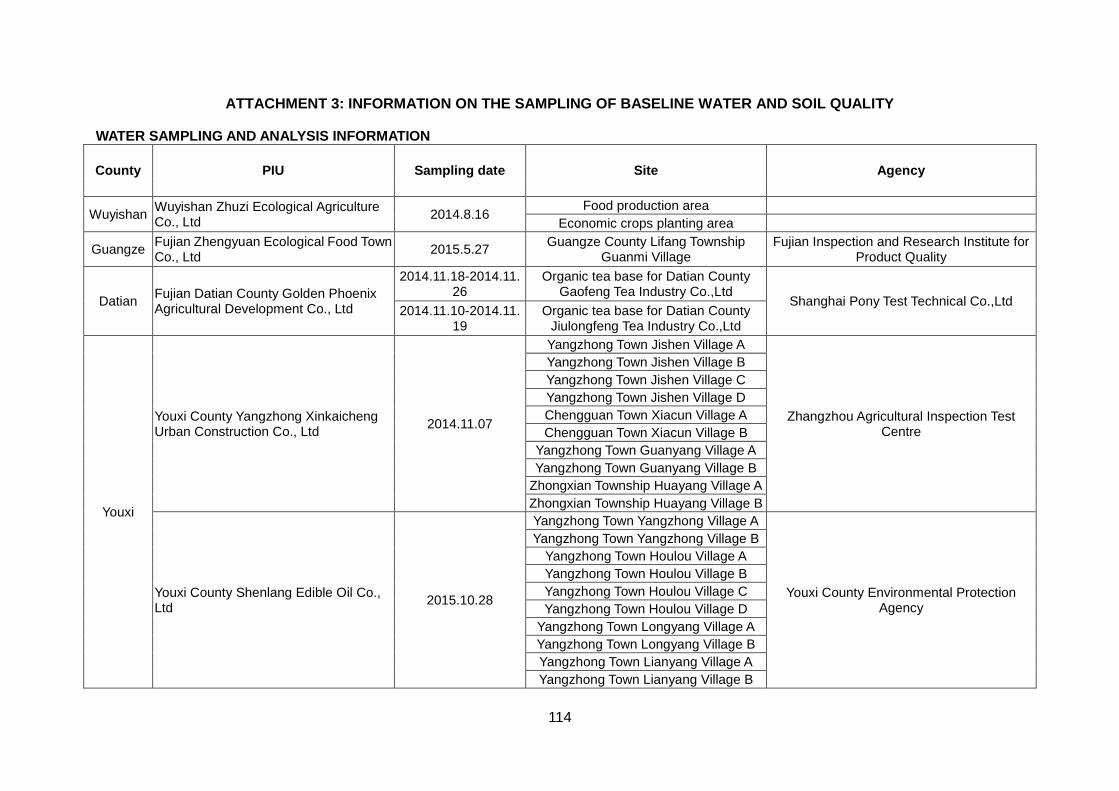
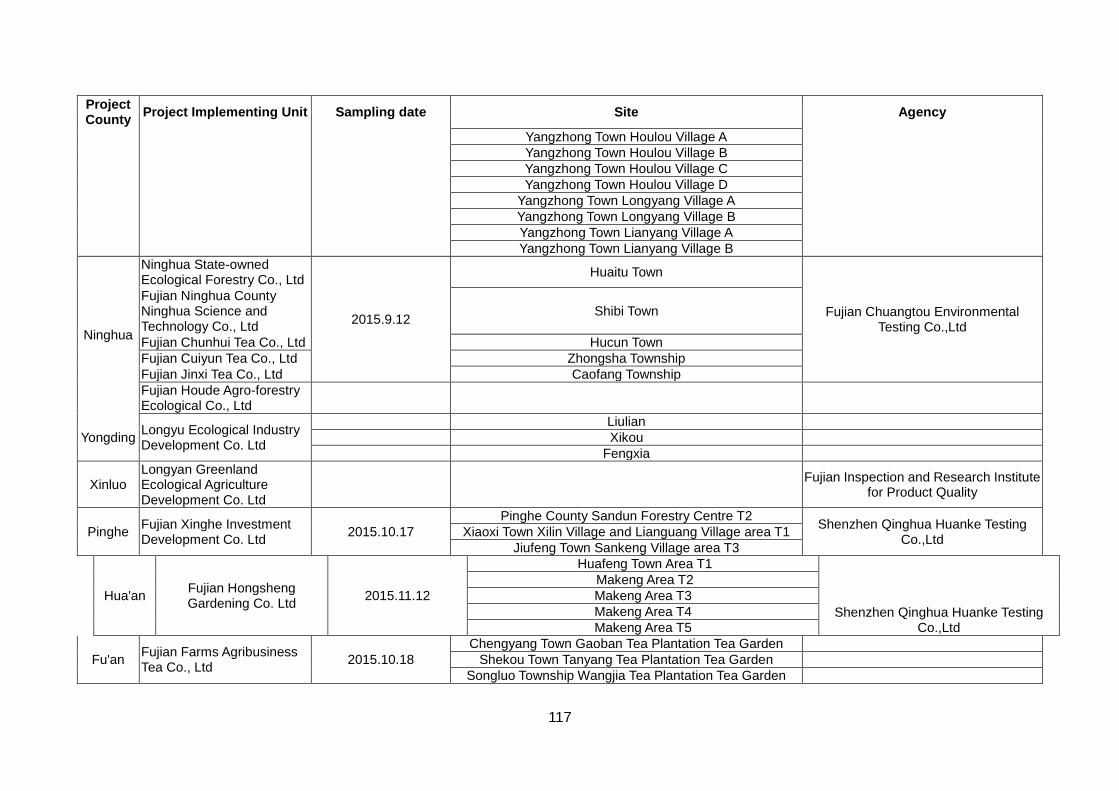
$1.00 = CNY6.3898
In this report, “$” refers to US dollars.
ABBREVIATIONS
ADB Asian Development Bank GRM Grievance redress mechanism BOD5 5-day biochemical oxygen demand IEE Initial environmental examination CNY Chinese Yuan LIEC Loan implementation environment consultant COD Chemical oxygen demand MEP Ministry of Environment Protection CPMO County Project Management Office MPMO Municipal Project Management Office DO Dissolved oxygen PDRC Provincial Development and Reform
Commission DOEP Department of Environmental Protection PIU Project Implementing Unit EHS Environmental, Health and Safety PPE Project Participating Enterprise EIA Environmental impact assessment PPMO Provincial Project Management Office EIR Environmental Impact Report PPTA Project Preparatory Technical Assistance EIT Environmental Impact Table PRC People’s Republic of China EMP Environmental Management Plan REA Rapid Environmental Assessment EMS Environment Monitoring Station SOE State Owned Enterprise EPB Environmental Protection Bureau SPS Safeguard Policy Statement FPG Fujian Provincial Government WHO World Health Organization FSR Feasibility Study Report WRB Water Resources Bureau FYP Five Year Plan WTP Water Treatment Plant GDP Gross domestic product WWTP Wastewater Treatment Plant GHG Greenhouse gas
WEIGHTS AND MEASURES
oC degree centigrade m
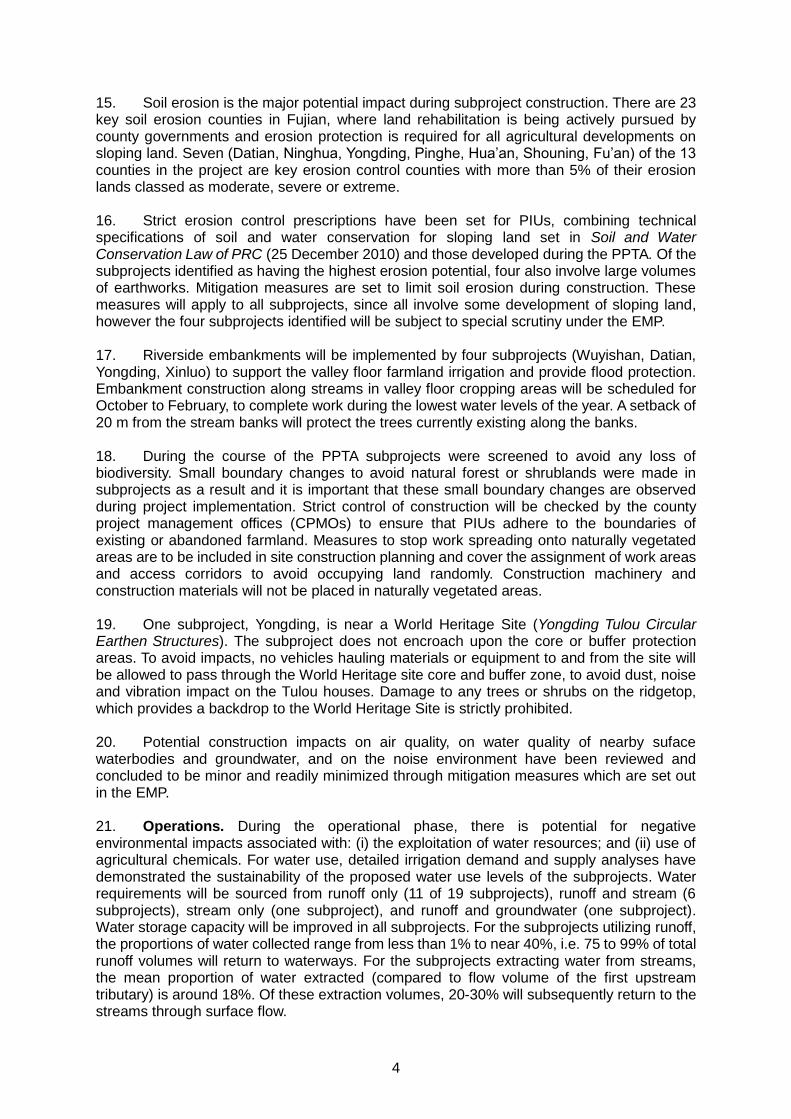
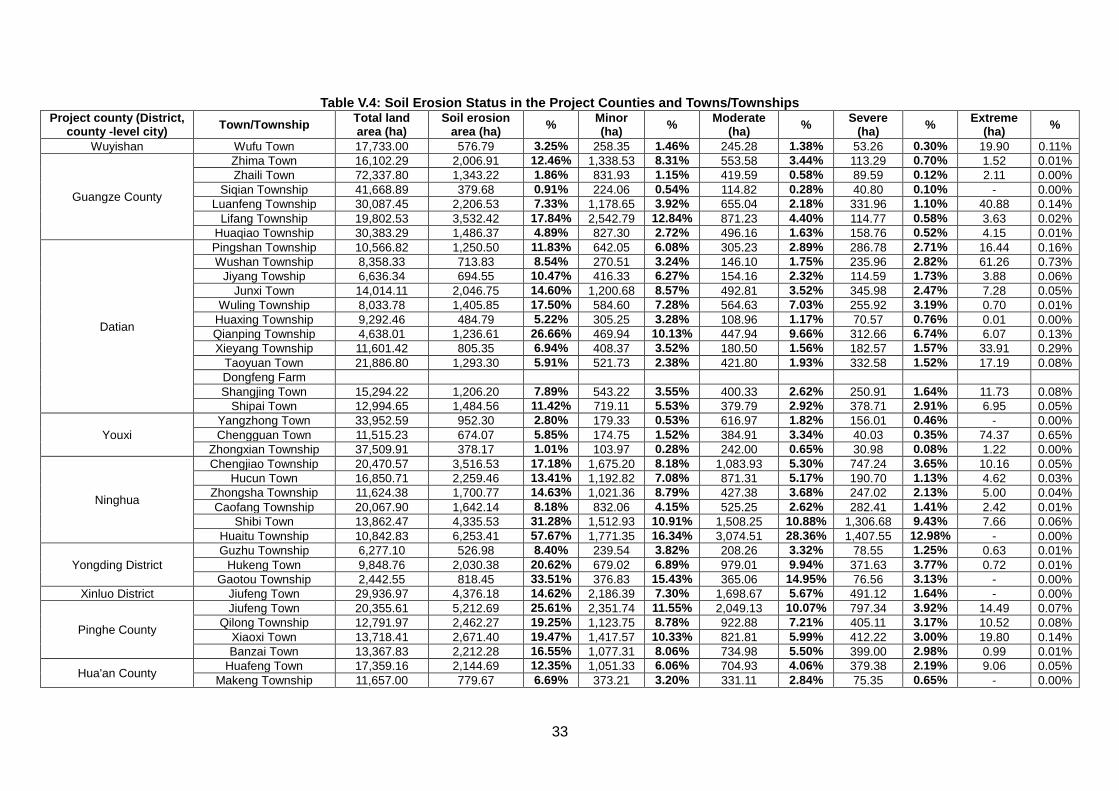
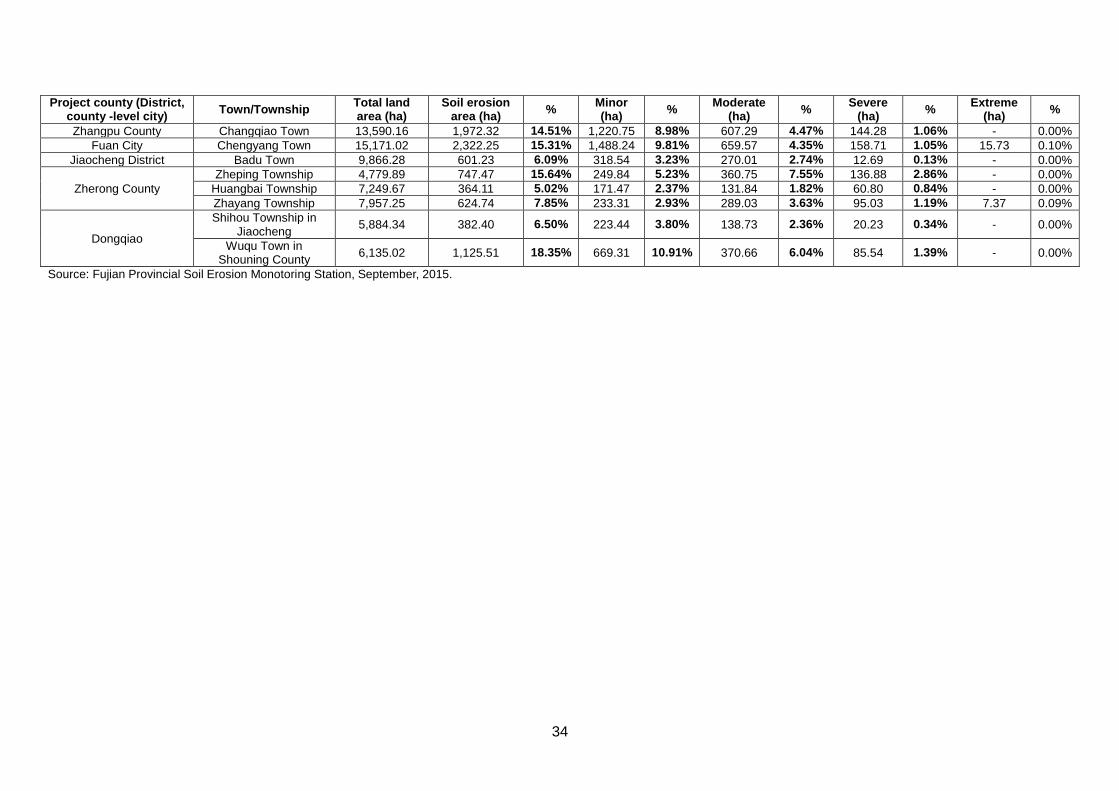
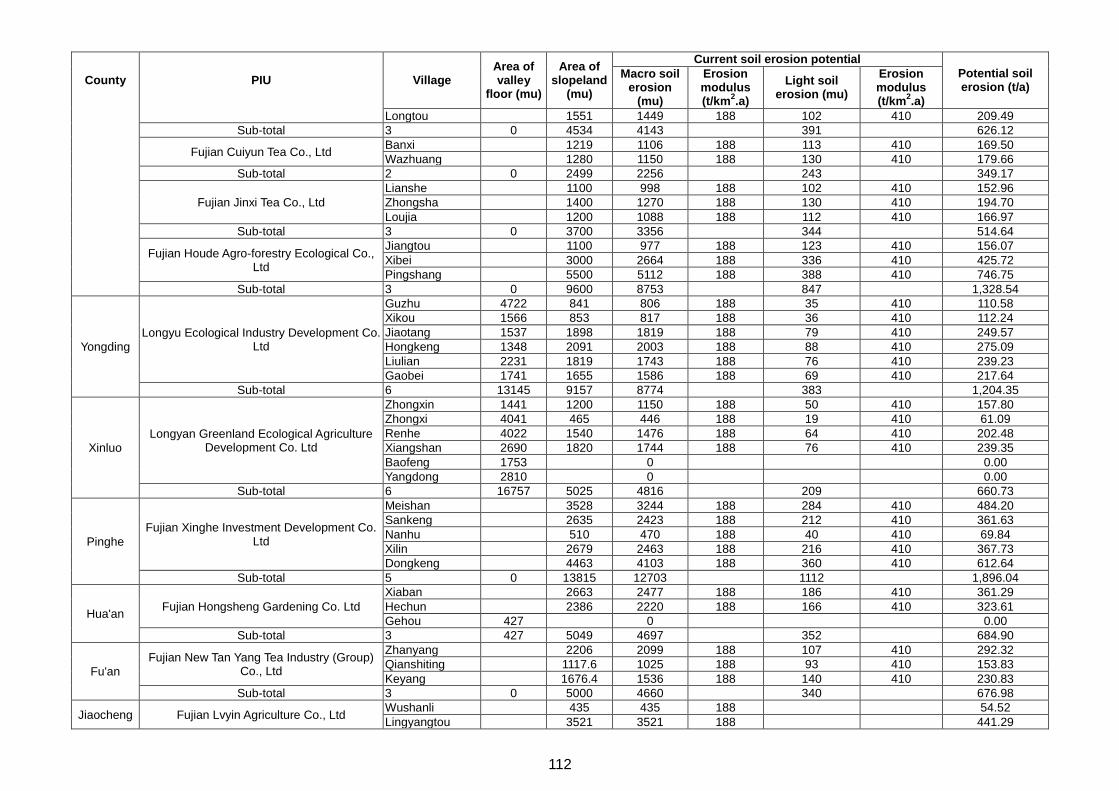
2 square meter
dB decibel m3/a cubic meter per annum
km kilometer m3/d cubic meter per day
km2 square kilometer mg/kg milligram per kilogram
kW kilowatt mg/l milligram per liter L liter mg/m
3 milligram per cubic meter
m meter t metric ton mu 1/15 hectare t/a ton per annum
Data in all figures and tables in this IEE are sourced from Project FSRs and Subproject EIA Tables unless otherwise stated. This initial environmental examination is a document of the borrower. The views expressed herein do not necessarily represent those of ADB's Board of Directors, Management, or staff, and may be preliminary in nature. Your attention is directed to the “terms of use” section of this website. In preparing any country program or strategy, financing any project, or by making any designation of or reference to a particular territory or geographic area in this document, the Asian Development Bank does not intend to make any judgments as to the legal or other status of any territory or area.
II
TABLE OF CONTENTS
I. EXECUTIVE SUMMARY ..................................................................................................... 1
A. Introduction ............................................................................................................... 1
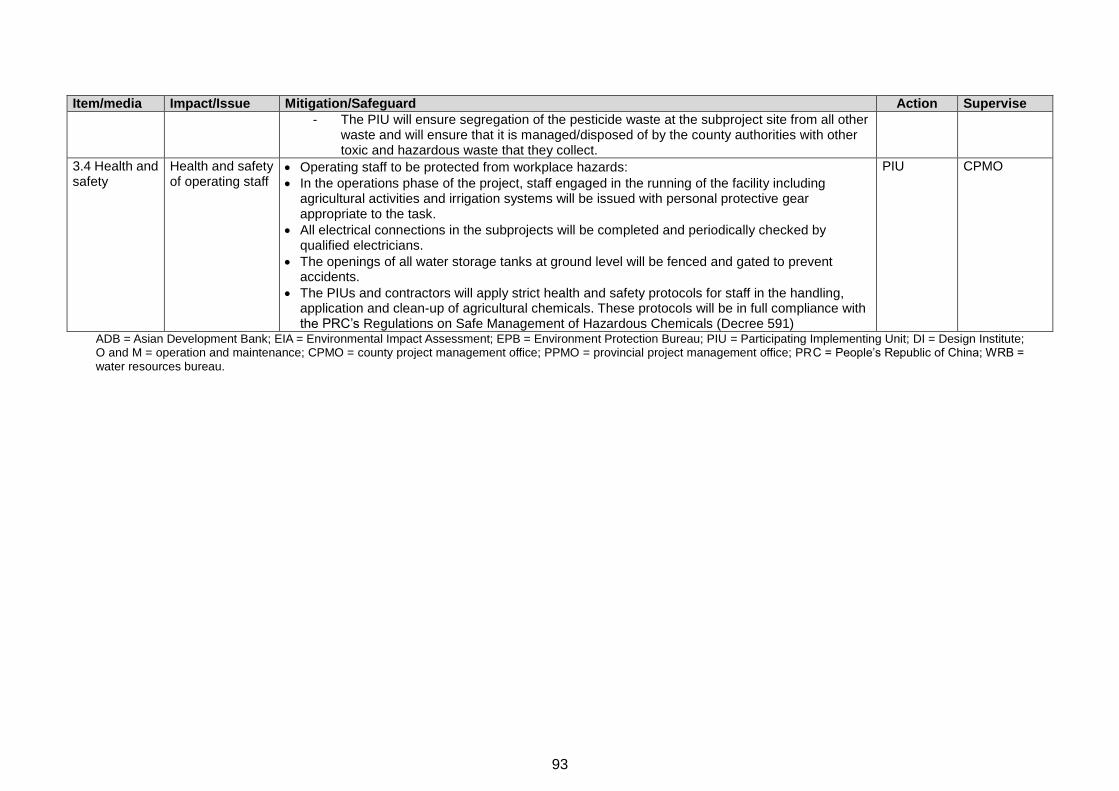
B. Baseline Environment................................................................................................ 2
C. Impacts and Mitigation Measures .............................................................................. 3
D. Capacity Building ....................................................................................................... 5
E. Associated facilities ................................................................................................... 6
F. Climate Change ......................................................................................................... 6
G. Public Consultation and Grievance Redress Mechanism ........................................... 6
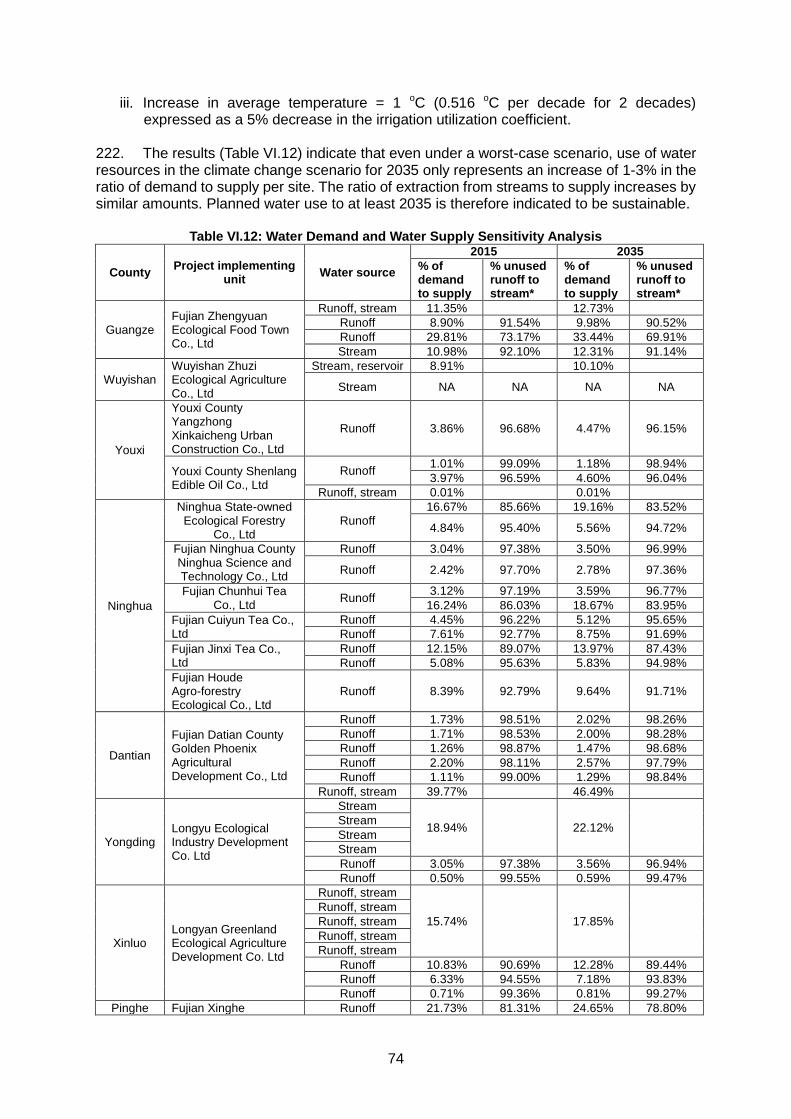
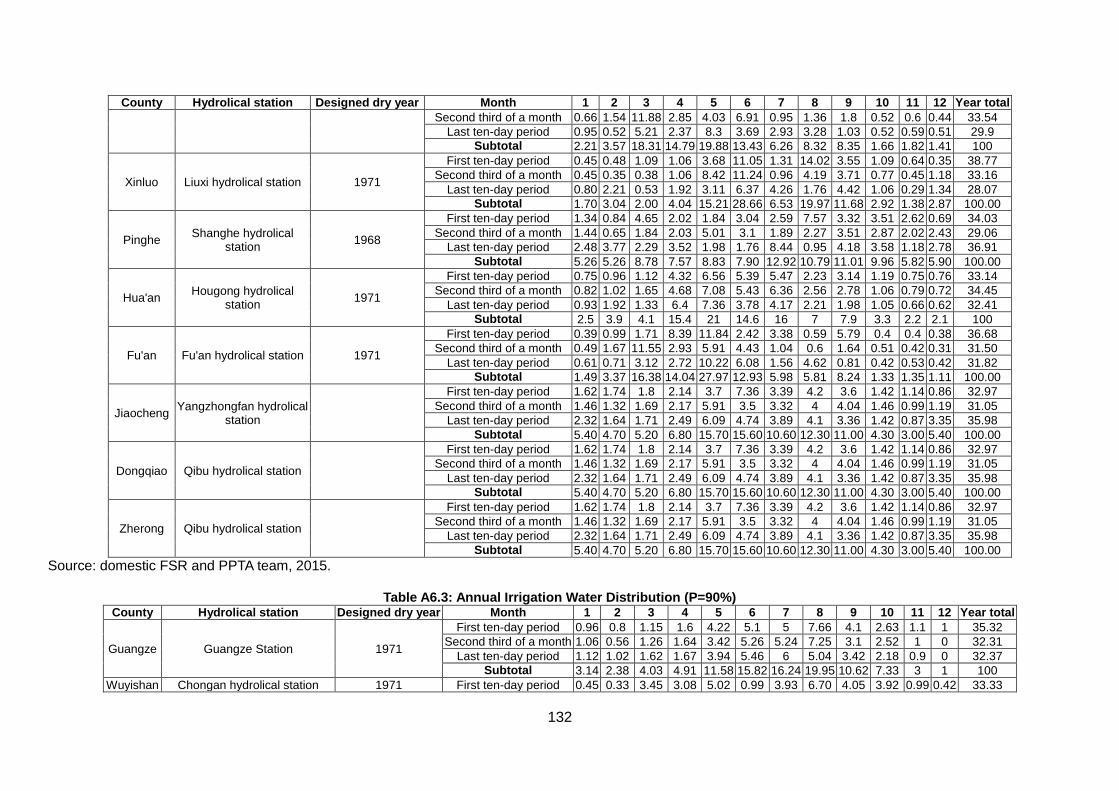
H. Environmental Management Plan .............................................................................. 7
I. Project Assurances .................................................................................................... 7
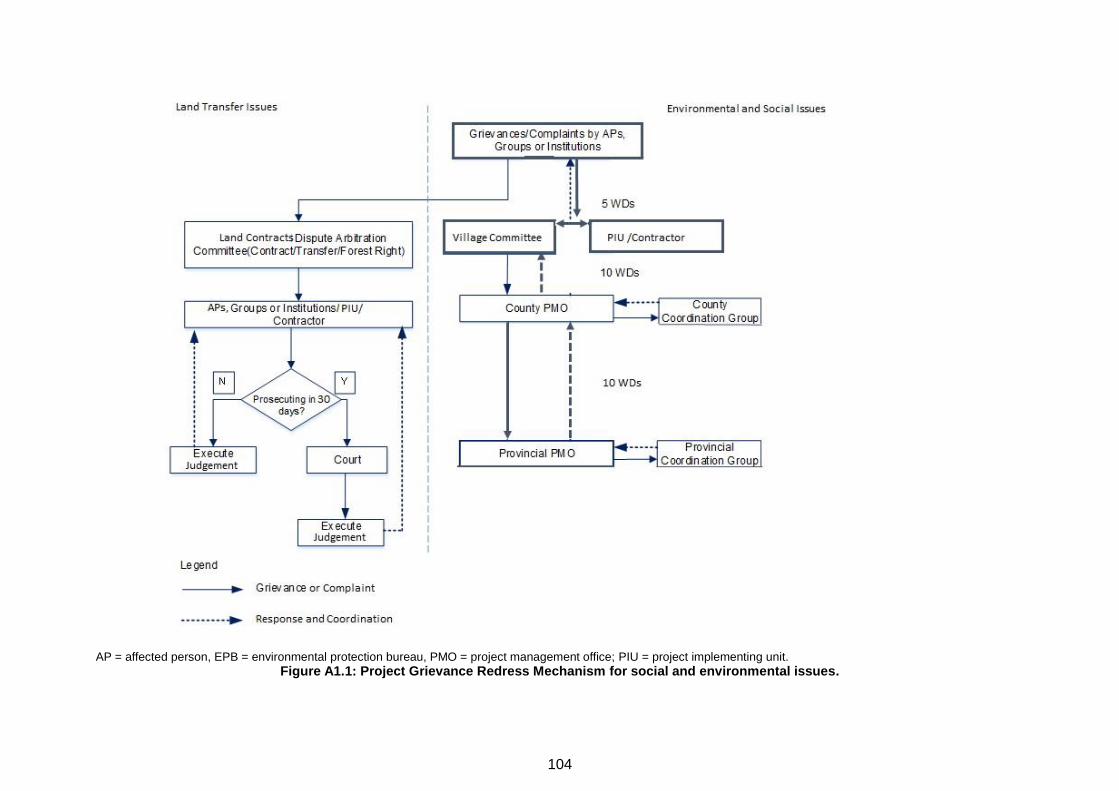
J. Conclusion ................................................................................................................ 7
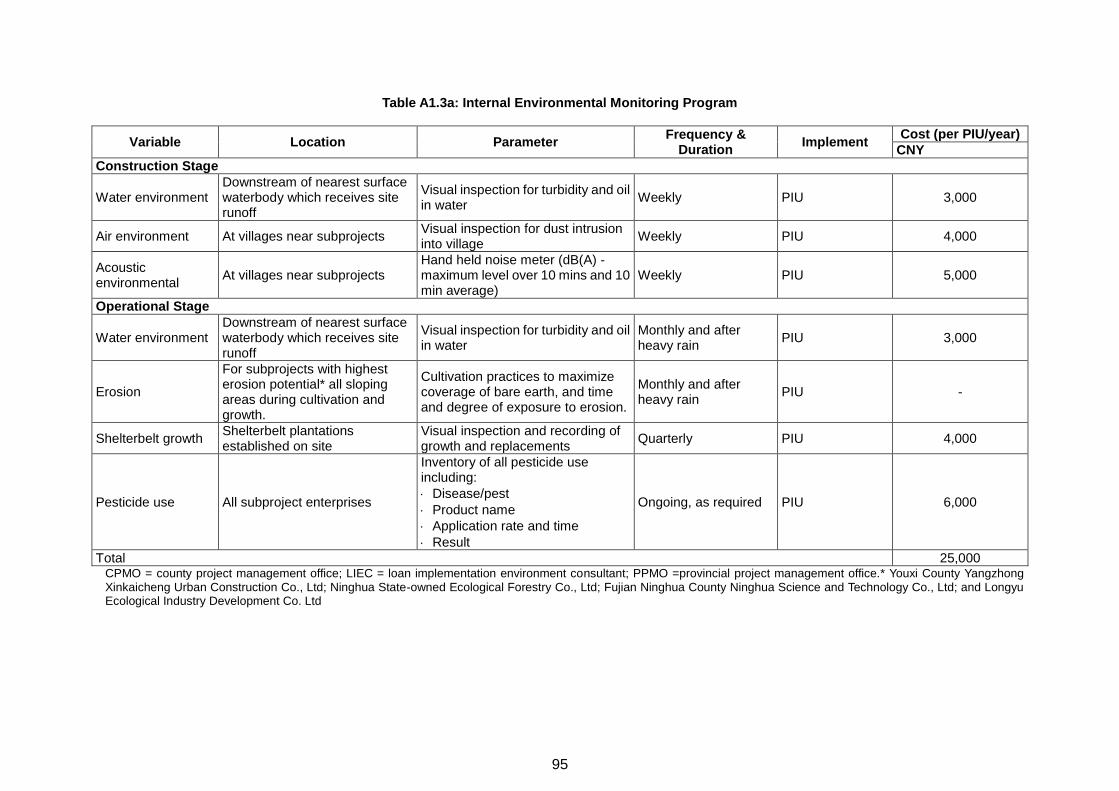
II. INTRODUCTION ................................................................................................................. 8
A. Project Rational ......................................................................................................... 8
B. The Proposed Project ................................................................................................ 9
C. Environmental safeguards ......................................................................................... 9
III. POLICY, LEGAL AND ADMINISTRATIVE FRAMEWORK .................................................. 11
A. Planning Framework ............................................................................................... 11
B. Legal and Administrative Framework ....................................................................... 12
C. Evaluation Standards .............................................................................................. 13
D. Implementation Arrangements ................................................................................. 15
IV. DESCRIPTION OF THE PROPOSED PROJECT ............................................................. 17
A. Project Overview ..................................................................................................... 17
B. The Subprojects ...................................................................................................... 17
C. Capacity Building ..................................................................................................... 24
D. Due Diligence of Existing Facilities and Approvals ................................................... 25
V. DESCRIPTION OF THE ENVIRONMENT (BASELINE DATA) .......................................... 27
A. Environmental Setting – Fujian Province ................................................................. 27
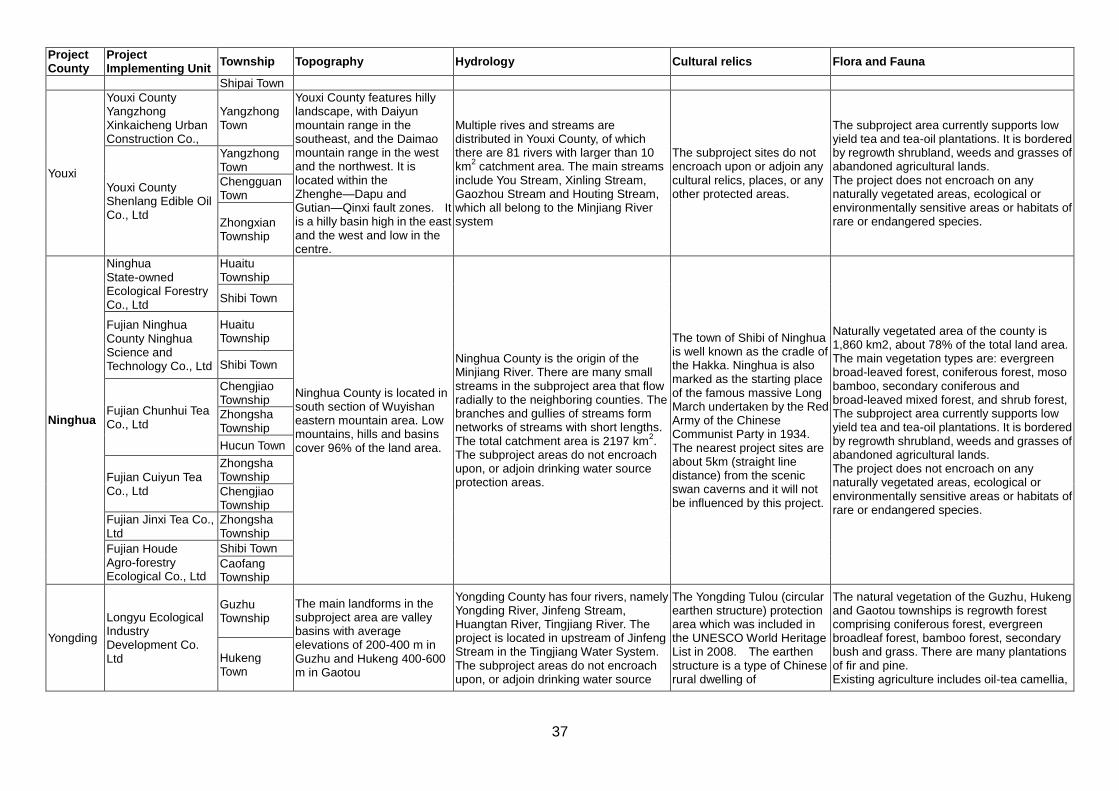
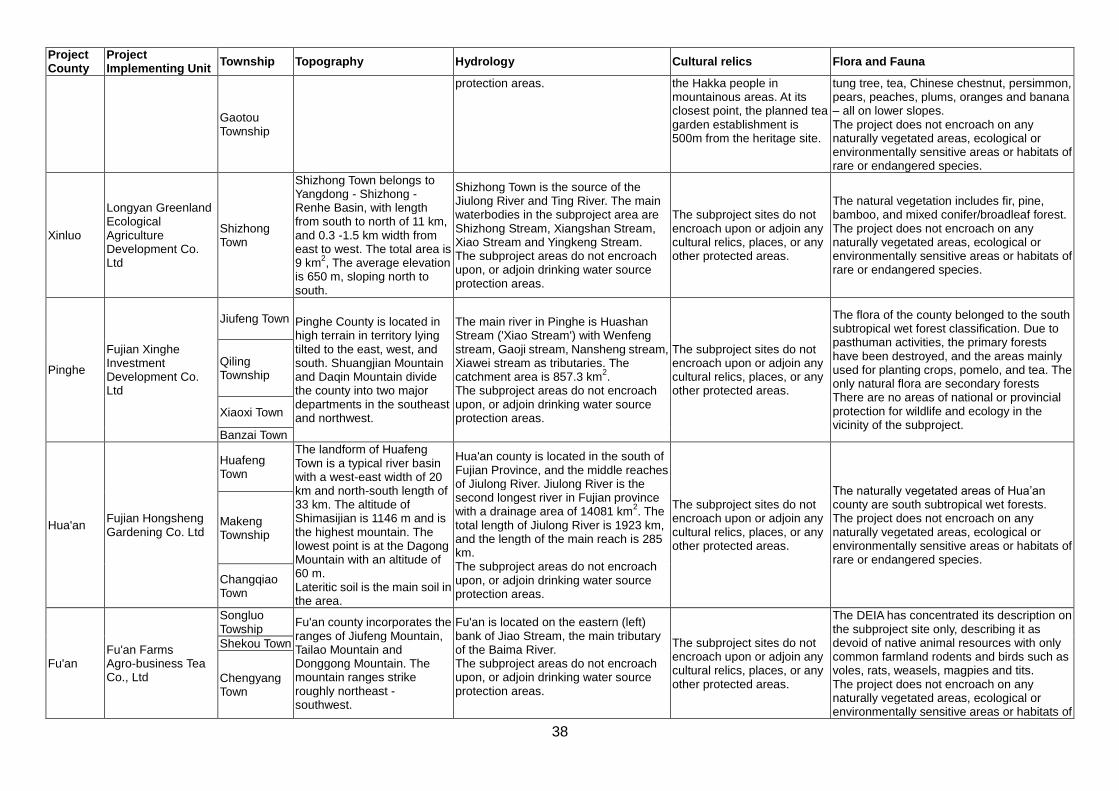
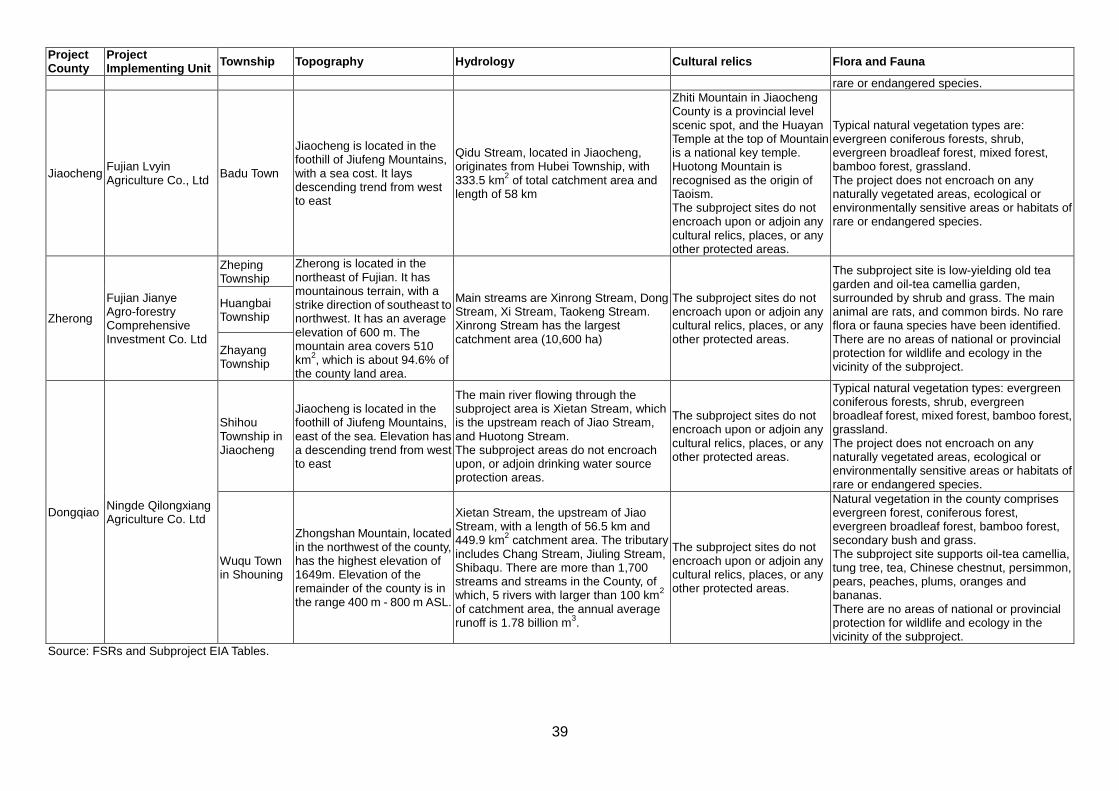
B. Environmental Setting – Project Counties................................................................ 27
C. Environmental Baseline at Project Sites .................................................................. 40
D. Socio-economic and Resources Setting of Project .................................................. 43
VI. ANTICIPATED ENVIRONMENTAL IMPACTS AND MITIGATION MEASURES ................. 47
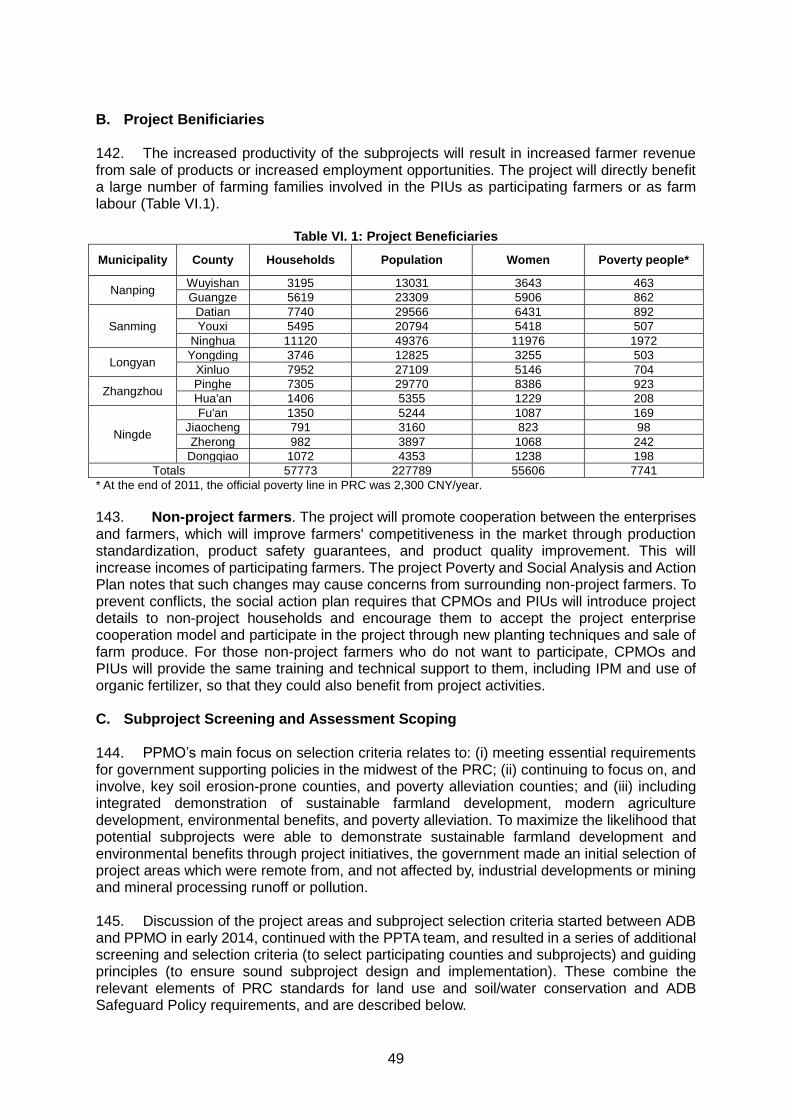
A. Project Benefits ....................................................................................................... 47
B. Project Benificiaries ................................................................................................. 49
C. Subproject Screening and Assessment Scoping ...................................................... 49
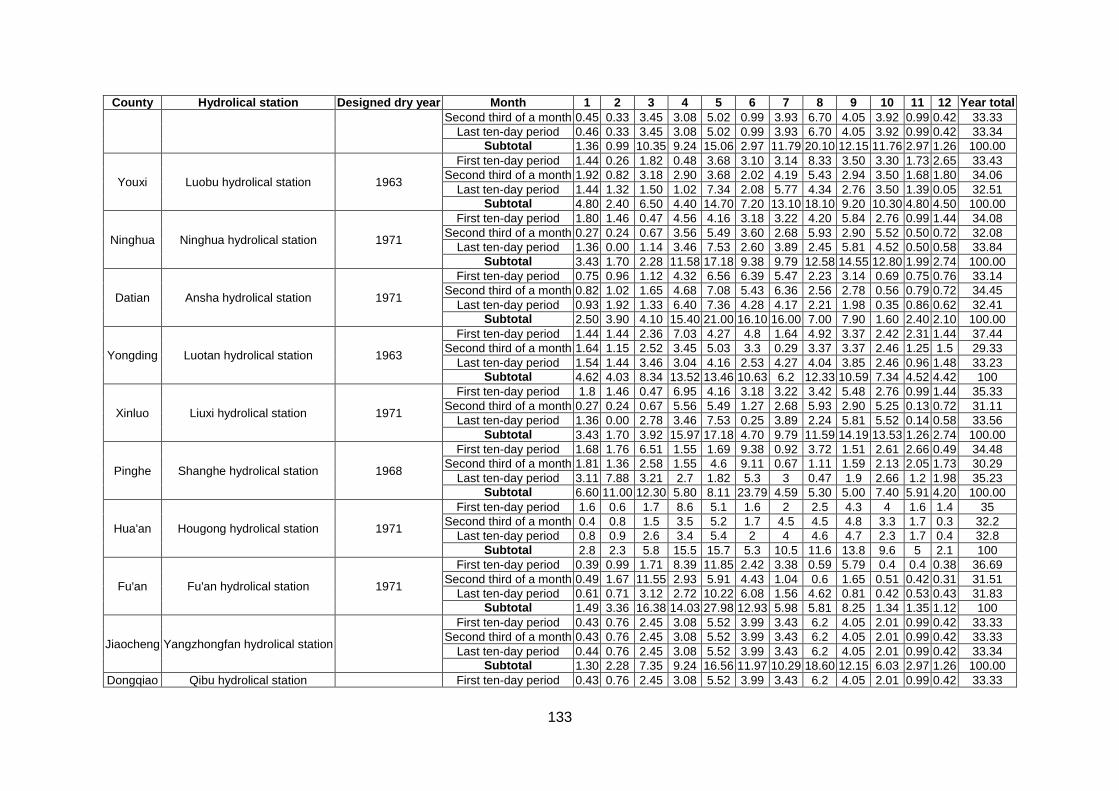
ATTACHMENT 5: WATER DEMAND AND SUPPLY ANALYSIS ............................................. 125
1
I. EXECUTIVE SUMMARY A. Introduction 1. This initial environmental examination (IEE) is for the Fujian Farmland Sustainable Utilization and Demonstration Project, Fujian province, People’s Republic of China (PRC). The project impact will be improved long-term farmland productivity and rural livelihood in Fujian Province. The project outcome will be climate-resilient and sustainable crop farming systems demonstrated in 13 project counties. The project has three outputs: (i) productive farmland established; (ii) sustainable farming technology and practices adopted; and (iii) institutional capacity strengthened. The first output will include land rehabilitation and agricultural demonstrations on valley floors and sloping lands. The assessment sections of this IEE focus mainly on outputs 1 and 2, since these comprise the major physical works of the subprojects. 2. The aim of the project is for environmentally sustainable and climate-smart agriculture, and the design of individual subprojects already included a range of environmental safeguards in the PRC Feasibility Reports. These have been added to by the domestic EIAs (DEIAs) and this IEE. 3. The project will be implemented by 19 agricultural enterprises engaged in tea and tea-oil production on slopeland areas and cropping, including rice, in the valley floors. These enterprises comprise state owned enterprises (SOEs) and private participating enterprises (PPEs), and are collectively termed the project implementing units (PIUs). The range of plantation and crop growing to be undertaken within each subproject is summarized in Table I.1. Each subproject cropping enterprise will be supported by irrigation and drainage infrastructure as well as farm tracks and shelterbelt establishment.
Table I.1: Subproject Types Project county
Project Implementing Unit PIU Type and area of land (mu)
4. A total of 269,128.5 mu of land will be included in project activities. Almost two thirds of the total activities (in terms of area) will be on the improvement of tea and tea-oil plantations on slopes. The total project land area comprises: (i) 263,880.5 mu farmland under active use and for which the project will expand or intensify the existing use; (ii) 4,748 mu of farmland under active use and for which the project will change the crop type; and (iii) 500 mu of unfarmed (abandoned) agricultural land, on which the project will establish new crops. About 191,730 mu are proposed for tea or tea-oil plantations, comprising the new establishment of plantations on abandoned agricultural terraces and rehabilitation of existing terraced plantations. This represents about 6% of Fujian’s total tea and tea-oil lands. On the valley floors, rice paddy and grain crop cultivation account for 51,264 mu, or 79% of the cropping. 5. Agricultural infrastructure included in the project covers: (i) 525 km of irrigation and drainage channels for all subprojects; (ii) in-stream weirs in five subproject; (iii) 708.5 km of farm tracks for farm machinery and plantation maintenance; (iv) planting of almost a million trees and shrubs for shelterbelts; and (v) 27 km of riverside embankment and dikes for valley floor farmland flood protection. B. Baseline Environment 6. Fujian Province is located in the southeast of mainland PRC. Eighty per cent of the province is mountainous and it is the most forested province in the PRC, with 52.4% forest cover. Water resources are abundant, with high rainfall and extensive river systems. A key issue for the province is soil erosion, due to the mountainous landforms and high rainfall. There are 23 “key soil erosion counties” in Fujian, and where erosion protection is required for all agricultural developments on sloping land. Seven (Datian, Ninghua, Yongding, Pinghe, Hua’an, Shouning/Dongqiao, Fu’an) of the 13 project counties are key erosion control counties with more than 5% of their erosion lands classed as moderate, severe or extreme. 7. In most project counties, especially the slopeland sites, air, noise and water environments are of good quality with no major existing pollution or contamination issues. In order to maximize the likelihood that potential subprojects were able to demonstrate
3
sustainable farmland development and environmental benefits through project initiatives, the initial selection of project areas were remote from, and not affected by, industrial developments or mining and mineral processing runoff or pollution. 8. Environmental baseline values for water quality, air quality, and noise environment at all subproject sites were sampled by domestic EIA Institutes to assess compliance with relevant national standards. The closest waterbodies to the subprojects in all but two counties (Datian and Dongqiao) comply with Class III standard of GB3838-2002, which means that the water is suitable for water source protection for centralized drinking water supply, sanctuaries for common species of fish, and swimming zones. At Datian, the water quality at the subproject site is Class V and suitable only for agricultural irrigation and livestock. At Dongqiao, the water quality is Class IV and is suitable for general industrial water supply and recreational waters in which there is not direct human contact with the water. 9. Only one component of one subproject uses groundwater (Fujian Hongsheng Gardening Co., Ltd). The groundwater quality at this locality was sampled for the DEIA and complies with Grade III standard of the Groundwater Quality (GB/T 14848-1993). 10. The air quality at all sites complies with Class II of GB3095-2012, which is the standard for residential, commercial, industrial and rural areas. Ambient noise levels at all sites meet Grade II of GB3096-2008, which is the standard for residential, commercial and mixed industrial areas. C. Impacts and Mitigation Measures 11. Site selection and screening. To avoid as many potential environmental impacts as possible, a comprehensive screening process was conducted by the government, design institutes and PPTA team early in the project design. The teams visited proposed project sites, checking slopes and forest cover, and meeting with the local bureaus of environment protection, forestry, and water resources to assess existing environmental values. As a result, one proposed subproject was removed in order to avoid the clearance of 8,600 mu of natural forest and shrub land. In five other subprojects (Jiaocheng, Youxi, Guangze, Ninghua, Xinlou), components involving a total of 30,083 mu of forest and shrub land clearing were removed from subproject designs. In two others (Datian and Yongding) subproject designs were changed to protect drinking water source zone and delete large capacity reservoir construction respectively. This early planning resulted in significant avoided impacts. 12. The project does not encroach on any naturally vegetated areas, ecological or environmentally sensitive areas, or habitats of rare or endangered species.The boundaries of all subprojects were examined to ensure that no natural vegetation (regrowth forest or shrublands) were included in lands to be developed for crops or agricultural infrastructure. This screening process resulted in potential impacts on biodiversity avoided. 13. Pre-construction. Mitigation of potential construction and operational impacts will begin with pre-construction measures relating to project readiness. Project site planning will be a formal requirement for each subproject to ensure that the layout of work areas and the scheduling of activities is in accordance with the impact mitigation prescriptions of the EMP. Measures to ensure that, prior to project implementation, the capacity to manage the project environmental safeguards is present in the project agencies are identified in the IEE and EMP. 14. Construction. The key construction issues are erosion, protection of stream banks, avoidance of naturally vegetated areas and protection of heritage sites. Potential contruction impacts include air and water pollution, noise and community health and safety.
4
15. Soil erosion is the major potential impact during subproject construction. There are 23 key soil erosion counties in Fujian, where land rehabilitation is being actively pursued by county governments and erosion protection is required for all agricultural developments on sloping land. Seven (Datian, Ninghua, Yongding, Pinghe, Hua’an, Shouning, Fu’an) of the 13 counties in the project are key erosion control counties with more than 5% of their erosion lands classed as moderate, severe or extreme. 16. Strict erosion control prescriptions have been set for PIUs, combining technical specifications of soil and water conservation for sloping land set in Soil and Water Conservation Law of PRC (25 December 2010) and those developed during the PPTA. Of the subprojects identified as having the highest erosion potential, four also involve large volumes of earthworks. Mitigation measures are set to limit soil erosion during construction. These measures will apply to all subprojects, since all involve some development of sloping land, however the four subprojects identified will be subject to special scrutiny under the EMP. 17. Riverside embankments will be implemented by four subprojects (Wuyishan, Datian, Yongding, Xinluo) to support the valley floor farmland irrigation and provide flood protection. Embankment construction along streams in valley floor cropping areas will be scheduled for October to February, to complete work during the lowest water levels of the year. A setback of 20 m from the stream banks will protect the trees currently existing along the banks. 18. During the course of the PPTA subprojects were screened to avoid any loss of biodiversity. Small boundary changes to avoid natural forest or shrublands were made in subprojects as a result and it is important that these small boundary changes are observed during project implementation. Strict control of construction will be checked by the county project management offices (CPMOs) to ensure that PIUs adhere to the boundaries of existing or abandoned farmland. Measures to stop work spreading onto naturally vegetated areas are to be included in site construction planning and cover the assignment of work areas and access corridors to avoid occupying land randomly. Construction machinery and construction materials will not be placed in naturally vegetated areas. 19. One subproject, Yongding, is near a World Heritage Site (Yongding Tulou Circular Earthen Structures). The subproject does not encroach upon the core or buffer protection areas. To avoid impacts, no vehicles hauling materials or equipment to and from the site will be allowed to pass through the World Heritage site core and buffer zone, to avoid dust, noise and vibration impact on the Tulou houses. Damage to any trees or shrubs on the ridgetop, which provides a backdrop to the World Heritage Site is strictly prohibited. 20. Potential construction impacts on air quality, on water quality of nearby suface waterbodies and groundwater, and on the noise environment have been reviewed and concluded to be minor and readily minimized through mitigation measures which are set out in the EMP. 21. Operations. During the operational phase, there is potential for negative environmental impacts associated with: (i) the exploitation of water resources; and (ii) use of agricultural chemicals. For water use, detailed irrigation demand and supply analyses have demonstrated the sustainability of the proposed water use levels of the subprojects. Water requirements will be sourced from runoff only (11 of 19 subprojects), runoff and stream (6 subprojects), stream only (one subproject), and runoff and groundwater (one subproject). Water storage capacity will be improved in all subprojects. For the subprojects utilizing runoff, the proportions of water collected range from less than 1% to near 40%, i.e. 75 to 99% of total runoff volumes will return to waterways. For the subprojects extracting water from streams, the mean proportion of water extracted (compared to flow volume of the first upstream tributary) is around 18%. Of these extraction volumes, 20-30% will subsequently return to the streams through surface flow.
5
22. For the use of agricultural chemicals, the project will implement increased use of organic fertilizers and innovative management and cultivation practices for pest control. This will result in a net reduction in the application of agricultural chemicals in the subproject sites. For fertilizers, about 12,000 tons/year of chemical fertilizer will be replaced by organic fertilizer. For pesticides, due to the unpredictable nature of disease and pest infestations, predicted reductions in pesticides cannot be quantified, but will be strictly monitored and included in progress reports. 23. Other potential impacts in the operational phase of subprojects are: erosion during crop management; solid waste handling and disposal; and in-stream weir operation. 24. Measures to prevent erosion during cultivation and tillage practices on sloping lands will center on the use of narrow terraces (inclined back towards the hillside and following the contours, with ditches on the inside edge of each terrace to harvest runoff and collect eroded soil materials. Interception dams1 to intercept runoff from slopes, and storage ponds and tanks, will be maintained to store water for irrigation and intercept sediments eroded from the tea gardens. 25. Risks associated with solid waste handling are expected to be small. In all townships, established litter collection processes and transport systems to nearby landfills are already in place. Volumes of waste produced during construction and operation will be small and manageable because: (i) project activities are spread across 19 counties; (ii) the nature of the project does not generate large or diverse volumes of waste; (iii) the main waste products to be generated, plastic mulch and/or packaging for agricultural chemicals, will be minimized through the use of biodegradable plastic mulch, improved mulching (to reduce the need for plastic film), reduced chemical application, recycling of the fertilizer bags, and, inventorying and control of the pesticide packaging. 26. The design of the existing and operating in-stream weirs include gates which maintain the flow of the waterbodies and allow passage of fish. Shelterbelt forests planted in the subprojects will use only native species to improve local biodiversity. 27. Occupational and community health and safety. The PIUs and construction contractors for the subprojects will include an environmental health and safety management plan, as part of their Site Management Plan as required by the EMP. The contractors’ performance and activities for occupational health and safety shall be incorporated in their monthly progress reports. 28. The safety and health of workers and residents may be at risk from construction (especially earthworks) and operations (especially the use of machinery on sloping land). Residents may also be affected by noise and dust. Strict health and safety measures will be implemented during construction and operation. D. Capacity Building 29. Part of the rationale for the project is that that sustainable land use in Fujian cannot be achieved without outside assistance, particularly to promote best-use practices. FPG seeks to avail itself of the experience and knowledge that can be accessed through the proposed project, to achieve the target of sustainable use of its farmland. The project has therefore been designed with a significant capacity building component.
1 Small dams along hill slopes aimed to catch water from runoff. Water is then transferred by channel or pipe to larger
water storage structures.
6
30. Each of the subprojects to be undertaken by a PIU have a capacity building component based on the needs (i.e. new green and organic products farming methods will be introduced to the cooperated farmer coopratives, village committee and farmers due to current traditional farming approaches, which leads low productivity and low quality of agro-products). This comprises: training (for both participating farmers and PIU managers); support to farmer cooperatives; establishment of a farmland infrastructure management and maintenance associations; a range of product certifications; purchase of quality testing equipment; and establishment of an agricultural information exchange platforms (internet facilities). Individual PIU subprojects have included, according to their industry types and cultivation models, research on irrigation efficiencies and water saving technologies; the setting up of on-farm meteorological stations; study tours; and establishment of pest control and prevention units. 31. In total, approximately 62,990 person-days of training on agricultural production techniques and practices will be provided to farmers, along with 7,800 person-days of training to PIU managers and local agricultural technicians. E. Associated facilities 32. In nine subprojects, products made from project-supported activities will be processed in existing facilities owned and operated by the same PIUs. Due diligence on the environmental approval and compliance status of these facilities has been undertaken. All PIUs with existing facilities which will process subproject products have documented environmental approvals. F. Climate Change 33. A climate risk and vulnerability assessment (CRVA) was conducted for the project. The subproject components most vulnerable to increases in temperature and decreases in rainfall are irrigated crops, the main focus of the project. The vulnerability comes from (i) increasing water stress and higher water demand from crops due to higher temperatures; and (ii) declining water availability for rain-fed crops and irrigation from site catchments and local waterbodies due to lower rainfall. The project water supply and demand analysis was calculated for a conservative rainfall/runoff exceedence value of P=90%,2 and showed that planned use of water resources by the project was sustainable, mainly due to the widespread harvesting of site runoff water. A sensitivity analysis using the worst 2035 scenario for increased temperature and reduced rainfall confirmed the sustainability. 34. Based on the total area of project crops and the emission rates from these cropping activities, greenhouse gas emissions were calculated for the project. Emissions for cultivation on valley floors (rice, grain, vegetables and pasture) total 62,500 tons CO2e/year. Emissions for slopeland cultivation (tea and tea-oil) total 14,380 tons CO2e/year. Emissions related to power usage on-site (predominantly by pumps) will produce an estimated 1,300 tons CO2e/year. The total, at approximately 78,180 tons/annum is below the 100,000 tons/year threshold in ADB’s Safeguard Policy Statement (SPS, 2009) for significant emissions. Emissions will be offset by carbon sequestration achieved by the 191,730 mu of tea and tea-oil plantations, and extensive shelterbelt plantings. G. Public Consultation and Grievance Redress Mechanism 35. Public consultation was conducted for the project by PPTA team and domestic EIA institutes. Meetings with project local government agencies have also been conducted. A grievance redress mechanism (GRM) has been developed in compliance with ADB’s SPS
2 P=90% are rainfall/runoff values which would be exceeded 90% of the time (i.e. a 1 in 10 year drought).
7
requirement to address environmental, health, safety, and social concerns associated with project construction, operation, and land contracting arrangements. H. Environmental Management Plan 36. A project environmental management plan (EMP) has been prepared to mitigate and manage the potential environmental impacts of project construction and operation (Attachment 1). The EMP includes institutional responsibilities, training needs, reporting schedules, pre-construction requirements, operational management prescriptions, GRM, monitoring and reporting, and costs for implementing the EMP. To support EMP implementation, the PMO will: appoint a qualified environment officer within the provincial PMO (PPMO) and each CPMO; recruit a loan implementation environment consultant (LIEC) (as part of the loan administration consultant services); and ensure that all PIUs have arranged contractual agreements with qualified environment monitoring stations (EMS) to conduct the environmental monitoring described in the EMP. I. Project Assurances 37. The project will comply with all applicable PRC laws and standards as well as the requirements in the project EMP for impact mitigation, performance monitoring and reporting, capacity building, and the establishment and operation of the GRM. Additional project-specific assurances have been developed to further reduce risks, including for erosion control, scope of operations, and pesticide use (Section IX.B). J. Conclusion 38. The project design has been developed toward the maximization of erosion control, avoidance of new land conversion, and the physical location and management of subprojects to avoid impacts. For environmental safeguards, assuming full and effective implementation of the project EMP (Attachment 1), the potential environmental impacts identified in this IEE are expected to be mitigated to levels which comply with the relevant PRC standards.
8
II. INTRODUCTION A. Project Rationale 39. Fujian covers a total land area of 120,146 km2, with a total population of 37.74 million3, of which, 22.93 million live in the urban area. Poverty rate is 2.37% of the total population in the province. Agricultural output value in 2013 was CNY 317 billion (21.5% of provincial gross domestic product, 1,473.712 billion). In 2014, total tea plantation area was 2,215,000 ha4 (9.72% of the national total) while tea production was 347,000 tons (18.48% of the national total and highest in the PRC). The tea sector involves nearly 10% of the total provincial population. Annual oil tea camellia seed production has increased from 62,983 tons in 2000 to 138,161 tons in 2013.5 Tea-oil camellia development is promoted by the provincial government and has become a main source of increasing income for the rural population. 40. High levels of agricultural production in Fujian have resulted in high usage of chemical fertilizers and pesticides. In 2013, total fertilizer use was 4.13 million tons6 with low fertilizer application efficiency (about 30%). The average application rate is 25.9 kg/mu, 15% higher than the national average. Excessive use of fertilizer and pesticides has resulted in non-point source pollution, soil acidification, and declining soil fertility and organic matter content. In 2013 total pesticide use was 57,800 tons. 41. The other major constraints on agricultural development in Fujian are soil erosion and lack of farmland infrastructures (poor farm tracks and limited irrigation facilities). On the valley floors, infrastructure is old and poorly maintained. On slopelands, agriculture is subject to soil erosion due to inappropriate land management. In the last 30 years, efforts to control erosion have made progress in reducing the problem; in 1985 the ratio of severe and medium soil erosion to all erosion classes exceeded 37%,7 and in 2001 the ratio had dropped to 9.98%.8 42. Reviews by the Ministry of Agriculture9 have concluded that sustainable land use cannot be achieved without outside assistance, particularly to promote best-use practices. The Fujian Provincial Government (FPG) wishes to benefit from the experience and knowledge that can be accessed through the project, to achieve sustainable use of farmland. 43. The project is in line with the Asian Development Bank (ADB)’s country partnership, 2011-2015 for the PRC10 in supporting the government’s overarching strategic goal by focusing on inclusive and environmentally sustainable growth and the ADB operational plan for agriculture and natural resources which promotes increased productivity and resource efficiency, agribusiness development, and enhanced food safety and quality.11 The project is also consistent with the updated ADB country strategy (2016-2020) that will focus on the following three strategic priorities: inclusive economic growth under the "New Normal", help the PRC realize "ecological civilization", and promote regional cooperation.
3
Fujian Provincial Statistic Book. 2014. 4 China Agricultural Yearbook. 2013.
5 Fujian Agricultural Statistic Book. 2014.
6 Ibid. It comprises from 1,674,100 tons of nitrogen fertilizer, 928,100 tons of phosphate fertilizer, 554,800 tons of potash fertilizer, and 975,600 tons of compound fertilizer respectively.
7 Medium soil erosion: annual soil loss from 1,500-2,500 ton per km
2. Severe soil erosion: annual soil loss above
2,500 ton per km2.
8 Director of Soil Conservation Station of Fujian province.
9 Opinions on Taking Measures to Prevent and Control Agricultural Nonpoint Source Pollution, MOA. No.1 Nongkejiaofa [2015], 10 April 2015.
10 ADB. 2012. Country Partnership Strategy: People’s Republic of China, 2011–2015. Manila.
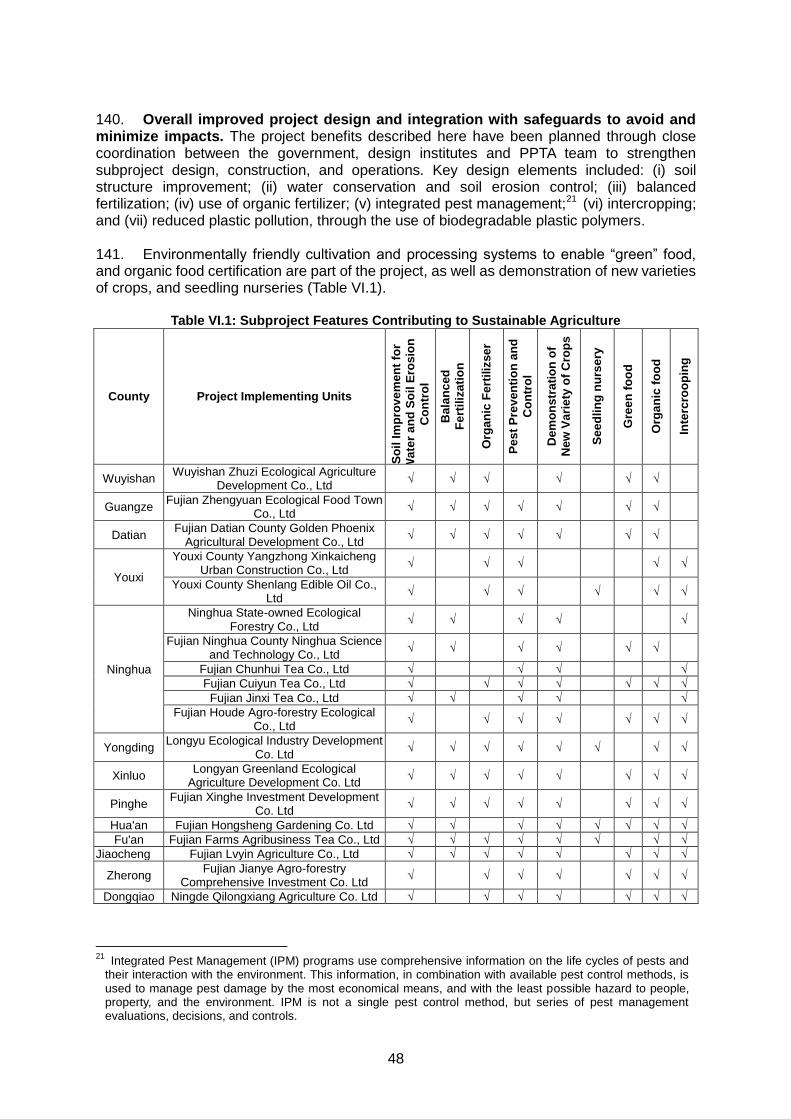
11 ADB. 2015. Draft Operational Plan for Agriculture and Natural Resources: Promoting Sustainable Food Security in Asia and the Pacific in 2015–2020. Manila.
9
B. The Proposed Project 44. The project impact will be improved long-term farmland productivity and rural livelihood in Fujian Province. The project outcome will be climate-resilient and sustainable crop farming systems demonstrated in 13 project counties. The project outputs will be (i) productive farmland established, (ii) sustainable farming technology and practices adopted, and (iii) institutional capacity strengthened. 45. The project will be implemented by 19 agricultural enterprises distributed among the 13 counties engaged in tea and tea-oil production on slopeland areas as well as other cropping including rice, in the valley floors. These enterprises will comprise both State Owned Enterprises (SOE) and Private Participating Enterprises (PPE) and will be collectively called Project Implementing units (PIUs). 46. Most of the subproject sites are in counties with poor catchment condition resulting in water loss and soil erosion. The sites in mountainous areas have low soil fertility so that existing productivity is low. Irrigation systems and facilities are often poorly planned and rudimentary, lacking the equipment and infrastructure to provide sustainable water use. Irrigation canals and drainage channels in valley floor sub-project sites have fallen into disrepair and resources for rehabilitation and maintenance are limited. This has resulted in limited irrigation during the dry season and constraints in draining flood waters from cultivation areas during the wet season. Existing tracks do not allow access for advanced machinery for cultivation and harvesting, with the result that these tasks are mainly done by manpower, which further limits productivity. 47. Selection of project counties focused on addressing these existing constraints as well as the objective of operating in areas of rural poverty and providing demonstration of sustainable and climate smart agriculture to a receptive audience. Project county selection against these factors is summarized in Table II.1.
Table II.1: Project County Selection
Selection criteria
Project Municipality Project county
Key poverty alleviation
county
Key water and soil conservation
county
Sustainable agriculture
demonstration area
Nanping Wuyishan
√
Guangze √
√
Sanming
Datian
√
Youxi
√
Ninghua √ √
Longyan Yongding
√
Xinluo
√
Zhangzhou Pinghe √ √
Hua'an
√
Ningde
Fu'an
√
Jiaocheng
√
Zherong √
√
Shouning √ √
C. Environmental safeguards 48. The project is classified ‘Category B’ for environment under the ADB Safeguard Policy (SPS, 2009), requiring preparation of an IEE. The project aims to improve the expansion and operational, environmental, and social management of key agricultural industries in Fujian Province. The scope and magnitude of potential environmental impacts have been categorized under the PRC’s EIA regulations as requiring preparation of an “EIA Table”
10
(projects with lower potential impacts). This IEE has been prepared based on information in the individual Feasibility Study Reports (FSRs) and PRC environmental impact assessment documents for each PIU, as well as site visits to the subprojects by the PPTA Environment Team. 49. The IEE includes an environmental management plan (EMP) (Attachment 1). This is the key guiding document for environmental-related issues in the construction and operational phases of the project. The potential impacts of project components are identified in the IEE, and the mitigation and protection measures to avoid, reduce, and/or mitigate these impacts to acceptable levels are described in the EMP. The EMP also defines the roles and responsibilities of relevant institutions, procedures and the EMP budget. The EMP draws on the findings of the project IEE, PPTA team’s investigations and consultations with the relevant government agencies. 50. The EMP will be coordinated by the PMO and implemented by the PIUs and their construction contractors. The EMP will be incorporated within Technical Specifications for construction, and will also be made available to the detailed design team to ensure all pre-construction mitigations are included within the Projects’ final design.
11
III. POLICY, LEGAL AND ADMINISTRATIVE FRAMEWORK A. Planning Framework 51. The PRC’s 12th Five Year Plan (FYP) (2011–2015) supports the long-term goal of building a harmonious and moderately prosperous society through livelihood improvement and regionally balanced and environmentally sustainable growth. The PRC’s 13th Five Year Plan (FYP) (2016-2020) focuses strongly on environmental protection. It states that, with income levels growing, the PRC’s population is starting to see that the quality of the environment impacts the quality of life and that high pollution levels need to be controlled to maintain social stability. Enterprises will have to be prepared for higher operational costs to meet the stricter enforcement of environmental protection measures. 52. The 13th FYP will be released in 2016. In the interim period, Fujian Province’s policy and implementation response are in the following documents: Fujian Provincial Resolution Concerning Some Major Issues in Comprehensively
Deepening Rural Area Reform to Accurate the Development of Modern Agriculture. (2014)
Fujian Provincial 12th Five Year Plan on Environmental Protection and Ecological Development (2011-2015);
Fujian Provincial Land Utilization Master Plan (2006-2020); Fujian Provincial Tea Industry Development Regulation (issued in 2012); Fujian’s implementation of Land Administration Law of the PRC (issued in 1999); Fujian Provincial Department of Agriculture’s 12th FYP Mid-term assessment report
(2013) Fujian Oil-Tea Industry Development Plan (2010)
53. Under the National Agricultural Sustainable Development Plan (2015-2030)12, Fujian Province is classified as a development priority zone, and for reducing the application of chemical fertilizers and pesticides, increasing red soil reclamation, controlling soil erosion, and promoting ecological, featured, and high efficiency agriculture, to establish high quality products and production systems. Major investment should go to (i) water and soil resource protection engineering13; (ii) agricultural and rural environmental control;14 (iii) agricultural ecological environment reclamation; and (iv) piloting and demonstration projects. The plan aims to promote green cultivation, create “high standard arable land” with better facilities, protect arable land, build irrigation works, and water conservation. 54. The Ministry of Environmental Protection (MEP) has launched ecological civilization pilot demonstration activities and Fujian Province was the first pilot province for ecological civilization (March 2014) to experiment and subsequently offer replicable solutions in sustainable development. As a pilot province, the FPG will build on existing experiences in agriculture and environmental protection and use the loan project to demonstrate agricultural improvements in less developed areas.
12
Released by the Ministry of Agriculture (MOA), National Development and Reform Commission (NDRC), Ministry of Science and Technology, Ministry of Finance, Ministry of Land and Resources, Ministry of Environmental Protection, Ministry of Water Resources, State Forestry Administration on 20 May 2015. No. 145 Nongjiafa [2015].
13Such as high standard farmland construction project, cultivated farmland protection and improvement project; high efficiency water-saving project (promoting sprinkler irrigation, micro irrigation, rainfall collection and irrigation, and integral control of water and fertilization), surface water over exploit and ground water overdraft area control project, and agricultural resources monitoring project.
14Specifically, livestock waste integrated management project, nitrogen and phosphate source control from chemical fertilizer and pesticide project, agricultural film and pesticide packages recycle and reuse project, straw integrated utilization project and rural environmental integrated management project.
12
B. Legal and Administrative Framework 55. The administrative framework for EIA in the PRC comprises national, provincial and local (municipal) environmental protection authorities. The national authority is the MEP, which promulgates laws, regulations and technical guidelines on EIA and pollution prevention and control, and which is represented at the provincial level by the Department of Environmental Protection (DOEP). The DOEP is the delegated authority to approve EIA reports for provincial construction projects, except those with national concerns and/or inter-provincial projects. Local or municipal-level Environmental Protection Bureaus (EPBs) enforce environmental laws and conduct environmental monitoring. For the project, the Fujian Provincial DOEP will approve the domestic EIAs. 56. The PRC has a wide range of laws, regulations, technical guidelines and standards that govern the way in which environmental protection and environmental impact assessment for construction projects must be implemented, including for pollution prevention and control on air, noise, water, ecology and solid waste, and technical guidelines on assessing atmospheric, noise, water and ecological impacts. The primary national laws and regulations that governed the EIA studies of the proposed project are provided in Tables III.1 and III.2.
Table III.1: Applicable Environmental Laws
Title Year issued
Environmental Protection Law 2014 revised
Environmental Impact Assessment Law 2003
Water Law 2002
Water Pollution Prevention and Control Law 2008
Atmospheric Pollution Prevention and Control Law 2000
Noise Pollution Prevention and Control Law 1997
Forestry Law 1998
Wild Animal Protection Law 2004
Solid Waste Environmental Pollution Prevention and Control Law 2005
Water and Soil Conserveation Law 2010
Promotion of Clean Production Law 2002
Urban and Rural Planning Law 2008
Land Administration Law 2004
Circular Economy Promotion Law 2009
Contracting of Rural Land Law 2002
Cultural Relics Protection Law 2002
Table III.2: National and Local Administrative Regulations
Regulation Year issued
Regulation on Construction Project Environmental Protection and Management 1998
Regulation on EIA of Plans and Programs 2009
Regulation on Classification of Construction Project Environmental Protection Management
2009
Environmental Impact Assessment Public Participation Interim Guideline 2006
Circular on Strengthening the Management of Environmental Impact Assessment for Construction Projects Financed by International Financial Organizations
1993
Regulation on Protection of Wild Flora 1997
National Biodiversity Strategy and Action Plan (2011 – 2030) 2010
National Regulation for Public Disclosure of EIAs (NDRC) 2012
Environmental Protection Supervision Rules for Construction Projects 1998
57. The implementation of environmental laws and regulations is supported by a series of associated management and technical guidelines (Table III.3).
Table III.3: Applicable Environmental Guidelines
13
Regulation Year /Code
Technical Guidelines for Environmental Impact Assessment: General Program HJ 2.1-2011
Guidelines for Environmental Impact Assessment: Atmospheric Environment HJ 2.2-2008
Technical Guidelines for Environmental Impact Assessment: Surface Water Environment
HJ/T 2.3-93
Technical Guidelines for Environmental Impact Assessment: Ground Water Environment
HJ 610-2011
Technical Guideline for Environmental Impact Assessment: Ecological Impact HJ 19-2011
Technical Guidelines for Environmental Impact Assessment: Public Participation January 2011
Technical Guideline on Environmental Monitoring Quality Management HJ 630-2011
Technical Guidelines for Noise Impact Assessment HJ 2.4-2009
Technical Guideline for Construction Project Environmental Risk Assessment HJ/T 169-2004
58. The environmental quality standard system that supports the implementation of the environmental protection laws and regulations in the PRC, and by which evaluation of environmental effects are measured, is grouped into two categories by function (i.e. pollutant emission/discharge standards and ambient environmental standards). The relevant main standards applicable to the project are shown in Table III.4.
Table III.4: Applicable Environmental Standards
Standards Year /Code
Ambient Air Quality Standard GB 3095-1996
Ambient Air Quality Standards15
GB 3095-2012
Air Pollutant Integrated Emission Standard GB 16297-1996
Hygienic Standard for the Design of Industries and Enterprises TJ 36-79
Environmental Quality Standard for Noise GB 3096-2008
Technical Specifications to Determine the Suitable Areas for Environmental Noise of Urban Area
GB/T 15190-94
Environmental Quality Standards for Surface Water GB 3838-2002
Quality Standard for Ground Water GB/T 14848-93
59. Standards and guidelines specific to the Project sector are shown in Table III.5.
Table III.5: Applicable local project guidelines and standards
Local Standards and Guidelines Year /Code
Technical regulations for oil-tea Nursery LY/T 2447-2015
Technical regulations for planting camellia oil trees LY/T 1328-2015
Code for Design of Irrigation and Drainage Engineering GB50288-1999
Technical specification for water-saving irrigation engineering GB/T50363-2006
Water Resource Assessment Guideline SL/T238-1999
Guidelines for assessment of water-draw and utilization in Construction Projects
SL/Z 322-2005
Youxi County camellia oil trees Plantation Technical Specification SYX/T 008 – 2011
Environmental Quality Standard for Green Food Production Area NT/T391-2013
Environmental Quality Standard for Pollution – Free Tea Production Area NY5020-2001
60. ADB environmental safeguard requirements. The project is classified as Category B for environment, requiring an IEE report. C. Evaluation Standards 61. ADB’s SPS requires projects to apply pollution prevention and control technologies and practices consistent with international good practices as reflected in internationally
15
To replace GB 3095-1996 on January 1, 2016.
14
recognized standards such as the World Bank Group’s Environmental, Health and Safety (EHS) Guidelines.16 62. For noise and air quality, PRC standards are generally more stringent than internationally accepted standards defined in the EHS Guidelines. PRC ambient acoustic quality standards are defined for categories not directly attributable to the classification of the World Health Organization, but the standard limits are not significantly different. Where EHS standards exist for parameters and are relevant, they are used in parallel with PRC standards in this assessment. 63. For water quality assessment, the ambient environmental standard applied in this IEE
is Surface Water Ambient Quality Standard (GB3838-2002) (Table III.6). The Class IV
standard is the minimum required standard for irrigation and agricultural use. There is no EHS guideline or target for water quality in this context.
Table III.6: Surface Water Ambient Quality Standards (Unit: mg/L)
Standard DO IMn BOD COD NH3-N
(GB3838-2002) – Grade III ≥5 ≤6 ≤4 ≤20 ≤1.0
(GB3838-2002) – Grade IV ≥3 ≤10 ≤6 ≤30 ≤1.5
(GB3838-2002) – Grade V ≥2 ≤15 ≤10 ≤40 ≤2.0
64. Groundwater quality of the project will be assessed against Class III standards according to Quality Standards for Groundwater (GB/T14848-1993). This is the appropriate classification for rural/agricultural groundwater resources advised by the DOEP. The parameter concentration limits for this standard are shown in Table III.7.
65. The relevant ambient air quality evaluation standard for the rural areas where subprojects are to be sited has been nominated by the DOEP as Grade II of Ambient Air Quality Standard (GB 3095-1996). The concentration limits are shown in Table III.8.
Table III.8: Ambient Air Quality Grade II Standard
Pollutant Time Standard (mg/m3)
EHS16
(mg/m3)
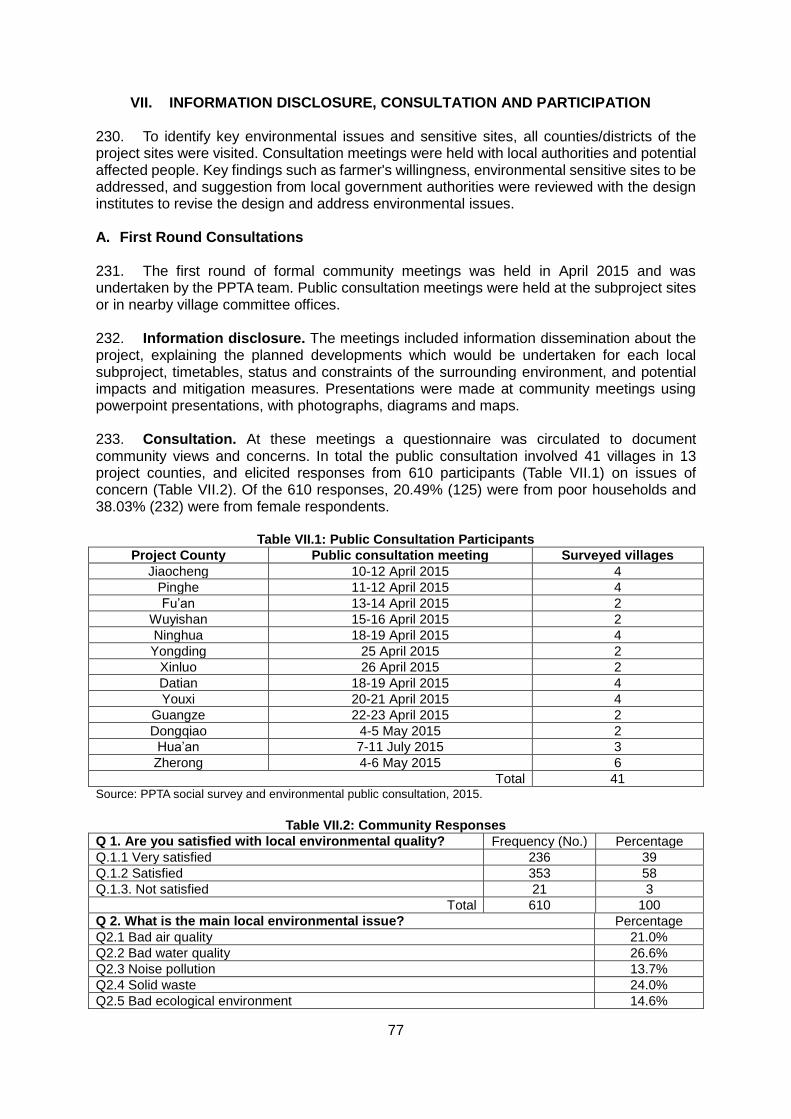
SO2
Annual average 0.06
Daily average 0.15 0.125-0.05 (0.02 guideline)
Unit hour average 0.50
PM10 Annual average 0.10 0.07-0.03 (0.02 guideline)
Daily average 0.15 0.075-0.15 (0.05 guideline)
NO2
Annual average 0.08 0.04 guideline
Daily average 0.12
Unit hour average 0.24 0.20 guideline
CO Daily average 4.0 n/a
Unit hour average 10.0 n/a
66. In the construction phase, impacts from air pollutants from dust and earthworks will be assessed against Grade II standard (for construction in non-urban environments) specified in Air Pollutant Comprehensive Emission Standard (GB16297-1996).
16
World Bank Group. 2007. Environmental, Health and Safety Guidelines General EHS Guidelines. Washington.
15
67. Noise environment for the project’s settings will be evaluated against Class 2 standards of the Environmental Quality of Noise Standard (GB3096-2008). The parameter concentration limits for this standard are shown in Table III.9.
Class 2 (Residential, commercial and industrial mixed area) 60 50
68. During operation, the level of noise from the sites will be assessed against the Class III Emission Standard for Industrial Enterprises Noise at Boundary (GB12348-2008). The parameter concentration limits for this standard are shown in Table III.10.
Table III.10: Industrial Enterprise Site Noise Standard/ Social Life Ambient Noise Emission Standard
Classification Day Leq[dB(A)]) Night Leq[dB(A)])
2 60 50
3 65 55
4 70 55
EHS16
70 70
69. The soil quality standard for the rural areas of the subproject sites is Class 2 standard according to Environmental Quality Standards for Soil (GB15618-1995). The parameter concentration limits for this standard are shown in Table III.11.
D. Implementation Arrangements 70. The FPG will be the executing agency and the municipal governments will be the implementing agencies. The PPMO under Fujian Agriculture Department will be responsible for project implementation and coordination with ADB. At municipal level, the five municipal governments have established municipal project management offices (MPMOs) in the municipal Agriculture Offices for day-to-day project management and coordination among project counties. Similarly county project managing offices (CPMOs) have been established at county Agriculture Offices to manage the implementation of subprojects in each county. 71. The PIUs will comprise both SOEs and PPEs. The PPMO will be responsible for the coordination and administration of procurement activities while PIUs will undertake specific subproject and procurement activities. 72. The main institutions involved in the implementation of the project and their roles in relation for the IEE and EMP are in Table III.12.
Table III.12: Institutional Roles and Responsibilities
PPMO - within Agriculture Department (Agriculture Affair Office)
On behalf of the executing agency, responsible for overall project coordination and supervision including: preparation and implementation; coordinate training and capacity development
16
Project implementation organizations
Management Roles and Responsibilities
activities; safeguards compliance; prepare and submit semi-annual environmental and social safeguard monitoring progress reports; compliance with loan and project agreements
MPMO (implementing agencies): Nanping, Sanming, Longyan, Zhangzhou, and Ningde Municipalities
Responsible for project implementation at the municipal level: monitor subproject implementation and achievement of output indicators within the municipality; and, prepare and submit semi-annual project progress report to PPMO.
CPMO – county Agriculture Bureaus of 13 project counties
Daily management activities for project preparation and implementation, incuding: quality assurance and quality control for project construction; review construction supervision works by the supervision agency; ensure PIUs comply with EMP; and, prepare semi-annual project progress reports and submit to MPMO
FPG = Fujian Provincial Government, PCG = Project Coordination Group; PPMO = Provincial Project Management Office, MPMO = Municipal Project Management Office, CPMO = County Project Management Office, ADB = Asian Development Bank, EMP = Environmental Management Plan.
73. The PCG comprises the following agencies and organizations: Provincial Development and Reform Commission (PDRC), Finance Department, Agriculture Department, Water Resource Department, Forestry Department, Environmental Protection Department and the Womens Federation.
17
IV. DESCRIPTION OF THE PROPOSED PROJECT A. Project Overview 74. The Project comprises three outputs: (i) productive farmland established, (ii) sustainable farming technology and practices adopted, and (iii) institutional capacity strengthened. 75. Output 1 – Productive Farmland Established. This output will include: (i) valley floor improvement (land preparation, flood protection, soil fertility) and demonstration; and (ii) sloping land rehabilitation (terracing and drainage) and demonstration. Valley floor improvement and demonstration will include 64,707.5 mu of valley floor demonstration areas developed for other crops including grains, vegetables, and lotus seeds. The main activities will comprise implementation of integrated improvement measures for the valley floors including land leveling and development of farm infrastructure such as farm tracks, water conservancy facilities (26.99 km of dikes/embankments for flood prevention, drainage ditches, canels, spray/drip irrigation equipment, etc.). Sloping-land rehabilitation and demonstration will include 204,421 mu of sloping-land demonstration area to be developed mainly for tea, oil tea and orchards. The main activities will involve rehabilitation measures for degraded sloping lands including terracing, and development of farm infrastructure such as farm tracks, and water conservancy facilities (water storage ponds, irrigation facilities). 76. Output 2 – Sustainable Farming Technology and Practices Adopted. This output will support PIUs and cooperatives through the provision of (i) agricultural equipment and materials to implement sustainable farming technology and practices such as soil conservation measures (e.g. application of organic fertilizer, zero or low tillage, mulching, and tree plantations for windbreaks and shade), integrated pest management, and other cropping technology (e.g. intercropping, crop rotation); and (ii) soil and water quality testing equipment. All the subprojects will adopt activities suitable for valley floor or slope land demonstration bases. The output will also include activities to provide each project township with professional soil and water quality testing equipment to assist in the formulation of balanced fertilizer application, if required. In addition, the output will facilitate certified green and organic production from part of the slopeland tea tree plantations. 77. Output 3 – Institutional Capacity Strengthened. This output will include (i) training of specialized farmer cooperatives on cooperative operation, production technology, and marketing; (ii) training of farmer trainers and farmers on good agricultural practices and technology, including requirements for green and organic product certification; (iii) establishment and capacity development of farmland infrastructure management and maintenance associations; (iv) consulting services for project management and establishment of a project performance monitoring system to develop the capacity of the EA and IAs for project management as well as monitoring and evaluation. B. The Subprojects 78. The assessment sections of this IEE focus mainly on Outputs 1 and 2, since these comprise the major physical works of the subprojects. It comprises the environmental impact assessment of 19 PIUs engaged in tea and tea-oil production on slopeland areas and cropping (including rice) in the valley floors in 13 counties across Fujian Province (Figure IV.1). Of the 19 PIUs, 9 are SOEs and 10 are PPEs. The subprojects were identified by the FPG as fulfilling the requirements for government sponsored investment. They are existing agricultural enterprises capable of responding to the central government’s promotion of tea and tea oil in Fujian Province with sustainable farming practices.
18
Figure IV.1: Location of Project Counties and Subproject Activities
19
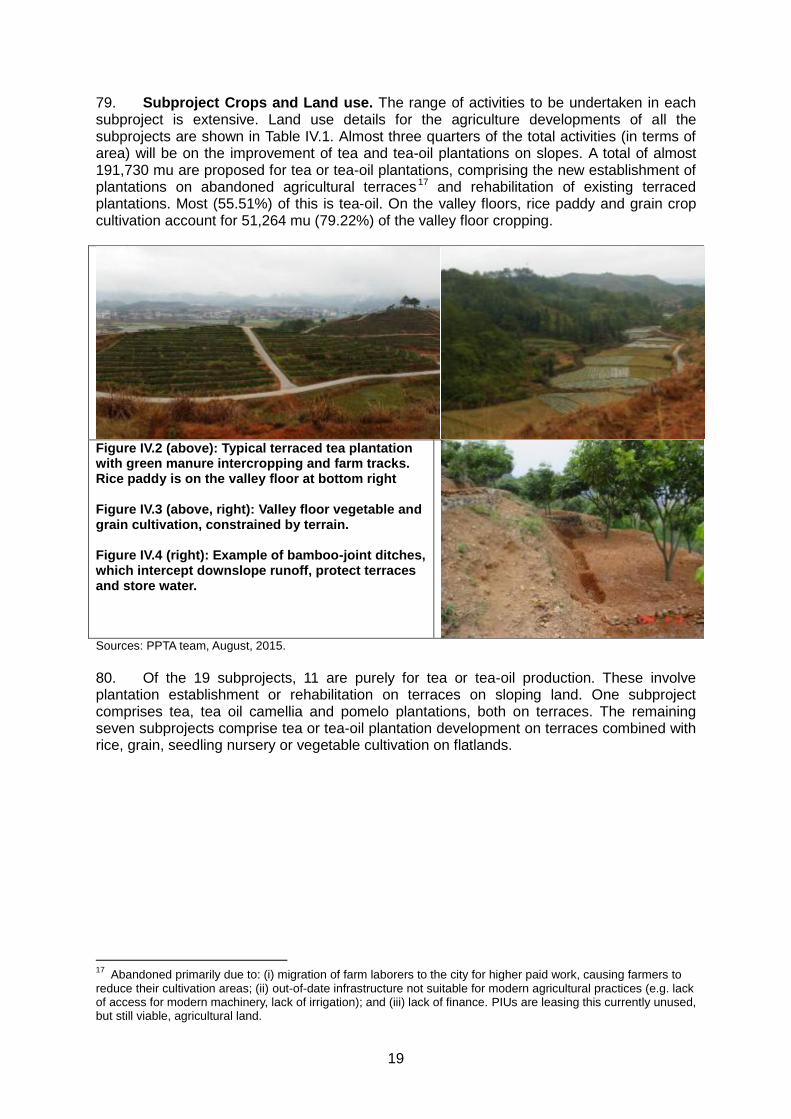
79. Subproject Crops and Land use. The range of activities to be undertaken in each subproject is extensive. Land use details for the agriculture developments of all the subprojects are shown in Table IV.1. Almost three quarters of the total activities (in terms of area) will be on the improvement of tea and tea-oil plantations on slopes. A total of almost 191,730 mu are proposed for tea or tea-oil plantations, comprising the new establishment of plantations on abandoned agricultural terraces 17 and rehabilitation of existing terraced plantations. Most (55.51%) of this is tea-oil. On the valley floors, rice paddy and grain crop cultivation account for 51,264 mu (79.22%) of the valley floor cropping.
Figure IV.2 (above): Typical terraced tea plantation with green manure intercropping and farm tracks. Rice paddy is on the valley floor at bottom right Figure IV.3 (above, right): Valley floor vegetable and grain cultivation, constrained by terrain. Figure IV.4 (right): Example of bamboo-joint ditches, which intercept downslope runoff, protect terraces and store water.
Sources: PPTA team, August, 2015.
80. Of the 19 subprojects, 11 are purely for tea or tea-oil production. These involve plantation establishment or rehabilitation on terraces on sloping land. One subproject comprises tea, tea oil camellia and pomelo plantations, both on terraces. The remaining seven subprojects comprise tea or tea-oil plantation development on terraces combined with rice, grain, seedling nursery or vegetable cultivation on flatlands.
17
Abandoned primarily due to: (i) migration of farm laborers to the city for higher paid work, causing farmers to reduce their cultivation areas; (ii) out-of-date infrastructure not suitable for modern agricultural practices (e.g. lack of access for modern machinery, lack of irrigation); and (iii) lack of finance. PIUs are leasing this currently unused, but still viable, agricultural land.
81. The crop life cycles for the subproject counties have been advised by the PIUs and are set out below for the main perennial plants in the project.
Tea-oil camellia: Embryo opening-time of young seedling (0-5th years, these two stages usually take 5 years). Growth and initial fruiting period (6-10 years) - Full fruit stage (10 –120 years, depending upon species);
Tea: seedling (8-9 months); juvenile (4-5 years); full production (till 25-30 years);
Pomelo: seedling (3 years); growth and fruiting (4-7 years); full production (8+ years)
Seeding planting Growth Harvest Drying
Figure IV.5: Tea Crop Stages
82. Figure IV.5 shows the on-farm activities of tea production covered by the project. On-farm production of tea-oil, pomelo and grain crops covers cultivation, sowing, crop management during growing, harvesting and pre-processing (drying for tea and tea-oil; sorting for pomelos; and threshing and winnowing for grain crops). After this, the produce leaves the farm for processing in processing plants. These are not covered by the project. Processing plants are considered for due diligence as existing associated facilities. 83. Irrigation and drainage. All subprojects include irrigation and drainage infrastructure. The range of components within this category comprise: water sources (weir rehabilitation, pond and water tank construction); pipelines; irrigation canals; pumping stations and sluices; drip irrigation installation; and, interception and drainage ditches. 84. For valley floor components, the irrigation water is mainly diverted from streams, while for the sloping land components, it is mainly collected rain water from site surface runoff. The runoff will be stored in water collecting tanks at different elevations in the tea, tea-oil or pomelo plantations. This can meet the demand for normal crop-growing as well as providing a buffer supply for uneven seasonal rainfall year-to-year (drought). The interception of surface runoff is also an effective anti erosion measure. 85. Various types of irrigation techniques differ in how the water obtained from the source is distributed within the field. In general, the goal is to supply the entire field uniformly with water, so that each plant has the amount of water it needs, neither too much nor too little. The project will mostly adopt furrow and surface irrigation for the valley floor, and for crops and plantations on sloping land, sprinkler and drip irrigation will be adopted. 86. A detailed breakdown of the specififications of the irrigation components for each subproject is at Attachment 2. 87. In-stream Weirs. The Datian Golden Phoenix subproject will refurbish the extraction points (pumps and pipes) at three existing and operating in-stream weirs to provide a collection point to draw off water for the irrigation of 18,000 mu of valley floor cultivation. The Guangze Zhengyuan and Zherong subprojects will refurbish the extraction point (pump and pipes) at one existing and operating in-stream weir to provide irrigation for 361 mu and 500 mu green rice cultivation on valley floor paddy respectively. The weirs will span the entire stream with a height of 1-2 meters. The water will continuously pass over the top, through
22
regularly spaced “gates” during low flow, and over-topping during high flows. Typical weir plan and cross section are at Figure IV.6.
Figure source: domestic FSRs, August, 2015.
Figure IV.6: Plan Drawing and Cross Section of Weir
88. Other farm infrastructure. A total of 692 km of farm tracks for farm machinery and plantation maintenance will be constructed. They will be less than 4 m wide generally. On slopes, they will be contructed as all-weather concrete tracks, with kerb drainage to ensure wheeled vehicles do not cause soil rutting and destabilization of slopes. Almost a million trees and shrubs will be planted as shelterbelts. These will be native species and their location and density will be designed to protect tea gardens from winds and to provide shade against excessive sunlight. An itemized list of the components is in Table IV.2.
Table IV.2: Farm Infrastructure
County Project Implementing Unit
Farm track (km)
Farmland forest network engineering (trees)
<4m >4m Terrace
protection shelter forest
Track Shelter forest
Wuyishan Wuyishan Zhuzi Ecological Agriculture Development Co., Ltd
6.914 14.978
62,500
Guangze Fujian Zhengyuan Ecological Food Town Co., Ltd
9.001
60,000
Datian Fujian Datian County Golden Phoenix Agricultural Development Co., Ltd
204.00
150,000
Youxi
Youxi County Yangzhong Xinkaicheng Urban Construction Co., Ltd
30.59
48,000
Youxi County Shenlang Edible Oil Co., Ltd 24.00
37,400
Ninghua
Ninghua State-owned Ecological Forestry Co., Ltd
79.50
Fujian Ninghua County Ninghua Science and Technology Co., Ltd
89. Embankments. A total of 26.99 km of riverside embankment will be implemented by four subprojects (Wuyishan, Datian, Yongding, Xinluo). The embankments are to support the valley floor farmland irrigation and provide flood protection. They will have a design standard of 1 in 10 year flood recurrence interval in compliance with regulation for domestic high standard basic farmland construction issued by Ministry of Land and Resources, 2011. 90. Farming Technology and Practices. Output 2 will support PIUs and cooperatives through the provision and demonstration of sustainable agricultural practices, introduction of technology, integrated pest management, and soil and water quality testing equipment (Table IV.3). The project will support subprojects obtaining certification for green and organic production.18
Table IV.3: Technology and Sustainable Agricultural Practice in Subproject Design
County or
district
Project
Implementing Unit
Agricultural products
quality testing equipment
Soil testing equipment
Product certification
Inter-planting (mu)
Pest control
Organic produce
Green agricutural
produce
Solar energy insect traps
Sticky insect trap
Other pest
control device
Wuyishan Zhuzi Ecological Agriculture Co., Ltd
8 1 4 5
Guangze Zhengyuan Ecological Food Town Co., Ltd
2 51 2008 (mu) 2 4361 166 133140
Datian Golden Phoenix Agricultural Development Co., Ltd
72 4 1000 (mu) 2 50000 600000 5000
Youxi
Yangzhong Xingkaicheng Urban Construction Co., Ltd
33 4800 (mu) 10198 8 203960 73
Shenlang Edible Oil Co., Ltd
33 1 8018 8 160360 56
Ninghua
State-owned Ecological Forestry Co., Ltd
26500
Ninghua Science and Technology Co., Ltd
2394
Chunhui Tea Co., Ltd 1 69 20724
Cuiyun Tea Co., Ltd 2 2499 14994
Jinxi Tea Co., Ltd
18
Green food is certified, pollution-free, safe, high-quality, nutritious food that is produced according to a specific production mode, and certified by specialized agencies, with applicable green food trademark. Organic food is certified agricultural products and processed products, produced and/or processed according to organic agricultural production requirement and related standards, and certified through legitimate, independent organic food certification organization.
24
Houde Agro-forestry Ecological Co., Ltd
1000 (mu) 3600 5
Yongding Longyu Ecological Industry Development
2 9157 36 71840
Xinluo Greenland Ecological Agriculture Development Co. Ltd
C. Capacity Building 91. FPG seeks to avail itself of the experience and knowledge that can be accessed through the proposed project, to achieve the target of sustainable use of its farmland. The project has been designed with a capacity building component. This has been designed by the Design Institutes in response to their appreciation of fundamental agricultural extension problems and advice from the CPMOs on particular weaknesses in practice applying to each county. The traditional “top-down” approach to agricultural extension will be balanced by PIUs, farmers’ cooperatives, and Farmland Infrastructure Management and Maintenance Associations, which will undertake their own research and determine the extension needs appropriate to their circumstances. 92. Under Project Output 3, each subproject has a capacity building component. This commonly comprises training (for participating farmers and PIU managers), support to farmer cooperatives, establishment of farmland infrastructure management and maintenance associations (Table IV.4), a range of product certifications, purchase of quality testing equipment, and establishment of agricultural information exchange platforms (internet facilities). Subprojects will include: research on irrigation efficiencies and water saving technologies, with the scope and nature of such work to be identified according to their industry types and cultivation models; the setting up of on-farm meteorological stations; study tours; and establishment of pest control and prevention units.
Table IV.4: Farmers Organizations to be Established under the Project
County Project Implementing Unit Farmer
cooperatives formed
FIMMA* formed
Wuyishan Wuyishan Zhuzi Ecological Agriculture Development Co., Ltd 4 1
Guangze Fujian Zhengyuan Ecological Food Town Co., 2
Datian Fujian Datian County Golden Phoenix Agricultural Development Co.,
30
Youxi
Youxi County Yangzhong Xinkaicheng Urban Construction Co., Ltd
*Farmland infrastructure management and maintenance association
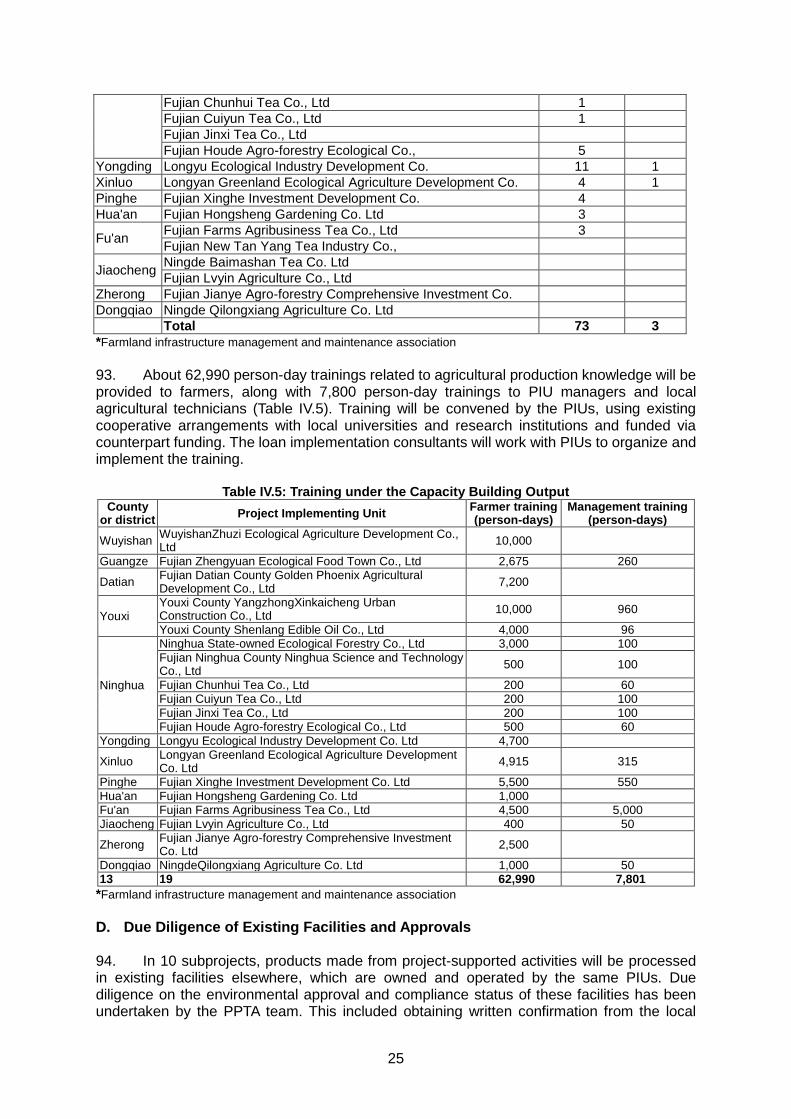
93. About 62,990 person-day trainings related to agricultural production knowledge will be provided to farmers, along with 7,800 person-day trainings to PIU managers and local agricultural technicians (Table IV.5). Training will be convened by the PIUs, using existing cooperative arrangements with local universities and research institutions and funded via counterpart funding. The loan implementation consultants will work with PIUs to organize and implement the training.
Table IV.5: Training under the Capacity Building Output County
or district Project Implementing Unit
Farmer training (person-days)
Management training (person-days)
Wuyishan WuyishanZhuzi Ecological Agriculture Development Co., Ltd
10,000
Guangze Fujian Zhengyuan Ecological Food Town Co., Ltd 2,675 260
Datian Fujian Datian County Golden Phoenix Agricultural Development Co., Ltd
7,200
Youxi Youxi County YangzhongXinkaicheng Urban Construction Co., Ltd
10,000 960
Youxi County Shenlang Edible Oil Co., Ltd 4,000 96
*Farmland infrastructure management and maintenance association
D. Due Diligence of Existing Facilities and Approvals 94. In 10 subprojects, products made from project-supported activities will be processed in existing facilities elsewhere, which are owned and operated by the same PIUs. Due diligence on the environmental approval and compliance status of these facilities has been undertaken by the PPTA team. This included obtaining written confirmation from the local
26
EPBs of environmental approvals of any existing facilities as well as advice on the environmental compliance history of the facilities (Table IV.6). All PIUs have submitted EPB certifications of no fines imposed on any of their operations since their establishment - except for the Wuyishan subproject which is newly established for this project.
Table IV.6: Due Diligence for Existing Processing Facilities
County PIU EIA approval for existing facilities
Approval date
Approval agency
Remarks
Wuyishan Wuyishan Zhuzi Ecological Agriculture Development Co., Ltd
NA NA New established state-owned enterprise
Guangze Fujian Zhengyuan Ecological Food Town Co., Ltd
NA NA New established state-owned company
Datian Fujian Datian County Golden Phoenix Agricultural Development Co., Ltd
Yes 4-Aug-14 Datian County
EPB
Existing standard tea garden with terrce building, irrigation, and drainage ditches
Youxi
Youxi County Yangzhong Xinkaicheng Urban Construction Co., Ltd
NA NA No existing facilities related to this project
Youxi County Shenlang Edible Oil Co., Ltd
Yes 30-May-11 Sanming Municipal
EPB
Camellia seed processing plant
Ninghua
Ninghua State-owned Ecological Forestry Co.,
NA NA No existing facilities related to this project
Fujian Ninghua County Ninghua Science and Technology Co., Ltd
Yes 22-Sep-11 Zherong EPB Yew and tea-oil camellia plantation project
Dongqiao Ningde Qilongxiang Agriculture Co. Ltd
Yes 15-Mar-10 Ningde
Dongqiao District EPB
Tea products processing plant
Source: Data collected from County EPBs. NA = not applicable (no associated facility). EPB = Environmental Protection Bureau.
27
V. DESCRIPTION OF THE ENVIRONMENT (BASELINE DATA)
A. Environmental Setting – Fujian Province
95. Fujian is located in southeast PRC. It is known for its mountains and coastal cities. The province is mostly mountainous. The northwest is higher in altitude. The Wuyi Mountains form the border between Fujian and Jiangxi. It is the most forested provincial level administrative region in the PRC, with a 62.96% forest coverage rate in 2009. The highest point is Huanggang Peak in the Wuyi Mountains (2,157 m). The Min River and its tributaries cut through much of northern and central Fujian. Other rivers include the Jin and Jiulong. 96. Fujian has a subtropical climate, with mild winters. In January the coastal regions average around 7–10°C while the hills average 6–8°C. In the summer, temperatures are high, and the province is threatened by typhoons coming in from the Pacific. Average annual precipitation is 1,400–2,000 mm. 97. Forests cover 52.4% of Fujian's total land area, the highest ratio for a province in the PRC. There are at least 1,943 species of woody plants, including 400 tree species used for timber production and 140 varieties of bamboo. Fujian has 400 million cubic meters of timber reserved, its timber production ranking third in the PRC. The fauna record of Fujian province is incomplete. Current records list 100 species of mammals, 540 species of birds, 115 species of reptiles and 44 species of amphibians. There are also more than 5,000 kinds of insects. Fujian has 16 National Parks, 14 National Geoparks, 30 National Forest Parks, five National Wetland Parks, and one National Fossil Site. 98. Fujian is rich in water resources, and its annual rainfalls totals 201.1 billion cubic meters. More than 500 rivers in the province have their drainage area of over 50 square kilometers each. The total volume of river runoff stands at 115 billion cubic meters a year on average. 99. In 2013, the population was 37.74 million, the 17th most populous province in PRC, of which 39.2% and 61.8% are rural and urban respectively. Male and female ratios are 51.3% and 48.7%. Total land area is 120,146 km2 with an average population density of 304/km2. The ethnic composition is Han (98%), She (1%), and Hui (0.3%). In 2013, the GDP was CNY 2,175.96 billion, averaging CNY 57,856 per capita, about 138% of the national average. GDP composition ratios for the primary, secondary, and tertiary sectors were 8.9%, 52%, and 39.1%, respectively. About 1.38 million hectares (ha) was farmland. On average, each rural person had about 0.058 ha (0.88 mu) of farmland, only about 65% of the national average. Per capita income in rural areas was CNY 11,184 in 2013, 26% higher than the national average (CNY 8,896). 100. Farmland is relatively sparse. Rice is the main crop, supplemented by sweet potatoes and wheat and barley. Fujian is the PRC’s leading province for production of longan and is also a major producer of lychees and tea. B. Environmental Setting – Project Counties 101. Climate. The climatic characteristics favouring quality tea growing are as follows: frequest low cloud and fog conditions with limited direct exposure to sunshine, abundant rainfall (>1,500mm) and high relative humidity in the air, temperatures that rise and fall slowly, and low wind speeds in the lee-sides and valleys of mountains. A summary of climatic characteristics of the project counties is at Table V.1. Datian, Youxi, Yongding and Hua’an are relatively hot and dry, but all are within the range for successful tea plantation agriculture.
102. Topography. The activities of individual PIUs are spread geographically over a number of township areas. This is due to the topographical constraints set by the mountainous terrain of Fujian, where tea is grown on small plots on protected lower slopes and a number of isolated plots make up a single enterprise. Elevation within the project counties ranges from 200 m to almost 2,000 m above sea level. Similarly, valley floor crops are confined to small and discontinuous river valleys. 103. Hydrology. The hydrological pattern of the counties is also determined by the topography. In subproject areas the hydrology comprises small streams, which flow among the many hills in a dendritic pattern. Although cumulatively these stream carry high volumes of water, the individual flow rates are small, and large rivers only form in the central east of the province where the mountains give way to small coastal plains. Waterbodies of the project counties are listed in Table V.2 and their locations are shown in Figure V.1.
Table V.2: River Systems of the Project Area
County Streams within Project Area Sub-tributaries Tributaries Main River
Wuyishan Wufuxi, Gutingxi, Wengduxi Chongyang Stream Jianxi River Minjiang River
Guangze Lifangxi, Zhimaxi Xi Stream Futunxi River
Ninghua Dongixi , Xixi Cuijiang River Shaxi River
Datian Xianfengxi, Hongqixi, Wenjiangxi Jun Stream Youxi River
Jiaocheng, Huotongxi, Qiduxi, Dajinxi, Chixi Jiaoxi River
Zherong Xingrongxi, Dongxi, Xixi,Taokengxi Qianyangxi River
Jiaoxi River
Fu’an Xixi Jiaoxi River
Dongqiao Xietanxi, Huotongxi Jiaoxi River
Hua’an Wenfengxi, Gaojixi, Nanshengxi, Xiaweixi
Huashanxi River Xixi River Jiulongjiang River
Pinghe Huashanxi, Jiufengxi Xixi River Jiulongjiang River
Xinluo, Wenfengxi, Gaojixi, Nanshengxi, Xiaweixi
Shizhongxi, Xiangshanxi
Beixi River Jiulongjiang River
Yongding Gaotouxi, Jiaotangxi, Hongkengxi Jinfengxi River Yongding River Tingjiang River
29
Figure V.1: River Systems of the Project Area
104. Flora and Fauna. Due to its mountainous environment and relatively low level of development Fujian Province is both rich and diverse in its flora and fauna. The Wuyi Mountain Nature Reserve in Wuyishan is a notable specimen base for new species of vertebrates and insects. Datian County has the Daxianfeng Natural Protection Zone located in Xushan Village of Pingshan Township. 105. The natural vegetation in the vegetated parts of the project counties comprises evergreen forest, coniferous forest, mixed broadleaf forest, bamboo forest, regrowth shrublands and grasslands. The natural forests are in the highest, least accessible areas which have not been converted to agriculture. These communities have all been cleared in the past and the current flora is secondary vegetation. Coniferous forest is mainly fir and pine. The Chinese fir (Cunninghamia lanceolata) forest is patchy natural regrowth, and the pine forest (Pinus massoniana) is mainly plantation. The broad-leaved forest is bitter Yung, silk chestnut oak, Cyclobalanopsis and green oak, and the main tree species of mixed broad-leaved forest includes Leucobala, beech mast, and chestnut. The bamboo forest is mainly Phyllostachys pubescens; and shrubland/grassland comprises Adinandra millettii, Pleioblastus amarus, black rice, sesame, fern, kudzu vine, paspalum, wild peanuts, and cogongrass. Regrowth, shrubland and grasslands are common on the margins of slopeland
30
agricultural areas including tea plantations. These areas are vulnerable to expansion of cropping and exploitation of their timber and non-timber resources. 106. The current land cover of the subproject sites is either low-yielding, old tea garden and oil-tea camellia garden, or abandoned agricultural terraces. In all cases, lands bordering the subproject sites are dominated by shrubs and low trees (both natural and exotic), and grass. Figure V.2 shows an abandoned terraced area on a hillside bordered by shrubs and grassland on the side and secondary conifer regrowth on the upper slope and summit.
107. No project counties have coastal areas and no project areas encroach upon wetlands or other coastal features. 108. Fauna. The 52.4% of Fujian’s land area which supports natural forest provides extensive habitat for the 100 species of mammals, 540 species of birds, 115 species of reptiles and 44 species of amphibians recorded. The subproject lands have been selected to exclude all naturally vegetated areas. Field investigation and consultation with locals by the EIA Institutes have found no rare or protected native animal in the subproject areas. The reported animals at the subprojects are mainly animals with habitats adapted to farmland or residential areas. 109. An Inventory of freshwater fish species from the larger river systems in Fujian has been provided by the Freshwater Fisheries Research Institute of Fujian Province. None of the species listed are protected species on the PRC National Fish Protection List (Table V.3).
Table V.3: List of Fish Species from the Larger Rivers
Sources: 1) Study on fish community structure in Sha Stream in Fujian Province; Journal of Fujian Fisheries No.1 March,
2010; The Freshwater Fisheries Research Institute of Fujian Province; Fuzhou, Fujian Province. 2) Study on fish community structure in Futun Stream and Jian Stream; Fujian Fisheries, No.3, 1990; Nanping
Fisheries Technology Extension Station, Nanping City, Fujian Province. 3) Wildlife Status of Youxi County, Fujian Province; http://www.rxyj.org/html/2010/0520/1185465.php 4) The Species Resources in Youxi County and the Protection of Biological diversity; Journal of Fujian Forestry
Sci & Tech, 23(3), 1996; Fujian Province.
110. Erosion and Soil Loss. Fujian Province is part of the red soil region of southern PRC. There are several factors which contribute to the erosion potential of this soil:19 (i) high annual precipitation, and 70% of the rain occurs as heavy rainstorms in April-September, which results in landslides and mud-rock flows; (ii) the substrate (Quaternary red clays and red sandstone) is soft, fragile and easily weathered and the soil derived from them is similarly erodible; and (iii) the soils occur on mountainous and hilly lands with steep slopes. 111. There are 23 key soil erosion counties in Fujian, where land rehabilitation is being pursued by governments. Erosion protection is required for all agricultural developments on sloping land. Seven (Datian, Ninghua, Yongding, Pinghe, Hua’an, Shouning, Fu’an) of the 13 counties in the project are key erosion control counties with more than 5% of their erosion lands classed as moderate, severe or extreme. In Datian, Junxi and Qianping Townships, over 10% of erosion lands in these categories and in Ninghua county Haitu Township and Shibi Town have more than 35%. Table V.4 shows the current soil erosion status in the project counties provided by the Fujian Provincial Soil Erosion Monotoring Station.
19
Liang et al. 2010. Soil erosion changes over the past five decades in the red soil region of Southern China. Journal of Mountain Science 7: 92-99.
32
112. Agricultural Chemical Use. In 2013, total fertilizer and pesticide application in Fujian Province was 4.13 million tons and 57,800 tons respectively,20 with low fertilizer application efficiency (only 30% approximately), and average application of 25.9 kg/mu (4 kg/mu higher than the national average). Along with increased production, overuse of fertilizer and pesticides caused non-point source pollution, soil acidification, reduced soil organic matter, and reduced ability of soils to retain fertility levels. Past approaches to fertilizer application take no account of soil fertility or crop needs and result in fertilizer overuse. 113. Common diseases and pests which are the main threats to crop health and yields are as follows: Tea: pest and disease—Empoasca vitis, Aleurocanthus spiniferus (insects and aphids), mites; Tea blister blight and Anthracnose. Normal applied pesticide: abamectin, Oxymatrine. Tea-oil camellia: pest and disease—Agaricodochium camelliae, Exobasidium gracile, Glomerella cingulate; Euproctis pseudoconspersa Strand, Biston marginata, Curculio Chinensis (insects and aphids). Normal applied pesticide: abamectin, Oxymatrine, 10% ethofenprox, Triazophos emulsifiable concentrates, Bordeaux mixture, Dichlorvos. Rice: pest and disease—Nilaparvata lugens, Cnaphalocrocis medinalis, Thanatephorus cucumeris (insects and aphids). Normal applied pesticide: Chlopyrifos, Triazophos emulsifiable concentrates, Carbendazim. Pomelo: pest and disease—Red spider, Bud tip, Aphidoidea, Anthracnose. Normal applied pesticide: Abamectin, Dichlorvos, Thiophanate-methyl, carbendazim. 114. Physical Cultural Resources. The project counties are rich in physical cultural resources. The Yongding Longyu subproject area is adjacent to the Yongding Tulou (circular earthen structure) protection area which was included in the UNESCO World Heritage List in 2008. The earthen structure is a type of Chinese rural dwelling of the Hakka people in mountainous areas. They were mostly built between the 12th and 20th centuries. This is a heritage site where the structure and fabric of ancient building forms are interwoven with the current community identity and lifestyle of an ethnic minority.
20
Fertilizer use was 1.67 million tons of nitrogenous fertilizer, 0.93 million tons of phosphate fertilizer, 0.55 million tons of potash fertilizer, and 0.98 million tons of compound fertilizer, respectively.
115. The Tulou World Heritage Site has a core heritage zone and a buffer zone (Figure V.3). The Yongding subproject boundary does not encroach on any part of the core or buffer zones. The land separating the subproject from the buffer zone is a ridgetop 200 to 500 m wide and which is forested. The subproject will not impact on the landscape or its scenic backdrop.
Figure V.3: Tulou World Heritage Site and Subproject Map
Source: Yongding Cultural Relic Bureau
116. Wuyishan has many old and historic trees (including Taxus chinensis var. mairei and Phoebe sp.), located in the villages of Wufu Township, and Shibi Town in Ninghua is a centre of Hakka culture. Ninghua County has the Swan Cavern Scenic Area (triple A tourist site) and is also the starting point of the famous Long March undertaken by the Red Army of the Chinese Communist Party in 1934. None of these values are located within the subprojects. 117. Summary of Environmental Setting. The topographic, hydrological, cultural and biological settings of the subproject counties are summarized in Table V.5.
36
Table V.5: Topographic, Hydrological, Cultural and Biological Settings of the Subproject Counties Project County
Project Implementing Unit
Township Topography Hydrology Cultural relics Flora and Fauna
Wufu Town is located in complex various terrain, with deeply dissected valleys and a layer, large water-bearing capacity. It is an intermontane basin hydrogeological area.
The main river in Wufu Town is Wufu Stream, which belongs to Tan stream system of Chongyang Stream. The catchment of the reservoirs from which supply for the subproject will be drawn is 42.09 km
2, with total capacity of 4.456
million m3, and already irrigate an area
of 15,634 mu with a total water supply 123.17 million m
3 per year.
The subproject areas do not encroach upon, or adjoin drinking water source protection areas.
Wufu Town has many old and famous trees located in the villages, which include Taxus Chinensis var. mairei and Phoebe sp. The nearest distance between project site and a protected tree is 485 m. The subproject only involves farmland and tea garden rehabilitation, will not have adverse impact to the trees in villages.
The Wuyi Mountain Nature Reserve is a specimen base for new species of vertebrates and insects. However there are no natural reserves and other key wildlife preserve areas near the subproject site. The project does not encroach on any naturally vegetated areas. Agricultural crops are the main flora in the subproject area, which include rice, lotus, tobacco, and mushroom. Animals reported in the subproject vicinity are limited to common snakes, frogs and birds.
Guangze Fujian Zhengyuan Ecological Food Town Co., Ltd
Zhima Town Guangze County is located in the northwest mountains of Fujian, with elevation ranging from 1,930 m to 215 m. The county belongs to intermontane basin extended from northeast to southwest, surrounded by rolling hills. The terrain in the northeast is the highest.
The project area is mainly in the Xi Creak Water system which is fed by Zhima Creak and Lifang Creak at Hangzhou Town, The watershed area of Guangze County is 848.76 km
2. No drinking water source
protection areas are on or adjoin the subproject
The subproject sites do not encroach upon or adjoin any cultural relics, places, or any other protected areas.
The native flora of the area has been destroyed and the existing flora is secondary vegetation of coniferous forest, broad-leaved forest, mixed forest, bamboo thicket, shrub grass, gardens, and agricultural vegetation. The project does not encroach on any naturally vegetated areas, ecological or environmentally sensitive areas or habitats of rare or endangered species.
Zhaili Town
Siqian Township
Luanfeng Township
Lifang Township
Huaqiao Township
Datian
Fujian Datian County Golden Phoenix Agricultural Development Co., Ltd
Pingshan Township
Datian County is located on the west side of Daiyun Mountain, which belongs to the mountainous subalpine zone with a terrain which slopes from the east, west and south towards the center.
Datian County is one of the origins of Min River, Jiulong River and Jin River and has 25 rivers with a total catchment area of more than 30 km
2. The main
rivers include Jun Stream, Wenjiang Stream, Taoyuan Stream, Guangtang Stream and Shangjing Stream. Jun Stream is the largest river with an average flow rate of 115 m
3/h and is the
main source of water for Jiemian Reservoir Hydropower Station. The average annual runoff of surface water in the county is 1.984 billion m
3 while the
total reserve of ground water is 354 million m
3.
Heyang Village and Yangchun Village in Wushan Township is within Datian County drinking water source protection area, no contruction activities can be conducted in these villages except tree planting
The subproject sites do not encroach upon or adjoin any cultural relics, places, or any other protected areas.
The county is located in the “Central Subtropical Laurilignosa vegetation zone in the humid forest area of East China” and belongs to the evergreen Castanopsis/ Lauracaea subzone There are 10 species of recorded wild mammals, 59 species of birds, 19 species of reptiles, 16 species of amphibians and 11 species of fish. Daxianfeng Natural Protection Zone is located in Xushan Village of Pingshan Township, with a total land area of 6893 ha, including 1848 ha core protection area. No subproject lands are within or adjoin the core or buffer areas. The project does not encroach on any naturally vegetated areas, ecological or environmentally sensitive areas or habitats of rare or endangered species.
Wushan Township
Jiyang Towship
Junxi Town
Wuling Township
Huaxing Township
Qianping Township
Xieyang Township
Taoyuan Town
Dongfeng Farm
Shangjing Town
37
Project County
Project Implementing Unit
Township Topography Hydrology Cultural relics Flora and Fauna
Shipai Town
Youxi
Youxi County Yangzhong Xinkaicheng Urban Construction Co.,
Yangzhong Town
Youxi County features hilly landscape, with Daiyun mountain range in the southeast, and the Daimao mountain range in the west and the northwest. It is located within the Zhenghe—Dapu and Gutian—Qinxi fault zones. It is a hilly basin high in the east and the west and low in the centre.
Multiple rives and streams are distributed in Youxi County, of which there are 81 rivers with larger than 10 km
2 catchment area. The main streams
include You Stream, Xinling Stream, Gaozhou Stream and Houting Stream, which all belong to the Minjiang River system
The subproject sites do not encroach upon or adjoin any cultural relics, places, or any other protected areas.
The subproject area currently supports low yield tea and tea-oil plantations. It is bordered by regrowth shrubland, weeds and grasses of abandoned agricultural lands. The project does not encroach on any naturally vegetated areas, ecological or environmentally sensitive areas or habitats of rare or endangered species.
Youxi County Shenlang Edible Oil Co., Ltd
Yangzhong Town
Chengguan Town
Zhongxian Township
Ninghua
Ninghua State-owned Ecological Forestry Co., Ltd
Huaitu Township
Ninghua County is located in south section of Wuyishan eastern mountain area. Low mountains, hills and basins cover 96% of the land area.
Ninghua County is the origin of the Minjiang River. There are many small streams in the subproject area that flow radially to the neighboring counties. The branches and gullies of streams form networks of streams with short lengths. The total catchment area is 2197 km
2.
The subproject areas do not encroach upon, or adjoin drinking water source protection areas.
The town of Shibi of Ninghua is well known as the cradle of the Hakka. Ninghua is also marked as the starting place of the famous massive Long March undertaken by the Red Army of the Chinese Communist Party in 1934. The nearest project sites are about 5km (straight line distance) from the scenic swan caverns and it will not be influenced by this project.
Naturally vegetated area of the county is 1,860 km2, about 78% of the total land area. The main vegetation types are: evergreen broad-leaved forest, coniferous forest, moso bamboo, secondary coniferous and broad-leaved mixed forest, and shrub forest, The subproject area currently supports low yield tea and tea-oil plantations. It is bordered by regrowth shrubland, weeds and grasses of abandoned agricultural lands. The project does not encroach on any naturally vegetated areas, ecological or environmentally sensitive areas or habitats of rare or endangered species.
Shibi Town
Fujian Ninghua County Ninghua Science and Technology Co., Ltd
Huaitu Township
Shibi Town
Fujian Chunhui Tea Co., Ltd
Chengjiao Township
Zhongsha Township
Hucun Town
Fujian Cuiyun Tea Co., Ltd
Zhongsha Township
Chengjiao Township
Fujian Jinxi Tea Co., Ltd
Zhongsha Township
Fujian Houde Agro-forestry Ecological Co., Ltd
Shibi Town
Caofang Township
Yongding
Longyu Ecological Industry Development Co. Ltd
Guzhu Township
The main landforms in the subproject area are valley basins with average elevations of 200-400 m in Guzhu and Hukeng 400-600 m in Gaotou
Yongding County has four rivers, namely Yongding River, Jinfeng Stream, Huangtan River, Tingjiang River. The project is located in upstream of Jinfeng Stream in the Tingjiang Water System. The subproject areas do not encroach upon, or adjoin drinking water source
The Yongding Tulou (circular earthen structure) protection area which was included in the UNESCO World Heritage List in 2008. The earthen structure is a type of Chinese rural dwelling of
The natural vegetation of the Guzhu, Hukeng and Gaotou townships is regrowth forest comprising coniferous forest, evergreen broadleaf forest, bamboo forest, secondary bush and grass. There are many plantations of fir and pine. Existing agriculture includes oil-tea camellia,
Hukeng Town
38
Project County
Project Implementing Unit
Township Topography Hydrology Cultural relics Flora and Fauna
Gaotou Township
protection areas. the Hakka people in mountainous areas. At its closest point, the planned tea garden establishment is 500m from the heritage site.
tung tree, tea, Chinese chestnut, persimmon, pears, peaches, plums, oranges and banana – all on lower slopes. The project does not encroach on any naturally vegetated areas, ecological or environmentally sensitive areas or habitats of rare or endangered species.
Xinluo
Longyan Greenland Ecological Agriculture Development Co. Ltd
Shizhong Town
Shizhong Town belongs to Yangdong - Shizhong - Renhe Basin, with length from south to north of 11 km, and 0.3 -1.5 km width from east to west. The total area is 9 km
2, The average elevation
is 650 m, sloping north to south.
Shizhong Town is the source of the Jiulong River and Ting River. The main waterbodies in the subproject area are Shizhong Stream, Xiangshan Stream, Xiao Stream and Yingkeng Stream. The subproject areas do not encroach upon, or adjoin drinking water source protection areas.
The subproject sites do not encroach upon or adjoin any cultural relics, places, or any other protected areas.
The natural vegetation includes fir, pine, bamboo, and mixed conifer/broadleaf forest. The project does not encroach on any naturally vegetated areas, ecological or environmentally sensitive areas or habitats of rare or endangered species.
Pinghe
Fujian Xinghe Investment Development Co. Ltd
Jiufeng Town Pinghe County is located in high terrain in territory lying tilted to the east, west, and south. Shuangjian Mountain and Daqin Mountain divide the county into two major departments in the southeast and northwest.
The main river in Pinghe is Huashan Stream ('Xiao Stream') with Wenfeng stream, Gaoji stream, Nansheng stream, Xiawei stream as tributaries. The catchment area is 857.3 km
2.
The subproject areas do not encroach upon, or adjoin drinking water source protection areas.
The subproject sites do not encroach upon or adjoin any cultural relics, places, or any other protected areas.
The flora of the county belonged to the south subtropical wet forest classification. Due to pasthuman activities, the primary forests have been destroyed, and the areas mainly used for planting crops, pomelo, and tea. The only natural flora are secondary forests There are no areas of national or provincial protection for wildlife and ecology in the vicinity of the subproject.
Qiling Township
Xiaoxi Town
Banzai Town
Hua'an Fujian Hongsheng Gardening Co. Ltd
Huafeng Town
The landform of Huafeng Town is a typical river basin with a west-east width of 20 km and north-south length of 33 km. The altitude of Shimasijian is 1146 m and is the highest mountain. The lowest point is at the Dagong Mountain with an altitude of 60 m. Lateritic soil is the main soil in the area.
Hua'an county is located in the south of Fujian Province, and the middle reaches of Jiulong River. Jiulong River is the second longest river in Fujian province with a drainage area of 14081 km
2. The
total length of Jiulong River is 1923 km, and the length of the main reach is 285 km. The subproject areas do not encroach upon, or adjoin drinking water source protection areas.
The subproject sites do not encroach upon or adjoin any cultural relics, places, or any other protected areas.
The naturally vegetated areas of Hua’an county are south subtropical wet forests. The project does not encroach on any naturally vegetated areas, ecological or environmentally sensitive areas or habitats of rare or endangered species.
Makeng Township
Changqiao Town
Fu'an Fu'an Farms Agro-business Tea Co., Ltd
Songluo Towship
Fu'an county incorporates the ranges of Jiufeng Mountain, Tailao Mountain and Donggong Mountain. The mountain ranges strike roughly northeast - southwest.
Fu'an is located on the eastern (left) bank of Jiao Stream, the main tributary of the Baima River. The subproject areas do not encroach upon, or adjoin drinking water source protection areas.
The subproject sites do not encroach upon or adjoin any cultural relics, places, or any other protected areas.
The DEIA has concentrated its description on the subproject site only, describing it as devoid of native animal resources with only common farmland rodents and birds such as voles, rats, weasels, magpies and tits. The project does not encroach on any naturally vegetated areas, ecological or environmentally sensitive areas or habitats of
Township Topography Hydrology Cultural relics Flora and Fauna
rare or endangered species.
Jiaocheng Fujian Lvyin Agriculture Co., Ltd
Badu Town
Jiaocheng is located in the foothill of Jiufeng Mountains, with a sea cost. It lays descending trend from west to east
Qidu Stream, located in Jiaocheng, originates from Hubei Township, with 333.5 km
2 of total catchment area and
length of 58 km
Zhiti Mountain in Jiaocheng County is a provincial level scenic spot, and the Huayan Temple at the top of Mountain is a national key temple. Huotong Mountain is recognised as the origin of Taoism. The subproject sites do not encroach upon or adjoin any cultural relics, places, or any other protected areas.
Typical natural vegetation types are: evergreen coniferous forests, shrub, evergreen broadleaf forest, mixed forest, bamboo forest, grassland. The project does not encroach on any naturally vegetated areas, ecological or environmentally sensitive areas or habitats of rare or endangered species.
Zherong is located in the northeast of Fujian. It has mountainous terrain, with a strike direction of southeast to northwest. It has an average elevation of 600 m. The mountain area covers 510 km
2, which is about 94.6% of
the county land area.
Main streams are Xinrong Stream, Dong Stream, Xi Stream, Taokeng Stream. Xinrong Stream has the largest catchment area (10,600 ha)
The subproject sites do not encroach upon or adjoin any cultural relics, places, or any other protected areas.
The subproject site is low-yielding old tea garden and oil-tea camellia garden, surrounded by shrub and grass. The main animal are rats, and common birds. No rare flora or fauna species have been identified. There are no areas of national or provincial protection for wildlife and ecology in the vicinity of the subproject.
Huangbai Township
Zhayang Township
Dongqiao Ningde Qilongxiang Agriculture Co. Ltd
Shihou Township in Jiaocheng
Jiaocheng is located in the foothill of Jiufeng Mountains, east of the sea. Elevation has a descending trend from west to east
The main river flowing through the subproject area is Xietan Stream, which is the upstream reach of Jiao Stream, and Huotong Stream. The subproject areas do not encroach upon, or adjoin drinking water source protection areas.
The subproject sites do not encroach upon or adjoin any cultural relics, places, or any other protected areas.
Typical natural vegetation types: evergreen coniferous forests, shrub, evergreen broadleaf forest, mixed forest, bamboo forest, grassland. The project does not encroach on any naturally vegetated areas, ecological or environmentally sensitive areas or habitats of rare or endangered species.
Wuqu Town in Shouning
Zhongshan Mountain, located in the northwest of the county, has the highest elevation of 1649m. Elevation of the remainder of the county is in the range 400 m - 800 m ASL.
Xietan Stream, the upstream of Jiao Stream, with a length of 56.5 km and 449.9 km
2 catchment area. The tributary
includes Chang Stream, Jiuling Stream, Shibaqu. There are more than 1,700 streams and streams in the County, of which, 5 rivers with larger than 100 km
2
of catchment area, the annual average runoff is 1.78 billion m
3.
The subproject sites do not encroach upon or adjoin any cultural relics, places, or any other protected areas.
Natural vegetation in the county comprises evergreen forest, coniferous forest, evergreen broadleaf forest, bamboo forest, secondary bush and grass. The subproject site supports oil-tea camellia, tung tree, tea, Chinese chestnut, persimmon, pears, peaches, plums, oranges and bananas. There are no areas of national or provincial protection for wildlife and ecology in the vicinity of the subproject.
Source: FSRs and Subproject EIA Tables.
40
C. Environmental Baseline at Project Sites 118. Environmental baseline values for water quality and soil quality at all subproject sites were recorded by the EIA Institutes for the DEIAs using a sampling program to indicate compliance with relevant national standards. These are Surface Water Quality Standard (GB3838-2002) and Soil Environmental Quality Standard (GB15618-1995). 119. The closest waterbodies to the subprojects in all but Datian and Dongqiao counties comply with Class III standard of GB3838-2002, which means that the water is suitable for water source protection for centralized drinking water supply, sanctuaries for common species of fish, and swimming zones. At Dongqiao, the water quality at the subproject site is Class IV and is suitable for general industrial water supply and recreational waters in which there is not direct human contact with the water. At Datian, the water quality is Class V and suitable only for agricultural irrigation and livestock. Sampling results are in Table V.6 and the sampling and analysis details (sampling times, location and laboratory) are in Attachment 3. Local environmental monitoring stations had differing capabilities in the range of parameters they could analyse. The external monitoring of water quality required by the EMP has been adjusted to be compatible with these capabilities. 120. Only one component of one subproject uses groundwater (Fujian Zhengyuan Ecological Food Town Co in Guangze County). The groundwater quality at this locality was sampled on 28 March 2014 and complies with Grade III standard of the Groundwater Quality (GB/T 14848-1993). 121. Soil quality was sampled at the subproject sites. Particular attention was paid to subprojects with valley floor cropping components, since these lands are subject to flooding and sediment deposition from upstream. Where only upper slope tea gardens were on in-situ soils, without the possibility of pollution from activities on higher slopes, soil sampling was not necessary. All soils sampled meet the Grade II standard of Soil Environmental Quality Standard (GB15618-1995), which indicates good quality soil for agriculture without significant contaminants. Sampling results are in Table V.7 and the sampling and analysis details are in Attachment 3. Local environmental monitoring stations had differing capabilities in the range of parameters they could analyse. The external monitoring of soil quality required by the EMP has been adjusted to be compatible with these capabilities. 122. Air quality and noise environment were not sampled. The project sites are in remote mountainous and high valley locations which are agricultural settings without significant urbanization or industrial development. The DEIAs reviewed existing county EPB data, which showed that all sites comply with Class II of GB3095-2012 for air quality, which is the standard for residential and rural areas, and ambient noise levels at all sites meet Grade II of GB3096-2008, which is the standard for residential and commercial areas.
Table V.6a: Water Quality Sampling Results
Project Implementing Unit pH DO CODMn CODC
r BOD5 NH3-N TP TN
Fecal coliform
Sulfate
Wuyishan Zhuzi Ecological Agriculture Co., Ltd
6.86-6.93 - -
14-16 2.7-3.0 0.184-0.242
0.06-0.09
- 2200- 2400
-
6.80-6.85 - -
14-17 2.7-3.2 0.191-0.236
0.07-0.10
- 2800- 3100
-
6.83-6.89 - -
16-19 3.3-3.6 0.234-0.288
0.08-0.09
- 3100- 3500
-
6.91-6.97 - -
12-13 2.3-2.6 - - - 940-
1100 -
6.92-7.01 - -
14-16 2.7-3.3 - - - 1400-
1800 -
Fujian Zhengyuan Ecological Food Town Co., Ltd
6.74 7.21 3.74 10.0 0.9 0.23 0.033 0.26 1800 -
6.63 7.1 3.12 14.4 1.76 0.577 0.177 0.737 5400 -
41
Project Implementing Unit pH DO CODMn CODC
r BOD5 NH3-N TP TN Fecal
coliform Sulfate
Fujian Datian County Golden Phoenix Agricultural Development Co., Ltd
7.12 7.7 1.4 12 1.1 0.074 0.014 0.09 1300 0.79
7.23 9.5 2.2 12 1.4 0.025 0.032 0.23 130 0.55
6.91 9.3 0.5 5 0.3 0.064 0.019 0.3 50 0.18
6.85 8.8 0.5 5 0.3 0.025 0.04 0.28 50 0.18
7.14 10.3 3.7 10 1.1 0.103 0.04 0.23 330 0.51
6.87 9.2 1.8 5 0.5 0.067 0.027 0.26 9200 5.08
Youxi County Yangzhong Xinkaicheng Urban Construction Co., Ltd
D. Socio-economic and Resources Setting of Project 123. In 2013, the GDP of Fujian Province was CNY 2,175.96 billion, averaging CNY 57,856 per capita, about 138% of the national average (CNY 41,908). GDP composition ratios for the primary, secondary, and tertiary sectors were 8.9%, 52.0%, and 39.1%, respectively. There were 1.38 million hectares (ha) of farmland. On average, each rural person had about 0.058 ha (0.88 mu) of farmland, which was only about 65% of the national average. Income in rural areas was CNY 11,184 per capita in 2013, which was 26% higher than the national average (CNY 8,896). For urban residents, the average income was CNY 30,816 per capita, which was about 11% higher than the national average (CNY 26,955). Table V.8 provides summary economic information for Fujian Province. Like most other provinces, Fujian has experienced rapid economic growth over the past two decades.
Table V.8: Basic Socio-economic Conditions in Fujian Province (2013) Economic Indicators Fujian PRC Fujian as % of PRC
Total Population (million) 37.74 1,360.72 2.77
Total Rural Population (million) 22.93 629.61 3.64
Total Urban Population (million) 14.81 731.11 2.03
Total GDP (billion CNY) 2,175.96 58,801.88 3.70
Per Capita GDP (CNY) 57,856 43,320 133.55
GDP In Agriculture Sector (billion CNY) 193.66 5,532.17 3.50
GDP Industrial Sector (billion CNY) 1,131.5 25,681.00 4.41
GDP In Tertiary Sector (billion CNY) 850.8 27,588.70 3.08
Total Farmland (million ha) 1.38 121.72 1.13
Irrigated Farmland (million ha) 1.17 63.47 1.84
Per Capita Farmland (Mu) 0.88 1.35 65.19
Per Capita Income In Rural Area (CNY) 11,184 8,896 125.72
Per Capita Income In Urban Area (CNY) 30,816 26,959 114.31 Source: China and Fujian Statistical Yearbooks 2014
124. Administrative areas. The project will cover 13 counties from 5 municipalities. It has a total land area of 25,283 km2 with a population of 4.64 million by the end of 2013. Five of the 13 counties (Guangzhe, Pinghe, Ninghua, Shouning, Zherong) are provincial level poverty counties. There are 212 township-level units in these 13 counties, and 3,262 administrative villages (Table V.9).
Table V.9: Administrative Units in 13 Project Counties
Items Project Counties Fujian Province
Number of Municipalities 5 9
Number of County 8 45
Number of County-Level Cities 3 14
Number of Districts 2 26
Number of Towns or townships 212 929
Number of Villages 3,262 14,429 Source: Relevant county statistical yearbook 2014, and Fujian Statistical Yearbooks 2014.
44
125. Population. In the 13 project counties, the total population was 4.64 million in 2013, about 12.29% of Fujian Province (Table V.10). The total land area of 13 project counties was 20,428 km2. As a result, the average population density was 135/km2, which was significantly lower than provincial average. The ratio of urban population in project counties was 31%, which was significantly lower than the Fujian provincial average (39%).
Table V.10: Basic Demographic Profile of the Project Counties, 2013 (unit: 10,000; %)
County Total
Population Urban
Population % of Urban Population
Rural Population
Males Females
Wuyishan 16.22 3.84 24% 12.38 8.46 7.76
Guangzhe 23.03 5.73 25% 17.3 12.35 10.68
Datian 37.35 9.06 24% 28.29 20.01 17.34
Youxi 60.11 15.92 26% 44.18 32 28.1
Ninghua 36.96 6 16% 30.96 19.34 17.62
Yongding 49.2 10.36 21% 38.84 25.58 23.62
Xinluo 49.78 33.44 67% 16.34 25.08 24.7
Pinghe 16.6 5.69 34% 10.91 8.59 8
Huaan 23.48 8.14 35% 15.33 11.99 11.49
Fuan 66.29 19.56 30% 46.73 34.92 31.37
Jiaocheng 47.02 15.19 32% 31.83 24.19 22.83
Zherong 10.74 3.17 30% 7.58 5.65 5.09
Shouning 26.98 5.74 21% 21.24 14.31 12.66
Total 463.76 141.84 31% 321.91 242.47 221.26
Fujian 3,774 1481 39% 2,293 1,870.92 1,762.73
As %Fujian 12.29% 9.58%
14.04% 12.96% 12.55% Source: Relevant County Statistical Yearbook and Fujian Statistical Yearbook for 2014.
126. The 13 project counties had a total GDP of CNY213.36 billion in 2013, or CNY46,008 per capita (86.27% of the provincial average; CNY57,856) (Table V.11). The proportion of the agriculture sector in the economy was 16.4% in the project counties, higher than the provincial average (8.9%). The proportion of the secondary sector (industrial and building sector) was 51.5% in project counties, lower than the provincial average (52%). The proportion of the tertiary sector (32.0%) was lower than the provincial average (39.1%).
Table V.11: Economic Performance in the Project Area (2013) (100 million, CNY)
Project County
GDP
(CNY x 10^8)
Primary Sector Secondary Sector Tertiary Sector Per Capita GDP
127. Poverty. Poverty levels in the subproject township vary significantly, from1.4% of the population in the project townships of Fu’an County to 28.5% in Guangze. The highest
45
poverty areas are in Guangze, Ninghua, Yongding and Hua’an counties. At the end of 2011, the official poverty line in PRC was 2,300 CNY/year (Table V.12).
Table V.12: Poverty Levels in Project Areas
County Townships Villages Poverty population % Poverty Population of
Total Population
Wuyishan 1 9 463 3.6
Guangze 6 16 3262 28.5
Datian 12 19 557 1.9
Youxi 4 8 465 2.2
Ninghua 6 22 3702 9.2
Yongding 3 6 817 6.4
Xinluo 1 6 1171 4.3
Pinghe 4 5 506 3.1
Hua'an 2 3 391 7.3
Fu'an 2 3 45 1.4
Jiaocheng 4 26 559 1.7
Zherong 3 6 220 4.7
Dongqiao 4 5 80 1.8
Total 52 134 12238 Source: Relevant County Statistical Yearbook and Fujian Statistical Yearbook for 2014.
128. Agriculture. Provincial gross agricultural output value in 2013 was CNY317 billion, with crops accounting for 43%, fishery products 31%, animal husbandry 16%, and forest products 9%. Gross agricultural output value of the project counties was CNY57.47 billion, including 54.6% for crops and 12.5% for forest products (Table V.13). The main agricultural products of the project counties included grain, oil seeds, sugar cane, tea, and fruit.
Table V.13: Main Agricultural Products in Project Counties (2013) (ton)
Source: Fujian Statistical Yearbook, 2014 and county statistical yearbooks, 2014. 129. Services. All of the villages involved in project activities have access to basic existing infrastructure including roads. However, some villagers have difficulty to access tap water and no villages have access to a sewerage system. Some villages only have access to well water or piped water to the house (Table V.14).
46
Table V.14: Project Villages with Access to Services
% of Access to electricity
% of Access to tap water
% of Access to village clinic
% of Access to village school
% of Access to road
% access to wastewater
drainage system
100 80 100 100 100 0
Source: Village Leader Interviews and FGDs, 2015.
130. The project will improve the handling and disposal of plastic agricultural film (mulch) and packaging from fertilizer and pesticides. A provincial system of solid waste handling at the village level (collection and disposal) was established in Fujian Province in 2009. Trash bins are provided at each village, transportation vehicles are provided at each township and landfills have been constructed and are operated in each county. Villages are responsible for collection, townships are responsible for transportation and the counties are responsible for solid waste treatment. For any plastic film that is not biodegradable or included in existing government sponsored recycling programs, the PPEs will hire farmers to collect the agricultural plastic film and transport it to the village trash bin and then finally transported to county landfill. 131. The proposed project will be carried out in 12 villages. There are 57,773 households and 227,788 in these villages, which account for 12.04% of total population in 51 project towns, and 4.6% in 13 project counties. Among total population, 55% are labors, with female labors accounting for 45%. The average land holding is 1.08 mu, and poverty ratio is 3.3%.
47
VI. ANTICIPATED ENVIRONMENTAL IMPACTS AND MITIGATION MEASURES 132. This section assesses the potential for beneficial and/or adverse environmental impacts during the project construction and operational phases, and the mitigation measures to be implemented during detailed design, pre-construction, construction, and operation. A. Project Benefits 133. Water and soil erosion control. In four subproject areas (Datian, Junxi and Qianping Townships) more than 10% of erosion lands are classed as moderate, severe or extreme, and in one county (Ninghua), Haitu and Shibi towns have more than 35%. The project will support land rehabilitation and soil erosion control practices for all subprojects, including the application of intercropping, non- or minimum tillage, and bamboo-joint ditches. The target of these improvements is to further reduce the levels of severe and moderate soil erosion in subproject sites, transforming them to light or allowable levels of erosion. 134. Sustainable use of water. The sustainable use of water has been affirmed by the analyses of seasonal water availability and water demand using normal year, dry year (P=90%) and extremely dry year (P=95%) scenarios for all subprojects. All tea and tea oil components of subprojects will harvest site runoff rainwater. This will ensure that local water resources are not depleted (since 75-99% of site runoff will return to the local waterbodies. Subprojects with valley floor cropping components will augment on-site runoff supplies with extraction from local streams. Irrigation technologies comprise sprinkle and trickle (drip) irrigation which allow real time control of water application. 135. Infrustructure improvement and management. The project will rehabilitate farm infrastructure, such as farm tracks, irrigation facilties (including weir rehabilitation), and stream embankment construction for farmland protection. Furthermore, the project will promote good management of the constructed infrastructure. Farmland infrastructure management and maintenance associations will be established and piloted. 136. Chemical fertilizer and pesticide application reduction. Currently the approach to fertilizer application takes no account of soil fertility or crop needs and results in fertilizer overuse, and non-point source pollution, soil acidification, reduced soil organic matter and reduced long term fertility. The project will promote balanced fertilizer application and commercial organic fertilizer use. 137. The project will apply integrated pest management (IPM), in combination with insect trapping devices and insect killing lamps. This will complement the newly released central and provincial regulations on the PRC Action Plan for Reaching Zero Growth of Fertilizer and Pesticide Application till 2020. Under this plan, a comprehensive recommendation of pesticide applications for project-related agricultural crops has been prepared by the provincial Department of Agriculture (Attachment 4). 138. Support to farmer groups. The project will develop and support about 73 farmer cooperatives. These will coordinate the relationship between farmers and project enterprises to improve communication and provide year-to-year certainty to farmers. Coordinated and collective action to obtain higher market competitiveness and negotiation status will ensure that benefits accrue to the farmers groups and individually to farmers. 139. Training farmers and project-related entities. The PIUs will organize traning of project-related farmers and their own staff, including technical guidance for modern agricultural farming and sustainable farming production (Table IV.4). The PIUs will receive trainings from CPMOs to improve project management expertise (including financial management, and procurement).
48
140. Overall improved project design and integration with safeguards to avoid and minimize impacts. The project benefits described here have been planned through close coordination between the government, design institutes and PPTA team to strengthen subproject design, construction, and operations. Key design elements included: (i) soil structure improvement; (ii) water conservation and soil erosion control; (iii) balanced fertilization; (iv) use of organic fertilizer; (v) integrated pest management;21 (vi) intercropping; and (vii) reduced plastic pollution, through the use of biodegradable plastic polymers. 141. Environmentally friendly cultivation and processing systems to enable “green” food, and organic food certification are part of the project, as well as demonstration of new varieties of crops, and seedling nurseries (Table VI.1).
Table VI.1: Subproject Features Contributing to Sustainable Agriculture
County Project Implementing Units S
oil
Im
pro
ve
men
t fo
r
Wa
ter
an
d S
oil
Ero
sio
n
Co
ntr
ol
Ba
lan
ced
Fe
rtil
iza
tio
n
Org
an
ic F
ert
iliz
se
r
Pe
st
Pre
ven
tio
n a
nd
Co
ntr
ol
Dem
on
str
ati
on
of
New
Va
rie
ty o
f C
rop
s
Se
ed
lin
g n
urs
ery
Gre
en
fo
od
Org
an
ic f
oo
d
Inte
rcro
op
ing
Wuyishan Wuyishan Zhuzi Ecological Agriculture
Development Co., Ltd √ √ √
√ √ √
Guangze Fujian Zhengyuan Ecological Food Town
Co., Ltd √ √ √ √ √ √ √
Datian Fujian Datian County Golden Phoenix
Agricultural Development Co., Ltd √ √ √ √ √ √ √
Youxi
Youxi County Yangzhong Xinkaicheng Urban Construction Co., Ltd
√ √ √ √ √
Youxi County Shenlang Edible Oil Co., Ltd
√ √ √ √ √ √
Ninghua
Ninghua State-owned Ecological Forestry Co., Ltd
√ √ √ √ √
Fujian Ninghua County Ninghua Science and Technology Co., Ltd
Integrated Pest Management (IPM) programs use comprehensive information on the life cycles of pests and their interaction with the environment. This information, in combination with available pest control methods, is used to manage pest damage by the most economical means, and with the least possible hazard to people, property, and the environment. IPM is not a single pest control method, but series of pest management evaluations, decisions, and controls.
49
B. Project Benificiaries 142. The increased productivity of the subprojects will result in increased farmer revenue from sale of products or increased employment opportunities. The project will directly benefit a large number of farming families involved in the PIUs as participating farmers or as farm labour (Table VI.1).
Table VI. 1: Project Beneficiaries
Municipality County Households Population Women Poverty people*
Nanping Wuyishan 3195 13031 3643 463
Guangze 5619 23309 5906 862
Sanming
Datian 7740 29566 6431 892
Youxi 5495 20794 5418 507
Ninghua 11120 49376 11976 1972
Longyan Yongding 3746 12825 3255 503
Xinluo 7952 27109 5146 704
Zhangzhou Pinghe 7305 29770 8386 923
Hua'an 1406 5355 1229 208
Ningde
Fu'an 1350 5244 1087 169
Jiaocheng 791 3160 823 98
Zherong 982 3897 1068 242
Dongqiao 1072 4353 1238 198
Totals 57773 227789 55606 7741
* At the end of 2011, the official poverty line in PRC was 2,300 CNY/year.
143. Non-project farmers. The project will promote cooperation between the enterprises and farmers, which will improve farmers' competitiveness in the market through production standardization, product safety guarantees, and product quality improvement. This will increase incomes of participating farmers. The project Poverty and Social Analysis and Action Plan notes that such changes may cause concerns from surrounding non-project farmers. To prevent conflicts, the social action plan requires that CPMOs and PIUs will introduce project details to non-project households and encourage them to accept the project enterprise cooperation model and participate in the project through new planting techniques and sale of farm produce. For those non-project farmers who do not want to participate, CPMOs and PIUs will provide the same training and technical support to them, including IPM and use of organic fertilizer, so that they could also benefit from project activities. C. Subproject Screening and Assessment Scoping 144. PPMO’s main focus on selection criteria relates to: (i) meeting essential requirements for government supporting policies in the midwest of the PRC; (ii) continuing to focus on, and involve, key soil erosion-prone counties, and poverty alleviation counties; and (iii) including integrated demonstration of sustainable farmland development, modern agriculture development, environmental benefits, and poverty alleviation. To maximize the likelihood that potential subprojects were able to demonstrate sustainable farmland development and environmental benefits through project initiatives, the government made an initial selection of project areas which were remote from, and not affected by, industrial developments or mining and mineral processing runoff or pollution. 145. Discussion of the project areas and subproject selection criteria started between ADB and PPMO in early 2014, continued with the PPTA team, and resulted in a series of additional screening and selection criteria (to select participating counties and subprojects) and guiding principles (to ensure sound subproject design and implementation). These combine the relevant elements of PRC standards for land use and soil/water conservation and ADB Safeguard Policy requirements, and are described below.
50
1. Subproject Screening
146. Subproject selection criteria were those related to site, activities, community acceptance, and PIU requirements, as follows. (i) Avoid all ecologically sensitive areas, including protected areas (all types of national
and provincial reserves, protected source areas of municipal reservoirs, etc.), wetlands, water resource protection areas, documented sites for rare or threatened flora and fauna (including nationally protected species), and rare, threatened, or restricted-range habitats. It is assumed that these areas are identified and clearly described by the local (county) government. In the event that such sites are only detected in the PPTA stage, PMO and ADB would also review the need to remove the proposed site from the project.
(ii) Avoid lands with a slope of >25º. For these slopes, although the soil and water conservation law indicates that planting perennials in combination with adequate erosion control measures is allowed, only sites that have been used before should be considered for rehabilitation. Design of these sloping sites should be such that risk of failure (e.g. collapse of terrace walls) is minimal. Otherwise, the area will be kept as is, or improved as natural forest area with minimum disturbance.
(iii) Activities proposed for support by the project should focus on farmland preparation and its related infrastructure, and related green and sustainable production activities. Activities that will not be supported by the project include investment for (i) processing, (ii) construction of new reservoirs (capacity over 100,000m3 and/or dam wall height greater than 15m), and (iii) civil works for training and/or testing centers. Farm track construction activities should be classified by use, size and road surface. Selection of farm track construction activities to be supported by the project will be assessed on the need for, fit with the project objectives as well as economic and financial viability.
(iv) Subprojects must be favorable to villagers in sharing potential benefits: in particular they must support close cooperation among PIUs and cooperatives/villagers, with an emphasis on land areas under various cooperative management arrangements between PIUs and village cooperatives.
(v) Subproject PIUs must be willing to invest in farmland reclamation, ecological construction with demonstration and technical piloting.
(vi) For any sub-projects with "associated facilities" (as defined by ADB's SPS), those facilities will already have all relevant domestic environmental and/or social approvals. Associated facilities are facilities that are not funded as part of the project (funding may be provided separately by the borrower/client or by third parties), and whose viability and existence depend exclusively on the project and whose goods or services are essential for successful operation of the project, e.g. processing facilities.
(vii) PPEs must have clear land ownership rights without disputes and contracts meeting the willingness of land rights entities.
2. Technical Guiding Principles
147. The PPTA team engaged with CPMOs and candidate PIUs to ensure that subprojects contained design and operational elements to make them sustainable users of natural resources and climate-smart. These comprised:
51
(i) All activities for the modification of land use, including preparation for either cropland or forest plantation, should comply with strict regulations in order that exposure to erosive forces is kept to a minimum. Land clearing must be conducted according to technical specifications of soil and water conservation for sloping land. Building terraces and soil tillage must be carried out along contours and keeping vegetation between contour terraces to prevent soil erosion.
(ii) In the choice of new crops or new farming systems, the protection of the soil must be ensured. For any new system or crop, the time and degree of exposure to erosive forces must be taken into consideration. This is critical for crops that develop slowly or form little canopy (such as onions) or farming/cultivation systems where soil has to be tilled intensively for seedbed preparation.
(iii) Recommendations of fertilizer application (rates) based on local soil and crop conditions must be followed to avoid non-point source pollution.
(iv) Participating PIUs and farmer cooperatives must be committed to adopting international best-practices for soil and water management and conservation within their project designs.
148. Through several rounds of discussion on project components among the PPTA team, PPMO, CPMOs and PIUs, it was agreed that in view of the selection criteria, subprojects with significant environmental impacts would be excluded from the project. The PPTA team visited the sites, checking slopes and forest cover, and meeting with local EPBs, forest bureaus, and water resource bureaus to confirm any protection areas near subproject sites. 149. As a result, one proposed subproject was removed in order to avoid the clearance of 8,600 mu of natural forest and shrub land. Another, at Fu’an, was reduced to avoid water source protection land, and was subsequently deleted from the project. In five other subprojects (Jiaocheng, Youxi, Guangze, Ninghua and Xinlou), components involving a total of 30,083 mu of forest and shrub land clearing were removed from subproject designs.In two others (Datian and Yongding) subproject designs were changed to protect drinking water source zone and delete large capacity reservoir construction respectively (Table VI.3).
Table VI.3: Key Environmental Issues in Screening
County Key Environmental Issue for Subproject Resolution
Fu’an About 700 mu of proposed tea planting in the subproject area are within a Drinking Water Protection Area of Fu’an County.
Subproject removed from project
Jiaocheng 4,625 mu of proposed area are involved in Drinking Water Protection Area and including pine forest clearing
Area of 4,625 mu was excluded from the subproject in July, 2015.
Datian Two subproject villages are within Drinking Water Protection Area
Activity limited to tree planting in these two village areas
Zhangping Subproject included 8,600 mu of forest and shrub land clearing
Subproject removed from project
Youxi Subproject included 18,000 mu of forest and shrub land clearing for oil tea camellia
18,000 mu of forest and shrub land clearing removed from subproject. Subproject changed to rehabilitation of existing plantations rather than making new terraces
Guangze Subproject included 578 mu of forest and shrub land clearing for tea
578 mu excluded from the subproject in May, 2015
Ninghua Subproject included 5,080 mu of forest and shrub land clearing for tea
5,080 mu excluded from the subproject in May, 2015
Yongding Subproject proposed construction of 8 reservoirs with total capacity of 1 million m
3
Proposal replaced by 8 water storage ponds with total capacity of 52,000 m
3
52
County Key Environmental Issue for Subproject Resolution
Xinluo Subproject included 1,800 mu of forest land clearing for oil-tea camellia
1,800 mu of forest land clearing removed from the subproject. Subproject changed to rehabilitation of existing plantations rather than establishment of new areas.
150. In the event that before and during project implementation, but after the completion of the PPTA, new subprojects are needed to replace subprojects which have dropped out, the same selection criteria and technical guiding principles will be applied. This is included as a project assurance.
3. Scoping of Assessment 151. To improve subproject design, detailed sub-project data sheets were prepared and passed to design institutes. Subproject information was collected and discussed with CPMOs and design institutes. The PPTA team provided comments and suggestions on the project scoping for the revision of FSRs. The major environmental protection issues identified in these consultations were: (i) sustainable use of water resources; (ii) reduction of soil erosion; (iii) use of agricultural chemicals; and (iv)protection of biodiversity. 152. The PMO, design institutes and EIA institutes prepared DEIAs following the PPTA team advice and especially addressing the three key issues of use of water resources, soil erosion and use of chemicals. 153. Biodiversity protection was successfully addressed during subproject screening. All candidate subprojects which involved agricultural reclamation of natural areas were excluded from the project. The remaining subprojects involve rehabilitation of sloping land to terraces only on abandoned agricultural land and without regrowth of secondary natural flora. 154. It is noted that the majority of subprojects with tea components included, in their originally submitted plans, some clearing of regrowth forest and extensions into new, previously unfarmed areas. The major changes to these plans, as a result of screening to avoid any loss of biodiversity, are recorded in Table VI.2. However, a number of small boundary changes to avoid forest were made in subprojects as a result of the screening criteria emphasized in meeting by the PPTA team. It is important that these small boundary changes are observed during project implementation. Confirmation of and compliance with boundaries on the ground is included as a requirement of the EMP and in project assurances. D. Pre-construction Phase: measures to be undertaken 155. The following measures will be implemented in the pre-construction phase to ensure the project’s environment management readiness.
Institutional strengthening, including (a) appointment of a qualified environment and social officer within the Provincial PMO for the implementation phase; and (b) hiring of at least one loan implementation environment consultant (LIEC) within loan implementation consultant services by the PPMO.
Updating the EMP. The mitigation measures defined in the project EMP (Attachment 1) will be updated based on final technical designs. This will be the responsibility of the CPMOs, using local design institutes.
Contract documents. All tender documents will include the EMP obligations, including the environmental monitoring program. This will be the responsibility of the local design institute, with support of the CPMOs and the LIEC.
Environmental protection training. The LIEC, in conjunction with the PPMO Environment Officer, CPMO Environment Officers and collaboration of local EPBs,
53
will provide training on implementation and supervision of environmental mitigation measures to PIUs and their contractors.
E. Impacts and Mitigation Measures 156. There are three key potential areas of environmental risks for the project: soil erosion and soil loss; sustainable use of water resources; and, use of agricultural chemicals. These will occur in different phases of subproject implementation. The construction, or establishment, phase of the subprojects will be when erosion impacts will be most significant. Impacts from the exploitation of water resources for irrigation and the use of agricultural chemicals will focus on the operational phase of the subprojects. Other risks, such as impacts to air and water quality and noise, will occur during construction. Management of solid waste, and occupational and community health and safety, will be required during both phases, construction and operation.
1. Construction Phase Impacts Erosion impacts 157. The potential for erosion to occur during the construction of terraces, establishment of plantations, land preparation for paddy and vegetable crops, and construction of unsealed farm tracks and drainage and irrigation infrastructure, is a critical concern for the project, especially in the key erosion control counties. The physical circumstances of each subproject in terms of soils, terrain, slope and land area were used to calculate the erosion potential modulus for each land use type and the total potential erosion for each subproject (summarized in Table VI.4; see Attachment 2 for all data).
Table VI.4: Erosion Potential for Subprojects
County PIU Area of
valley floor (mu)
Area of slopeland
(mu)
Total potential soil erosion (t/a)
Converted to t/km2/a
(for comparison with standard*)
Wuyishan
Wuyishan Zhuzi Ecological Agriculture Co., Ltd
13,000
2,000
546.66
5,466.60
Guangze Fujian Zhengyuan Ecological Food Town Co., Ltd
361
6,657
888.06
4,154.94
Datian Fujian Datian County Golden Phoenix Agricultural Development Co., Ltd
18,000
50,000
6,825.89
309,440.35
Youxi
Youxi County Yangzhong Xingkaicheng Urban Construction Co., Ltd
-
10,198
1,202.72
8,176.89
Youxi County Shenlang Edible Oil Co., Ltd
14.50
8,018.00
965.96
5,172.72
Ninghua
Ninghua State-owned Ecological Forestry Co., Ltd
-
26,500
3,847.97
48,227.89
Fujian Ninghua County Ninghua Science and Technology Co., Ltd
-
2,394
345.19
1,746.65
Fujian Chunhui Tea Co., Ltd -
3,454
626.12
1,892.55
Fujian Cuiyun Tea Co., Ltd -
2,499
349.17
581.72
Ninghua Jinxi Tea Co., Ltd -
3,700
514.64
1,269.45
Fujian Ninghua County Houde Agro-forestry Ecological Co., Ltd
-
9,600
1,328.54
8,502.66
Yongding
Longyan Municipality Longyu Ecological Industry Development Co. Ltd
13,143
9,157
1,204.35
17,906.28
Xinluo Longyan Municipality Greenland Ecological Agriculture Development
16,757
5,025
660.73
9,594.68
54
Co. Ltd
Pinghe Fujian Xinghe Investment Development Co. Ltd
* South China Type 1 Standard for “hydraulic erosion” (500 t/km2/a).
158. The data shows that when the potential erosion per year for each subproject (based on slope and erosion modulus calculations) is converted to tons per square kilometer per year (t/km2/a), all subproject potentials exceed the South China Type 1 Standard for “hydraulic erosion” (500 t/km2/a) except for Ningde Baimashan Tea and Fujian Cuiyun Tea (marginal exceedence). This high potential highlights the critical need for strict erosion control during construction. 159. The potential soil loss through erosion from the proposed subprojects of Datian Golden Phoenix, Youxi Yangzhong, Ninghua SOE, Ninghua Science and technology, Ninghua Houde, Yongding Longyu, Pinghe Xinghe and Dongqiao Ningde PIUs are highest, due to the large areas of sloping land planned for terrace development. To assess the magnitude of the risk of large scale erosion from the subprojects the amount of earthworks for each has been calculated (Table VI.5)
Table VI.5: Magnitude of Earthworks for each Subproject
Project PIU Earth excavation
(0'000 m3)
Earth backfill (0'000 m
3)
Wuyishan Wuyishan Zhuzi Ecological Agriculture Development Co.,
21.08 10.54
Guangze Fujian Zhengyuan Ecological Food Town Co., Ltd 14.61 14.54
Datian Fujian Datian County Golden Phoenix Agricultural Development Co., Ltd
19.8 5.6
Youxi
Youxi County Yangzhong Xinkaicheng Urban Construction
160. The data shows that excavation and backfill volumes for all subprojects are closely matched and there will be minimal excess spoil or stockpiles. However the amount of earth excavation during construction is the main indicator of the magnitude of potential erosion during this phase, since the exposed, mostly sloping surfaces will be open to the effects of rain and wind until stabilized. Of the subprojects identified in Table VI.3 as having the highest erosion potential, four also involve significantly large volumes of earthworks (Youxi County Yangzhong Xinkaicheng Urban Construction Co., Ltd; Ninghua State-owned Ecological Forestry Co., Ltd; and Longyu Ecological Industry Development Co. Ltd). 161. The following mitigation measures are set to limit soil erosion during construction. These measures will apply to all subprojects, since all involve some development of sloping land, however the subprojects listed above will be subject to special scrutiny under the EMP due to the large scale of earthworks planned. 162. The Fujian Provincial Soil Erosion Prevention Regulation Article 19 requires that “down-slope 22 reclamation, down- slope cultivation and other unreasonable productive activity is forbidden. For lands located at Key Soil Erosion Prevention Zone, selective cutting is advocated and clear-felling to prepare for plantation development is prohibited; For Key Soil Erosion Control Zones, removal of existing vegetation is forbidden.” These basic provisions are followed by the project. 163. In addition, the project requires, through its technical guidelines for subproject designs, that all preparation for cropland or tea forest plantation must be conducted according to technical specifications of soil and water conservation for sloping land set in Soil and Water Conservation Law of PRC (25 December, 2010). These specifications are summarized as two principles and adherence to them is required by the EMP: (i) building terraces and soil tillage must be carried out along contours and keeping vegetation between contour terraces to prevent soil erosion; and (ii) for any new system or crop, the time and degree of exposure to erosive forces must be taken into consideration. This is critical for crops that develop slowly or form little protective canopy or farming/cultivation systems where soil has to be tilled intensively for seedbed preparation. Impacts of Embankments 164. The subprojects at Wuyishan, Datian, Yongding and Xinluo involve the construction of embankments to protect valley floor cropping from floods. To avoid impact to downstream reaches on flows and turbidity, impact mitigation for embankment construction along streams in valley floor cropping areas will focus on scheduling construction work for October to February, to complete work during the lowest water levels of the year. A setback of 20 m from the stream banks will allow all trees currently existing along the banks to be retained and the “soft” earthen and vegetated foreshores to be unchanged. The embankments have been designed to have a natural soil surface and will be planted to grass and shrubs. Impacts on Ecological Environment 165. To safeguard against the introduction of potential invasive weeds and pests, all project activities using new crop varieties (tea tree seedlings, camellia oil-tea tree seedlings, pomelo, ratooning rice, etc), will only locally adapted species. Crops or grasses used for intercropping and stabilizing base part of terraces should only use locally grown species or sterilized seedlings (i.e. which cannot propagate).
22
i.e. across contours.
56
166. To protect the regrowth forests, shrublands and grasslands, not within the footprint of the subproject developments but on their borders from careless and unplanned construction activities the following measures will be followed:
(i) The layout of construction sites shall minimize the areal extent of construction activities being undertaken at any time. Construction machinery and construction workers shall be strictly assigned to work areas and access corridors as part of site planning and without occupying land randomly. Construction machinery and construction materials will not be placed in naturally vegetated areas.
(ii) Imported construction materials such as brick, stone, sand, cement and wood, shall be transported to the construction site in batches to meet demand so that stockpiles do not overflow onto naturally vegetated areas. After the completion of the project, cleaning and greening work shall be carried out to restore any damage.
Physical Cultural Resources 167. With the exception of the Yongding subproject, there is no record at the local County Administration of Cultural Heritage of important heritage or archaeological potential on or adjoining the lands that will be used for subproject development. Should archaeological artefacts be discovered during any site works, government requirements for excavating and preserving those items will be strictly followed. Chance find procedures will be established for undiscovered underground cultural or historic sites that might be identified during project implementation. This requirement is included in the EMP. 168. At the Yongding subproject site, no vehicles hauling materials or equipment to and from the site will be allowed to pass through the World Heritage site core and buffer zone. This will ensure that dust, noise and most especially vibration will not impact on the Tulou houses. Transport routes, confirming this prohibition will be included in the Yongding subproject Site Management Plan prepared in the pre-construction phase. Damage to any trees or shrubs on the ridgetop, which provides a backdrop to the World Heritage site will be strictly prohibited. Other Construction Impacts 169. A number of construction impacts and mitigation measures will be common to all subprojects. They are generic in nature and refer to typical construction and farmland establishment works involving land preparation, use of machinery for earthworks, transportation of materials, farm track-making (including cementing) and water storage tank, canal and irrigation pipe construction. In some subprojects (Youxi Shenlang and Longding Longyu) greenhouses and nursery areas will also be constructed, producing building waste. 170. Air Quality. Air pollution is likely to occur during the construction phase, originating from a variety of sources, including: (i) movements of construction machinery; (ii) dust emissions due to earthworks, construction activities and materials haulage and stockpiling; and (iii) uncontrolled burning of waste. Ambient air quality of the sites has been sampled and is good. Any impacts on the air quality adjoining the site will be temporary and able to be mitigated. The PIUs and their contractors will include the following measures to reduce air pollution and dust development.
(i) Material stockpiles and concrete mixing equipment will be equipped with dust shrouds. Earthworks to prepare site should be undertaken just before commencement of construction to avoid long term stockpiling. The height of stockpiles should be less than 0.7 m to ensure stability under wind and rainfall conditions and the facilitate covering.
57
(ii) Vehicles transporting potentially dust-producing materials will have proper fitting sides and tail boards and covered with protective canvasses.
(iii) On-site movement of cement bags should not overload people or vehicles to minimize bag rupture and spillage.
(iv) Unauthorized burning of construction waste material shall be subject to penalties for the Contractor, and withholding of payment.
171. Pollution of surface and groundwater. Construction wastewater will be produced from the maintenance and cleaning of mechanical equipment and vehicles, maintenance water for mixing and curing concrete, cooling water, and lost water and soil during the construction period which is discharged as pollutants. It is unlikely that runoff from site will reach these distant waterbodies, however to guard against runoff and infiltration impacting the immediately surrounding water the contractors will do the following.
(i) Sedimentation tanks are built, and after settling out of solids the upper clear liquid is recycled for spraying the construction site (dust control), and the waste residue in the tank is cleared and transported to designated landfills.
(ii) Oil traps are provided for service areas and parking areas, and oil-water separators are installed before the sedimentation tank for oil-containing wastewater.
(iii) All construction machinery is repaired and washed at special repairing shops. No on-site machine repair and washing shall be allowed.
(iv) Storage facilities for fuels, oil, and other hazardous materials are within secured areas on impermeable surfaces, and provided with bunds and cleanup kits.
(v) The contractors’ fuel suppliers are properly licensed, follow proper protocol for transferring fuel, and are in compliance with Transportation, Loading and Unloading of Dangerous or Harmful Goods (JT 3145-88).
172. Noise. Noise can be expected during construction due to construction machinery operation and transport activities. Predicted noise levels at different distances were calculated according to the PRC standard method and the results show that, if construction machinery is used singly, the impact distance is 35 m away from the source during the day and 281 m at night. to meet the PRC standard of Noise Limits for Construction Sites (GB12523-2011) in distance. No work involving construction machinery or transport will be allowed at night. 173. There will be a variety of construction machinery and transport vehicles operating during the construction phase of the subprojects, but normally, the machinery will operate at intervals, and resultant noise will be intermittent and transient. Table VI.6 shows distances to sensitive receptors for all subprojects.The subproject areas are located in farmland and usually at a distance from villages. Where there is no sensitive point of acoustic environment within the impact distance, no mitigation is required.
Table VI.6: Distance to the villages from project sites
County Township Village Distance
(m) Sensitive
receptors? Remark
Wuyishan Wufu
Wengdun 20 Yes
Xingxian 20 Yes
Wuyi 20 Yes
Wufu 20 Yes
Tianwei 50 Yes
Dajiang 20 Yes
Maochang 20 Yes
Xiwei 20 Yes
Diancun 20 Yes
Guangze Zhima Daoshi 300 No Sufficient distance from
58
County Township Village Distance
(m) Sensitive
receptors? Remark
subproject sites
Baimenlou 10 Yes
Hutang 324 No Sufficient distance from subproject sites
Qinmu 26 Yes
Shanguan 205 No
Sufficient distance from subproject sites
Zhima 50 No
Paixia 435 No
Zhaili Meixi 100 No
Qiaoting 2600 No
Siqian Dongshan 740 No
Luanfeng Pingxi Farm 106 No Mountain village protected by
terrain
Lifang
Guanmi 535 No Sufficient distance from subproject sites
Lifang 1900 No
Shicheng 461 No
Huaqiao Wutun 76 No Mountain village protected by
terrain
Datian
Pingshan
Pingshan 20 Yes
Meiyang 20 Yes
Neiyang 20 Yes
Ruimei 128 No Mountain village protected by terrain Keshan 160 No
Heyang 20 No
Small village, few households Yangchun 20 No
Jinshan 20 No
Wushan 20 Yes
Jiyang Jiyang 20 Yes
Junxi Shangtai 20 No Small village, few households
Huxing Hengkeng Group 20 No
Mountain village protected by terrain
Qianping Jikeng 20 No
Xieyang Zhenshan 20 No
Taoyuan Dongban Group 20 No
Shangjing Shangjing 20 Yes Township seat
Shipai Gongqiao 20 No Mountain village protected by
terrain
Youxi
Yangzhong
Yangzhong 417 No
Sufficient distance from subproject sites
Guanyang 496 No
Jishen 484 No
Houlou 195 No
Longyang 79 No Small project area
Lianyang 306 No
Sufficient distance from subproject sites
Chengguan
Xiacun 140 No
Zhongxian Huayang 513 No
Ninghua
Zhongsha
Changtan 20 Yes
Banxi 450 No Sufficient distance from subproject sites Xiasha 726 No
Lianshe 78 No Mountain village protected by terrain Loujia 20 No
Zhongsha 20 Yes
Huaitu
Sunkeng 100 Yes
Tianbei 20 Yes
Fengshan 70 No Sufficient distance from
subproject sites
Shibian 83 No Mountain village protected by
59
County Township Village Distance
(m) Sensitive
receptors? Remark
terrain
Zhuyuan 20 Yes
Qiaotou 100 Yes
Tuanjie 118 No
Mountain village protected by terrain
Shibi
Chentang 100 No
Gongqiao 62 No
Jiangjia 138 No
Nantian 20 No
Jiangtou 20 Yes
Xibei 127 No
Guankeng 131 No
Hutou Longtou 20 Yes
Caofang Pingshang 272 No Mountain village protected by terrain Chengjiao Liantang 20 No
Yongding Hongkeng
Hongkeng 60 No
Liulian 105 No
Xikoulv 61 No
Jiaotang 40 No Mountain village protected by
terrain
Gaotou 150 Yes
Guzhu 54 No
Xinluo Shizhong
Zhongxin 20 Yes
Zhongxi 20 Yes
Renhe 20 Yes
Xiangshan 20 Yes
Baofeng 20 Yes
Yangdong 20 Yes
Pinghe
Banzai Dongkeng 20 No Small village, few households
Jiufeng Sankeng 20
No Mountain village protected by terrain
Meishan 20 Yes
Xiaoxi Jingzai 314 No Mountain village protected by
terrain
Qiling Yangpingke 760 No
Sufficient distance from subproject sites
Hua'an
Huafeng Xiaban 707 No
Makeng Hechun 600 No
Chengyang
Zhanyang 341 No
Shangdai 160 No
Songluo Wangjia 20
No Mountain village protected by terrain
Songluo 20 Yes
Shekou Tanyang 50 No
Xikou 50 No
Jiaocheng Badu
Lingyangtou 80 No Mountain village protected by
terrain
Handan 550 No Sufficient distance from subproject sites Hongmengli 382 No
Zherong
Chuping
Hongkeng 50 No
Danchi 20 No Mountain village protected by
terrain
Huangbai
Shakengli 450 No Sufficient distance from
subproject sites
Chenjiashan 80 No Mountain village protected by
terrain
Shuanggangyang Farm
20 No No residents
60
County Township Village Distance
(m) Sensitive
receptors? Remark
Zhayang Shishan 50 Yes
Dongqiao
Shihou Linxiayang 30 No Mountain village protected by terrain
Wuqu
Wuqu 30 Yes
Dahan 30 Yes
Nan'an 325 No Sufficient distance from subproject sites Hualong 1400 No
174. For residents nearest the subproject sites (i.e. the sensitive receptors in Table VI.6), there will be short-term impacts from construction noise. Impacts will be minimized by the following measures.
(i) Erection of temporary noise barriers between the work site and residents where they are less than 35m apart.
(ii) Daily construction schedules will be arranged to prohibit work in lunch break and at night.
(iii) Villagers in the sensitive villages in Table VI.6 will be notified before construction activities which emit high noise levels are scheduled.
(iv) The construction schedule will be arranged to avoid multiple large-scale and noise emitting machinery operating simultaneously.
175. To avoid noise impacts on sensitive points along the main roads from transport vehicles, the construction unit will reduce the number of vehicles and traffic flow, set speed limits, and, prohibit the use of the horn in villages. Regular checks and maintenance for all machinery and equipment to make sure they are in good condition and for quiet running.
2. Operational Phase Impacts 176. As a result of the PPTA’s selection criteria and scoping exercises undertaken with the EIA and design institutes, the assessment of operational impacts was focused on the key issues of: (i) sustainable use of water resources; and (ii) use of agricultural chemicals. Sustainable use of water resources 177. The primary method for supplying water for irrigation in the subprojects will be the collection of runoff via on-site interception dams and drainage structures. From these, water will be directed to storage tanks and ponds. Most runoff water intercepted by dams will be directed to storage tanks, since this system can be designed for gravity feed. Water collected by drainage ditches will mainly be directed to ponds for settlement of solids before use for irrigation. Rainfall runoff will be used by most subprojects as first preference for irrigation water because this will save on water extraction fees. Components of subprojects which will rely entirely on runoff water are tea and tea-oil plantations with relatively low water demand:
Youxi Yangzhong tea-oil; Youxi Shenlang tea-oil; Yongding Longyu tea and tea-oil; Xinluo Longyan tea and tea-oil; Pinghe Xinghe tea, tea-oil and pomelo; Fujian Farms Agribusiness Tea Co. Ltd; Jiaocheng Lvyin tea-oil; Zherong Jianye tea and tea-oil; and, Dongqiao Qilongxiang tea.
178. Components of subprojects in Datian, Guangze, Youxi, Xinluo, Yongding, Hu’uan and Zherong (including tea, tea-oil, rice, grain, pasture and nursery) will either use water from a nearby stream exclusively for irrigation or augment on-site runoff collection with pumping of water from a local stream. Only one subproject (Hua’an Hongsheng) will extract from groundwater.
61
179. The irrigation water requirement for plantations and crops and the water resources available to the subprojects was calculated by the PPTA team using data provided by the design institutes. A full description of the analysis of water resources and the derivation of cropping water demand and supply is in Attachment 5. Calculations for each subproject are summarized in Table VI.5. Water demand has been calculated from irrigation requirements for each crop type, the number of rotations per year and the planned total areas cultivated. Water sources are nominated as “Runoff” or “Stream” or a combination of both. 180. For the components only using runoff water collection for irrigation, the available water supply is calculated from rainfall data and site runoff volumes using a combination of runoff coefficients for forest/shrubland on upper slopes (where applicable) and agricultural lands on the lower slopes, which range from 0.57 to 0.62. For the components of subprojects which use water from a nearby stream exclusively or augment on-site runoff with extraction from a local stream, the water demand and supply calculations for available water use annual stream flow data calculated from the stream’s catchment. 181. In both situations, the calculations used rainfall/runoff data of P = 90% exceedance. These are rainfall/runoff values which would be exceeded 90% of the time (i.e. a 1 in 10 year drought). 182. For those components using only site runoff (i.e. all slopeland sites), proportions of water intercepted and collected to the site runoff volume range from less than 1% to near 40% (Table VI.7). This means that the majority of runoff from these mini-catchments will continue to feed into local streams and contribute to the river system. At typical irrigation efficiencies of 30-40% a high proportion of irrigation water also returns to the system via surface and subsurface flows. Water return rates to the local waterbody have been calculated as the runoff not intercepted for irrigation plus return irrigation at 40% irrigation efficiency (assuming 10-20% loss to evaporation and 20% loss to deep soil percolation). The table shows that these returns to the waterbody are high, at between 75% and 99% of the total runoff volumes. 183. For components using streams for water extraction, Table VI.7 shows the proportions of water extracted from local streams compared with the contributory flow of the first tributary upstream of the extraction point. The flow volume in the first upstream tributary has been used by the FSRs as a proxy measure for sustainable water availability for extraction, assuming that if the extraction demand can be satisfied by that small portion of the total stream flow then the extraction rate is sustainable. Overall, the mean proportion of extraction to tributary flow is 18% and no subproject’s water extraction volume exceeds 41% of the flow of the first upstream tributary. The project extraction volumes are therefore considered to be sustainable and will have no significant impacts on downstream flows or water users. 184. The tea seedling nursery planned as a component of the Hua’an Hongsheng subproject will draw water directly from pumped groundwater via new wells. The available water resource for this has been advised by the Hua’an water Resources Bureau as 961,000 m3, and the extraction rate is not significant, at 2.96%. 185. Stream extraction is by pumping directly from the watersource via agricultural pipe, with water directed to storage tanks or ponds. In two subprojects (Datian Golden Phoenix and Guangze Zhengyuan) existing in-stream weirs used as capture structures for water extraction will be rehabilitated, and the impacts of this in the operation phase are considered below.
62
Table VI.7: Water Demand and Water Supply Calculations for the Subprojects. Multiple entries per subproject reflects different sites (and therefore water sources) in the subproject area.
County Project implementing
unit Water source
Irrigation area (mu)
Irrigation method
Water demand
(0'000 m3)
Gross water demand
(0'000 m3)
Annual runoff (0'000 m
3)
Water supply capacity
(0'000 m3)
Proportion of demand to
supply
% unused runoff to stream*
P=90% %
Guangze Fujian Zhengyuan Ecological Food Town Co., Ltd
Source: PPTA Team (DFR Appendix 1) * Runoff not intercepted for irrigation plus return irrigation at 40% irrigation efficiency (assuming 10-20% loss to evaporation and 20% loss to deep soil percolation).
64
Use of Agricultural Chemicals 186. Project initiatives will achieve lower rates of agricultural chemical application in subprojects. Through its emphasis on the use of organic fertilizer and integrated pest management (combining proper management of chemicals with non-chemical measures) the project will target reductions in chemical use per unit area of cultivation. 187. Fertilizer. All subprojects will at least partially subsitite chemical fertilizers with organic fertilizer. This will be achieved through soil testing and matching crop needs to fertilizer recommendations. Organic fertilizer does not contain inorganic ions such as sulfate and chloride which can act to weaken soil structure, nor cadmium and fluoride which tend to accumulate in soil and ultimately affect plant growth. Nitrogen and phosphorus in organic fertilizers are slow release compared with chemical fertilizer and tend not to be leached away by rain storms after application. In addition, the high organic matter levels in organic fertilizers act to aerate the soils and maintain soil structure and wetting capacity. In total the subprojects plan to use about 104,440 tons of organic fertilizer per year which will replace the use of 15,110 tons of chemical fertilizer (Table VI.8).
Table VI.8: Planned Organic Fertilizer Use and Chemical Fertilizer Replaced
Project Implementing Unit Type and area of involved
land (mu)
Planned organic fertilizer
application (ton/year)
Replaced chemical fertilizer
(ton/year)
Wuyishan Zhuzi Ecological Agriculture Co., Ltd
Rice 10,000 2500 222
Lotus 3,000 1200 84
Tea garden 2,000 600 18
Fujian Zhengyuan Ecological Food Town Co., Ltd
Organic rice 361 108.3 6
Organic tea garden 2,008 2008 191
Green tea garden 4,649 3719.2 442
Fujian Datian County Golden Phoenix Agricultural Development Co., Ltd
Tea garden 30,000 5400 900
Oil-tea camellia garden 20,000 2000 -640
Lowland farmland 18,000 2700 -342
Youxi County Yangzhong Xinkaicheng Urban Construction Co., Ltd
Oil-tea camellia garden 10,198 3059.4 684
Youxi County Shenlang Edible Oil Co., Ltd
Nursery seedling base 14.5 43.5 -2
Oil-tea camellia garden 8,018 2405.4 538
Ninghua State-owned Ecological Forestry Co., Ltd
Oil-tea camellia garden 26,500 9275 265
Fujian Ninghua County Ninghua Science and Technology Co., Ltd
188. The recently released Action Plan for Reaching Zero Growth of Fertilizer and Pesticide Application till 202023 emphasized that in Fujian Province fertilization principles should promote the use of straw mulch; increased application of organic fertilizer; green manure crop planting during the winter fallow period; and combined fertilization techniques and simplified cultivation technologies.The project design includes the implementation of all of these techniques and initiatives. The project will also establish a pilot for water and fertilizer integration technology (to increase fertilizer use efficiency) in Fu’an County (SOE). 189. Pesticides. The project aims to reduce the use of pesticides, although some pesticide use will still be required, either to address pest issues which cannot be solved through organic approaches and/or while the other project approaches and practices (below) are being established. The Fujian Department of Agriculture has promulgated a comprehensive list of diseases and pests of project enterprises along with recommended pesticides and application methods (Attachment 4). These pesticides and application rates comply with the PRC’s Action Plan for Reaching Zero Growth of Fertilizer and Pesticide Application till 2020 and are designed to target and reduce pesticide usage. However, three of the chemicals on the provincial list (omethoate, triazophos and dichlorvos) are listed as ‘highly hazardous’ by the World Health Organization. These are excluded from use in the project (see also project assurances). None of the other pesticides in the provincial plan are restricted or prohibited by the PRC Government, the Rotterdam Convention, or the World Health Organization, and therefore comply with ADB’s Prohibited Investment Activities List. 190. Specific quantities or application rates for pesticide use are not available for the project sites, however, based on pesticide application rates in the PRC’s Action Plan for Reaching Zero Growth of Fertilizer and Pesticide Application till 2020 and existing agricultural practices in the project counties, a reduction in pesticide application of 5% per mu is anticipated. Measures for reducing pesticide use promoted by the action plan comprise:
23
Released by MOA on 17 February 2015.
66
selection of seedlings with disease and insect resistance, introduction of nursery stock quarantine, cultivation measures to improve plant resistance to disease and insect pests including removal of diseased plants, pest capture on a population scale using light traps and sticky traps at high density at crops’ insect-prone periods. The project will instigate a monitoring and control program for pesticide use in the subprojects by maintaining an inventory of all pesticides bought and applied in the subproject sites. This would include, for each PIU, the name of the pesticide, quantity used and application rate, the pest or disease targeted. 191. The pesticide monitoring and control program requirement is included in the EMP and the results will be included in the PMO’s reports to the ADB. Overall, reductions in the rate of application of agricultural chemicals per unit area, especially fertilizers, will decrease the non point source pollution load entering the county waterways and contribute to improved water quality. 192. To ensure that project initiatives in the management of agricultural chemicals are not jeopardized by uncontrolled chemical use on neighbouring, non-project enterprises, non-project farmers will be included in the project training programs on IPM and organic fertilizer use. Other operational impacts 193. Other potential impacts in the operational phase of subprojects are: solid waste management; erosion during crop farming; in-stream weir operation, and; shelterbelt establishment. 194. Solid Waste. Solid waste generated during operations will include agricultural plastic film and the packaging of fertilizers and pesticides. For plastic film, the residue left in the soil will affect the decomposition of soil humus and the air and water permeability of soil, resulting in soil structure damage, and low water retention and fertilizer conservation. Film residue also hinders seed germination, root growth and crop development, as well as affecting normal nutrient absorption of crops resulting in poor fertilizer use efficiency. For fertilizers, based on observations during the PPTA period, most of the packaging for fertilizers can be recycled by farmer households, or subproject enterprises. The following measures will be implemented:
For the plastic film, mitigation measures are: (i) film mulching practices which optimize the timing of mulching and timely removal of film to shorten the mulching period; (ii) use of biodegradable polymers for agricultural plastic film such as aliphatic polyesters and aliphatic co-polyesters; and (iii) increased efforts to improve agricultural plastic film recovery and recycling.
For pesticide packaging, mitigation measures are: (i) training will be conducted for farmers on chemical packaging handling and recycling. The training will be conducted by technical officers of the Fujian Agriculture Department and County Agriculture Bureaus. Packaging inventory systems training will be undertaken by the loan implementation environmental consultant (LIEC); and (ii) the PIUs will record all the utilization of pesticide, and require staff and farmers to return the empty packages to the PIU.
195. Overall, risks associated with the production and disposal of solid waste are small. In all townships, established litter collection processes and transport systems to nearby landfills are already in place. Volumes of waste produced during construction and operation will be small and manageable because: (i) project activities are spread across 19 counties; (ii) the nature of the project does not generate large or diverse volumes of waste; and (iii) the main waste products to be generated, plastic mulch and/or packaging for agricultural chemicals,
67
will be minimized through the use of biodegradable plastics, improved mulching (to reduce the need for plastic film), reduced chemical application, recycling of the fertilizer bags, and, inventorying and control of the pesticide packaging, as described above. 196. Erosion during crop and plantation management. Crop maintenance, inter-row cultivation and tillage practices on sloping lands have the potential to cause erosion. To prevent soil erosion of tea and tea-oil plantations during the production periods, the following measures will be taken.
(i) On the steeper slopes, inclined terraces (higher elevation at the outside of the terrace than on the inside) will be constructed, and, equipped with bamboo-joint ditches on the lower edge inside the terrace to harvest runoff and collect eroded soil materials.24
(ii) At the lower elevation part of the tea gardens, interception dam and rainwater harvest ponds will be maintained to store this rainwater for irrigation and to store sediments eroded from the tea gardens.
(iii) On the more gentle slopes, erosion will be prevented by planting on the contour with protective ridges.
(iv) As with the terraces, grassed waterways are used to channel runoff water into collector structures (ponds or concrete tanks).
197. The outer edge of the terraces are the parts most susceptible to erosion, especially during the period of early growth of the tea garden. Grasses of cash crops will be grown for soil and water conservation. After crop harvesting, a protective layer of stubble or other plant residues will remain. During the first seasons after planting, a biological crust (moss and lichen) forms, which together with the natural growth of grasses, will further reduce soil erosion. Soil surfaces under the tea trees will be mulched with rice straw or organic fertilizer depending on its composition and availability of straw. This mulch protects the soil surface against raindrop impacts and the increased soil organic matter will improve and stabilize the soil structure. 198. Farm tracks. The approximately 692 km of farm tracks to be constructed (Section IV) may result in soil erosion, including due to increasing slope gradients on cut-and-fill slopes, where subsurface water flow is intercepted, overland flow across the bare surfaces, and damage from vehicle activity. Impacts are expected to be small given the small size of individual tracks, their location among stabilized (cropped and/or terraced) surfaces, and that corners and culverts will be sealed. 199. In-stream weirs. The Datian Golden Phoenix subproject will rehabilitate three existing in-stream weirs to provide collection points for water extraction, for the irrigation of valley floor cultivation. The Guangze Zhengyuan and Zherong subprojects will each rehabilitate an in-stream weir to provide irrigation for organic rice cultivation on valley floor paddy. No threatened or endangered fish species have been documented in the subject waterbodies. The movements of fish and other aquatic organisms is provided for by by regularly spaced open “gates” in the weir structure, which allow free water flow (Figure VI.1).
24
The project terracing (unlike paddy or vegetable terraces) refers to single rows of plants, which are drained, vegetated and stabilized (see Figure IV.2 and IV.4).
68
Figure VI.1: In-stream Weir Cross-section and Photo Showing Design Water Flow Gates
Figure source: FSR and site visit photo by PPTA team.
200. Shelterbelt forests. Eleven of the 13 county subprojects include the planting of shelterbelt forests to protect tea and tea-oil plantations on exposed slopes from damaging winds and from drying out. The mandatory use of native (indigenous) species for these forests will augment the habitat values of retained regrowth forest in the localities and will contribute to local biodiversity by providing habitats and wildlife corridors. F. Community Health and Safety 201. The PIUs and construction contractors for the subprojects will prepare and include an environmental health and safety management plans, as part of their Site Management Plans, as required by the EMP. Contractor performance and activities for occupational health and safety shall be incorporated in their monthly progress reports. 202. The safety and health of both workers and nearby residents may be threatened by construction activities, especially during earthworks and the operation of machinery on sloping land. Surrounding residents may also be affected by noise and dust. During operation staff and laborers on the farms will be subject to health and safety issues in their day-to-day work. Mitigation measures in the EMP to protect the community are as follows.
(i) Planning construction activities so as to minimize disturbances to residents, utilities
and services. Temporary land occupation will be planned ahead of construction to minimize its impact. Any land temporarily occupied will be reinstated to its original condition after construction.
(ii) Implementing safety measures around the construction sites to protect the public, including warning signs to alert the public to potential safety hazards, and barriers to prevent public access to construction sites.
(iii) Negotiating haulage truck and machinery movements with village committees to ensure that village activities (market days etc) and residential roads are minimally impacted by construction traffic.
Mitigation measures in the EMP to ensure worker occupational health and safety are as
follows.
(i) PIUs and contractors shall be required by the CPMOs to ensure that their workers and other staff engaged in the proposed constructions are in a safe environment.
(ii) The PIU, in conjunction with their contractors will prepare site environmental health and safety plans for each subproject, for approval by the CPMOs. The site environmental health and safety plans will be in full compliance with the Labour Law
69
of the PRC25, the Labor Contract Law of the PRC, and the Special Rules on the Labor Protection of Female Employee.s26
(iii) Contractors shall ensure that: (a) all reasonable steps are taken to protect any person on the site from health and safety risks; (b) the construction site is a safe and healthy workplace; (c) machineries and equipment are safe; (d) adequate training or instruction for occupational health and safety is provided, especially for new workers; (e) adequate supervision of safe work systems is implemented; and (f) means of access to and egress from the site are without risk to health and safety.
(iv) In the operations phase of the project, workers and other staff will be issued with protective gear appropriate to their tasks.
(v) All electrical connections in the subprojects will be completed and periodically checked by qualified electricians.
(vi) The openings of all water storage tanks at ground level will be fenced and gated to prevent accidents.
(vii) The PIUs and contractors will apply strict health and safety protocols for staff in the handling, application and clean-up of agricultural chemicals. These protocols will be in full compliance with the PRC Regulations on Safe Management of Hazardous Chemicals (Decree 591) issued by the State Council on 11 March 2011.
G. Climate Change 203. Potential environmental impacts were assessed of: (i) the effects of project greenhouse gas emissions (GHGs) on the climate; and (ii) the effects of climate change on the project.
1. Greenhouse Gas Emissions 204. GHG emissions from the project will occur from two sources: (i) emissions from agricultural activities, in particular from rice paddy flooding and cultivation, and, to a lesser degree, GHGs produced by tea gardens; and (ii) emissions from energy use (electricity) in the operation of facilities, including irrigation infrastructure. 205. Valley floor components. GHG emissions for the valley floor components of the project, comprising rice, cereal, vegetables and pasture, were calculated using the models provided in the 2006 IPCC Guidelines for National Greenhouse Gas Inventories (Table VI.10). Total GHG emissions for the project valley floor components are about 62,500 tons CO2e/year. 206. Tea and tea-oil components. The IPPC Greenhouse Gas Inventories do not provide calculators for tea plantations. To estimate GHG emissions for the tea and tea-oil components, the results of carbon footprinting studies for Darjeeling tea production in India, which is grown under similar conditions, climate, and elevations,27 were applied (Table VI.9).
Table VI.9: GHG Emissions from Individual Processes in Cradle-to-Gate Phases
Inputs in tea and tea-oil cropping Organic Farming GHG
207. It was concluded that the best combination of emission factors were using the growth emissions for conventional (mechanized) cultivation, with the fertilizer and pesticide factors for organic practice. This gives a total of 15.0 kg CO2e/kg tea. Since 4 kg of raw tea pickings are needed for 1 kg of tea and with an average local yield of 300 kg/ha, this equates to an emission factor of 1,125 kg CO2e/ha. The total emissions for the subprojects (with 183,000 mu of tea and tea-oil) are therefore 14,380 tons CO2e/year.
Table VI.10: Estimates of GHG Emissions for Valley floor Components of the Project
Project Implementing
Unit
Type and area of involved land
Unit production
(ton/mu)
Production (ton)
Chemical fertilizer (ton/mu)
Nitrogen fertilizer
application (ton N/ha)
Organic fertilizer (kg/mu /year)
Organic fertilizer (ton / ha / year)
GHG emission
(0'000 tons)
Wuyishan Zhuzi Ecological Agriculture Co., Ltd
Rice 10000 0.48 4800 0.071 0.244 200 3.000 0.6
Lotus 3000 0.8 2400 0.080 1.864 200 1.5 0.59
Fujian Zhengyuan Ecological Food Town Co., Ltd
Green rice 361 0.5 180.5 0.045 0.070 300 4.500 0.02
Fujian Datian County Golden Phoenix Agricultural Development Co., Ltd
Estimates made using the IPCC National Greenhouse Gas Inventories Calculator.
208. Power consumption. Both the valley floor and slopeland crops in the project will be irrigated, and the irrigation infrastructure is driven by electrical pumps. In order to gain a complete estimate of total GHGs, the total predicted annual power consumption of the subprojects is required. However, the design institutes and PIUs were unable to provide information on projected power usage or the employment of pumps on sites. As an alternative, the PPTA team has estimated power usage and greenhouse gas emissions using the following assumptions:
(i) Total irrigation water delivered per year (all subprojects) = 64,800,000 m3. (ii) Average distance water is pumped 80-100m. (iii) Multiple small to medium pumps used in the power range 15-30 kW each. (iv) Power to move 1,000,000 m3 of water 80-100m using multiple small to medium
pumps is estimated at 30,800 kWh.
71
(v) Conversion factor of power generation in the PRC grid to greenhouse gas emissions is 0.65 kg CO2e/kWh.
209. On the basis of these assumptions, total annual electricity consumption to achieve the annual irrigation requirements for the entire project is estimated at just below 2,000,000 Kwh. GHG emissions for this amount are about 1,300 tons CO2e per year. 210. The total CO2e emissions generated by the project, from both direct and indirect sources, will be about 78,180 tons/annum. This is below the 100,000 tons/year threshold in ADB’s SPS for significant emissions. Carbon sequestration, especially in the tea tree and tea-oil plantations, will further reduce net emissions.
2. Climate Risk and Vulnerability Assessment 211. This section summarizes the results of the project climate risk and vulnerability assessment (CRVA). Trends in the climate of Fujian were analysed from data published by the Fujian Meteorological Bureau for a 52 year period from 1961 to 2013. Future climate scenarios were identified based on previous simulations conducted by the National Climate Center using the International Centre for Theoretical Physics (ICTP) Regional Climate Model version 3 (RegCM3) in high resolution, and the Intergovernmental Panel on Climate Change Special Report on Emissions Scenarios (IPCC SRES) (and subsequently published in the Chinese Science Bulletin 57 (10), 2012; and Chinese Journal of Geophysics 55(5), 2012). The method derives future climate predictions for the world and individual countries according to four “scenario families” which provide different socio-political settings. These are A1, A2, B1 and B2. A and B represent the extremes of ideological focus from economics-driven (A) to environmentally-driven (B) decision making. Scenarios 1 and 2 represent the degree to which these countries and regions act in unison (1) or as individuals (2). 212. Current trends in the climate. Since 1961, the annual average temperature in Fujian
Province has risen by 1℃ (Figure VI.2) and is especially pronounced in mean winter
temperatures (Figure VI.3). The days of maximum extreme temperature have increased and the days of minimum extreme temperature have decreased.
Source: Meteorological Bureau of Fujian, 2015
Figure VI.2: Variation in annual average temperature 1961-2013.
72
Source: Lin and Qiu, 2014
Figure VI.3: Variations of mean winter temperature in Fujian during 1971—2013
213. Over the same period, the annual average precipitation increased slightly, and days of rainfall decreased (Figure VI.4). However, the days when storms occur have increased, especially in the rainy season. The frequency and intensity of extreme events has also increased, with destructive typhoons becoming much more frequent (e.g. recent events in 2005, 2006, 2008 and 2010).
Source: Meteorological Bureau of Fujian, 2015
Figure VI.4: Variations of yearly mean precipitation in Fujian during 1961—2013
214. Droughts most frequently occur in Fujian Province in summer and autum. Spring droughts most commonly occurred between 1937 and 1950, summer droughts in the 1950s and 1960s and autumn and winter droughts both in the period of 1937-1950 and in 1964-1970 (Table VI.11). Generally, the drought occurrences have shown a long term decreasing trend, but its seasonal variability is the main cause of impacts to cropping.
Table V1.11: Occurrences of Droughts in Fujian Province, 1939-1995
Year 1937-1950 1951-1960 1964-1970 1971-1980 1981-1995 Total
Spring drought 7 (41.2) 3(17.6) 3(17.6) 4(23.5) 0(0) 17(100)
Autumn and winter drought 5(26.3) 3(15.8) 5(26.3) 2(10.5) 4(21.1) 19(100) Source: Lu and Wang, 2012
28. Numbers in brackets are %.
215. Projected climate change—temperature. The future climate will continue to warm. The regional model RegCM3 predicts that under IPCC SRES A1, B1 and A2 scenarios for 2050, the average temperature in the future in Fujian Province will increase at a rate of 0.516
oC /decade and 0.342 oC /decade under B1 and A1B scenarios respectively. The increased trend of the average temperature under the A2 scenario is 0.215 oC /decade, and is not
28
Lu, S.J. and Wang Y. 2012. The Climate of Fujian. Meteorological Press.
73
significant. With the increase in temperature, growing periods have lengthened. The northern boundary of the tropic climate zone has moved northwards and the cropping of some tropical crops is becoming possible. The growing period of rice has also been prolonged by 6-11 days.
216. Projected climate change—precipitation. The projected result for precipitation shows that the yearly average precipitation in Fujian Province under B1 and A1B scenarios will decrease, with an average rate of 3.58 mm/year and 6.47 mm/year respectively, while it will increase under the A2 scenario with the rate of 8.05 mm/year. These widely differing future rainfall scenarios make agricultural planning difficult, but highlight the need for conservative estimates or runoff and reservoir recharge, as well as designing larger than average drainage structures. 217. For the short to medium term, the A2 scenario is likely to be more relevant than others, since it describes the current way that most countries and regions, including the PRC, are approaching climate change issues. Predictions of minimal rise in temperatures and significant increases in rainfall under the A2 scenario will place little adaptation pressure on the agricultural enterprises of the project. 218. The predicted changes for Fujian as a result of climate change are that the average temperature in the future will increase at a rate of between 0.516 oC /decade and 0.342
oC/decade and that the yearly average precipitation will decrease with an average rate of between 3.58 mm/year and 6.47 mm/year. These predictions for both temperature and rainfall are for B1 and A1B scenarios respectively and represent the most significant predicted changes. 219. The subproject components most vulnerable to increases in temperature and decreases in rainfall are irrigated crops, the main focus of the project. Drought in the spring is one of the important factors affected the growth and yield of tea. Drought in other seasons affects the fruiting stages of pomelo and grain crops. Key vulnerabilities are from:
(i) Water stress and higher water demand from crops due to higher temperatures. (ii) Low water availability for rain-fed crops and low water availability for irrigation from
site catchments and local waterbodies due to lower rainfall. (iii) The increased incidence of crop diseases and insect pests due to warmer
conditions.
220. These potential impacts are offset to some extent by the potential benefits of overall rising temperatures, which will result in warmer summers and milder winters. These are expected to increase the growing period for rice by 6-11 days and result in higher crop productivity, and provide increased opportunities for intercropping of legumes during winter with summer rice. 221. Project water demand and supply. Increased crop water demands and the seasonality and intensity of rainfall will need to be addressed in the sustainability of planned irrigation systems in the subprojects. Project water demand and supply was calculated assuming a conservative rainfall/runoff exceedence value of P=90%, the equivalent of a very dry year with a return frequency of 1 in 10 years, and was based on 50 years of rainfall data. The results show that planned use of water resources by the project was sustainable, especially due to the widespread harvesting of site runoff water. An additional two-way sensitivity analysis was undertaken on the project water demand and supply (Table VI.12). The input data were as follows:
i. Target year = 2035 ii. Reduction in average rainfall = 130 mm (6.47 mm per year for 20 years)
74
iii. Increase in average temperature = 1 oC (0.516 oC per decade for 2 decades) expressed as a 5% decrease in the irrigation utilization coefficient.
222. The results (Table VI.12) indicate that even under a worst-case scenario, use of water resources in the climate change scenario for 2035 only represents an increase of 1-3% in the ratio of demand to supply per site. The ratio of extraction from streams to supply increases by similar amounts. Planned water use to at least 2035 is therefore indicated to be sustainable.
Table VI.12: Water Demand and Water Supply Sensitivity Analysis
County Project implementing
unit Water source
2015 2035
% of demand to supply
% unused runoff to stream*
% of demand to supply
% unused runoff to stream*
Guangze Fujian Zhengyuan Ecological Food Town Co., Ltd
Source: PPTA team. *Runoff not intercepted for irrigation plus return irrigation at 40% irrigation efficiency
(assuming 20% loss to evaporation and 20% loss to deep soil percolation). NA=not applicable (“unused runoff to stream” only applies to site runoff).
223. Adaptation to future climate change. The CRVA and water balances and sensitivity analyses show that the planned irrigation systems are sufficiently robust to cope with the changes in temperature and rainfall predicted for the area under A1 and B1 climate change scenarios (the A2 scenario predicts an increase in rainfall). However, the seasonality of rainfall makes it both prudent and necessary to develop and promote water-saving awareness and techniques to minimize the effects of seasonal droughts. The project designs include the following adaptation measures. (i) Use of improved strains and varieties of crops, which are adapted to the local climatic
and soil conditions of the project area. Available new varieties for rice, tea and oil tea suitable for different regions in Fujian Province have been identified by Fujian Provincial Agricultural Department and their use promoted (Fujian Provincial Agricultural Department, 201429).These varieties have better disease and drought resistance and will be employed in the establishment of new crops in all subprojects.
(ii) Significant on-farm water storage capacity to buffer the effects of seasonal drought for all subprojects, including covered water storage to minimize evaporative loss.
(iii) Irrigation technologies comprise sprinkle and trickle (drip) irrigation which allow real time control of water application.
(iv) Mulching by cover crops, such as forage grass and leguminous forage will be employed in tea and oil tea gardens to conserve soil moisture. Green manure cropping and mulching helps control soil erosion, and increases carbon sequestration on farms.
(v) The establishment of shelterbelts of trees around tea and tea-oil plantations will protect the crops from drying out and contribute to water savings. The establishment
29
Agricultural Bureau of Fujian Province, 2014. The new handbook of five new agricultural technologies.
of integrated windbreaks and tea and oil tea garden will also contribute to on-farm carbon sequestration.
H. Indirect, induced, and cumulative Impacts 224. Indirect impacts are adverse and/or beneficial environmental impacts which cannot be immediately traced to a project activity but can be causally linked. Induced impacts are adverse and/or beneficial impacts on areas and communities from unintended but predictable developments caused by a project which may occur later or at a different location. Cumulative impacts are the combination of multiple impacts from existing projects, the proposed project, and anticipated future projects that may result in significant adverse and/or beneficial impacts that would not be expected in case of a stand-alone project.30 225. Indirect impacts. A potential indirect risk is that the hydrology of streams downstream of the project sites is negatively affected, due to water extraction and interception of runoff for the project. This risk is considered minimal because: (i) water demand and supply analysis has confirmed that water extraction represents only 8–12% of the total capacity of the watercourses; (ii) the majority of subprojects (including all of the slopeland subprojects) will source their water needs from overland flow, which captures only a small proportion of rainwater; and (iii) the improved water storage capacity to be achieved by the project will reduce extraction pressures on local water resources in the dry season. 226. Induced impacts. A potential induced impact is that the establishment of infrastructure and capacity achieved by the project will result in scaling up of commercial activities after the project by the project enterprises, including increases in workers, further land intensification, and/or subsequent pressures on public utilities (e.g. roads and water and electricity easements). These risks are considered small due to: (i) the physical limits imposed by the boundaries of each subproject and/or topography; (ii) restrictions imposed by existing land planning and zonation; and (iii) the growing requirements for high-quality tea and tea-oil, which require separation between plants and which limits cropping intensification. A beneficial induced impact may be the increase in demand for organic fertilizer, strengthening the viability of the industry and reducing demand for chemical-based fertilizers. 227. Cumulative benefits. No new land will be taken up for agriculture under the project. Instead, existing agricultural lands will be improved or, in the case of abandonded cultivation, rehabilitated. Approximately 27% of the existing valley floor cultivation areas in the project villages will be rehabilitated and 11% of the existing tea and tea-oil plantations and abandoned terraces in the project villages will be rehabilitated. There will be no encroachment on naturally vegetated lands, and farm machinery farm tracks are designed to form only internal farm networks and not provide access for the exploitation of forest lands. 228. Water resources of the project area fall within five major river systems (the Jiaxi, Minjiang, Jiulongjiang and the Tingjiang systems). The cumulative annual use of water resources by the project is 6.46x10⁶ m3, which is 0.067% of the total resource of these river systems. 229. Cumulatively, the project will reduce the amount of chemical fertilizer used on subproject lands by approximately 15,110 tons per year, by replacing it with organic fertilizer. In 2013, total annual fertilizer application in Fujian Province was 4,13 million tons, and average application of 25.9 kg/mu (4 kg/mu higher than the national average). While this reduction only represents 0.4% of Fujian’s total chemical fertilizer use, it is important in the context of the state target of Fujian Province for zero growth in the use of chemical fertilizers by 2020.
30 ADB. 2011. Sourcebook for Safeguard Requirement 1: Environment. Manila.
77
VII. INFORMATION DISCLOSURE, CONSULTATION AND PARTICIPATION 230. To identify key environmental issues and sensitive sites, all counties/districts of the project sites were visited. Consultation meetings were held with local authorities and potential affected people. Key findings such as farmer's willingness, environmental sensitive sites to be addressed, and suggestion from local government authorities were reviewed with the design institutes to revise the design and address environmental issues. A. First Round Consultations 231. The first round of formal community meetings was held in April 2015 and was undertaken by the PPTA team. Public consultation meetings were held at the subproject sites or in nearby village committee offices. 232. Information disclosure. The meetings included information dissemination about the project, explaining the planned developments which would be undertaken for each local subproject, timetables, status and constraints of the surrounding environment, and potential impacts and mitigation measures. Presentations were made at community meetings using powerpoint presentations, with photographs, diagrams and maps. 233. Consultation. At these meetings a questionnaire was circulated to document community views and concerns. In total the public consultation involved 41 villages in 13 project counties, and elicited responses from 610 participants (Table VII.1) on issues of concern (Table VII.2). Of the 610 responses, 20.49% (125) were from poor households and 38.03% (232) were from female respondents.
Table VII.1: Public Consultation Participants
Project County Public consultation meeting Surveyed villages
Jiaocheng 10-12 April 2015 4
Pinghe 11-12 April 2015 4
Fu’an 13-14 April 2015 2
Wuyishan 15-16 April 2015 2
Ninghua 18-19 April 2015 4
Yongding 25 April 2015 2
Xinluo 26 April 2015 2
Datian 18-19 April 2015 4
Youxi 20-21 April 2015 4
Guangze 22-23 April 2015 2
Dongqiao 4-5 May 2015 2
Hua’an 7-11 July 2015 3
Zherong 4-6 May 2015 6
Total 41 Source: PPTA social survey and environmental public consultation, 2015.
Table VII.2: Community Responses
Q 1. Are you satisfied with local environmental quality? Frequency (No.) Percentage
Q.1.1 Very satisfied 236 39
Q.1.2 Satisfied 353 58
Q.1.3. Not satisfied 21 3
Total 610 100
Q 2. What is the main local environmental issue? Percentage
Q2.1 Bad air quality 21.0%
Q2.2 Bad water quality 26.6%
Q2.3 Noise pollution 13.7%
Q2.4 Solid waste 24.0%
Q2.5 Bad ecological environment 14.6%
78
Total 100.0%
Q3. What impact that you think the project will bring? Frequency
(No.) Percentage
Q3.1 Good impact 483 80.5%
Q3.2 Adverse impact 10 1.7%
Q3.3 No idea 107 17.8%
Total 600 100.0%
Q4. What the largest good impact that you think the project will bring?
Frequency (No.)
Percentage
Q4.1Air environmental protection 104 13.2%
Q4.2 Water resource protection 152 19.3%
Q4.3 Water and soil erosion reduction and ecological environmental protection
167 21.2%
Q4.4 Noise pollution reduction 55 7.0%
Q4.5 Water resource saving 136 17.3%
Q4.6 Solid waste reduction 62 7.9%
Q4.7 Soil environment protection 112 14.2%
Total 788 100.0%
Q5. What the adverse impact that you think the project will bring? Frequency
(No.) Percentage
Q5.1 Air environmental pollution 58 15.2%
Q5.2 Water resource pollution 69 18.1%
Q5.3 Ecological damage 42 11.0%
Q5.4 Noise pollution 33 8.7%
Q5.5 Water resource waste 60 15.7%
Q5.6 Solid waste produce 53 13.9%
Q5.7 Soil environmental damage 66 17.3%
Total 381 100.0%
Q6. What is your main concern during the project construction period?
Frequency (No.)
Percentage
Q6.1 Noise 89 19.7%
Q6.2 Dust 84 18.6%
Q6.3 Water resource pollution 77 17.0%
Q6.4 Ecological damage 42 9.3%
Q6.5 Not convenient for farming 74 16.4%
Q6.6 Not convenient for getting around 86 19.0%
Total 452 100.0%
Q7. Are you going to make a complaint if the project has impact to your daily life?
Frequency (No.)
Percentage
Q7.1 Yes 105 17.9%
Q7.2 No 146 24.8%
Q7.3 It depends on the level of impact 337 57.3%
Total 588 100.0%
Q8. Who you will refer to if you are going to make a complaint? Frequency
(No.) Percentage
Q8.1 Contractor 73 16.1%
Q8.2 project enterprise 50 11.0%
Q8.3 Environmental protection bureau 111 24.4%
Q8.4 Village committee 134 29.5%
Q8.5 Complaints Office in the Township government 86 18.9%
Total 454 100.0%
79
Q9. Do you agree the project location? Frequency
(No.) Percentage
Q9.1 Yes 570 93.9%
Q9.2 No 1 0.2%
Q9.3 Do not care 36 5.9%
Total 607 100.0%
Q10. What impact that you think the project will bring to your daily life?
Frequency (No.)
Percentage
Q10.1 Good impact 526 86.2%
Q10.2 Adverse impact 3 0.5%
Q10.3 No idea 81 13.3%
Total 610 100.0%
Q11. What impact that you think the project will bring to local economy development and society?
Frequency (No.)
Percentage
Q11.1 Good impact 527 86.4%
Q11.2 Adverse impact 1 0.2%
Q11.3 No idea 82 13.4%
Total 610 100.0%
Q12. Do you think the project is viable after consider the good and adverse impacts that will be caused?
Frequency (No.)
Percentage
Q12.1 project viable, good impact is greater than the adverse impact 553 91.0%
Q12.2 project not viable, adverse impact greater than good impact 8 1.3%
Q12.3 No idea 47 7.7%
Total 608 100.0% Source: PPTA social survey and environmental public consultation, 2015.
234. Of the 610 people who participated in the survey, 91% supported the project. Most believed that the project will improve local environmental quality (80%) and 86% of the respondents believed that the project construction will bring benefit to their daily life and local economic development. The main environmental concerns during project construction that the community reported were: construction noise (19.7%), community safety and well-being (“getting around during construction”) (19%), dust (18.6%), water resource pollution (17.0%), and ecological damage (9.3%). Mitigation measures to address these issues havew been developed in the environmental impact assessments and are included in the EMP. 235. Consultation meetings were also held with local government authorities including EPBs, Agricultural Bureaus, Planning Bureaus, Land Administration, Water Resource Bureaus, Forest Bureaus and Cultural Relic Bureaus. Major concerns included drinking water source protection and forest protection – and these concerns were fully addressed during project screening. B. Second Round Information Disclosure 236. A second round of information disclosure was made after the completion of the first draft domestic EIA Tables by the EIA Institutes. The main environmental impacts and mitigation measures, as well as the environmental management plan described in the EIA Tables were notified in public media (http://www.hbsjy.com for Dongqiao and Zherong) and information boards of villages near the subproject sites for the other counties. During this second round of information disclosure, the grievance redress mechanism was also introduced, with assurances that the mechanism and contact points for complaints will be fully publicized at subproject localities before construction commences.
80
VIII. GRIEVANCE REDRESS MECHANISM 237. A grievance redress mechanism (GRM) has been developed in compliance with ADB’s SPS (2009) requirement to address environmental, health, safety, and social concerns associated with project construction, operation, land leasing and land cooperation arrangements. The GRM is designed to achieve the following objectives: (i) provide channels of communication for local communities to raise concerns about environment- and social-related grievances which might result from the project; (ii) prevent and mitigate adverse environmental and social impacts to communities caused by project construction and operation; (iii) improve mutual trust and respect and promote productive relationships between the PIUs and local communities; and (iv) build community acceptance of the project. The GRM is accessible to all members of the community, including women, youth, and poverty-stricken residents. Multiple points of entry are available, including face-to-face meetings, written complaints, telephone conversations, e-mail, and social media. 238. Public grievances related to project construction to be addressed by the GRM may include damage to public roads, interruption of public services, dust emissions, noise, soil erosion, inappropriate disposal of waste materials, and safety for the general public and construction workers. Public grievances related to land contracts may relate to the lack, or un-timely payment of compensation monies, other allowances, and/or lease monies as per entitlements described in the associated documents. 239. The GRM meets the regulatory standards of the PRC that protect the rights of citizens from construction-related environmental and/or social impacts. Decree No. 431 Regulation on Letters and Visits, issued by the State Council of PRC in 2005, codifies a complaint acceptance mechanism at all levels of government and protects the complainants from retaliation. Based on the regulation, the former State Environmental Protection Administration (SEPA) published updated Measures on Environmental Letters and Visits (Decree No. 34) in 2006. 240. Currently in Fujian Province (and generally in the PRC), when residents or organizations are negatively affected by a development, they may complain, by themselves or through their community committee, to the contractors, developers, the Township Government, the local EPB, the local Forestry Bureau, the local Water and Soil Conservation Station, the provincial DOEP, or by direct appeal to the local courts. The main weaknesses of this system are: (i) the lack of a specialized unit to address grievances; and (ii) the lack of a specific timeframe for the redress of grievances. The project GRM addresses these weaknesses. 241. The details of the project GRM, including a time-bound flow chart of procedures, are included in the project Environmental Management Plan (Attachment 1 of this IEE).
81
IX. CONCLUSIONS A. Project Impacts and Mitigation Measures 242. Significant potential environmental impacts were avoided by a strong design and screening process and which resulted in the exclusion from the project of activities involving clearance of natural vegetation, water source protection areas, large scale reservoir construction, or conversion of sloping forest land to terraces. 243. The three key areas of potential environmental impacts are soil erosion (during construction) and the unsustainable use of water resources and use of agricultural chemicals (during operation). Other, more minor risks will occur during construction (impacts to air and/or water quality) or both construction and operation (the need for management of solid waste, and of worker and community health and safety). 244. Pre-construction. Project site planning will be a formal requirement for each subproject to ensure that the layout of work areas and the scheduling of activities is in accordance with the impact mitigation prescriptions of the EMP. Measures to ensure that, prior to project implementation, the capacity to manage the project environmental safeguards is present in the project agencies are identified in the IEE and EMP. 245. Construction. The major potential impact of erosion during subproject construction has been assessed separately, taking into account the individual differences in terrain, soils and enterprise. Strict erosion control prescriptions have been set for PIUs, combining technical specifications of soil and water conservation for sloping land set in Soil and Water Conservation Law of PRC (25 December, 2010) and those developed by the PPTA. 246. Of the subprojects identified as having the highest erosion potential, four also involve significantly large volumes of earthworks. Mitigation measures are set to limit soil erosion during construction. These measures will apply to all subprojects, since all involve some development of sloping land; however the four subprojects identified will be subject to special scrutiny under the EMP due to the large scale of earthworks planned. 247. Embankment construction along streams in valley floor cropping areas will be scheduled for October to February, to complete work during the lowest water levels of the year. A setback of 20 m from the stream banks will allow all trees currently existing along the banks to be retained. 248. Strict control of construction will be checked by CPMOs to ensure that PIUs adhere to the boundaries of existing or abandoned farmland. Measures to stop work spreading onto naturally vegetated areas are to be included in site construction planning and cover the assignment of work areas and access corridors to avoid occupying land randomly. Construction machinery and construction materials will not be placed in naturally vegetated areas. 249. At the Yongding subproject site, no vehicles hauling materials or equipment to and from the site will be allowed to pass through the World Heritage site core and buffer zone, to avoid dust, noise and vibration impact on the Tulou houses. Damage to any trees or shrubs on the ridgetop, which provides a backdrop to the World Heritage site will be strictly prohibited. 250. Potential construction impacts on air quality, on water quality of nearby suface waterbodies and groundwater, and on the noise environment have been reviewed and concluded to be minor and readily minimized through mitigation measures which are set out in the EMP.
82
251. Operations. There is potential for negative environmental impacts associated with: (i) the exploitation of water resources; and (ii) use of agricultural chemicals. For water use, detailed water demand and supply analyses have demonstrated the sustainability of the proposed water use levels of the subprojects. For the subprojects utilizing runoff, the proportions of water collected range from less than 1% to near 40%, i.e. 75 to 99% of total runoff volumes will return to waterways. For the subprojects extracting water from streams, the mean proportion of water extracted (compared to flow volume of the first upstream tributary) is around 18%. Of these extraction volumes, 20-30% will subsequently return to the streams through surface flow. 252. For the use of agricultural chemicals, through the increased use of organic fertilizers and innovative management and cultivation practices for pest control, a net reduction in the application of agricultural chemicals is predicted for the project enterprises. Due to the unpredictable nature of disease and pest infestations, predicted reductions in pesticides cannot be quantified, but will be strictly monitored and included in progress reports. About 15,110 tons/year of chemical fertilizer will be replaced by organic fertilizer. 253. Other potential impacts in the operational phase of subprojects are: erosion during crop management; solid waste handling and disposal; in-stream weir operation, and; shelterbelt establishment. 254. Crop maintenance, inter-row cultivation and tillage practices on sloping lands have the potential to cause erosion. To prevent this, slope-reversed terraces will be equipped with bamboo-joint ditches on the lower edge inside the terrace to harvest runoff and collect eroded soil materials. Interception dam and rainwater harvest ponds will be maintained to store water for irrigation and intercept sediments eroded from the tea gardens. Farm machinery tracks will be designed to avoid channeling runoff water and managed to maintain stability. 255. Measures to minimize impacts from plastic film mulch will optimize the timing of mulching and timely removal of film to shorten the mulching period, use degradable agricultural plastic film and promote plastic film recovery and recycling. The handling and disposal of waste packaging of fertilizer and pesticide will be given special attention. Fertlizer bags will be recycled and pesticide packaging will be tracked entering and exiting the site through inventorying and segregation for hazardous waste disposal by county waste management agencies.The design of in-stream weirs include gates which maintain the flow of the waterbodies and allow passage of fish. Shelterbelt forests planted in the subprojects will use only native species to improve local biodiversity. 256. Community Health and Safety. The PIUs and construction contractors for the subprojects will include an environmental health and safety management plan, as part of their Site Management Plan as required by the EMP. The contractors’ performance and activities for occupational health and safety shall be incorporated in their monthly progress reports. Safety and health of both workers and nearby residents may be threatened by construction activities, especially during earthworks and the operation of machinery on sloping land. Surrounding residents may also be affected by noise and dust. During operation staff and laborers on the farms will be subject to health and safety issues in their day-to-day work. 257. Environmental Management Plan. The EMP brings together all the mitigation measures for the identified impacts as well as pre-construction requirements, operational management prescriptions and the activities and budgets required to address the unresolved impact issues of wastewater use and groundwater exploitation. The EMP also includes (i) a GRM to ensure affected people have a timely response to their complaints and (ii) an environmental monitoring program, to monitor and report on the environmental performance of project implementation. The EMP includes institutional responsibilities, training needs,
83
reporting schedules and costs for implementing the mitigation measures and the monitoring requirements. B. Project Assurances 258. The project will comply with all applicable PRC laws and standards as well as the project EMP, including the implementation of all mitigation measures, performance monitoring and reporting, environmental training of project personnel, and the establishment and operation of a grievance redress mechanism. 259. The following project-specific assurances will also be complied with:
(i) Erosion control. All PIUs will ensure that the design, construction and operation of
subprojects will comply with technical specifications of soil and water conservation for sloping land set in Soil and Water Conservation Law of PRC (25 December 2010).
(ii) Protection of natural vegetation. (a) PIUs will not expand site operations beyond the boundaries agreed for the subprojects. (b) PIUs will confirm that there will be no conversion of natural forest or natural shrublands31 to tea or tea-oil gardens. (c) All subprojects involving stream embankments (including Wuyishan, Datian, Yongding and Xinluo subproject) shall retain existing trees (if any) along both riverbanks.
(iii) Pesticides. No pesticides that are listed as ‘Extremely Hazardous’ or ‘Highly Hazardous’ by the World Health Organization, will be used in the project. This includes the prohibition of three pesticides (omethoate, trizophos and dichlorvos) listed in the Fujian Department of Agriculture’s list of recommended pesticide applications.
(iv) Weed control. (a) If the use of fast-growing non-native species (e.g. grasses) is required for stabilizing bare construction surfaces, only sterilized seedlings (i.e. which cannot propagate) shall be used. (b) To reduce the risk of spreading weeds, pest animals, and/or soil-based organisms, the project will: (a) prohibit the use of any plant species classified in the PRC as weeds, as defined by the China National Invasive Plant Database (http://www.agripests.cn; 229 species) and by the Ministry of Environment Protection and Chinese Academy of Sciences (19 species).
(v) World Heritage Areas. Yongding subproject PIU shall ensure that no activities including truck haulage or machinery movements will pass through the Tulou World Heritage Site core and buffer protection zones, and that no trees on the skyline which forms a backdrop to the Tulou site will be damaged.
(vi) Water source protection areas. Datian subproject PIU shall ensure that in the drinking water protection zone portion of the subproject area, only native tree planting is undertaken.
(vii) New subprojects. In the event that during project implementation any new subprojects are added, the same selection criteria and technical guiding principals used in the project preparation will be applied.
C. Conclusion 260. The project design has been developed toward the maximization of erosion control, avoidance of new land conversion, and the physical location and management of subprojects to avoid impacts. For environmental safeguards, assuming full and effective implementation of the project EMP (Attachment 1), the potential environmental impacts identified in this IEE are expected to be mitigated to levels which comply with the relevant PRC standards.
31
Defined under Classes 031(forest) and 032 (shrubland) of the PRC’s Land Classification Criteria GB-T21010 (2007).
FUJIAN FARMLAND SUSTAINABLE UTILIZATION AND DEMONSTRATION PROJECT
People’s Republic of China
February 2016
Prepared by the Fujian Provincial Government with the assistance of the Asian
Development Bank
85
TABLE OF CONTENTS
A. Introduction ............................................................................................................. 86 B. Institutional Arrangements and Responsibilities for EMP Implementation ................ 86 C. Project Readiness Inspection .................................................................................. 87 D. Summary of Potential Impacts and Mitigation Measures ......................................... 88 E. Monitoring and Reporting ........................................................................................ 94 F. Training ................................................................................................................. 100 G. Grievance Redress Mechanism ............................................................................. 101 H. EMP Cost Estimates .............................................................................................. 105
ANNEX 1: TERMS OF REFERENCE FOR PROJECT ENVIRONMENTAL POSITIONS ........ 107 PPMO Environment Officer....................................................................................... 107 CPMO Environment Officers ..................................................................................... 107 TOR for Loan Implementation Environmental Consultant ......................................... 109
This is an attachment to the Initial Environmental Examination Report, which is an official document of the borrower. The views expressed herein do not necessarily represent those of ADB’s Board of Directors, Management, or staff and may be preliminary in nature. Your attention is directed to the “Terms of Use” section of the ADB website (www.adb.org). In preparing any country program or strategy, financing any project, or by making any designation of or reference to a particular territory or geographic area in this document, the Asian Development Bank does not intend to make any judgement as to the legal or other status of any territory or area.
A. Introduction 1. This Environmental Management Plan (EMP) is developed for the Fujian Farmland Sustainable Utilization and Demonstration Project (the project). It summarizes the potential project environmental impacts and defines mitigation measures and monitoring requirements for the design, construction, and operational stages of the project. It also defines the institutional arrangements and mechanisms, roles and responsibilities of different institutions, and costs for EMP implementation. The EMP seeks to ensure continuously improving environmental protection activities during preconstruction, construction, and operation in order to avoid, reduce, and/or mitigate adverse impacts and risks. The EMP is based on the findings of the Initial Environmental Examination (IEE) and domestic environmental assessment reports. 2. The EMP was disclosed on the ADB public website (www.adb.org) on 10 February 2016 and is included in the project administration manual (PAM). It will be included as a separate annex in all bidding and contract documents. The contractors will be informed of their obligations to implement the EMP, and to provide for EMP implementation costs in their bids for project works. 3. The EMP includes a monitoring program. Monitoring results will be used to evaluate: (i) the extent and severity of actual environmental impacts against the predicted impacts; (ii) the performance of the environmental protection measures and compliance with relevant laws and regulations; (iii) trends of impacts; and (iv) overall effectiveness of the EMP. B. Institutional Arrangements and Responsibilities for EMP Implementation 4. The Fujian Provincial Government (FPG) is the Executing Agency (EA) for the project. The FPG has set up a Project Coordinating Group (PRG) to facilitate liaison with project agencies and to assist in complaints resolution in the GRM. The PRG comprises representatives from DRC, Finance Department, Agriculture Department, Water Resource Department, Forestry Department, Environmental Protection Department and the Womens Federation. 5. The EA has established a provincial project management office (PPMO), who will be responsible, on behalf of the EA, for the management of the project and to oversee the implementation of the EMP. The PMO has nominated and established the position of a PMO environmental officer who will directly coordinate the activities of the EMP. 6. Beneath the PPMO are five Municipal PMOs (MPMO) and 13 County PMOs (CPMO). The role of the MPMOs will mainly focus on financial management and procurement matters, except for the Ningde MPMO which will act in the role of CPMO for the subprojects in Fu’an, Zherong and Donqiao counties. 7. The CPMOs will be responsible for day-to-day implementation of the project within each county, at the subproject level. The CPMOs will ensure that the provisions of the EMP are implemented in each subproject. Each CPMO will have a member of staff assigned to manage the EMP implementation and assist the PPMO environmental officer and Loan Implementation Environmental Consultant (LIEC; see below) at the local level. 8. PPMO. The PPMO, through the PPMO environmental officer, and in coordination with the LIEC, will do the following:
(i) Prepare and provide the following specification clauses for incorporation in the bidding procedures: (i) environmental management requirements to be budgeted by PIUs and their construction contractors; (ii) environmental clauses for contractual
87
terms and conditions; and (iii) the EMP. (ii) Translate the EMP into Chinese-language and ensure that it remains consistent with
this original version in English-language. (iii) Ensure the EMP is implemented by the contractors, and that all contractors and
PIUs comply with the EMP. (iv) Implement the Grievance Redress Mechanism (Section G). (v) Prepare and submit semi-annual environmental monitoring reports to ADB.
9. Environmental Monitoring Station (EMS). In each project county, the EMS of the Environment Protection Bureau (EPB) will be contracted by each PIU to implement the external environmental monitoring program described in this EMP. The CPMO will supervise this monitoring. Each EMS will report to the local EPBs and CPMO. Each EMS will be identified in the project procurement plan. 10. Loan Implementation Environmental Consultant (LIEC). A LIEC will be hired under the loan implementation consultancy services. The terms of reference for this position are in Annex B. The LIEC is essential to completion of environmental pre-construction activities and should be recruited as soon as possible after loan effectiveness. The LIEC will assist the PPMO Environmental Officer with the following.
11. PIUs. The PIUs will implement project components, administer and monitor contractors and suppliers, and be responsible for construction supervision and quality control at each subproject site. The PIUs and their construction contractors will be responsible for implementing the EMP mitigation measures during construction, under the supervision of the CPMO. The contractors will need to understand their requirements under the EMP. Each contractor will be required to assign a specific member of their work team who will be responsible for the team’s environmental, health and safety management. The contractors will work with the CPMO Environmental Officers, and LIEC, to ensure that prior to any works, the EMP is jointly reviewed and any site-specific measures are identified and agreed. C. Project Readiness Inspection 12. Before construction, the LIEC will assess each PIU’s readiness in terms of environmental management based on a set of indicators (Table A1.1) and report it to ADB and PPMO. This assessment will demonstrate that environmental commitments are being carried out and environmental management systems are in place before construction starts, or suggest corrective actions to ensure that all requirements are met. Some of these commitments are particularly important because information relating to them was either not submitted in the PPTA phase or submitted too late in the PPTA phase for proper resolution. These include compliance with loan assurances relating to (i) the impacts of in-stream weirs and (ii) the need to protect an important heritage site.
Qualified environmental monitoring stations contracted by CPMOs
Yes No
Compliance with loan covenants and assurances
The borrower complies with loan assurances related to project design and environmental management planning
Yes No
Public involvement effectiveness
Meaningful consultation completed Yes No
GRM established with publicized entry points Yes No
88
Indicator Criteria Assessment
Contracts with environmental safeguards
Bidding documents and contracts incorporating the environmental activities and safeguards listed as loan assurances
Yes No
Site construction planning
Site construction plan prepared for each PIU. Yes No
Water extraction permits/approvals
For PIU irrigation systems Yes No
EMP financial support
The required funds have been set aside for EMP implementation by each PIU
Yes No
D. Summary of Potential Impacts and Mitigation Measures 13. Potential environmental issues and impacts during the pre-construction, construction and operation phases, and corresponding mitigation measures, are in Table A1.2.
89
Table A1.2: Summary of Potential Impacts and Mitigation Measures
Confirm that final slopeland boundaries of subprojects avoid regrowth natural forest and shrubland as agreed in screening.
CPMO LIEC, PPMO
Water extraction permission
Obtain a water use permit for water inputs from the local Water Resources Bureaus – providing all details required for that application to the WRB
PIU Local WRBs, CPMO, LIEC
1.2 Project environmental Support
Establish and implement environmental support positions
Contract a Loan Implementation Environmental Consultant (LIEC) PPMO ADB
Contract Environmental Monitoring Stations in each county for external monitoring PIU CPMO, LIEC
Appoint Environmental Officers at PPMO and CPMOs PMO CPMO, LIEC
Assign environment officers at each PIU PIU CPMO, LIEC
1.3 Construction Preparation Stage
Update EMP
Update mitigation measures defined in this EMP based on the detailed design. DI, PIU CPMO, LIEC, ADB
Construction plans and documents
Prepare environment section in the terms of reference for construction bidders;
Prepare environmental contract clauses for construction, using reference to EMP and monitoring table.
PIU (using DIs)
CPMO, LIEC
Establish and publicize GRM
Identify GRM entry points and brief them on their role;
Publicize GRM entry points, people and contacts at each PIU construction site, in local newspapers, websites and village committee and community premises before construction commences
PMO PCG, LIEC, ADB
Construction site planning
Prepare Site Construction Plans including appropriate parts for each PIU from the project EMP, including an environmental health and safety plan
Nominate an Environmental, Health and Safety Officer (EHSO) in contractors’ team
Develop site environmental health and safety plan.
PIU and contractors
CPMO, LIEC
Environmental Training
LIEC to provide training on implementation and supervision of environmental mitigation measures to contractors (see Table A1.7)
LIEC PPMO
Construction
2.1 Air Quality Local air pollution from construction activities
Material stockpiles and concrete mixing equipment will be equipped with dust shrouds.
Earthworks to prepare site should be undertaken just before commencement of construction to avoid long term stockpiling.
Vehicles transporting potentially dust-producing materials will have proper fitting sides and tail boards and covered with protective canvasses;
On-site movement of cement bags should not overload people or vehicles to minimize bag rupture and spillage;
Unauthorized burning of waste plant material during land preparation shall be subject to penalties for the Contractor, and withholding of payment.
For villages within the noise impact distance from construction operations:
Erect temporary noise barriers between work site and residents where less than 35m apart.
Daily construction schedules will be arranged to prohibit work in lunch break and at night.
Villagers will be notified before construction activities which emit high noise levels are scheduled.
The construction schedule will be arranged to avoid multiple large-scale and noise emitting machinery operating simultaneously.
To avoid noise impacts on sensitive points along the main road from transport vehicles the construction unit will reduce the number of vehicles and traffic flow, set speed limits and prohibiting the use of the horn in villages.
Contractor, PIU
CPMO
2.2 Soil stability
Erosion and siltation
Implement erosion controls set out in Soil and Water Conservation Law of PRC.
Terraces and soil tillage will be conducted along contours and keeping vegetation between contour terraces to prevent soil erosion.
For new terraces and crops, the time and degree of exposure to erosive forces must be minimized.
Special scrutiny on erosion control will be directed to the following subprojects due to the large scale of earthworks planned: Youxi County Yangzhong Xinkaicheng Urban Construction Co., Ltd; Ninghua State-owned Ecological Forestry Co. Ltd; Longyu Ecological Industry Development Co., Ltd
Contractor, PIU
CPMO
2.3 Water quality
Pollution of surface water and groundwater
Oil traps provided for service areas and parking areas, and oil-water separators are installed before the sedimentation tank for oil-containing wastewater;
All construction machinery repaired and washed at special repairing shops. No on-site machine repair and washing shall be allowed;
Storage facilities for fuels, oil, and other hazardous materials within secured areas on impermeable surfaces, and provided with bunds and cleanup kits;
The contractors’ fuel suppliers to be properly licensed, follow proper protocol for transferring fuel, and are in compliance with Transportation, Loading and Unloading of Dangerous or Harmful Goods (JT 3145-88)
Contractor PIU
Embankments To avoid impact to downstream reaches on flows and turbidity, impact mitigation for embankment construction along streams in valley floor cropping areas will:
schedule construction work for October to February,
setback 20 m from the stream banks
retain all trees currently existing along the banks
retain “soft” earthen and vegetated foreshores plant the embankments with grass and shrubs.
Contractor PIU
2.4 Biodiversity
Habitat protection
To protect the regrowth natural forests and shrublands not within the footprint of the subproject developments but on their borders from careless and unplanned construction activities:
Minimize the areal extent of construction activities being undertaken at any time.
Ensure strictly assigned to work areas and access corridors as part of site planning and without occupying land randomly.
Construction machinery and construction materials will not be placed in naturally vegetated areas.
Ensure stockpiles do not overflow onto naturally vegetated areas.
After the completion of the project, cleaning and greening work shall be carried out to restore any damage.
Habitat enhancement
Shelterbelt forests of native species indigenous to the region will be developed to protect plantations on sloping land from winds and drying out.
PIUs CPMOs
2.5 Physical cultural resources
Protection of heritage site
The Yongding Longyu subproject PIU will ensure that:
No vehicles hauling materials or equipment to and from the site will be allowed to pass through the World Heritage site core and buffer zone.
Transport routes, confirming this prohibition will be included in the Yongding subproject Site Construction Plan
Damage to any trees or shrubs on the ridgetop, which provides a backdrop to the World Heritage site will be strictly prohibited.
Contractor and PIU
CPMO, Yongding Cultural Relic Bureau
Protection of chance finds
Chance find procedures in line with PRC government procedures will be established for undiscovered underground cultural or historic sites that might be identified during project implementation.
Contractor and PIU
CPMO, County Cultural Relic Bureaus
2.6 Construction waste
Solid waste generated by construction activities and from workers’ camps
Provide waste collection and storage containers at locations away from surface water or sensitive receivers.
Arrange with municipal waste collection services for regular collection of waste.
Properly remove and dispose residual materials, and wastes. Paving or vegetating shall be done as soon as the materials are removed to stabilize the soil.
Contractor and PIU
CPMO
2.7 Health and safety
Community safety
Plan construction activities so as to minimize disturbances to residents, utilities and services.
Implement safety measures around the construction sites to protect the public, including warning signs to alert the public to potential safety hazards, and barriers to prevent public access to construction sites.
Negotiate haulage truck and machinery movements with village committees to ensure that village activities (market days etc) and residential roads are minimally impacted by construction traffic.
Contractor and PIU
CPMO
Construction worker safety
Take all reasonable steps to protect any person on the site from health and safety risks;
Make the construction site a safe and healthy workplace;
Make machineries and equipment areas safe;
Provide adequate training or instruction for occupational health and safety;
Provide all workers with personal protection equipment;
Implement adequate supervision of safe work systems;
Provide means of access to and egress from the site without risk to health and safety.
The contractors’ performance and activities for occupational health and safety shall be incorporated in their monthly progress reports;
All activities will comply with the Labour Law of the PRC, the Labor Contract Law of the PRC, and the Special Rules on the Labor Protection of Female Employees.
Operation
3.1 Water Impact on surface water quality from agricultural chemicals
Minimize use of chemical fertilizer through soil testing and crop management. Maximize use of organic fertilizers and straw mulches.
Reduce chemical pesticide use by: selection of seedlings with disease and insect resistance, introduction of nursery stock quarantine, cultivation measures to improve plant resistance to disease and insect pests including removal of diseased plants, pest capture on a population scale using light traps and sticky traps at high density at crops’ insect-prone periods.
PIU CPMO
3.2 Soil stability
Erosion and siltation
On the steeper slopes, slope-reversed terraces (higher elevation at the outside of the terrace than on the inside) will be equipped with bamboo-joint ditches on the lower edge inside the terrace to harvest runoff and collect eroded soil materials.
At the lower elevation part of the tea gardens, interception dam and rainwater harvest ponds will be maintained to store this rainwater for irrigation and to store sediments eroded from the tea gardens.
On the more gentle slopes erosion will be prevented by planting on the contour with protective ridges.
As with the terraces, grassed waterways are used to channel runoff water into collector structures (ponds or concrete tanks).
During crop management, PIUs will implement erosion controls set out in Soil and Water Conservation Law of PRC.
PIU CPMO
3.3 Waste n
Unplanned or unsound disposal of agricultural wastes
All biomass waste from cultivation, pruning and weeding will be reused on site either for composting or mulch. No waste will be burnt.
Residue of agricultural plastic film left in the soil will be minimized by (i) film mulching practices which optimize the timing of mulching and timely removal of film to shorten the mulching period; (iii) use of biodegradable polymer agricultural plastic film; (iv) where film is not degradable, promotion of agricultural plastic film recovery and recycling.
PIU CPMO
Fertilizer and pesticide packaging
Packaging for fertilizers will be recycled by farmer households, or subproject enterprises
For pesticide packaging, the following measures will be implemented: - Training will be conducted for farmers involved in the subprojects, on chemical packaging
handling and recycling; - For pesticide packaging and containers, the PIUs will record all the utilization of pesticide,
and require staff and farmers to return the empty packages to the PIU.
- The PIU will ensure segregation of the pesticide waste at the subproject site from all other waste and will ensure that it is managed/disposed of by the county authorities with other toxic and hazardous waste that they collect.
3.4 Health and safety
Health and safety of operating staff
Operating staff to be protected from workplace hazards:
In the operations phase of the project, staff engaged in the running of the facility including agricultural activities and irrigation systems will be issued with personal protective gear appropriate to the task.
All electrical connections in the subprojects will be completed and periodically checked by qualified electricians.
The openings of all water storage tanks at ground level will be fenced and gated to prevent accidents.
The PIUs and contractors will apply strict health and safety protocols for staff in the handling, application and clean-up of agricultural chemicals. These protocols will be in full compliance with the PRC’s Regulations on Safe Management of Hazardous Chemicals (Decree 591)
PIU CPMO
ADB = Asian Development Bank; EIA = Environmental Impact Assessment; EPB = Environment Protection Bureau; PIU = Participating Implementing Unit; DI = Design Institute; O and M = operation and maintenance; CPMO = county project management office; PPMO = provincial project management office; PRC = People’s Republic of China; WRB = water resources bureau.
94
E. Monitoring and Reporting 14. Three types of project monitoring will be conducted under the EMP: (i) internal monitoring and supervision and reporting by each PIU; (ii) EMP implementation monitoring and progress reporting by the LIEC; and (iii) environmental compliance monitoring by local EMSs. 15. The project monitoring program focuses on the environment in the project areas of influence in the 13 project counties (Tables A1.3a and A1.3b). The program covers the scope of monitoring, monitoring parameters, time and frequency, implementing and supervising agencies, and estimated costs. The monitoring shall comply with the methodology provided in the relevant national environmental monitoring standards and national environmental quality standards of air, surface water, groundwater and noise, and the pollutant discharge standards (Table A1.4). 16. Internal monitoring and supervision. During construction, the PIUs will be responsible for conducting internal environmental monitoring in accordance with the monitoring plan (Table A1.3a). Results will be reported through the PIU reports to the CPMOs. 17. EMP implementation monitoring and progress reporting. The LIEC will review project progress and compliance with the EMP based on field visits, and the review of the environmental monitoring conducted by the EMS. The findings of the LIECs will be reported to ADB through the semiannual EMP monitoring and progress reports. The reports will include (i) progress made in EMP implementation, (ii) overall effectiveness of the EMP implementation (including public and occupational health and safety), (iii) environmental monitoring and compliance, (iv) institutional strengthening and training, (v) public consultation (including GRM), and (vi) any problems encountered during construction and operation, and the relevant corrective actions undertaken. The LIEC will help PMO prepare the reports and submit the English report to ADB for appraisal and disclosure. 18. Environmental compliance monitoring by local EMS. The PIUs in each city or county will contract the city or county EMS to conduct environmental monitoring in accordance with the monitoring program (Table A1.3b). A detailed cost breakdown will be provided by the county EMS when the environmental monitoring program is updated at the start of each component implementation. Monitoring will be conducted during construction and operation period, until a PCR is issued. Semi-annual monitoring reports will be prepared by the EMSs and submitted to CPMOs and the PIUs. 19. The environmental monitoring results will be compared with relevant PRC performance standards (Table A1.4). Non-compliance with these standards will be highlighted in the monitoring reports. Monitoring results will be submitted to the CPMOs and then reported by the PPMO to ADB in semi-annual environmental monitoring reports (prepared with the support of the LIEC; Table A1.5).
95
Table A1.3a: Internal Environmental Monitoring Program
Variable Location Parameter Frequency &
Duration Implement
Cost (per PIU/year)
CNY
Construction Stage
Water environment Downstream of nearest surface waterbody which receives site runoff
Visual inspection for turbidity and oil in water
Weekly PIU 3,000
Air environment At villages near subprojects Visual inspection for dust intrusion into village
Weekly PIU 4,000
Acoustic environmental
At villages near subprojects Hand held noise meter (dB(A) - maximum level over 10 mins and 10 min average)
Weekly PIU 5,000
Operational Stage
Water environment Downstream of nearest surface waterbody which receives site runoff
Visual inspection for turbidity and oil in water
Monthly and after heavy rain
PIU 3,000
Erosion
For subprojects with highest erosion potential* all sloping areas during cultivation and growth.
Cultivation practices to maximize coverage of bare earth, and time and degree of exposure to erosion.
Monthly and after heavy rain
PIU -
Shelterbelt growth Shelterbelt plantations established on site
Visual inspection and recording of growth and replacements
Quarterly PIU 4,000
Pesticide use All subproject enterprises
Inventory of all pesticide use including:
Disease/pest
Product name
Application rate and time
Result
Ongoing, as required PIU 6,000
Total 25,000 CPMO = county project management office; LIEC = loan implementation environment consultant; PPMO =provincial project management office.* Youxi County Yangzhong Xinkaicheng Urban Construction Co., Ltd; Ninghua State-owned Ecological Forestry Co., Ltd; Fujian Ninghua County Ninghua Science and Technology Co., Ltd; and Longyu Ecological Industry Development Co. Ltd
96
Table A1.3b: External Environmental Monitoring Program
County Phase Variable Location Indicator Frequency Unit cost per
session Cost
(CNY) Agency
Super- vision
Remark
Wuyishan
Construction
Water Wufu Creek (2 sections) pH, SS, COD, Petroleum 2 times/year, 1 day/time 2,000 12,000
EMS Wuyishan
EPB 3 years for
construction
Air 6 points near Wengdun, Xingxian, Wuyi, Wufu, Tianwei, Dajiang, Maochang, Xiwei & Diancun villages
construction Air 2 points near Wuqu and Dahan villages
TSP, PM10 4 times/year, 2 days/time 1,000 12,000
Noise LAeq 4 times/year, 1 day/time 600 7,200
Operation Water quality of
nearby rivers 2 creeks: Xietan, Huotong
pH, SS, COD, BODs, TP, NH3-N
2 times/year 2,000 4,000 EMS Shouning
EPB 1 year after the
project operation
Sub-total 35,200
GRAND TOTAL 697,600
BOD = biological oxygen demand; COD = chemical oxygen demand; EMS = Environmental Monitoring Station; EPB = Environment protection Bureau; O&M = operation and maintenance; CPMO = County Project Management Office; PIU = Project Implementing Unit, TN = total nitrogen, SS = suspended solids. TP = total phosphorous, TSP = total suspensed particles; NH3-N = ammonium nitrate.
100
Table A1.4: Monitoring Indicators and Applicable PRC Standards
Phase Indicator Standard
Construction Dust at PIU boundary Air Pollutant Comprehensive Emission Standard (GB16297-1996)
Dust at nearby village(s)
Class II Ambient Air Quality Standard (GB 3095-1996)
Noise limits at boundary of PIU
Emission Standard of Environmental Noise for Boundary of Construction Site (GB 12523-2011)
Surface water quality Surface Water Ambient Quality (GB3838-2002). The target standard for each monitoring site is the existing (pre-construction) quality class
Operation Surface water quality Surface Water Ambient Quality (GB3838-2002). The target standard for each monitoring site is the existing (pre-construction) quality class
20. Environmental acceptance reporting. Following the PRC Regulation on Project Completion Environmental Audit (MEP, 2001), within three months after the completion of each subproject, an environmental acceptance report for each subproject shall be prepared by a licensed environmental monitoring institute. The report will be reviewed and approved by the Fujian EPD and reported to ADB (Table A1.5). The environmental acceptance reports of the component completions will indicate the timing, extent, effectiveness of completed mitigation and of maintenance, and the needs for additional mitigation measures and monitoring during operations.
Table A1.5: Reporting Plan
Reports From To Frequency
Pre-construction Phase
Project readiness
Project Readiness report LIEC ADB Once before construction
Construction Phase
External environmental monitoring
Environmental monitoring report
Qualified environmental
monitoring stations
Local EPBs,
CPMOs
Quarterly
Compliance monitoring
Environment progress and monitoring reports
PPMO, LIEC ADB Semi-annual
Acceptance report
Environmental acceptance report
Licensed acceptance
institute
Local EPB, EPD
Once; within 3 months of
completion of physical works
Operational Phase
Compliance monitoring
Compliance with EMP measures report (first year of operation)
LIEC ADB Quarterly
External environmental monitoring
Environmental monitoring report (first year of operation)*
* monitoring from the date of the acceptance report
F. Training 21. The capacity of the CPMO and the PIUs staff responsible for EMP implementation and supervision will be strengthened through training. This will impart an understanding of the
101
goals, methods, and practices of project environmental management. Initially the training will be in formal workshops but will extend to on the job training by the LIEC as he/she visits construction sites. 22. The training will cover EMP implementation, supervision, and reporting, and on the Grievance Redress Mechanism (Table A1.6). Training will be facilitated by the LIEC with support of other experts under the loan implementation consultant services. Attendees from the PIUs will be staff nominated to oversee EMP implementation and supervising engineers.
Table A1.6: Training Program
Training Attendees Contents Times Days Participants
Once prior to, and once after the first year of project implementation
2 70 600 84,000
Grievance Redress Mechanism
All “project agencies”
Roles and responsibilities, Procedures
Once prior to, and once after, the first year of project implementation
1 30 600 18,000
Environmental protection and monitoring
CPMO and PIUs
Pollution control on construction sites (air, noise, waste water, solid waste)
Once (during project implementation)
1 30 600 18,000
Chemical package handling and recycling
PIUs, agricultural contractors and farmers
Safe handling and procedures for inventorying packages and containers.
Once (during project implementation)
1 30 600 18,000
Total estimated cost: 138,000
Note. All costs, including training, were estimated by the PPTA team based on experience in similar projects
G. Grievance Redress Mechanism 23. A Grievance Redress Mechanism (GRM) has been established as part of the project EMP to receive and manage any public environmental and/or social issues which may arise due to the Project. The project agencies will ensure that potentially affected communities are informed on GRM at an early stage of the project. 24. Project agencies (i.e. those directly involved in the project) comprise the Provincial, Municipal and County PMOs, PIUs, contractors, and village committees. The PPMO is the lead agency responsible for overall management, implementation, and reporting of the GRM. The PPMO Environment Officer coordinates the GRM and will: (i) establish a simple registry system to document and track grievances received (including forms to record complaints and how they have been resolved); and (ii) report on progress of the GRM in the semi-annual environmental monitoring and progress reports to ADB. 25. The CPMOs will coordinate the GRM at the local level. The CPMO Environment Officers will (i) instruct the concerned PIUs and contractors on their responsibilities in the GRM; (ii) establish liaison with PIUs and contractors to ensure that all complaints received and immediately resolved by them are reported, and that more difficult issues are referred to the CPMO; and set up their own recording system for gathering GRM data and passing it on to the PPMO.
102
26. All contractors and work staff will be briefed by the CPMO on the GRM. Contractors and workers will be instructed to be courteous to local residents and, in the event they are approached by the general public with an issue, to immediately halt their work and report the issue to the foreman. (ii) at least one sign will be erected at each construction site providing the public with updated project information, the GRM process, and contact names and details for the GRM entry points. 27. Prior to project construction, the CPMO and will notify all relevant agencies about the project and GRM, so that if these agencies receive complaints, they know to contact the PMO and follow up as necessary. This will include, but not be limited to, local EPBs, the local courts, and police. 28. The procedure and timeframe for the GRM is shown in Figure A1.1 and is as follows: Environmental Complaints Stage 1 (maximum 5 days). Affected persons or groups can submit a written or oral complaint to the project enterprises and contractors as well as village committee as they wish to. These agencies take following actions in Stage 1 if they receive a complaint.
(a) Step 1. Project agency receives complaint and assesses if the complaint is eligible.
Eligible complaints include those where (i) the complaint pertains to the project; and (ii) the issues fall within the scope of environmental and social issues that the GRM is authorized to address.
(b) Step 2a—Eligible complaints. The agency attempts to resolve the issue directly with the affected person. Within 2 days of receiving the complaint, the agency will provide clear advice to the affected person on the proposed corrective action and by when it will be taken. In general, the corrective action(s) will be implemented not later than 5 days from this point. If quick corrective action is not possible, or the agency receiving the complaint is unsure how to proceed, or the complainant is not satisfied by the initial corrective action, then the complaint will be referred to the CPMO and Stage 2 actions.
(c) Step 2b—Ineligible complaints. If a complaint is assessed to be ineligible, the project agency meets with the affected person and informs them, and will ask the affected person if they would like to be referred to relevant agencies.
(d) Step 3. The project agency submits all documentation on the case to CPMO. This will include making a written record of any oral complaints.
Stage 2 (maximum 10 days). For complaints not resolved in Stage 1, Stage 2 is initiated.
(a) Step 1: The CPMO environment and/or social officers will meet with the affected person and together discuss the issue and identify possible solutions. At the meeting, a possible solution will be agreed upon. The subject agency (e.g., contractor, the PIU, village committee) will implement the agreed solution and report the outcome to the CPMO within 5 days of receipt of this advice.
(b) Step 2: if the Step 1 is unsuccessful (i.e. no solution can be identified or the affected person is not satisfied with the proposed solution), the CPMO will refer the complaint to the county project leading group (CPCG). The CPCG will work with all stakeholders (CPMO, APs, and related county administrative bureaus) to identify a solution acceptable to all. The agreed solution will be implemented within 5 days and progress reported to the PPMO.
Stage 3 (maximum 10 working days). For complaints not resolved in Stage 2, Stage 3 is initiated (similar principal and procedures as stage 2), and PPMO will take lead to address and solve the complaints, or coordinating with its level PCG and administrative departments.
103
29. If the above is diligently undertaken, and is still unsuccessful, people adversely affected by the project may submit complaints to ADB’s Accountability Mechanism.32 Land Contract Complaints 30. For any affected persons related to land contract, land transfer or forestland rights complaints, they can also complain to the Land-contracted Dispute Arbitration Committee. The acceptance and arbitration time follows "PRC laws in dispute mediation and arbitration in rural land contract and management". After the adjudication has been by the Committee, the APs and project enterprises have to implement it if no prosecuting will be made to the Court within 30 days.
AP = affected person, EPB = environmental protection bureau, PMO = project management office; PIU = project implementing unit.
Figure A1.1: Project Grievance Redress Mechanism for social and environmental issues.
105
31. No part of the project GRM affects the rights of an affected person to take their complaints to the higher level of administrative agencies or courts. At any time in this process, an affected person may contact ADB (East Asia Department) directly, including ADB’s Resident Mission in the PRC. 32. Any costs incurred to receive document and address grievances will be paid by the PPMO or with regard to relevant laws and regulations (No charge from complaints). 33. The tracking and documenting of grievance resolutions by the PPMO will include the following elements: (i) tracking forms and procedures for gathering information from project personnel and complainant(s); (ii) regular updating of the GRM database by the PPMO Environment Officer; (iii) processes for informing stakeholders about the status of a case; and (iv) a simple but effective filing system, so that data can be retrieved for reporting purposes, including reports to ADB. H. EMP Cost Estimates 34. The cost for EMP implementation comprises three items: mitigation measures (Table A1.2), environmental monitoring (Tables A1.3a–b), and training (Table A1.6). The costs are summarized in Table A1.7. Excluded from the budget are (i) detailed design revisions and adjustments, (ii) infrastructure costs which relate to environment and public health but which are already included in the project direct costs, and (iii) remuneration for the PPMO and CPMO Environment Officers and loan implementation consultants. Costs were developed by the PPMO and PPTA team based on the costs of similar projects and team experience. 35. The PIUs will pay for compliance environmental monitoring costs during construction and initial operating phase. The PIUs and their contractors will pay for all mitigation measures during construction, including those specified in the contract documents and any unforeseen impacts due to construction activities. The PPMO and PIUs will bear the costs related to environmental supervision during construction and operation respectively. The PPMO will bear the costs for training, the GRM, and the LIEC.
106
Table A1.7: Summary of EMP Budget for Five Years. See Tables A1.2, A1.3a–b, and A1.6 for breakdown of costs (CNYx103).
PMO = project management office (both provincial and county-level).
107
ANNEX 1: TERMS OF REFERENCE FOR PROJECT ENVIRONMENTAL POSITIONS I. BACKGROUND 1. The PPMO is responsible for project implementation and comprises the provincial agencies involved in the project. The CPMO is engaged in the day-to-day management of the project and deals directly with the PIUs and their subprojects. 2. Compliance with the Loan and Project Agreements includes implementation of an Environment Management Plan (EMP), which is prepared as part of the project environment impact assessment. The EMP is the critical guiding document to manage, monitor, and report upon potential project environmental impacts. Implementation of the EMP is a full-time task. For this reason, the PPMO and CPMOs assigns full-time officers for this role. These terms of reference describe the requirements for these officers. 3. Both the PPMO and CPMO Environment Officers will work on behalf of their agency to implement the project EMP. The positions are for the entire project duration (five years). II. DETAILED TASKS
PPMO Environment Officer 4. The PPMO Environment Officer will have a detailed understanding of the project EMP and supporting documents, including the domestic environmental reports, the project IEE, and project environmental assurances. The officer will be responsible for the following:
(i) Assess whether the EMP requires updating due to any changes in project design which may have occurred after the EMP was prepared.
(ii) Distribute the Chinese language version of the EMP to all relevant agencies, including the implementing agencies, provincial and municipal agencies for environment protection, forestry, water resources, and/or land planning, contractors, and construction supervision companies. This should occur at least three months before construction begins.
(iii) Conduct meetings with agencies as necessary to ensure they understand their specific responsibilities described in the EMP.
(iv) Ensure that relevant mitigation, monitoring and reporting measures in the EMP are included in the bidding documents, contracts and relevant construction plans.
(v) At least two months before construction begins, establish and implement the project Grievance Redress Mechanism (GRM) described in the EMP. This will include: (a) prepare a simple table and budget identifying the type, number and cost of materials needed to inform local communities about the GRM and starting dates and scope of construction; (b) design, prepare and distribute these materials, and plan and conduct the community meetings; (c) prepare a form to record any public complaints; (d) prepare a summary table to record all complaints, including dates, issues, and how they were resolved; and (e) ensure that all relevant agencies, including contractors, understand their role in the GRM.
(vi) Prior to construction, ensure that PIUs and their contractors have informed their personnel, including all construction workers, of the EMP requirements. This will include all mitigation measures relating to impacts to air, water, noise, soil, sensitive sites, ecological values, cultural values, worker and community health and safety, respectful behavior when communicating with local communities, and responding to and reporting any complaints.
(vii) During project construction, regularly meet with CPMO Environment Officers and review subproject implementation progress and compliance with the EMP.
(viii) Compile, review, and store environmental progress reports from the CPMOs, records of any grievances, and any other relevant issues. Maintain digital copies of all information. When necessary, enter data into summary tables in digital format (e.g. to transfer records of grievances from hard copy forms). Ensure that all information is stored in the PMO filing system, backed up, and can be easily retrieved.
(ix) Prepare semi-annual environment progress reports on behalf of the PPMO.
CPMO Environment Officers
108
5. The CPMO Environment Officers will have a detailed understanding of the project EMP and project assurances as they apply to their county and subprojects and supporting documents, including the domestic environmental report for the county and the technical appendices of the PPTA DFR. The officers will be responsible for the following:
(i) Work closely with the PPMO Environment Officer to ensure that final subproject designs comply with the requirements set out in the EMP and project assurances.
(ii) Distribute the Chinese language version of the EMP to all relevant agencies at the county and township level, including the agencies for environment protection, forestry, water resources, village committees, and contractors. This should occur at least three months before construction begins.
(iii) Conduct meetings with agencies as necessary to ensure they understand their specific responsibilities described in the EMP.
(iv) Ensure that relevant mitigation, monitoring and reporting measures in the EMP are included in the bidding documents, contracts and relevant construction plans.
(v) At least two months before construction begins, establish and implement the project Grievance Redress Mechanism (GRM) described in the EMP. This will include ensuring that the GRM is publicized at and around the sites and the preparation of local record-keeping spreadsheets.
(vi) During project construction, make regular site visits to assess progress, meet with contractors and/or local communities, and assess compliance with the EMP.
(vii) Work closely with PIUs, loan implementation consultants, PPMO Environment Officer and other county agencies and personnel as necessary to conduct these tasks.
109
TOR for Loan Implementation Environmental Consultant I. BACKGROUND 1. The Fujian Farmland Sustainable Utilization and Demonstration Project, Fujian province, People’s Republic of China (PRC) will be implemented by 21 agricultural enterprises distributed among the 13 counties engaged in tea and tea-oil production on slopeland areas as well as other cropping including rice, in the valley floors. These enterprises will comprise both State Owned Enterprises (SOE) and Project Participating Enterprises (PPE), collectively called Project Implementing Units (PIUs). 2. Project implementation will be overseen and coordinated by a Provincial Project Management Office (PMO), established within the Provincial Department of Agriculture. The PPMO will be assisted by a Loan Implementation Consultant team. The Loan Implementation Environmental Consultant (LIEC) will be a part of this team and will assist the PPMO with implementation of the project Environmental Management Plan (EMP). II. SCOPE AND DURATION OF WORK 3. This position could be a firm or an individual engaged by the PPMO. It is an independent position. It is not part of the PPMO in-house environmental team or any PIU. The specialist will report directly to the PPMO. The position is for 10 person-months spread over the entire project duration (5 years). The LIEC should be recruited as soon as possible after loan effectiveness, as their first task is to confirm project environmental readiness (EMP Table A1.1). III. QUALIFICATIONS
4. The specialist will have: (i) an undergraduate degree or higher in environmental management or related field; (ii) at least five years of experience in environmental management, monitoring, and/or impact assessment; (iii) familiarity with ADB project management requirements and national environmental management procedures; (iv) ability to communicate and work effectively with local communities, contractors, and government agencies; (v) ability to analyze data and prepare technical reports; (vi) willingness and health to regularly visit the subproject sites; and (vii) proficiency in spoken and written English. IV. TASKS
Before construction
(i) Ensure project environmental readiness, including: (i) checklist in Table A1.1 of the EMP is achieved; (ii) all contractor contracts include, and will comply with, the EMP; and (iii) relevant sections of the EMP are incorporated in construction plans and contracts.
(ii) Ensure that relevant sections of the project EMP are incorporated in the construction contract documents.
(iii) Assist the PPMO to implement the GRM, including: (i) establish and publicize the GRM; and (ii) collate and evaluate grievances received.
(iv) Develop procedures to: (i) monitor EMP implementation progress; (ii) collate and evaluate data collected in the EMP environmental monitoring program; and (iii) prepare and submit the semi-annual environmental monitoring reports to ADB (until Project Completion Report).
(v) Provide hands-on support and on-the-job training to the CPMOs, PIUs and contractors on the specific requirements of the EMP as required.
During project implementation
(i) Undertake site visits to all PIUs during subproject construction and operating phase. (ii) Conduct EMP compliance assessments, identify any environment-related implementation
issues, and propose necessary responses in corrective action plans. (iii) Assist PPMO to prepare semi-annual environmental monitoring progress reports for
submission to ADB.
110
ATTACHMENT 2: EROSION PREDICTION CALCULATIONS This is a simple calculation, combining the area of sloping land and the area of valley floor flat land involved in the subprojects, with the potential soil erosion modulus for each (from PRC Technical Method Guidelines). The predicted total potential soil erosion is the addition of the two.
County PIU Village Area of valley
floor (mu)
Area of slopeland
(mu)
Current soil erosion potential
Potential soil erosion (t/a)
Macro soil erosion
(mu)
Erosion modulus (t/km
2.a)
Light soil erosion (mu)
Erosion modulus (t/km
2.a)
Wuyishan
Wuyishan Zhuzi Ecological Agriculture Co., Ltd
Wengdun
13000
500 500 410 136.67
Xingxian
Wuyi 200 200 410 54.67
Wufu
Tianwei 350 350 410 95.67
Maochang
Dajiang
Xiwei 150 150 410 41.00
Diancun 800 800 410 218.66
Sub-total 9 13000 2000 2000 546.66
Guangze
Fujian Zhengyuan Ecological Food Town Co., Ltd
Baimenlou
743 703 188 40 410 99.04
Daoshi 361 1354 1284 188 70 410 180.06
Hutang 192 182 188 10 410 25.54
Qinmu 265 250 188 15 410 35.43
Shanguan 142 132 188 10 410 19.28
Shuikou 219 209 188 10 410 28.93
Zhima 564 534 188 30 410 75.13
Paixia 107 101 188 6 410 14.30
Meixi 95 89 188 6 410 12.79
Qiaoting 365 345 188 20 410 48.71
Dongshan 742 712 188 30 410 97.44
Pingxi Farm 629 594 188 35 410 84.01
Guanmi 570 534 188 36 410 76.77
Lifang 139 129 188 10 410 18.90
Shicheng 233 218 188 15 410 31.42
Wudun 298 278 188 20 410 40.31
Sub-total 16 361 6657 6294 363 888.06
Datian Fujian Datian County Golden Phoenix
Agricultural Development Co., Ltd
Pingshan 400 4000 3765 188 235 410 536.11
Meiyang 600 4000 3765 188 235 410 536.11
Neiyang 900 4000 3765 188 235 410 536.11
Ruimei 300 2000 1883 188 117 410 267.98
Keshan 400 3000 2740 188 260 410 414.48
Heyang 2000 1830 188 170 410 275.82
Yangchun 2800 2560 188 240 410 386.45
Jinshan 500 2000 1830 188 170 410 275.82
Wushan 400 3000 2740 188 260 410 414.48
Jiyang 1600 1000 956 188 44 410 131.84
Shangtai 2800 200 180 188 20 410 28.03
111
County PIU Village Area of valley
floor (mu)
Area of slopeland
(mu)
Current soil erosion potential
Potential soil erosion (t/a)
Macro soil erosion
(mu)
Erosion modulus (t/km
2.a)
Light soil erosion (mu)
Erosion modulus (t/km
2.a)
Chashan 1500 500 470 188 30 410 67.11
Dashi 600 1500 1415 188 85 410 200.58
Hengkeng 12000 11322 188 678 410 1,604.33
Jikeng 8000 7000 188 1000 410 1,150.66
Zhanshan 1200
Dongban 1700
3000
Shangjing 1700
Gongqiao 400
Sub-total 19 18000 50000 46221 3779 6,825.89
Youxi
Youxi County Yangzhong Xinkaicheng Urban Construction Co., Ltd
Yangzhong 4726 4564 165 162 410 546.31
Houlou 2896 2796 170 100 410 344.21
Longyang 1546 1496 180 50 410 193.18
Lianyang 1030 995 165 35 410 119.02
Sub-total 4 0 10198 9851 347 1,202.72
Youxi County Shenlang Edible Oil Co., Ltd
Guanyang 1912 1847 170 65 410 227.09
Jishen 2084 2014 175 70 410 254.10
Xiacun 14.5 1500 1450 160 50 410 168.33
Huayang
2522 2432 180 90 410 316.44
Sub-total 8 14.5 8018 7743 275 965.96
Ninghua
Ninghua State-owned Ecological Forestry Co., Ltd
Sunkeng 2842 2452 185 390 410 409.01
Shibian 1124 974 190 150 410 164.37
Fengshan 2483 2143 186 340 410 358.66
Tianbei 2990 2590 200 400 410 454.66
Qiaotou 1694 1464 200 230 410 258.06
Tuanjie 592 512 195 80 410 88.43
Tiankeng 1060 940 180 120 410 145.60
Nantian 1419 1259 200 160 410 211.60
Jiangjia 1943 1723 190 220 410 278.38
Jiangtou 785 695 170 90 410 103.37
Gongqiao 685 615 170 70 410 88.83
Chentang 1183 1053 190 130 410 168.91
Sub-total 12 0 18800 16420 2380 2,729.88
Fujian Ninghua County Ninghua Science and Technology Co., Ltd
500m upstream of Huotong Creek Technology Co., Ltd
3000m downstream of Houtong Creek
Irrigation Water in the project site 1
Irrigation Water in the project site 2
Irrigation Water in the project site 3
Dongqiao Ningde Qilongxiang Agriculture Co. Ltd 2014.6.25 Qiandiping Base Fujian Entry&Exit Inspection and Quarantine Bureau Inspection and Quarantine Testing
Center
SOIL SAMPLING AND ANALYSIS INFORMATION
Project County
Project Implementing Unit Sampling date Site Agency
Project Implementing Unit Sampling date Site Agency
Dongqiao Ningde Qilongxiang Agriculture Co. Ltd
2014.6.25 Qiandiping Base Fujian Entry&Exit Inspection and
Quarantine Bureau Inspection and Quarantine Testing Center
119
ATTACHMENT 4: FUJIAN GOVERNMENT LIST OF APPROVED PESTICIDES AND APPLICATIONS Note: Three of the listed chemicals (omethoate, trizophos and dichlorvos) are listed as ‘highly hazardous’ by the World Health Organization and are excluded from use in the project.
70%托布津 70% Thiophanate-methyl 500倍 attenuation 500 times
for spraying
50%多菌灵 50% carbendazim 500倍 attenuation 500 times
for spraying
脚腐病 Phytophthora
parasitica (Dastur) 托布津 Thiophanate-methyl
先将腐烂树皮切除干净,然后用托布津和新鲜无
杂质黄土搅拌成糊状涂在患病部位。 First, cut
the barks which are rot, and then mix Thiophanate-methyl and loess inclusion-free like pasty and paint on the the body that has become
124
农作物
Crops
病虫害 Diseases and
insect pests 农药名称 Name of pestcide 用量 Usage
安全期 Safe
period Remarks
diseased
马铃薯
Potato
蚜虫 Aphidoidea
2.5%高效氯氟氰菊酯水乳剂
2.5% Lambda-Cyhalothrin emulsion in water 12-17 ml/mu 3 days
每季最多使用 2 次 Maximum use twice every
quarter
10%氟啶虫酰胺水分散粒剂
10% Flonicamid water dispersible granul 30-50 g/mu 7 days
每季最多使用 2 次 Maximum use twice every
quarter
每 100 kg 种薯用 70%噻虫嗪种子处理可分散粉
剂 70% Thiamethoxam powder for dry seed
treatment water dispersible powder for slurry seed treatment in every 100kg potato seeds
10-40 g
用水稀释后喷雾到种薯上充分搅拌,直到药液均
匀分布到种薯表面,晾干后即可。每季最多使用 1
次 attenuation the pestcide with water and stir
them with potato seeds until the liquid distribute uniformity on the surface of the potato seeds and wait them dry. Maximum use once every quarter
蛴螬 Holotrichia
diomphalia Bates
每 100 kg 种薯用 600 g/L 吡虫啉悬浮种衣剂 600
g/L Imidacloprid suspension concentration for seed dressing in every 100kg potato seeds
40-50 ml
兑适量水调成浆状药液,与种薯充分搅拌,直到
药液均匀分布到种薯表面,晾干后即可。每季最
多使用 1 次 uniformity spray with right amount of
water and make them to pasty, stir them with potato seeds until the liquid distribute uniformity on the surface of the potato seeds and wait them dry.Maximum use once every quarter
晚疫病 Phytophthora
infestans
80%代森锰锌可湿性粉剂
80% Mancozeb wettable powder 120-180 g/mu 3 days
每季最多使用 3 次 Maximum three times every
quarter
500 g/L 氟啶胺悬浮剂
500 g/L Fluazinam suspension concentration 27-33 ml/mu 7 days
每季最多使用 4 次 Maximum use four times
every quarter
250 g/L 醚菌酯悬浮剂 250 g/L Kresoxim-methy
suspension concentration 15-20 ml/mu 7 days
每季最多使用 3 次 Maximum three times every
quarter
环腐病 Clavibacter
michiganense subsp.sepedonicum
(Spieckermann&Kotth
off)Davis,Gillaspie,Vidaver and Harris.
每 100 kg 种薯用 70%敌磺钠可溶粉剂 70%
Fenaminosulf soluble granule in every 100kg potato seeds
300g 粉剂兑水 700ml 300g
powder in 700ml water
药液均匀喷雾到种薯表面,晾干后即可。每季最
多使用 1 次 uniformity spray on the surface of
the potato seeds and waiting it dry; Maximum use once every quarter
36%甲基硫菌灵悬浮剂 36%
Thiophanate-Methyl suspension concentration
800 倍液浸种薯 attenuation
800 times with potato seeds
晾干播种;每季最多使用 1 次 seed them when
they are dry; Maximum use once every quarter
Source: Fujian Provincial Department of Agriculture, May 2015.
125
ATTACHMENT 5: WATER DEMAND AND SUPPLY ANALYSIS
1. Overview. Fujian Province possesses 663 rivers, with a total length of 13,569 km in the province and a drainage density of 112 m/km
2. There are more than 597 rivers with over 50 km
2 catchment area,
with a total area of 112,842 km2 and total mainstream length of 3,134 km. There are 67 first-grade
rivers and five rivers with over than 5,000 km2 catchment area. The main rivers and river systems: Min,
Jiulong, Jin, Ting, Jiao are the relatively large river in the Province. The largest river in Fujian is Min River, and Ting River is the only river that flowing into the oceanthrough other province. 2. Water resource characteristics. Uneven spatial and temporal distribution of precipitation. The annual average rainfall in Fujian is 1,667 mm, from northwest to southeast, gradually decreasing from 2,200 mm-1,600 mm. Annual average runoff is 500-1,400 mm. Annual average precipitation during rainy season from March to September accounted for 82.5% of the average annual precipitation, while the five-month from dry season in October to the next February', the rainfall accounted for only 17.5% of the annual precipitation. The rainfall in spring rainy season (March-April), rainy season (May-June), summer (July to September), dry season rainfall (October to next February) is accounting for 16 -27%, 27-37%, 20-30%, 14-22%
33 respectively against the annual average rainfall (Figure A5.1).
Figure A5.1: Annual average rainfall seasonally distribution in Fujian
3. Fujian is abundant in water resources. It has a subtropical marine monsoon climate, backed to the fills and closed to ocean with sufficient rainfall and humidity. The main water resources in Fujian come from precipitation with a total amount of 116.87 billion m
3, the per capita water resource is 3,769 m
3,
which is about 1.64 times against the national level. The unit water resource amount is 6,387 m3, which
is 3.32 times against the national average level. 4. Project infrastructure involving water resources. In the project, it involves valley floor rehabilitation in 6 project counties of 5 municipalities, namely Zherong County in Ningde Municipality, Datian County in Sanming Municipality, Yongding County and Xinluo District in Longyan Municipality, Guangze County and Wuyishan in Nanping Municipality. Since the valley floor such as farmland is near to creaks and rivers, which could provide abundant water resources. Other project areas have already constructed some drainage ditches and irrigation projects. However, without sufficient input and maintenance and management, most of the infrastructure has already been out of date. Currently, most of the project areas have no high standard water conservancy key projects, but some simple dirt ditches for water distribution. For those project areas without streams and rivers go through, agricultural farming essentially depends on the natural condition. In order to expand the water extraction capacity, and supply to farmland in relatively high position, changing the dryland into irrigated farmland, weirs will be constructed in the suitable location of rivers with low-head barrage. 5. Slopeland. Currently, with the investment from the Central to local government authorities, some small amount of tea and tea-oil camellia garden has established sprinkler irrigation and drip irrigation demonstration facilities. Based on local practices, they have conducted terracing project, which converted the original farming mode that would cause water and erosion into contour planting. Water diversion channels, rainfall collection tanks, bamboo joint ditches
34 in terrace have been practiced.
33
Chen Jiajin et al. 2007. Spatial and temporal distribution of agricultural climate resources in Fujian and its impact on agricultural production. China Agricultural Meteorology 28: 1-4.
34 Bamboo joint ditch (called Zhujiegou in Chinese) is one kind of irrigation and drainage works in terrace fields of slope land that created by local people. In Chinese it is named Zhujiegou due to its shape looks like the cutted bamboo joint. It spreads in terrace filelds and parallels to the contour with a gradient of about 1 / 120.
0.00
5.00
10.00
15.00
20.00
25.00
30.00
35.00
Spring Rainy season (3-4)
Rainy Season ( 5-6) Summer Season ( 7-9) 10-2 of Next Year
Pro
po
rtio
ns
(%
)
Seasons
126
These practices have helped for water and soil erosion controlling, also improved soil fertility and water holding capacity. 6. Water availability. Inflow analysis and calculation: the inflow of each irrigation area is ensured based on dependability of irrigation designing (frequency), and conduct typical year analysis. Data is searching from project area nearby hydrological station with similar climate and soil condition. According to hydrological data from hydrological stations, typical distribution of runoff during the year under P = 90% has been analyzed, and runoff will be allocated over the year. 7. Annual rainfall of designed level year: average annual rainfall of the project area is collecting from the "Fujian rainfall contour map," "surface water resource in Fujian", and based on the project counties located and rainfall characteristics, the coefficient of variation Cv will be determinde, Coefficient of skew Cs = 2Cv, and the calculation of precipitation under different frequencies can be calculated. 8. Annual inflow of designed level year = average runoff * catchment area * runoff coefficient of modulus, formula as follows:
Wp = Kp × F × h × 10 million m3
Where: Wp- annual inflow of designed level year (m3)
Kp- runoff coefficient of modulus F- catchment area (km
2)
h- annual average runoff (mm) 9. The available water supply capacity is calculated based on each ten days natural stream amount. To be more specific, if the ten days natural stream supply capacity is smaller than the designed water extraction capacity for channels, the natural stream will be considered as available water supply capacity (all will be extracted). If the ten days natural stream supply capacity is larger than the designed water extraction capacity for channels, the designed capacity will be considered as available water supply capacity. 10. Water demand. The water demand prediction during the design level year is to be conducted based on the weighted average crop irrigation quota per unit area under designed guarantee rate of irrigation water, which is based on the project land utilization planning, main crops structure adjustment, rotation and intercropping methods, and designed irrigation facilities and multiple cropping index and net crop irrigation quota. 11. The irrigation quota of crops, vegetables and fruit trees was selected based on “Water Quota in Different Industries” (DB35/T 772-2013) that issued by Fujian provincial government according to the classification of project zone I and II, crop types and growing season. 12. Gross water consumption can be calculated based on the irrigation water effective utilization index, and net water demand calculated according to net irrigation quota.
13. Calculations are presented in Tables A6.1–3.
Zhujiegou ditches sequentially connect with setting basins and earth weirs. The top of Bamboo joint ditches is usually 10 cm lower than the ground of terrace to facilitate water slow inflow into the next setting basin. On other side of ditchs is usually connected with the main drainage ditch in the slope garden.
127
Table A6.1: Water availability and its monthly distribution in the project area (P = 90%)