Introduction Marine sediments consist of a skeleton of mineral grains and pore space, which is usually occupied by aqueous and gaseous fluids (Maltman 1994). The stabi- lity of the sediment is controlled by the forces between the grains (cohesion) and the pressure of the fluids in the pores (Strout & Tjelta 2005). While the first depends on the mineralogy of the grains, the latter is a function of physical properties such as water content, state of consolidation, or grain size distribution. Varia- bility in one or more sediment physical properties may result in instability and failure. Geological processes, which are capable of causing pore pressure increase and weakening of the sedimentary framework include tec- tonic deformation, earthquakes, rapid sediment accu- mulation, gas-hydrate melting or tidal/storm wave loa- ding (e.g. Hampton et al. 1996; Locat & Lee 2002). In this context, Cone Penetration Tests (CPT) represent a widely used, time efficient method for the in situ cha- racterisation of the physical properties of the sediments and their variability. (Chari et al. 1978; Konrad 1987; Bennett et al 1989; Lunne et al. 1997; Christian et al. 1993; Wright 2004). Standard probes measure the cone and sleeve resistance (as a first order estimate of sedi- ment strength), pore pressure in defined locations (u1, u2,u3), tilt, and temperature (Lunne et al. 1997). Apart from this set of primary data, a number of secondary physical-sedimentary parameters can be calculated. If the insertion pressure and velocity profile during pene- tration of the probe are known, undrained shear strength (Esrig et al. 1977) and consolidation ratio (Bennett et al. 1985) may be derived. As a consequence, CPT tests play a significant role in the assessment of the underground in offshore construction, and the stability of subsurface sediments deposited on continental shel- ves and slopes. In this paper we present the initial results of a recently developed FF-CPT device for soft sediments. In contrast to industrial CPT procedures, where the probe is pushed hydraulically at a constant rate (2 cm/s), our lightweight, cable-controlled lance may be universally deployed. Its modular design, with optionally added weights (up to 60 kg) and extension rods (0.5 m–6.5 m total length) allows us to control the maximum penetration depth and tackle various scien- tific questions. In this manuscript, we provide a "proof of concept" and illustrate how we vary weights, exten- sion rods, and winch speed to accommodate for various settings (soft vs. indurated sediment) and deployment platforms (free-fall mode vs. crane or winch). In addi- tion, long-term testing records of pore pressure dissipa- tion after insertion may help us to assess whether NORWEGIAN JOURNAL OF GEOLOGY Initial Results of a new Free Fall-Cone Penetrometer 199 Initial Results of a new Free Fall-Cone Penetrometer (FF-CPT) for geotechnical in situ characterisation of soft marine sediments Sylvia Stegmann, Tobias Mörz & Achim Kopf Stegmann, S., Mörz, T. & Kopf, A.: Initial Results of a new Free Fall-Cone Penetrometer (FF-CPT) for geotechnical in situ characterisation of soft marine sediments. Norwegian Journal of Geology, Vol. 86, pp. 199-208. Trondheim 2006. ISSN 029-196X. Two of the most crucial sediment physical parameters controlling slope stability and trigger mechanism of mass movements are shear strength and excess pore pressure. Since both of them require in situ measurement, Cone Penetration Testing (CPT) is an ideal method to characterise in situ. While standard CPT tests penetrate of sediments at constant rate, a new free fall cone penetrometer (FF-CPT) for shallow-water application down to 200 m water depth has been developed. Its modular, lightweight design allows us to operate from small platforms to research vessels. The length (0.5 m – 6.5 m) and the weight (40 kg – 170 kg) of the device can be adapted according to the geological setting and main scientific interests. Here we present our initial results as a "proof-of-concept". In five locations with variable sediment composition, the lance was deployed with different penetration velocities ranging from 30 cm/s to free drop in different weight- and length-modi. Based on the primary data (acceleration, cone resis- tance, sleeve friction, pore pressure), we mainly focus on dissipation of insertion pore pressure and a first-order sediment classification. The results show an influence of the different penetration velocities on pore pressure regarding to its evolution over the time and on the magnitudal strength parameters. Finally, our preliminary data suggest that the time- and cost-effective use of our marine FF-CPT is an appropriate alternative to stan- dard CPT measurements. S. Stegmann, T. Mörz & A. Kopf, Research Centre Ocean Margins, University Bremen, Leobener Strasse/MARUM Building, 28359 Bremen, Germany. email: [email protected]
Transcript
Introduction Marine sediments consist of a skeleton of mineralgrains and pore space, which is usually occupied byaqueous and gaseous fluids (Maltman 1994). The stabi-lity of the sediment is controlled by the forces betweenthe grains (cohesion) and the pressure of the fluids inthe pores (Strout & Tjelta 2005). While the firstdepends on the mineralogy of the grains, the latter is afunction of physical properties such as water content,state of consolidation, or grain size distribution. Varia-bility in one or more sediment physical properties mayresult in instability and failure. Geological processes,which are capable of causing pore pressure increase andweakening of the sedimentary framework include tec-tonic deformation, earthquakes, rapid sediment accu-mulation, gas-hydrate melting or tidal/storm wave loa-ding (e.g. Hampton et al. 1996; Locat & Lee 2002). Inthis context, Cone Penetration Tests (CPT) represent awidely used, time efficient method for the in situ cha-racterisation of the physical properties of the sedimentsand their variability. (Chari et al. 1978; Konrad 1987;Bennett et al 1989; Lunne et al. 1997; Christian et al.1993; Wright 2004). Standard probes measure the coneand sleeve resistance (as a first order estimate of sedi-ment strength), pore pressure in defined locations (u1,
u2, u3), tilt, and temperature (Lunne et al. 1997). Apartfrom this set of primary data, a number of secondaryphysical-sedimentary parameters can be calculated. Ifthe insertion pressure and velocity profile during pene-tration of the probe are known, undrained shearstrength (Esrig et al. 1977) and consolidation ratio(Bennett et al. 1985) may be derived. As a consequence,CPT tests play a significant role in the assessment of theunderground in offshore construction, and the stabilityof subsurface sediments deposited on continental shel-ves and slopes. In this paper we present the initialresults of a recently developed FF-CPT device for softsediments. In contrast to industrial CPT procedures,where the probe is pushed hydraulically at a constantrate (2 cm/s), our lightweight, cable-controlled lancemay be universally deployed. Its modular design, withoptionally added weights (up to 60 kg) and extensionrods (0.5 m–6.5 m total length) allows us to control themaximum penetration depth and tackle various scien-tific questions. In this manuscript, we provide a "proofof concept" and illustrate how we vary weights, exten-sion rods, and winch speed to accommodate for varioussettings (soft vs. indurated sediment) and deploymentplatforms (free-fall mode vs. crane or winch). In addi-tion, long-term testing records of pore pressure dissipa-tion after insertion may help us to assess whether
NORWEGIAN JOURNAL OF GEOLOGY Initial Results of a new Free Fall-Cone Penetrometer 199
Initial Results of a new Free Fall-Cone Penetrometer (FF-CPT) for geotechnical in situ characterisation of softmarine sediments
Sylvia Stegmann, Tobias Mörz & Achim Kopf
Stegmann, S., Mörz, T. & Kopf, A.: Initial Results of a new Free Fall-Cone Penetrometer (FF-CPT) for geotechnical in situ characterisation of softmarine sediments. Norwegian Journal of Geology, Vol. 86, pp. 199-208. Trondheim 2006. ISSN 029-196X.
Two of the most crucial sediment physical parameters controlling slope stability and trigger mechanism of mass movements are shear strength andexcess pore pressure. Since both of them require in situ measurement, Cone Penetration Testing (CPT) is an ideal method to characterise in situ.While standard CPT tests penetrate of sediments at constant rate, a new free fall cone penetrometer (FF-CPT) for shallow-water application downto 200 m water depth has been developed. Its modular, lightweight design allows us to operate from small platforms to research vessels. The length(0.5 m – 6.5 m) and the weight (40 kg – 170 kg) of the device can be adapted according to the geological setting and main scientific interests. Herewe present our initial results as a "proof-of-concept". In five locations with variable sediment composition, the lance was deployed with differentpenetration velocities ranging from 30 cm/s to free drop in different weight- and length-modi. Based on the primary data (acceleration, cone resis-tance, sleeve friction, pore pressure), we mainly focus on dissipation of insertion pore pressure and a first-order sediment classification. The resultsshow an influence of the different penetration velocities on pore pressure regarding to its evolution over the time and on the magnitudal strengthparameters. Finally, our preliminary data suggest that the time- and cost-effective use of our marine FF-CPT is an appropriate alternative to stan-dard CPT measurements.
S. Stegmann, T. Mörz & A. Kopf, Research Centre Ocean Margins, University Bremen, Leobener Strasse/MARUM Building, 28359 Bremen, Germany.email: [email protected]
intrinsic sediment strength or excess pore pressures arelikely to trigger shallow submarine mass movements.
Instrument design, theoretical back-ground, and methodsDesign of the FF-CPT
A marine free-fall FF-CPT has recently been developedfor 200 m water depth at the Research Centre OceanMargin (RCOM) at the University of Bremen (Fig.1).We use the term "free-fall" to distinguish between ourgravity-driven deployment style and the hydraulicallypushed standard CPT tests. However, most of thedeployments are carried out with controlled speedusing a winch, while very rarely, we deploy in free drop(i.e. only when the underground is known to be free ofrocks, etc.).
Our instrument consists of an industrial standard 15cm2 cone penetrometer manufactured by GEOMIL(Netherlands), which is equipped with an absolute porepressure sensor (2 MPa), an inclinometer (25˚), and a
temperature sensor. Load cells measure the sedimentresistance acting on the cone during penetration. Theforce acting on the cone, divided by the cone base area(Fig. 1a) produces the cone resistance qc. The forceacting on the sleeve friction in relation to the surface ofthe sleeve area (Fig. 1a) is defined as the sleeve frictionfs (Lunne et al. 1997). The sleeve friction load cellrecords the sum of the cone resistance and the sleevefriction. This principle defines a subtraction cone,which is used in our device. Sleeve friction is obtainedfrom the difference in load between the friction andcone resistance load cells (Lunne et al. 1997). The tiltsensor in the lowermost part of the lance providesinformation on the angle of penetration. A waterproofhousing at the upper end of the lance, fitted with microcontroller and data-acquisition, an acceleration sensorand the power supply, provides autonomous FF-CPTmeasurements even on very small vessels and researchplatforms (Fig. 1b). Concerning weight and the length,our lance is characterised by a modular design. Depen-ding on the sediment strength the lance can be moun-ted optionally with extension rods (up to 6 1-m-pieces)and weights (up to 4 x 15 kg-pieces). In the short mode,the FF-CPT weighs about 40 kg (Fig. 1c), whereas the
200 S. Stegmann et al. NORWEGIAN JOURNAL OF GEOLOGY
Fig 1: (a) Schematic diagram of FF-CPT; (b) photograph of FF-CPT in5.5 m mode on a small research vessel of EAWAG institute, Switzerland;(c) photograph of FF-CPT in shortest mode during a test at Kuhgrabennear Bremen.
weight totals approximately 170 kg if all extension rodsand extra weights are mounted. In short to moderatemode, the FF-CPT can be deployed by two people fromsmall platforms; recovery is aided by a standard 4x4 carwinch. In this way, we ensure maximum flexibility inthe use of our lance depending on different scientificquestions. For further description of the design and theapplication of the FF-CPT see Stegmann et al. (2006).
Testing methods and data handling withthe FF-CPTVariation of the penetration velocity and the weight isuseful for controlling the penetration depth. As can beseen from Figure 1, variable penetration is achieved bythree factors:
(i) Length of the frontal part of the lance,(ii) Weights added to the head of the lance, and(iii) Penetration velocity.
While the first two parameters have to be set prior tothe test (see Fig. 1b, c), the velocity is varied during thetest. So far, we have tested at velocities ranging fromfree drop (ca. 600 cm/s) to various winch speeds uponpenetration (30-200 cm/s). However, lower velocitiesare possible, and we have also conducted tests in clayeymud where the probe is placed at the sediment-waterinterface and then sinks in by its own weight (estimatedrates ca. 1 cm/s in cohesive mud). In any case, velocityis decreasing with increasing penetration depth (andcohesion along the lance’s surface), and has to be inte-grated in order to provide exact depth profiling. Almost30 years of standard CPT testing (chiefly industrial)provide a sound base for the interpretation of dataacquired during tests with non-linear penetration vel-ocity (our FF-CPT device). The immense amount ofdata, predominantly collected onshore, is compiled in afundamental and widespread overview by Lunne et al.(1997).
Measured and derived physical proper-ties of FF-CPT testsPrimary parameters
The crucial geotechnical parameters measured in FF-CPT tests are cone resistance (qc), sleeve friction (fs),acceleration, and pore pressure (u). In contrast to stan-dard CPT tests where the lance is pushed by hydraulicforce at a constant velocity of 2 cm/s, penetration vel-ocity varies with depth both in free-fall mode and whenlowered using a winch. This change in penetration vel-ocity has profound effects on the primary parametersand is a subject of this paper. Also, the terminal depth(TD) of penetration of the FF-CPT is not a simple
function of time (as in the pushed tests), but a complexdeceleration path caused by the sedimentary successionencountered. The built-in acceleration sensor is used toreconstruct the penetration velocity and to assign depthto the data. As an additional control of total insertiondepth, we measure the length along which material isstuck to the lance. However, this can only be doneduring individual tests, but not when running multiplepenetration experiments (pogo-style deployment).Prior to individual measurements, calibration of theprobe is performed in air as well as in the water columnto monitor its potential offset. Before testing, the porewater port and filter element are filled/saturated tominimise artefacts in pressure measurement. Depen-ding on the penetration velocity and on the duration ofthe test, an adequate frequency for data acquisition ischosen (up to a maximum 40 Hz). From the main para-meters of FF-CPT experiments, both cone resistanceand sleeve friction are strongly rate-dependent. As weare measuring in saturated sediments, the pore pressureis the sum of hydrostatic pressure and excess pore pres-sure (Maltman, 1994). Assuming that the pore fluid is inconjunction with the hydrostatic system at our test sites,we subtract the hydrostatic pressure of the watercolumn plus penetration depth from the measuredpressure data and obtain the excess pore pressure indu-ced upon insertion of the lance.
Secondary paramaters
There are a number of secondary parameters which canbe easily derived from the sensor data. These includeboth empirical, CPT-specific measures such as the fric-tion ratio, but also well established parameters such asundrained shear strength or permeability. The mainaim of estimating sediment strength by measuring coneresistance and sleeve friction is a first order sedimentclassification, whereby cone resistance is a measure ofthe stiffness of the sediment (Lunne et al. 1997). Itshould be noted here that this strength parameter isnot a measure for static resistance, but records thedynamic resistance depending on the penetration rate.In cohesive sediments, this increase of penetration vel-ocity results in an increase in cone and sleeve resistance(Dayal & Allen 1975a). The increase of qc is described asa logarithmic increase with penetration velocity (for0.13 cm/s < v > 81 cm/s). In non-cohesive, granularsediments, this relationship is less pronounced, orabsent (Dayal & Allen, 1975b). To identify several soiltypes, the ratio between f and q (also known as frictionratio) is generally used, where greater values corres-pond to fine-grained sediments, and vice versa (Felle-nius & Eslami 2000). The first soil classification chartfor electrical penetrometer measurements was publis-hed by Douglas & Olsen (1981). Robertson (1990) useda similar method (plotting friction ratio vs. cone resis-tance), but recalculated the effect of pore pressure on
201NORWEGIAN JOURNAL OF GEOLOGY Initial Results of a new Free Fall-Cone Penetrometer
cone resistance, as expressed in the corrected coneresistance qt (Robertson 1990):
qt=qc+u2 (1-a)
where: qt = cone resistance corrected for pore water pressure
cone shouldera = ratio between shoulder area (cone base)
unaffected by the pore water pressure to the total shoulder area, here: 0.6
Robertson’s classification chart includes 12 differentsoil types based on grain size composition, amount oforganic matter, stiffness and overconsolidation ratio(Robertson, 1990). For standard CPT tests the correc-ted cone resistance qt can be used to estimate theundrained shear strength of the sediment (su). It isrepresented by the ratio between the sum of qt and thecone factor Nc, which is a function of sediment rigidityand in situ stress state. Lunne et al. (1997) give an over-view of several theoretical solutions for the factor Nc,which ranges in natural systems from 10 – 18. Esrig etal. (1977) suggest the empirical relationship for mode-rately to highly sensitive marine sediments:
Su = Uimax/6,
where: Su = undrained shear strengthUimax= maximum excess pore pressure.
As our tests have been carried out with different, non-linear velocities, we use this relationship to determinethe undrained shear strength.
Complementary Laboratory Testing
Sediment samples have been analysed in the laboratory
to get reference data for the interpretation and qualityassessment of the in situ FF-CPT data.
Grain Size Distribution
A Beckman Coulter LS200 laser particle counter wasused for grain size distribution analysis. It is capable ofmeasuring particles between 0.37 and 2000 µm, so thatthe fraction coarser than 2 mm has to be separated bysieving prior to the measurement. The vessel for thesample (50-2000 mg) is moved relative to the 750 nm-laser during the measurement. Each analysis monitors92 grain size categories controlled by a multi-elementsensor. The data are presented in Table 2 and serve as areference for the interpretation of the FF-CPT results.
Vane Shear Testing
Vane shear tests were conducted using a viscosimeterdevice manufactured by Haase, Germany, equippedwith a miniature vane. The device is motor-driven andmeasures the torque and rotation angle of the vane.Shear strength values are optioned from the torquemeasurements and the known vane geometry followingstandard procedures. (e.g., DIN 18130, BS1377). Valuesare used for comparison with the undrained shearstrength as derived from FF-CPT parameters.
Results and discussionThe test sites chosen for our initial FF-CPT testingmostly lie in the vicinity (100 km radius) of the city ofBremen for convenience’s sake. The only exceptionswere two short cruises with multiple deployments in"normal" as well as gas-rich muds in the Mecklenburgand Eckernförde Bights, Baltic Sea (Table 1). The twomain criteria for their selection was (i) knowledge ofthe local deposits, and (ii) some variation in fluid char-
202 S. Stegmann et al. NORWEGIAN JOURNAL OF GEOLOGY
Table 1.
Location Water Deployment Weight Length Penetration Number of Duration ofdepth (m) (kg) (m) depth (m) individual tests dissipitation (min)
Table 1: Location, water depth, and FF-CPT testing mode (velocity, added weight and length of lance, number of individual tests, duration).
ging for the pore pressure tests. With the sites selected,we cover the full range of clay-rich mud through sandysilts, some of which are normally consolidated whileothers are organic-rich harbour muds (e.g. Wilhelms-haven) or soupy material from pockmark fields(Eckernförde). Details about the geological setting arenot so important for this paper, but the local names aregiven throughout for clarity (please refer to Tables 1, 2for sites, testing procedures, etc.).
FF-CPT measurements
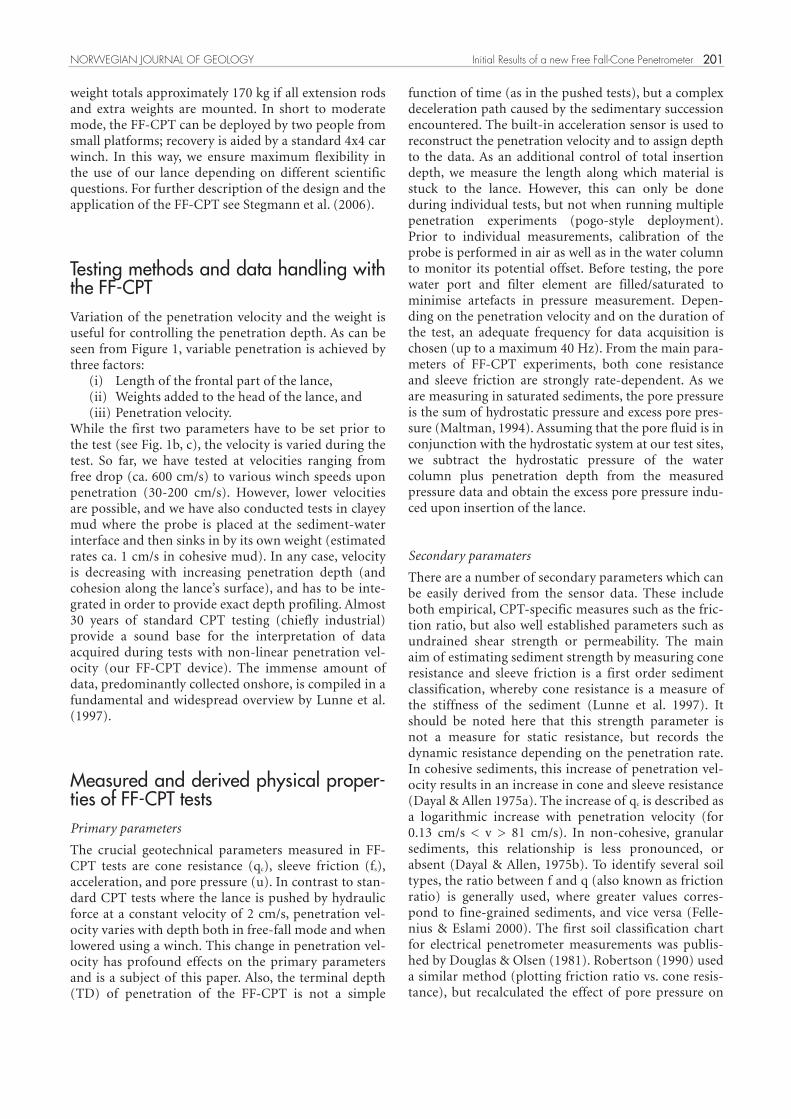
Initially our FF-CPT tests were aimed to study theeffect of variable weight of the lance on total depth ofpenetration. Figure 2 provides an example of a series oftests in short mode (Fig. 1c) with variable weight andin free drop versus controlled winch speed of 50 cm/s.It can be seen that for the relatively coarse-grained sedi-ment (Kuhgraben), each added 15 kg weight amountsto an extra 20 cm penetration.
Figure 3 exemplifies the results of a FF-CPT test in siltymud (Mecklenburg Bight, Baltic Sea, see Table 1),mainly dedicated to the penetration behaviour and therecords of the different sensors. The penetrometer waslaunched with a speed of 200 cm/s. Acceleration (Fig.3a), or better: decelaration, is used to obtain penetra-tion velocity and total depth of penetration by integra-tion. It can be seen that the initial insertion velocity ofca. 200 m/s decreases rapidly to about half that valuewithin the uppermost 35 cm below the sea floor (cmbsf; Fig. 3a). Penetration speed then drops less rapidlyfor the stiffer underlying muds before the probe comesto a complete halt at 220 cm bsf. Both cone resistanceqc (Fig. 3b) and sleeve friction fs (Fig. 3c) show anincrease in the upper part of the penetrated sediment,with the maximum cone resistance being >500 kPa.Figure 3d shows the "excess pore pressure" evolutionupon and during penetration, with the hydrostaticpressure (Phyd) having been subtracted from the totalpressure readings. Again, the strongest deviation of the
curve is observed at 35-40 cm bsf, suggesting that a dis-continuity is met. When comparing all sensors at thisdepth level, it can be seen that values near 7 m/s2 aswell as profound increases in cone resistance and sleevefriction point towards a harder horizon (Figs. 3a-c). Incontrast, the initial pore pressure increase induced bythe impact of the FF-CPT suddenly ceases, reachingeven negative pressures for a fraction of a second (Fig.3d, 35-40 cm depth). This observation is consistentwith other tests at high insertion speed in coarser-grai-ned sediments (e.g. Kuhgraben; see below).
To gain insights into the evolution of excess pore pres-sure dissipation after impact of the FF-CPT, the com-plete data record has to be embraced. Figures 4 and 5provide examples of pressure behaviour at various sca-les and modes. This is merely to shed light on the influ-
203NORWEGIAN JOURNAL OF GEOLOGY Initial Results of a new Free Fall-Cone Penetrometer
Fig 2: Example of varying penetration depth as a function of diffe-rent deployment mode (winch vs. free-fall) and total weight. See alsoTable 1.
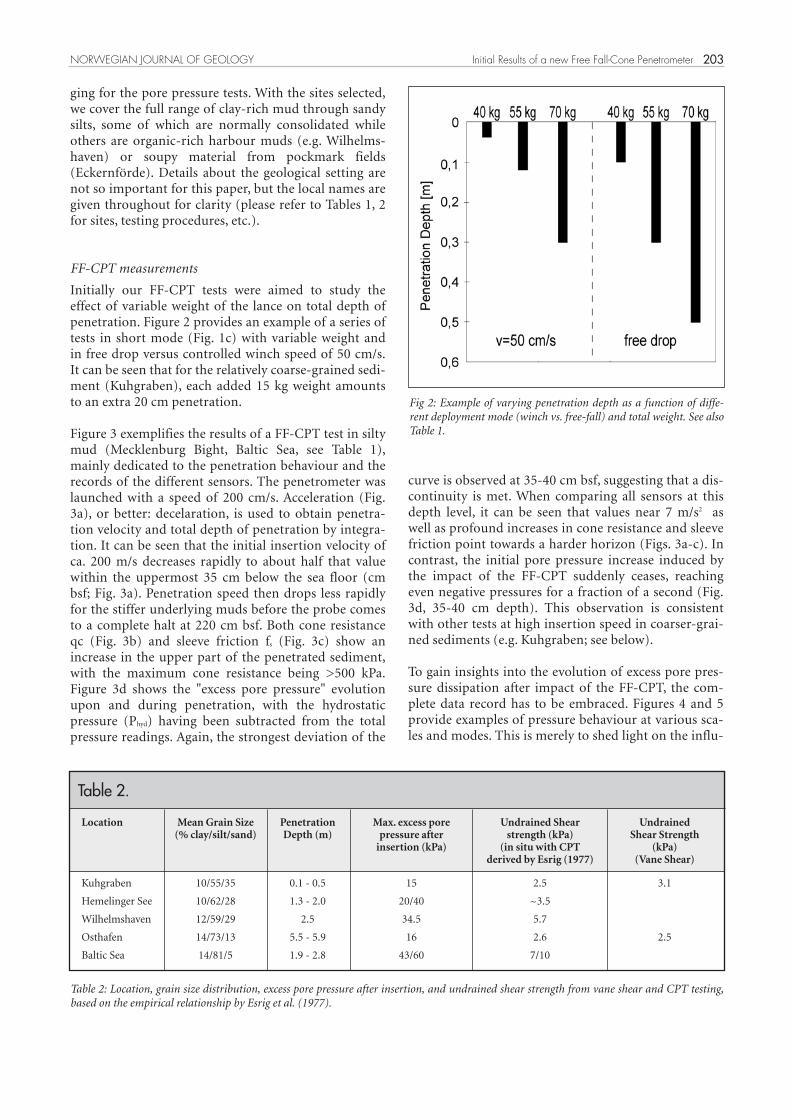
Table 2.
Location Mean Grain Size Penetration Max. excess pore Undrained Shear Undrained(% clay/silt/sand) Depth (m) pressure after strength (kPa) Shear Strength
insertion (kPa) (in situ with CPT (kPa) derived by Esrig (1977) (Vane Shear)
Kuhgraben 10/55/35 0.1 - 0.5 15 2.5 3.1
Hemelinger See 10/62/28 1.3 - 2.0 20/40 ~3.5
Wilhelmshaven 12/59/29 2.5 34.5 5.7
Osthafen 14/73/13 5.5 - 5.9 16 2.6 2.5
Baltic Sea 14/81/5 1.9 - 2.8 43/60 7/10
Table 2: Location, grain size distribution, excess pore pressure after insertion, and undrained shear strength from vane shear and CPT testing,based on the empirical relationship by Esrig et al. (1977).
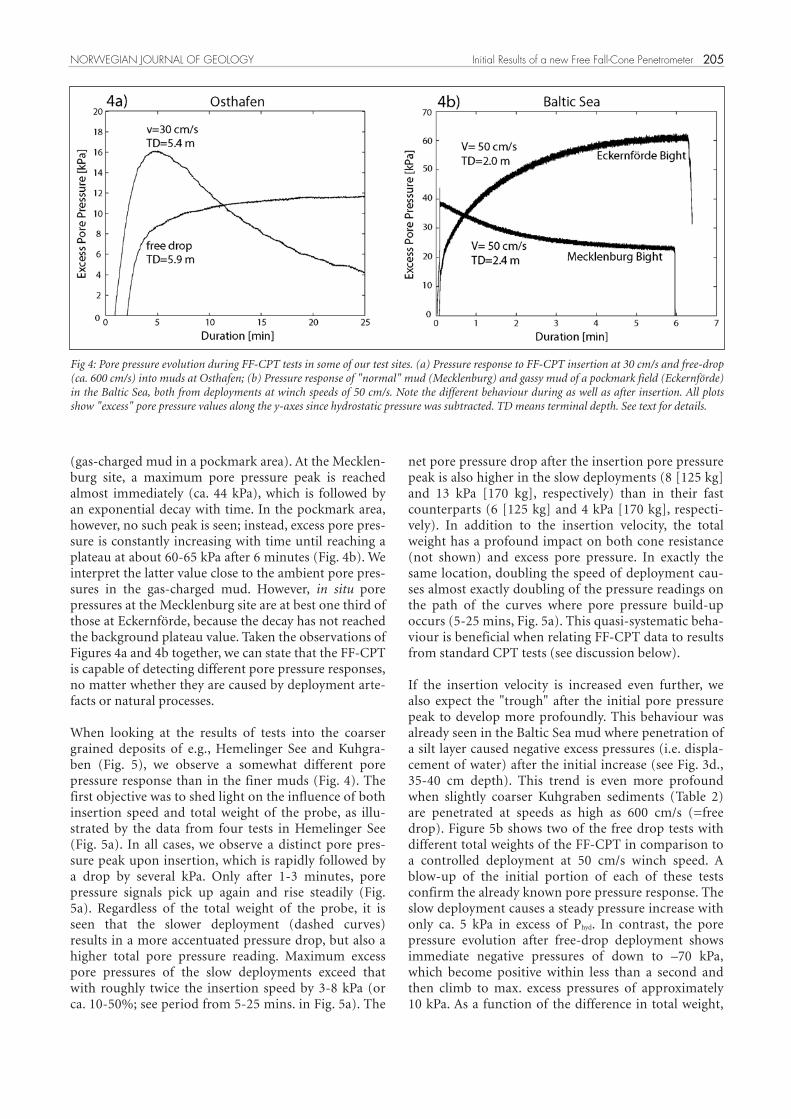
ence of the sediment composition, impact velocity, anddifferent evolution of the pressure signal with time. InFigure 4, we compare the finer grained end of our suiteof samples (Osthafen, Baltic Sea), while Figure 5 focu-ses on the coarser grained end members at HemelingerSee and Kuhgraben. Figure 4a illustrates the inducedexcess pore pressure evolution caused by the impact ofthe FF-CPT into Osthafen muds at variable rates (30cm/s vs. free drop [according to the Phyd data with time,this amounts to ca. 600 cm/s]). It can be seen that pres-sure increase is more inert at high insertion rate, withthe excess pore pressure still increasing after 25 minutespast insertion. In contrast, moderate deployment vel-
ocity causes a distinct pore pressure maximum of about16 kPa after less than 5 minutes, followed by an equallyrapid decay to about half that value 10 minutes later (t50
value). We attribute this fact to a pressure pulse (orwave) of fluids being displaced and driven away fromthe probe in case of rapid deployment. In general, weacknowledge this effect to be more profound in coar-ser-grained sediments. If we disregard the artificialoverpressures and compare sediments with naturallyhigh fluid pressures of the Baltic Sea, we observe stri-king similarities. Figure 4b compares slow deployments(50 cm/s winch speed) into the mud from MecklenburgBight (regular deposition) and the Eckernförde Bight
204 S. Stegmann et al. NORWEGIAN JOURNAL OF GEOLOGY
Fig 3: Diagram showing a set of parameters measured with the CPT in clayey mud in the Baltic Sea: (a) Acceleration (overlain by penetrationvelocity, as derived from deceleration), (b) cone resistance, (c) sleeve friction, and (d) insertion pore pressure. For details, see text and Table 1.
(gas-charged mud in a pockmark area). At the Mecklen-burg site, a maximum pore pressure peak is reachedalmost immediately (ca. 44 kPa), which is followed byan exponential decay with time. In the pockmark area,however, no such peak is seen; instead, excess pore pres-sure is constantly increasing with time until reaching aplateau at about 60-65 kPa after 6 minutes (Fig. 4b). Weinterpret the latter value close to the ambient pore pres-sures in the gas-charged mud. However, in situ porepressures at the Mecklenburg site are at best one third ofthose at Eckernförde, because the decay has not reachedthe background plateau value. Taken the observations ofFigures 4a and 4b together, we can state that the FF-CPTis capable of detecting different pore pressure responses,no matter whether they are caused by deployment arte-facts or natural processes.
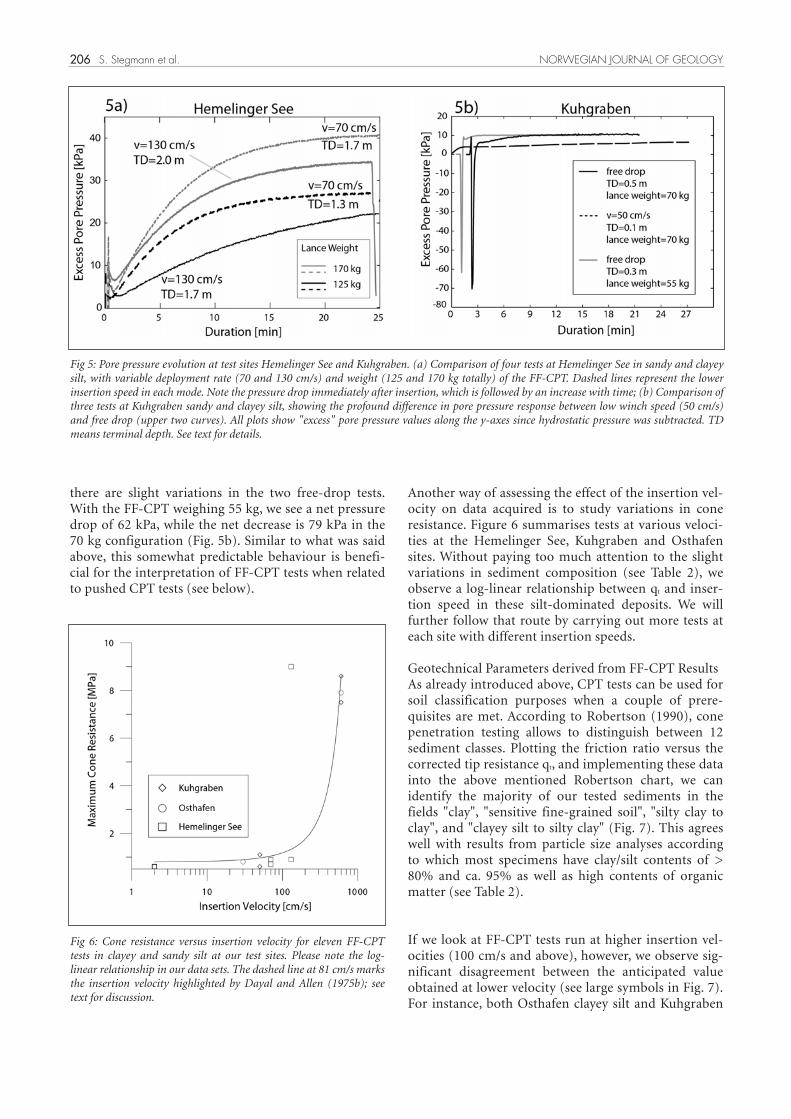
When looking at the results of tests into the coarsergrained deposits of e.g., Hemelinger See and Kuhgra-ben (Fig. 5), we observe a somewhat different porepressure response than in the finer muds (Fig. 4). Thefirst objective was to shed light on the influence of bothinsertion speed and total weight of the probe, as illu-strated by the data from four tests in Hemelinger See(Fig. 5a). In all cases, we observe a distinct pore pres-sure peak upon insertion, which is rapidly followed bya drop by several kPa. Only after 1-3 minutes, porepressure signals pick up again and rise steadily (Fig.5a). Regardless of the total weight of the probe, it isseen that the slower deployment (dashed curves)results in a more accentuated pressure drop, but also ahigher total pore pressure reading. Maximum excesspore pressures of the slow deployments exceed thatwith roughly twice the insertion speed by 3-8 kPa (orca. 10-50%; see period from 5-25 mins. in Fig. 5a). The
net pore pressure drop after the insertion pore pressurepeak is also higher in the slow deployments (8 [125 kg]and 13 kPa [170 kg], respectively) than in their fastcounterparts (6 [125 kg] and 4 kPa [170 kg], respecti-vely). In addition to the insertion velocity, the totalweight has a profound impact on both cone resistance(not shown) and excess pore pressure. In exactly thesame location, doubling the speed of deployment cau-ses almost exactly doubling of the pressure readings onthe path of the curves where pore pressure build-upoccurs (5-25 mins, Fig. 5a). This quasi-systematic beha-viour is beneficial when relating FF-CPT data to resultsfrom standard CPT tests (see discussion below).
If the insertion velocity is increased even further, wealso expect the "trough" after the initial pore pressurepeak to develop more profoundly. This behaviour wasalready seen in the Baltic Sea mud where penetration ofa silt layer caused negative excess pressures (i.e. displa-cement of water) after the initial increase (see Fig. 3d.,35-40 cm depth). This trend is even more profoundwhen slightly coarser Kuhgraben sediments (Table 2)are penetrated at speeds as high as 600 cm/s (=freedrop). Figure 5b shows two of the free drop tests withdifferent total weights of the FF-CPT in comparison toa controlled deployment at 50 cm/s winch speed. Ablow-up of the initial portion of each of these testsconfirm the already known pore pressure response. Theslow deployment causes a steady pressure increase withonly ca. 5 kPa in excess of Phyd. In contrast, the porepressure evolution after free-drop deployment showsimmediate negative pressures of down to –70 kPa,which become positive within less than a second andthen climb to max. excess pressures of approximately10 kPa. As a function of the difference in total weight,
205NORWEGIAN JOURNAL OF GEOLOGY Initial Results of a new Free Fall-Cone Penetrometer
Fig 4: Pore pressure evolution during FF-CPT tests in some of our test sites. (a) Pressure response to FF-CPT insertion at 30 cm/s and free-drop(ca. 600 cm/s) into muds at Osthafen; (b) Pressure response of "normal" mud (Mecklenburg) and gassy mud of a pockmark field (Eckernförde)in the Baltic Sea, both from deployments at winch speeds of 50 cm/s. Note the different behaviour during as well as after insertion. All plotsshow "excess" pore pressure values along the y-axes since hydrostatic pressure was subtracted. TD means terminal depth. See text for details.
there are slight variations in the two free-drop tests.With the FF-CPT weighing 55 kg, we see a net pressuredrop of 62 kPa, while the net decrease is 79 kPa in the70 kg configuration (Fig. 5b). Similar to what was saidabove, this somewhat predictable behaviour is benefi-cial for the interpretation of FF-CPT tests when relatedto pushed CPT tests (see below).
Another way of assessing the effect of the insertion vel-ocity on data acquired is to study variations in coneresistance. Figure 6 summarises tests at various veloci-ties at the Hemelinger See, Kuhgraben and Osthafensites. Without paying too much attention to the slightvariations in sediment composition (see Table 2), weobserve a log-linear relationship between qt and inser-tion speed in these silt-dominated deposits. We willfurther follow that route by carrying out more tests ateach site with different insertion speeds.
Geotechnical Parameters derived from FF-CPT Results As already introduced above, CPT tests can be used forsoil classification purposes when a couple of prere-quisites are met. According to Robertson (1990), conepenetration testing allows to distinguish between 12sediment classes. Plotting the friction ratio versus thecorrected tip resistance qt, and implementing these datainto the above mentioned Robertson chart, we canidentify the majority of our tested sediments in thefields "clay", "sensitive fine-grained soil", "silty clay toclay", and "clayey silt to silty clay" (Fig. 7). This agreeswell with results from particle size analyses accordingto which most specimens have clay/silt contents of >80% and ca. 95% as well as high contents of organicmatter (see Table 2).
If we look at FF-CPT tests run at higher insertion vel-ocities (100 cm/s and above), however, we observe sig-nificant disagreement between the anticipated valueobtained at lower velocity (see large symbols in Fig. 7).For instance, both Osthafen clayey silt and Kuhgraben
206 S. Stegmann et al. NORWEGIAN JOURNAL OF GEOLOGY
Fig 5: Pore pressure evolution at test sites Hemelinger See and Kuhgraben. (a) Comparison of four tests at Hemelinger See in sandy and clayeysilt, with variable deployment rate (70 and 130 cm/s) and weight (125 and 170 kg totally) of the FF-CPT. Dashed lines represent the lowerinsertion speed in each mode. Note the pressure drop immediately after insertion, which is followed by an increase with time; (b) Comparison ofthree tests at Kuhgraben sandy and clayey silt, showing the profound difference in pore pressure response between low winch speed (50 cm/s)and free drop (upper two curves). All plots show "excess" pore pressure values along the y-axes since hydrostatic pressure was subtracted. TDmeans terminal depth. See text for details.
Fig 6: Cone resistance versus insertion velocity for eleven FF-CPTtests in clayey and sandy silt at our test sites. Please note the log-linear relationship in our data sets. The dashed line at 81 cm/s marksthe insertion velocity highlighted by Dayal and Allen (1975b); seetext for discussion.
and Hemelinger See clayey and sandy silts show veryhigh cone resistance values, and hence plot in the fieldof pure sand. This implies that for the more rapid ofour deployments, a reliable soil classification is severelyhindered. It can be seen that the higher the velocity, themore data shift towards the upper left portion of thediagram (Fig. 7). We conclude that friction ratios mayget less reliable when penetration velocity is high,because qc is up to 4-fold higher than in the deeper sec-tion when momentum has been lost (see Fig. 3b,c). Asoutlined above, the force measured during penetrationof the FF-CPT probe can be translated into undrainedshear strength under certain assumptions (see discus-sion in Esrig et al., 1977). In our experiments, the inser-tion pressure ranged from 15 kPa to 60 kPa for the totalof 13 tests conducted so far (see Table 1 for details).Based on the FF-CPT experiments, undrained shearstrength was calculated for all five locations (Table 2).The finer-grained sediments in Osthafen, Wilhelmsha-ven, and the Baltic Sea are characterised by a relativelywide range of shear strengths from 2.6 kPa to 10 kPa.This may be explained by the different degree of conso-lidation, which is also mirrored by the difference in
total penetration depth (1.9 m - 5.5 m). However, vaneshear tests of the Osthafen mud, which were carried outon the surface of a split gravity core, gained 2.5 kPa.The coarser materials show undrained shear strengthsof 3.5 kPa (Hemelinger See) and 2.5 kPa (Kuhgraben;see Table 2). Vane shear tests on the latter material werecarried out as a reference measurement, and lie higher(3.1 kPa). We conclude that the elevated permeabilityof the Kuhgraben sandy silt allows water to dissipatevery rapidly during FF-CPT impact, so that the inser-tion pressure monitored at u2 is biased by negative porepressures, and thus underestimates the total pressureupon impact.
Conclusions• We can show that our new FF-CPT device may be
used for time-effective in situ measurements fromnearly any platform in the estuarine or marinerealm (Fig. 1).
• Given the modular design of our FF-CPT, we areable to specifically address certain depth levels andhence may perform step-like dissipation tests withthe probe to examine different sedimentary layers(see Stegmann et al. 2006, p.29). This includes long-term dissipation tests as well as deployments at vari-able penetration velocities or weights (Figs. 4-5).
• From the FF-CPT tests carried out so far in clayeyand sandy silt, we obtain a log-linear relationshipbetween cone resistance at the probe and insertionvelocity. This may allow us to compare FF-CPT datawith results from pushed standard CPT tests withincertain limitations.
• Comparing the published soil classification charts(e.g., Robertson 1990) with our FF-CPT data andgrain-size analysis, in situ classification of the testedsediments agrees well with the laboratory measure-ments (Fig. 6 and Table 2).
• Pore pressure and sediment strength should show apositive correlation in FF-CPT tests, because a cer-tain degree of consolidation/stiffness is required toallow the build-up of a significant pore pressureartefact. Our results of combined FF-CPT, grain sizeand vane shear analyses indicate that clay contentalone does not necessarily result in lower permeabi-lity and more rapid pore pressure build-up. In fact,the opposite is suggested when data from Osthafenand Kuhgraben mud are compared. While the firstdoes not exceed excess pressures of 4 kPa (min. dis-sipation value) to 16 kPa (max.), the latter covers arange from –50 kPa (initial fluid displacement) to10 kPa in excess of hydrostatic pressure.
• More generally, we can state that the FF-CPT iscapable of detecting different pore pressure respon-ses in marine (or estuarine) sediments, no matterwhether they are caused by deployment artefacts or
207NORWEGIAN JOURNAL OF GEOLOGY Initial Results of a new Free Fall-Cone Penetrometer
Fig 7: First-order sediment classification (based on Robertson’s chart[1990], modified) of deployments at Wilhelmshaven, Osthafen,Hemelinger See, Mecklenburg Bight (Baltic Sea) and Kuhgraben. Forthose sites where fast (v = >81 cm/s) were carried out, results areshown as large symbols (see inset: Legend). For details, see discussionin text and Figure 6.
natural processes. This way the device is powerful indistinguishing between the influence of pore wateroverpressures on the one hand, and weak strength(from q and f) on the other hand as potential trig-gers of slope instability.
• The correlation of the pore pressure signal andshear strength (for CPT and laboratory tests) isambiguous, most likely because of the large numberof variables such as insertion velocity, total weightetc. during FF-CPT deployment. More testing willbe carried out to analyse the influence of the vari-able parameter of our dynamic measurements.
Acknowledgements: M. Lange is acknowledged for valuable suggestionsand immense help with construction, programming, and testing of theFF-CPT. M. Lange and A. Seifert assisted with measurements in theBaltic Sea, for which we thank them sincerely. Our colleagues V. Ber-horst (Geomil, Netherlands), H. Villinger, B. Heesemann, N. Kaul pro-vided valuable discussion. S. Kreiter, A. Seifert, G. von Halem and J.B.Struut helped with laboratory testing. B. Buck, A. Schröder, S. Spahic,M. Geisen (Osthafen), S. Potthoff (Wilhelmshaven), and T. Wever andR. Lühder (Baltic Sea) have been extremely supportive during variousparts of our experiments. The manuscript benefited from the valuable,detailed suggestions by Jim Strout and an anonymous referee, as well asthe superb editorial handling by Anders Solheim. Funding for this rese-arch was provided by the German Science Foundation (DFG) to theResearch Centre Ocean Margins. This is RCOM publication no. 0398.
References
Bennett, R.H., L. Huon, P.J. Valent, J. Lipkin & M.I. Esrig, M.I 1985: Insitu undrained shear strengths and permeabilities derived frompiezometer measurements. In R.C. Chaney, R.C. & Demars, K.R.(Eds.), Strength Testing of Marine Sediments: Laboratory and InSitu Measurements. American Society for Testing and Materials, 88-100.
Bennett, R. H., Li. H., Burns, J.T., Perscival, C.M. & Lipkin, J. 1989:Application of Piezometer Probes to Determine Engeineering Pro-perties and Geological Processes in Marine Sediments. AppliedClay Science 4, 337-355.
Chari, T.R., Smith W.G. & Zielinski, A. 1978: Use Of Free Fall Penetro-meter In Sea Floor Engineering. In Oceans ’78 "The ocean chal-lenge"; Fourth annual combined conference sponsored by the MarineTechnology Society and the Institute of Electrical and Electronics Eng-ineers, 686-687.
Christian, H.A., Heffler D.E. & Davis, E.E 1993: Lancelot - an in situpiezometer for soft marine sediments. Deep-Sea Research I 40,1509-1520.
Dayal, U. & Allen, J.H. 1975a. The Effect of Penetration Rate on theStrength of Remolded Clay and Sand Samples. Canadian Geotech-nical Journal 12, 336-348.
Dayal, U. & Allen, J.H. 1975b. A note on friction ratio. Canadian Geo-technical Journal 12, 524-526.
Douglas, B.J. & Olsen, R.S. 1981: Soil classification using electric conepenetrometer. American Society of Civil Engineers (ASCE). Proce-edings of Seminar on Cone Penetration Testing and Experience, St.Louis, 209-227.
Esrig, M.I., R.C. Kirby & Bea, R.G. 1977. Initial development of ageneral effective stress method for the prediction of axial capacityfor driven piles in clay. Proc. 9th Offshore Technology Conference,495-501.
Fellenius, B.H. & Eslami A. 2000: Soil profile interpreted from CPTudata, "Year 2000 Geotechnics" Geotechnical Engineering Confe-rence, Asian Institute of Technology, Bankok, Thailand, 18 pp.
Hampton, M.A., Lee, H.J. & Locat, J. 1996: Submarine Landslides.Reviews of Geophysics 34, 33-59.
Konrad, J.-M. 1987: Piezo-friction-cone penetrometer testing in softclays. Canadian Geotechnical Journal 24, 645-652.
Locat, J. & Lee, H.J. 2002: Submarine landslides: advances and chal-lenges. Canadian Geotechnical Journal 39, 193-212.
Lunne, T., P.K. Robertson & Powell, J.J.M. 1997: Cone Penetrating Tes-ting. In Geotechnical Practice. Spon Press, 312 pp.
Maltman, A. (Ed.) 1994: The Geological Deformation of Sediments.Champman & Hall London, 362. pp.
Robertson, P.K. 1990: Soil classification using the cone penetrationtest. Canadian Geotechnical Journal 27, 151-158.
Stegmann, S., Villinger, H. & Kopf, A. 2006: Design of a Modular,Marine Free-Fall Cone Penetrometer. Sea Technology 47, 27-33.
Strout, J. M. & Tjelta, T.I. 2005: In situ pore pressures: What is theirsignificance and how can they be reliably measured? Marine andPetroleum Geology 22, 275-285.
Wright, I., 2004: Geotechnical Investigations Using Mini-Cone Pene-trometer Testing. Sea Technology 45, 49-52.
208 S. Stegmann et al. NORWEGIAN JOURNAL OF GEOLOGY