INITIAL TOWNSHIP TESTING OF NITRATE IN PRIVATE WELLS WASHINGTON COUNTY 2014 SUMMARY November 2015 Minnesota Department of Agriculture Pesticide and Fertilizer Management Division In accordance with the Americans with Disabilities Act, this information is available in alternative forms of communication upon request by calling 651-201-6000. TTY users can call the Minnesota Relay Service a 711. The MDA is an equal opportunity employer and provider.
Transcript
INITIAL TOWNSHIP TESTING OF NITRATE IN PRIVATE WELLS
WASHINGTON COUNTY 2014 SUMMARY
November 2015
Minnesota Department of Agriculture
Pesticide and Fertilizer Management Division
In accordance with the Americans with Disabilities Act, this information is available in alternative forms of communication upon request by calling 651-201-6000. TTY users can call the Minnesota Relay Service a 711.
The MDA is an equal opportunity employer and provider.
2014 Summary Washington County Township Sampling | 2
ACKNOWLEDGEMENTS
MDA PRIMARY AUTHORS
Kimberly Kaiser, Nikol Ross
CONTRIBUTORS AND REVIEWERS
MDA Staff: Heather Johnson, Annie Felix-Gerth, Larry Gunderson, Bill VanRyswyk,
Michael MacDonald, Bruce Montgomery and Dan Stoddard.
Washington County Staff: Stephanie Grayzeck Souter
FUNDING
Project dollars provided by the Clean Water Fund (from the Clean Water, Land and
Legacy Amendment).
2014 Summary Washington County Township Sampling | 3
Table of Contents ........................................................................................................................................................ 3
Future Work ............................................................................................................................................................... 24
Table 5. Township Nitrate Results Summary Related to Vulnerable Groundwater and Row Crop
Production ................................................................................................................................................... 21
Table 6. Nitrate Concentration within Sampled Groundwater Aquifers ...................................................... 23
Table 7. Property Setting for Well Location ................................................................................................ 28
Table 8. Well Construction Type ................................................................................................................. 28
Table 9. Age of Well .................................................................................................................................... 28
Table 10. Depth of Well ............................................................................................................................... 29
Table 11. Unique Well ID Known ................................................................................................................ 29
Table 12. Livestock Located on Property .................................................................................................... 29
Table 13. Fertilizer Stored on Property ....................................................................................................... 30
Table 14. Farming on Property ................................................................................................................... 30
Table 15. Distance to an Active or Inactive Feedlot ................................................................................... 30
Table 16. Distance to Septic System .......................................................................................................... 31
Table 17. Distance to Agricultural Field ...................................................................................................... 31
Table 18. Drinking Water Well .................................................................................................................... 31
Table 19. Treatment System Present ......................................................................................................... 32
Table 20. Last Tested for Nitrate ................................................................................................................ 32
Table 21. Last Nitrate Test Result .............................................................................................................. 32
2014 Summary Washington County Township Sampling | 5
EXECUTIVE SUMMARY
In 2014, one township and one city in Washington County, Minnesota, were selected for
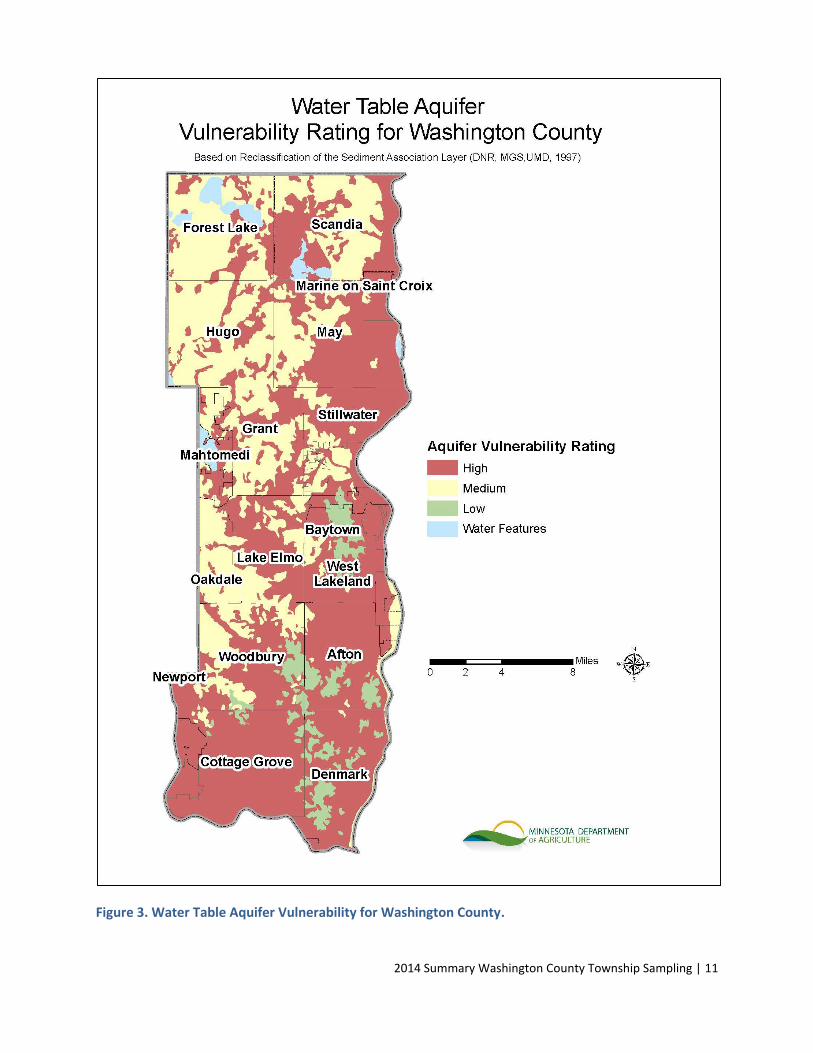
private well nitrate sampling in support of the Nitrogen Fertilizer Management Plan. This
selection was based on historically elevated nitrate conditions, aquifer vulnerability and
row crop production. Samples were collected from private wells using homeowner
collection and mail-in methods. Well log information was obtained when available and
correlated with nitrate results.
Information collected indicated approximately 96 percent of wells in Cottage Grove and
Denmark Township were finished in the Paleozoic sedimentary deposits. Samples were
collected from 526 wells in these two communities representing a 39 percent response
rate from homeowners.
Results showed that across the two communities, 22 percent of private wells sampled
were above the health standard of 10 mg/L for nitrate as nitrogen (nitrate-N). In Cottage
Grove, 28 percent were above 10 mg/L, and in Denmark 14 percent of the private wells
tested were above the 10 mg/L standard for nitrate-N. The maximum nitrate values
ranged from 20.9 to 34.1 mg/L. The 90th percentiles ranged from 11.8 to 15.8 mg/L and
the mean nitrate values found were 3.8 to 6.0 mg/L for Denmark Township and Cottage
Grove, respectively.
This initial testing was followed by a second sampling offered to homeowners with wells
that had a detectable nitrate result. This work will be discussed further in a follow-up
report in 2016.
INTRODUCTION
The Minnesota Department of Agriculture (MDA) has recently updated the 1990
Nitrogen Fertilizer Management Plan (NFMP), which is the state’s blueprint for
prevention or minimization of the impacts of nitrogen fertilizer on groundwater. One of
the goals of the NFMP is to minimize or mitigate the source of pollution from nitrogen
fertilizer. Updating the NFMP provided an opportunity to restructure the County’s and
the State’s strategies for reducing nitrate contamination of water resources, with more
specific, localized accountability for nitrate contamination associated with row crop
agricultural production.
To effectively manage nitrate contamination of water resources, it is appropriate to
focus on areas of greatest risk. Testing private wells for nitrate is one method for
identifying areas and wells at greatest risk. For this, the MDA has developed the
“Township Testing Program”. In the Township Testing Program (TTP) the MDA works
2014 Summary Washington County Township Sampling | 6
with local partners (counties and Soil and Water Conservation Districts) to collect and
analyze water samples from private drinking water wells within townships that either had
high nitrate results or exist in an area with high aquifer vulnerability and a high
percentage of row crop production.
This testing conducted in Washington County will be used to guide future work as the
MDA plans to offer nitrate tests to approximately 70,000 private well owners (within 250-
350 townships) between 2014 and 2019. As of spring 2015, 60 townships in
eight counties have been completed.
For further information on this program, please visit the project webpage at:
< DL stands for less than a detectable limit. The DL is less than 0.03 mg/L. The 75th percentile (90th, 95th, and 99th) is the value below which 75 percent (90%, 95%, and 99%) of the observed values fall.
2014 Summary Washington County Township Sampling | 21
Table 5. Township Nitrate Results Summary Related to Vulnerable Groundwater and Row Crop
Production.
Community Total Wells
Percent of Land in Row Crop Production
Percent of Land in Vulnerable
Geology
Percent of Wells Nitrate-N ≥ 10 mg/L
90th Percentile
mg/L
Cottage Grove 300 27% 36% 29% 15.8
Denmark Township 226 47% 23% 13% 11.8
Total 526 37%* 30%* 21%* 14.2
* Represents an average
WELL SETTING AND CONSTRUCTION
WELL OWNER SURVEY
The well owner survey, sent out with the sampling kit, requested additional information
about private wells that were to be sampled. The survey included questions about the
well construction, depth and age, and nearby land use. A blank survey can be found in
Appendix A. It is important to note that well information was provided by the well owners
and may be approximate or potentially erroneous. The following section is a summary of
information gathered from the well owner survey (complete well survey results are
located in Appendix B at the end of this document, Tables 7-21).
The majority of wells in each township were identified by the homeowner as “rural”
property. Approximately 82 percent of sampled wells are drilled construction and two
percent are sand point wells. There were no hand dug wells sampled.
Sand point (drive-point) wells are typically completed at shallower depths than drilled
wells. Sand point wells are also usually installed in areas where sand is the dominant
geologic material and where there are no thick confining units such as clay. This makes
sand point wells more vulnerable to contamination from the surface.
Most of the sampled wells are greater than 100 feet deep, with the majority between
100 and 299 feet below ground surface.
2014 Summary Washington County Township Sampling | 22
POTENTIAL NITRATE SOURCE DISTANCES
The following response summary relates to isolation distances of potential point sources
of nitrate that may contaminate wells. This information was obtained from the well
surveys completed by the homeowner.
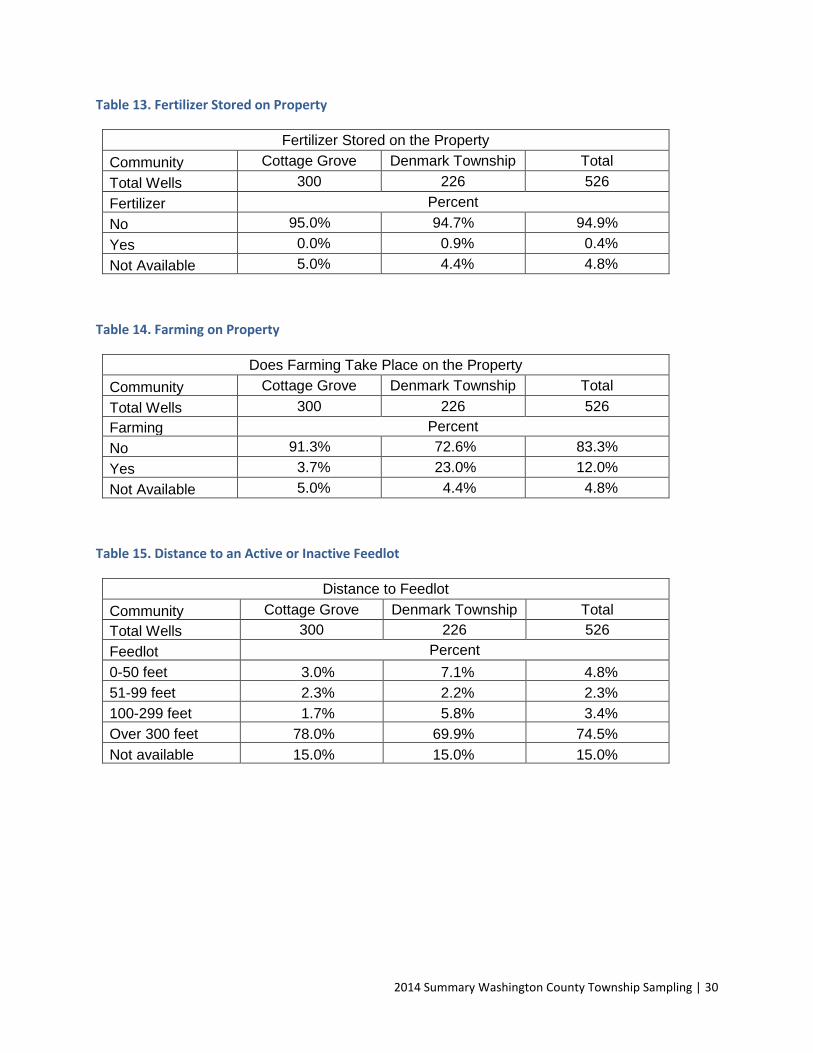
On average, farming takes place on twelve percent of the properties.
Agricultural fields are greater than 300 feet from wells at 64 percent of the properties.
Only two percent of the well owners across the communities responded that they have livestock (greater than ten head of cattle or other equivalent) on their property.
Most wells (75 percent) are more than 300 feet from an active or inactive feedlot.
Very few well owners (less than one percent) store more than 500 pounds of fertilizer on their property.
A small minority of wells (six percent) are less than 50 feet away from septic systems.
2014 Summary Washington County Township Sampling | 23
WELL LOGS
In some cases, well owners were able to provide Unique Well Identification Numbers
(Unique ID) for their wells. When the correct Unique IDs are provided, a well log can be
used to obtain well construction information and to identify the aquifer that the well
withdraws water from. In this study, 85 wells were identified in the CWI and the well logs
were obtained (Table 6). This represents 16% of the sampled wells in this township
testing.
According to the well logs, the most commonly utilized aquifers were from the Paleozoic
aquifers. This reflects the overall findings for all documented wells in the focus area
(Table 2). Only one of the documented wells was in the Quaternary water table aquifer.
Table 6. Nitrate Concentration within Sampled Groundwater Aquifers.
Aquifer Total Wells
Ave Depth**
Number Percent
<3 3<10 ≥10 <3 3<10 ≥10
(Feet) Nitrate-N mg/L
Quaternary Water Table
1 157 1 0 0 100% 0% 0%
Paleozoic 84 258 66 13 5 79% 15% 6%
Total 85 257* 67 13 5 79%* 15%* 6%*
* Represents a weighted average value. ** The depths were obtained from well logs in the CWI database.
2014 Summary Washington County Township Sampling | 24
SUMMARY
The City of Cottage Grove and Denmark Township were chosen for sampling based on
the following criteria: local expertise from Washington County and Washington
Conservation District, past high nitrate results, vulnerable groundwater, and row crop
production.
Samples were collected from private wells using homeowner collection and mail-in
methods. Samples were collected from 526 wells in these two communities
representing a 39 percent response rate from homeowners.
According to the well logs and CWI, the most commonly utilized aquifers were from the
Paleozoic aquifers. Specifically, the Prairie Du Chien-Jordon Aquifer is the main source
of groundwater.
Results showed that across the two communities, 22 percent of private wells sampled
were above the health standard of 10 mg/L for nitrate as nitrogen (nitrate-N). In Cottage
Grove, 28 percent were above 10 mg/L, and in Denmark 14 percent of the private wells
tested were above the 10 mg/L standard for nitrate-N.
FUTURE WORK
Well owners with detectable nitrate results from this township testing were offered a free
pesticide sample and a follow-up nitrate sample taken by MDA staff. At the time of this
resampling, a well site visit is performed (when possible) in order to rule out well
construction issues and likely point sources of nitrate. In preparation for the well site
visits, every effort is made to obtain well log information so that nitrate results and the
aquifer designation can be compared in a more comprehensive fashion. Washington
Conservation District offers to meet with homeowners to discuss potential well
construction issues and possible nitrogen point sources on the homeowner property.
This work will be discussed further in a follow-up report in 2016.
The testing conducted in Washington County will be used to guide future work as the
MDA plans to offer nitrate tests to approximately 70,000 private well owners (within 250-
350 townships) between 2014 and 2019. As of spring 2015, 60 townships in
eight counties have been completed.
2014 Summary Washington County Township Sampling | 25
REFERENCES
Minnesota Department of Health. (2002). Washington County Nitrate-Nitrogen Probability. On-line PDF Retrieved March 25, 2015, from http://www.health.state.mn.us/divs/eh/water/swp/nitrate/reports/2011method/washington.pdf
Minnesota Department of Health. (n.d.) County Well Index website. Retrieved March 11, 2015, from http://www.health.state.mn.us/divs/eh/cwi/
Minnesota Department of Natural Resources. (1991). Geologic Sensitivity Project Workgroup. Criteria and guidelines for assessing geologic sensitivity of ground water resources in Minnesota, Minnesota Department of Natural Resources, Division of Waters, St. Paul, Minn., p. 122.
Minnesota Pollution Control Agency. (1998). Baseline Water Quality of Minnesota’s Principal Aquifers, Region 2, North Central Minnesota.
Minnesota Geological Survey, MDNR and University of Minnesota –Duluth. (1997). Geomorphology of Minnesota, geomorphology data describing a wide variety of conditions related to surficial geology within a hierarchical classification scheme that was devised for use within Minnesota, Scale 1:100,000.
Minnesota Geologic Survey. (n.d.) Minnesota Geological Survey County Geological Atlas Program. Retrieved March 17, 2015, from http://www.mngs.umn.edu/county_atlas/countyatlas.htm
Mossler, John H. (2013). M-194 Bedrock Geology of the Twin Cities Ten-County
Metropolitan Area, Minnesota. Retrieved from the University of Minnesota Digital Conservancy: http://purl.umn.edu/154925
Nolan, BT., and Stoner, J.D. (2000). Nutrients in Groundwaters of the Conterminous United States, 1992-95: Environmental Science and Technology, 34(7), 1156-1165.
Swanson, L., and Meyer, G.N. (1990). C-05 Geologic atlas of Washington County, Minnesota. Minnesota Geological Survey. Retrieved from the University of Minnesota Digital Conservancy: http://purl.umn.edu/58492
U.S. Environmental Protection Agency. (2009). National Primary Drinking Water Regulations list, On-line PDF Retrieved February 2, 2015, from http://water.epa.gov/drink/contaminants/upload/mcl-2.pdf
Warner, K.L., and Arnold, T.L. (2010). Relations that Affect the Probability and Prediction of Nitrate Concentration in Private Wells in the Glacial Aquifer System in the United States, A USGS National Water-Quality Assessment Program Scientific Investigations Report 2010.
2014 Summary Washington County Township Sampling | 26
Washington County Department of Public Health & Environment [PHE]. (2014). The Washington County Groundwater Plan 2014-2024. On-line PDF Retrieved March 27, 2015, from http://www.co.washington.mn.us/DocumentCenter/View/794
2014 Summary Washington County Township Sampling | 27
APPENDIX A: PRIVATE WELL SURVEY QUESTIONS
Private Well Survey Questions
1. What setting did the water sample come from? Please choose only one. Answers choices: Sub-division, Lake Home, River Home, Country, Municipal/city, or Other.
2. Are there livestock on this property? Yes or No 3. Do you mix or store fertilizer (500lbs or more) on this property? Yes or No 4. Does farming take place on this property? Yes or No
Well Information Section
5. Does your well have a Unique Well ID number? Yes or No 6. If yes, what is the Unique ID?
(6 digit number found on a metal tag attached to your well casing) 7. Type of well construction? Answer choices: Drilled, Sand point, Hand dug, Other, Other, and don’t know. 8. Approximate age (years) of your well? Answer choices: 0-10 years, 11-20 years, 21-40 years, and over 40 years old. 9. Approximate depth of your well Answer choices: 0-50 feet, 51-99 feet, 100-299 feet, and 300 or more feet. 10. Distance to an active or inactive feedlot Answer choices: 0-50 feet, 51-99 feet, 100-299 feet, and 300 or more feet. 11. Distance to a septic system Answer choices: 0-50 feet, 51-99 feet, 100-299 feet, and 300 or more feet. 12. Distance to an agricultural field Answer choices: 0-50 feet, 51-99 feet, 100-299 feet, and 300 or more feet. 13. Is this well currently used for human consumption? Yes or no 14. Please check any water treatment you have other than a water softener. Answer choices: None, Reverse osmosis, distillation, filtering system and other. 15. When did you last have your well tested for nitrates?
Answer choices: Never, with the last year, within the last 3 years, the last 10, or 10 or more.
16. What was the result of your last nitrate test? Answer choices: 0<3, 3<10, 10 or greater, or don’t know.
2014 Summary Washington County Township Sampling | 28
APPENDIX B: PRIVATE WELL SURVEY ANSWERS
Table 7. Property Setting for Well Location
Property Setting
Community Cottage Grove Denmark Township Total
Total Wells 300 226 526
Setting Percent
Country 48.0% 74.9% 59.1%
Lake 0.0% 0.9% 0.4%
River 11.3% 7.5% 9.7%
Sub-division 27.3% 9.7% 19.8%
Other 6.3% 3.1% 4.9%
Not Available 7.0% 4.9% 6.1%
Table 8. Well Construction Type
Well Construction Type
Community Cottage Grove Denmark Township Total
Total Wells 300 226 526
Well Type Percent
Drilled 79.0% 85.4% 81.7%
Sand Point 2.0% 11.3% 1.7%
Other 1.0% 0.0% 0.6%
Not Available 18.0% 13.3% 16.0%
Table 9. Age of Well
Well Age
Community Cottage Grove Denmark Township Total
Total Wells 300 226 526
Age Percent
0-10 years 4.7% 12.8% 8.2%
11-20 years 18.0% 23.9% 20.5%
21-40 years 51.0% 37.2% 45.1%
Over 40 years 21.3% 19.5% 20.5%
Not available 5.0% 6.6% 5.7%
2014 Summary Washington County Township Sampling | 29
Table 10. Depth of Well
Well Depth
Community Cottage Grove Denmark Township Total
Total Wells 300 226 526
Depth Percent
0-50 feet 1.0% 0.9% 1.0%
51-99 feet 5.7% 4.4% 5.1%
100-299 feet 56.7% 47.3% 52.7%
Over 300 feet 19.0% 28.3% 23.0%
Not available 17.7% 19.0% 18.3%
Table 11. Unique Well ID Known
Does the Well Have a Unique ID
Community Cottage Grove Denmark Township Total
Total Wells 300 226 526
Unique ID Percent
No 22.0% 20.4% 21.3%
Yes 15.7% 18.8% 18.8%
Not Available 63.3% 55.4% 59.9%
Table 12. Livestock Located on Property
Livestock on Property
Community Cottage Grove Denmark Township Total
Total Wells 300 226 526
Livestock Percent
No 93.0% 92.9% 93.0%
Yes 1.7% 2.7% 2.1%
Not Available 5.3% 4.4% 4.9%
2014 Summary Washington County Township Sampling | 30
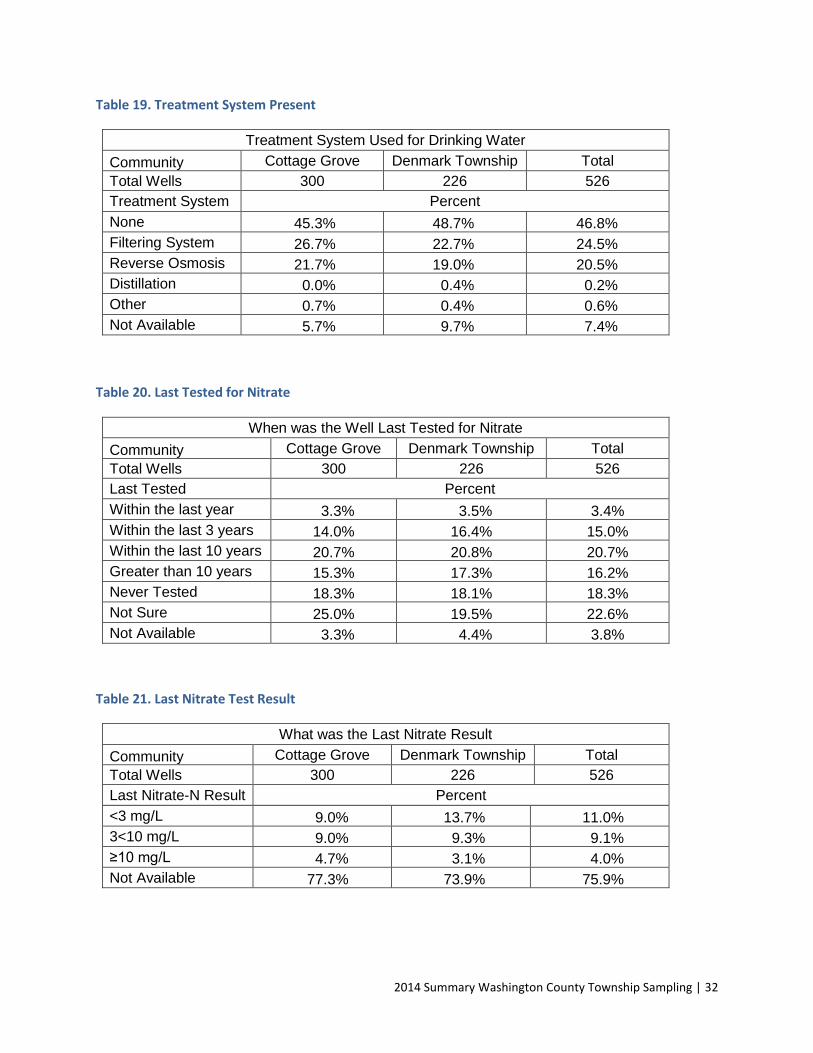
Table 13. Fertilizer Stored on Property
Fertilizer Stored on the Property
Community Cottage Grove Denmark Township Total
Total Wells 300 226 526
Fertilizer Percent
No 95.0% 94.7% 94.9%
Yes 0.0% 0.9% 0.4%
Not Available 5.0% 4.4% 4.8%
Table 14. Farming on Property
Does Farming Take Place on the Property
Community Cottage Grove Denmark Township Total
Total Wells 300 226 526
Farming Percent
No 91.3% 72.6% 83.3%
Yes 3.7% 23.0% 12.0%
Not Available 5.0% 4.4% 4.8%
Table 15. Distance to an Active or Inactive Feedlot
Distance to Feedlot
Community Cottage Grove Denmark Township Total
Total Wells 300 226 526
Feedlot Percent
0-50 feet 3.0% 7.1% 4.8%
51-99 feet 2.3% 2.2% 2.3%
100-299 feet 1.7% 5.8% 3.4%
Over 300 feet 78.0% 69.9% 74.5%
Not available 15.0% 15.0% 15.0%
2014 Summary Washington County Township Sampling | 31
Table 16. Distance to Septic System
Distance to Septic System
Community Cottage Grove Denmark Township Total
Total Wells 300 226 526
Septic Percent
0-50 feet 7.3% 4.0% 5.9%
51-99 feet 35.0% 23.5% 30.0%
100-299 feet 44.3% 54.9% 48.9%
Over 300 feet 7.7% 9.3% 8.4%
Not available 5.7% 8.4% 6.8%
Table 17. Distance to Agricultural Field
Distance to Agriculture Field
Community Cottage Grove Denmark Township Total
Total Wells 300 226 526
Distance to Field Percent
0-50 feet 1.3% 6.2% 3.4%
51-99 feet 4.7% 6.6% 5.5%
100-299 feet 16.3% 25.7% 20.3%
Over 300 feet 72.0% 53.5% 64.1%
Not available 5.7% 8.0% 6.7%
Table 18. Drinking Water Well
Is the Well Used for Drinking Water
Community Cottage Grove Denmark Township Total
Total Wells 300 226 526
Drinking Water Percent
No 0.7% 4.9% 0.6%
Yes 94.0% 94.7% 94.3%
Not Available 5.3% 4.9% 5.1%
2014 Summary Washington County Township Sampling | 32