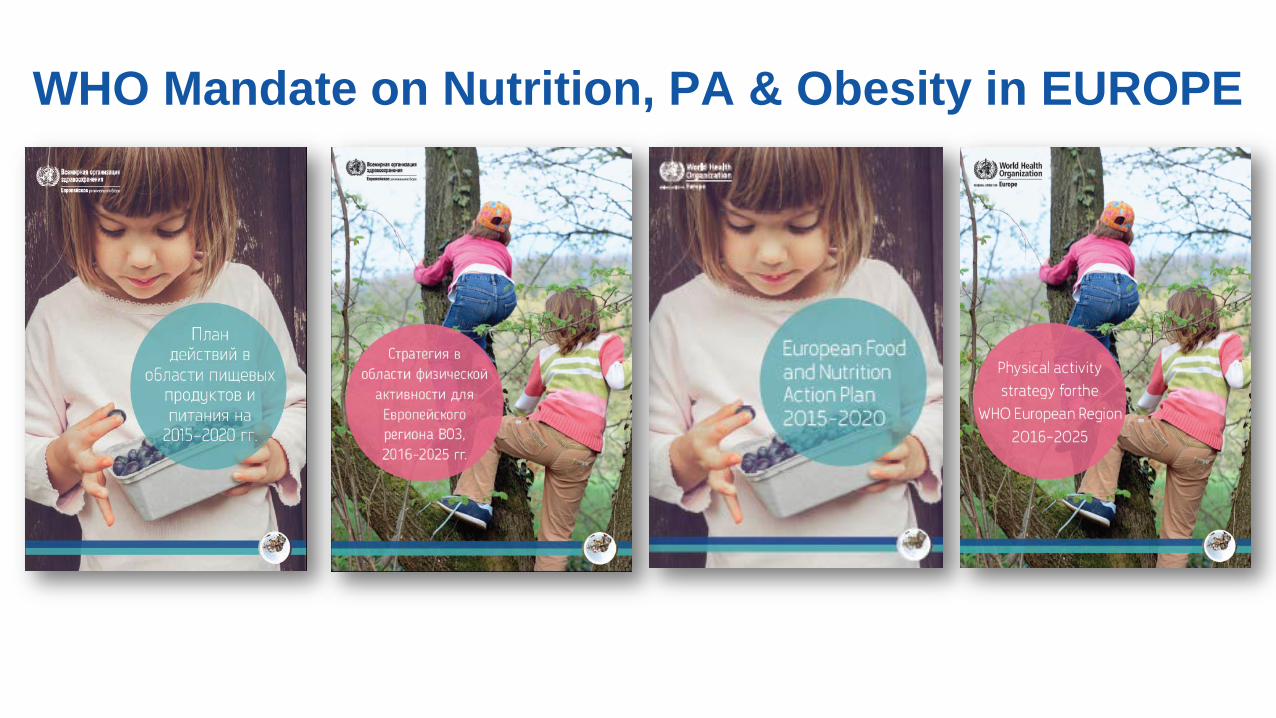
Initiatives and Actions addressing nutrition, physical activity and obesity by WHO Dr João Breda, MPH PhD MBA Programme Manager Nutrition, Physical Activity & Obesity WHO Regional Office for Europe Budapest, 1 December 2016
Transcript
Initiatives and Actions addressing nutrition, physical activity and
obesity by WHO
Dr João Breda, MPH PhD MBA Programme Manager Nutrition, Physical Activity & Obesity
WHO Regional Office for Europe
Budapest, 1 December 2016
CHALLENGES
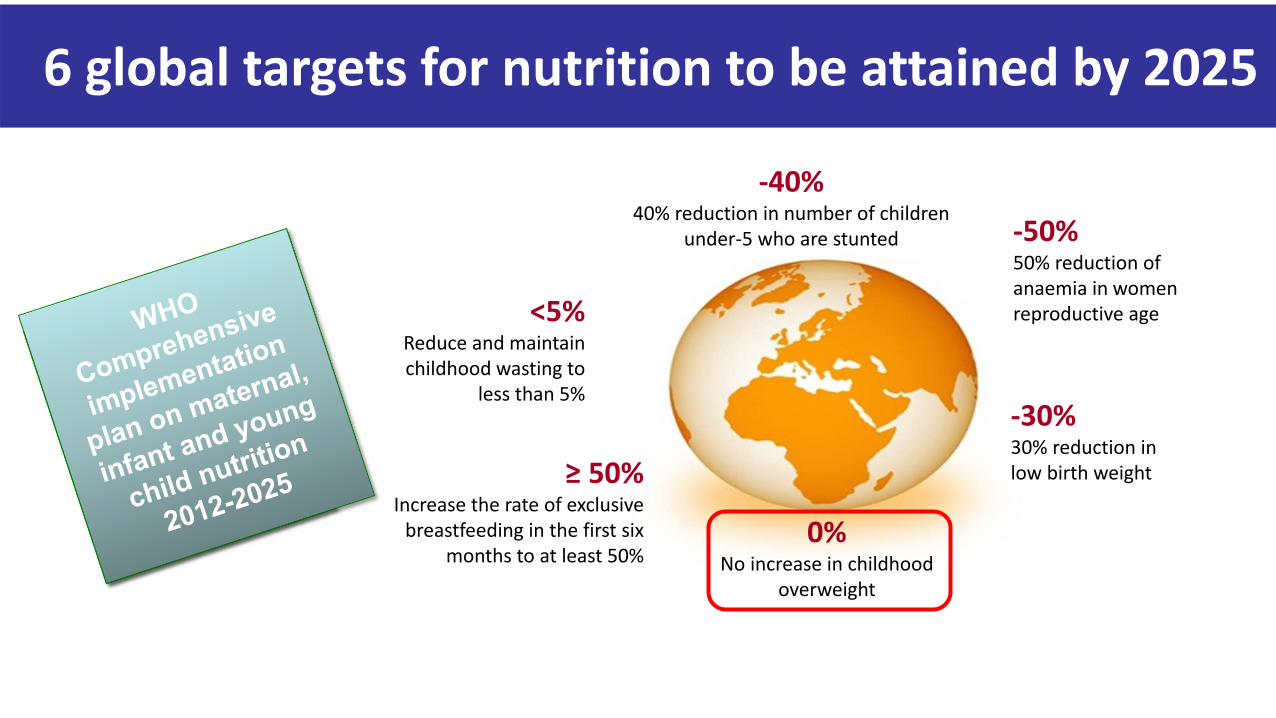
-40% 40% reduction in number of children
under-5 who are stunted
-30% 30% reduction in low birth weight ≥ 50%
Increase the rate of exclusive breastfeeding in the first six
months to at least 50%
-50% 50% reduction of anaemia in women reproductive age
0% No increase in childhood
overweight
<5% Reduce and maintain childhood wasting to
less than 5%
6 global targets for nutrition to be attained by 2025
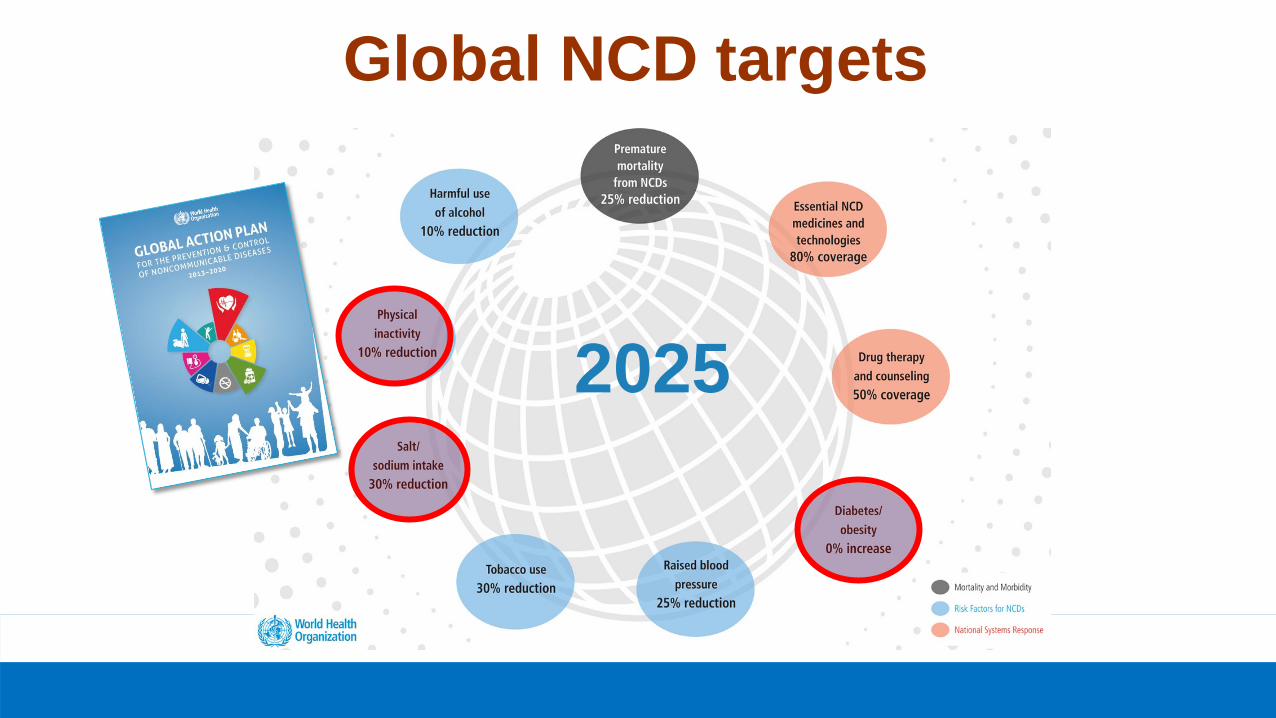
Global NCD targets
2025
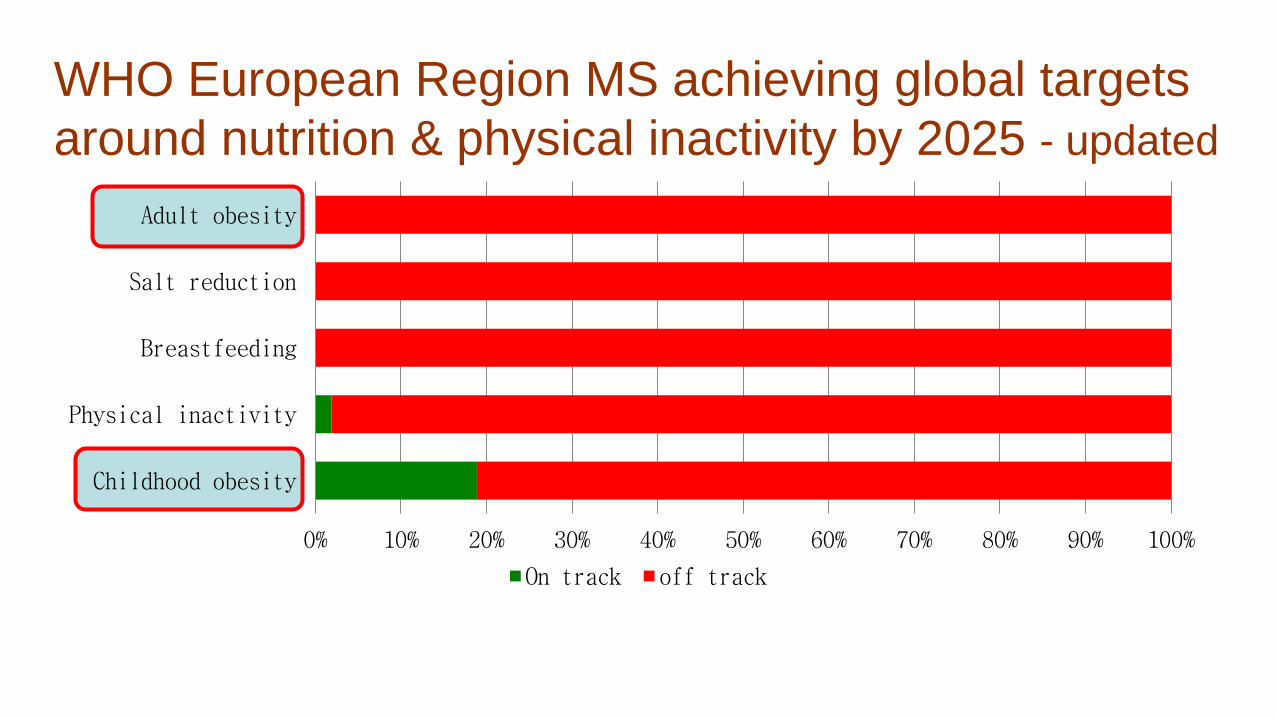
WHO European Region MS achieving global targets around nutrition & physical inactivity by 2025 - updated
0% 10% 20% 30% 40% 50% 60% 70% 80% 90% 100%
Childhood obesity
Physical inactivity
Breastfeeding
Salt reduction
Adult obesity
On track off track
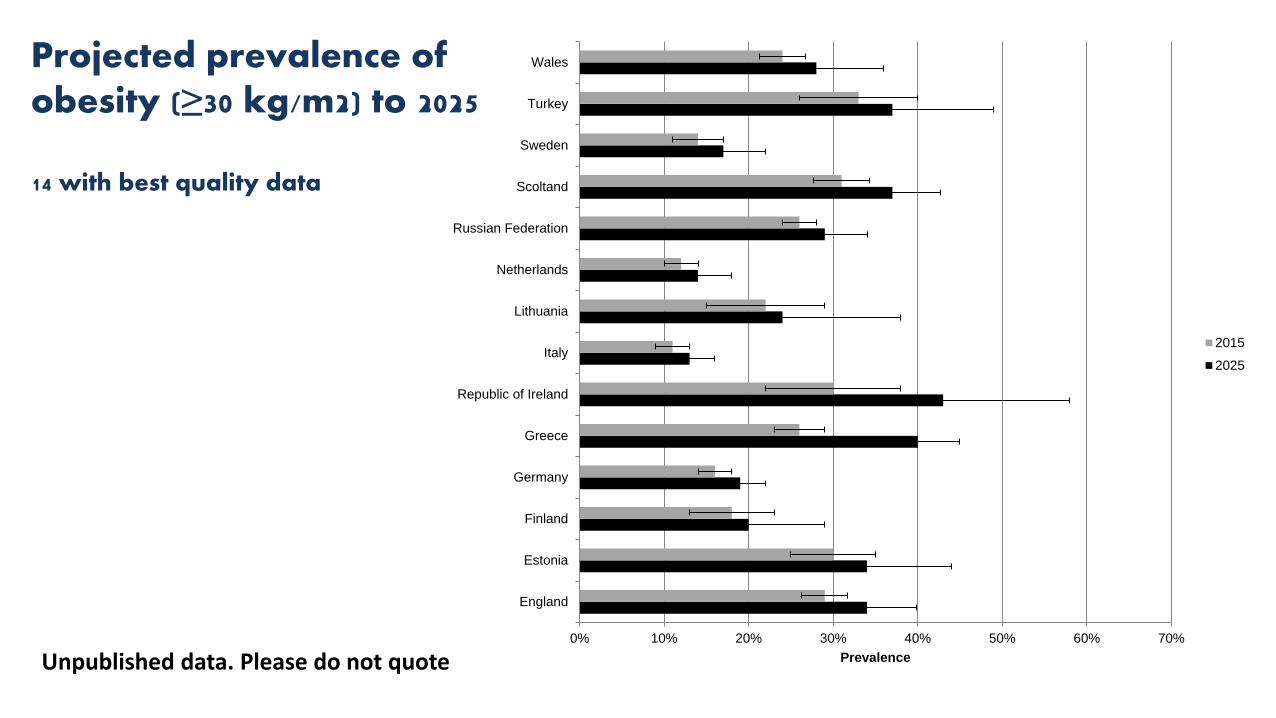
Projected prevalence of obesity (≥30 kg/m2) to 2025 14 with best quality data
0% 10% 20% 30% 40% 50% 60% 70%
England
Estonia
Finland
Germany
Greece
Republic of Ireland
Italy
Lithuania
Netherlands
Russian Federation
Scoltand
Sweden
Turkey
Wales
Prevalence
2015
2025
Unpublished data. Please do not quote
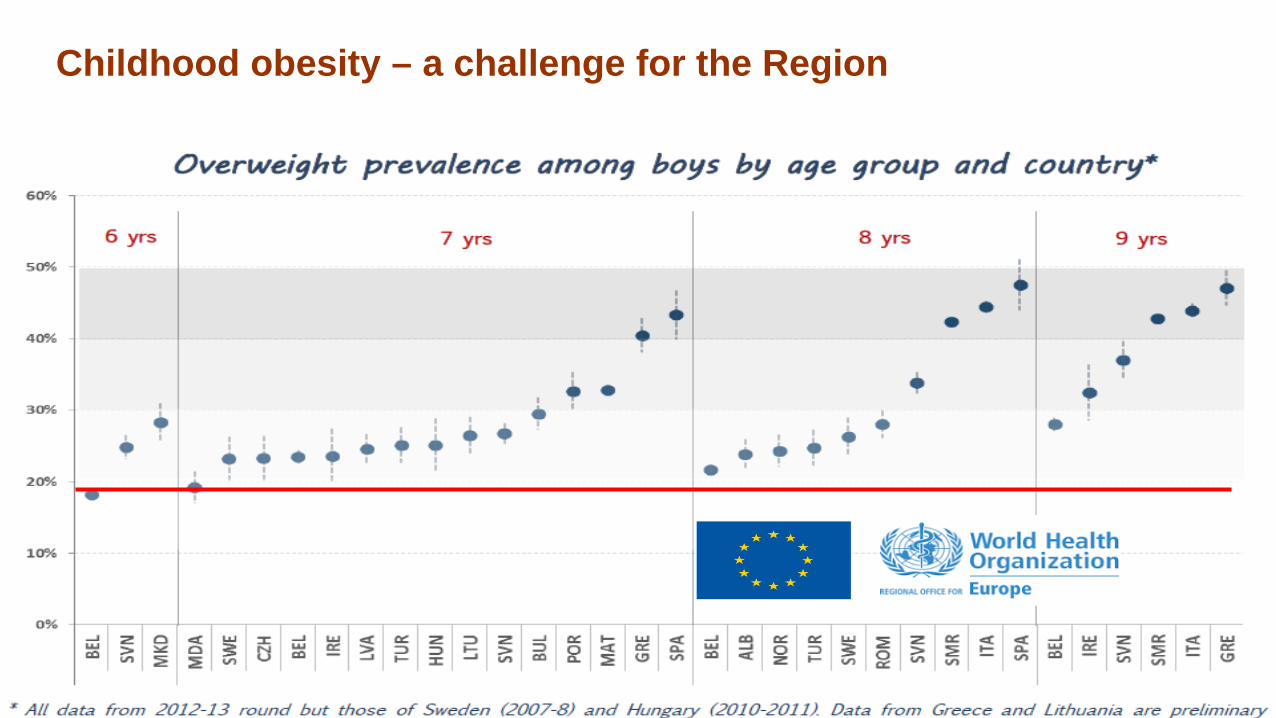
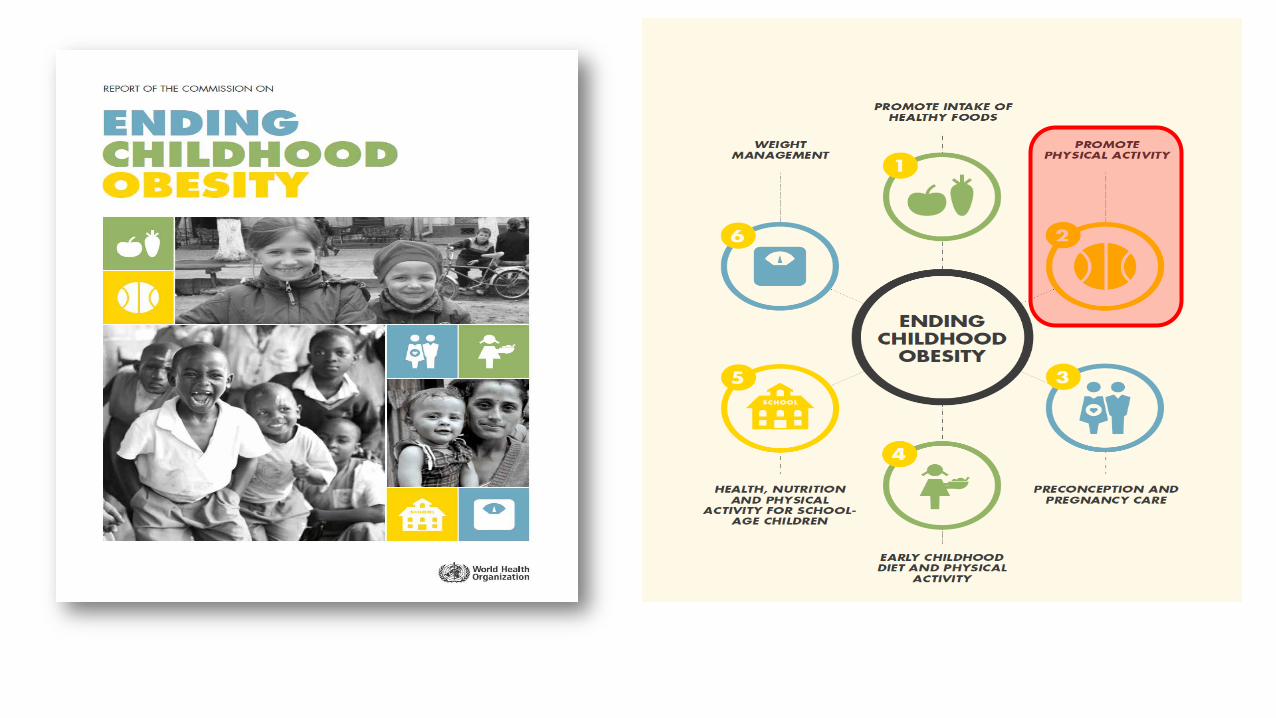
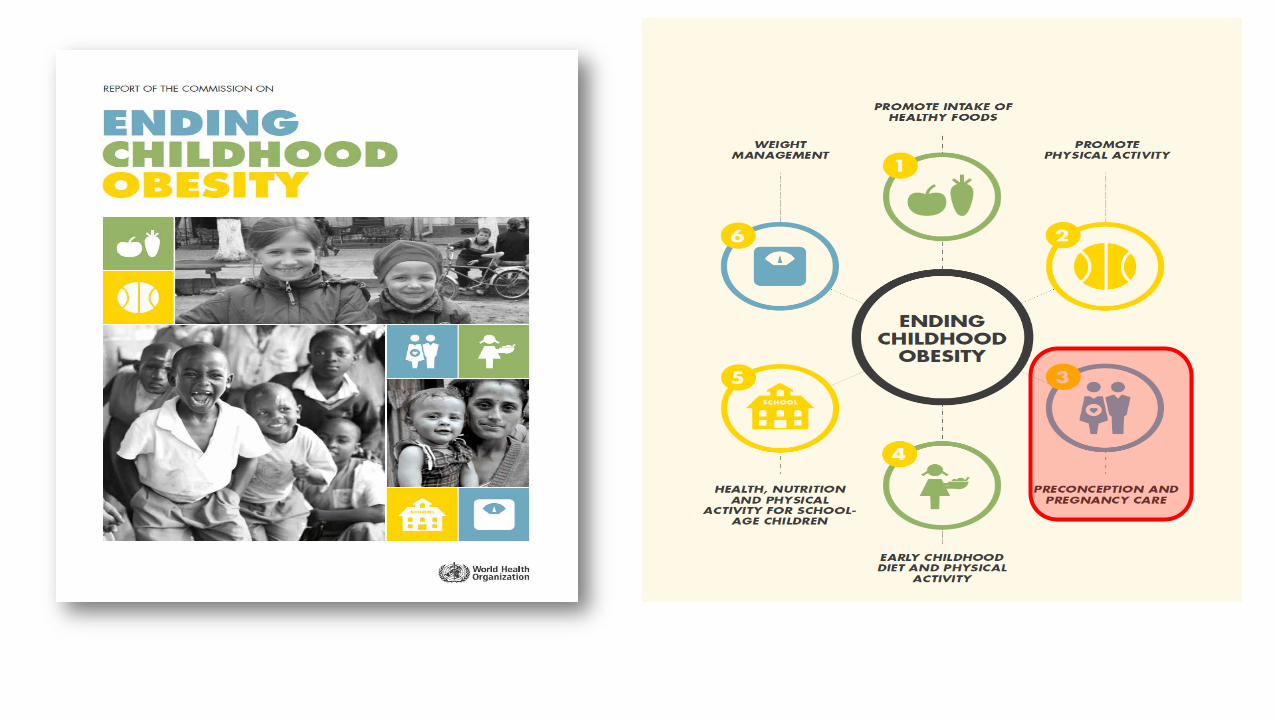
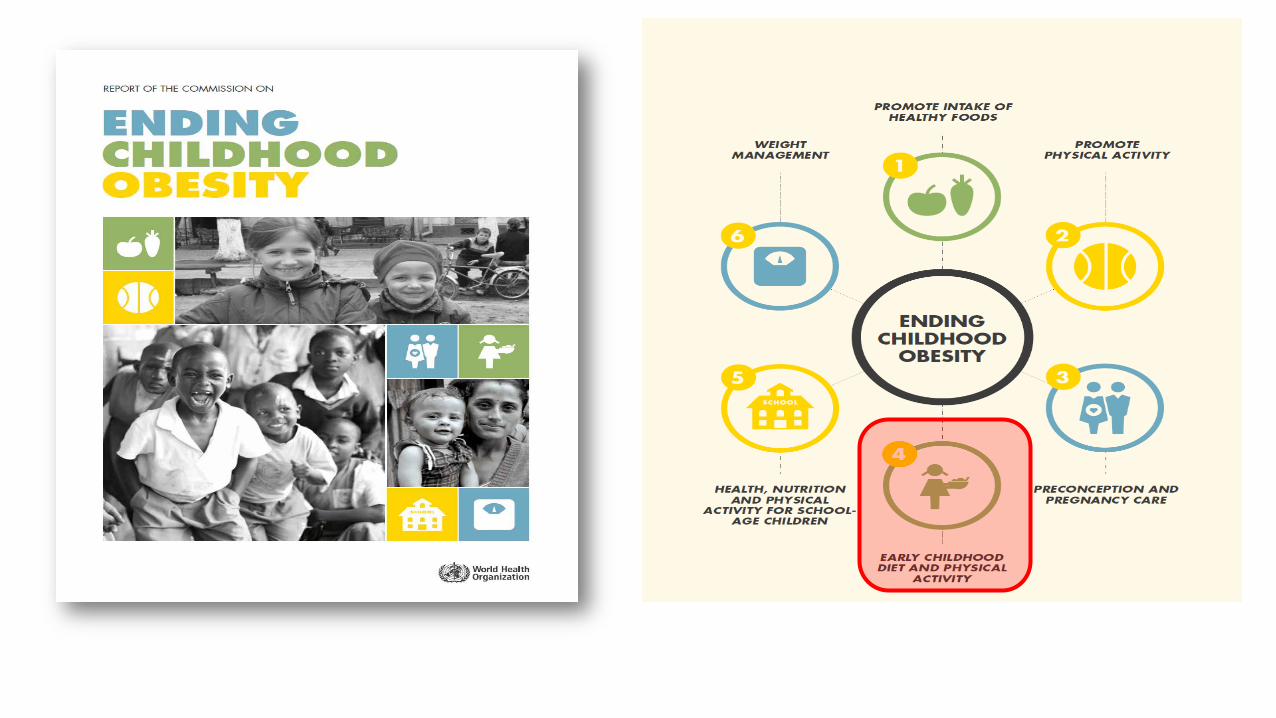
Childhood obesity – a challenge for the Region
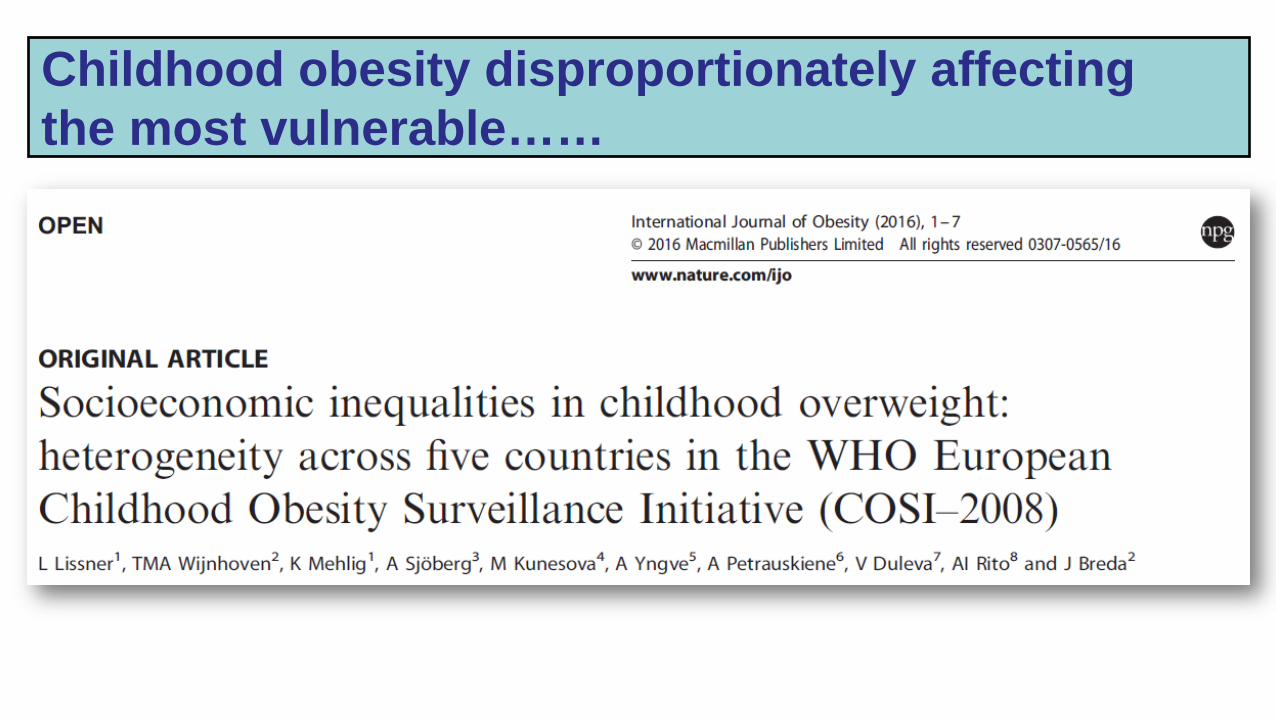
Childhood obesity disproportionately affecting the most vulnerable……
Adolescents - overweight (including obesity) prevalence in youth according to “sub-region”
14,1
20,2
11,5
15,5 14,7
21,3
15,6 16,2 15,3
22,5
18,5 17,3
0
5
10
15
20
25
30
Western Europe Southern Europe Eastern Europe Northern Europe
%
2002
2006
2010
Overweight prevalence distribution according to geographical region in 32 countries within WHO European Region, considering both boys and girls with 11, 13, 15 (Source: HBSC).
Highest Levels
0
10
20
30
40
50
60
70
80
90
100
%
2010
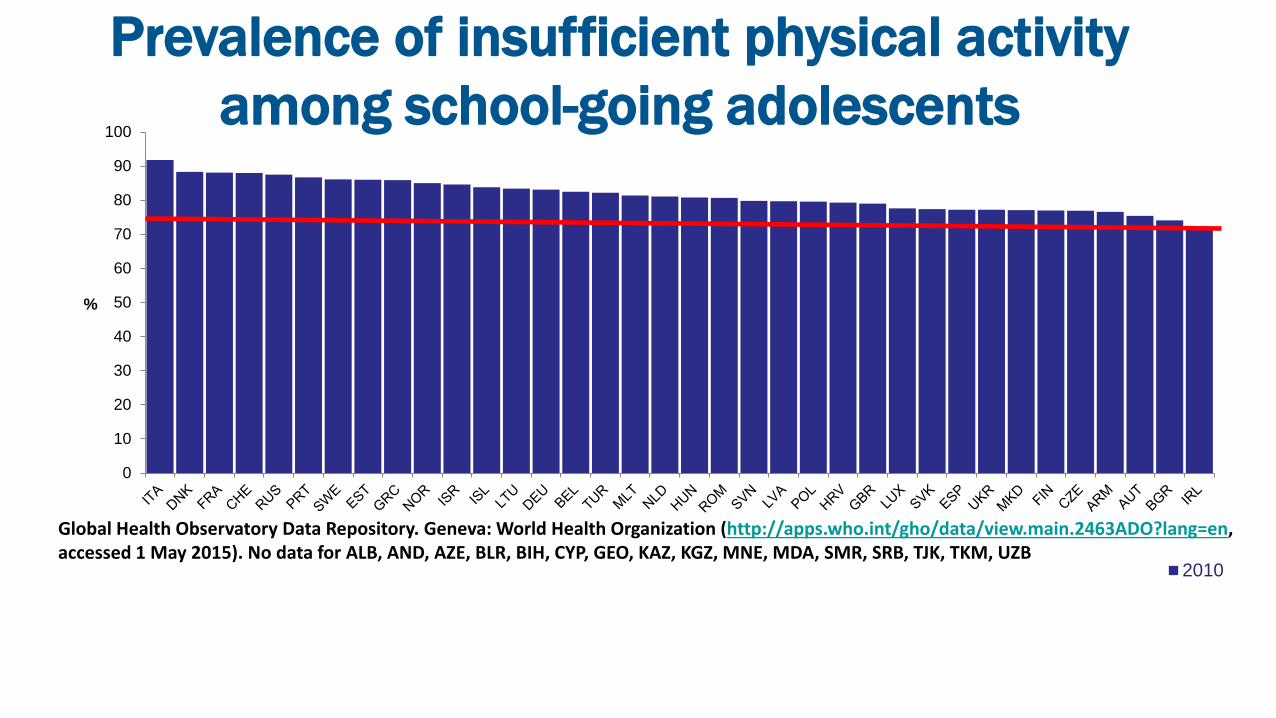
Prevalence of insufficient physical activity among school-going adolescents
Global Health Observatory Data Repository. Geneva: World Health Organization (http://apps.who.int/gho/data/view.main.2463ADO?lang=en, accessed 1 May 2015). No data for ALB, AND, AZE, BLR, BIH, CYP, GEO, KAZ, KGZ, MNE, MDA, SMR, SRB, TJK, TKM, UZB
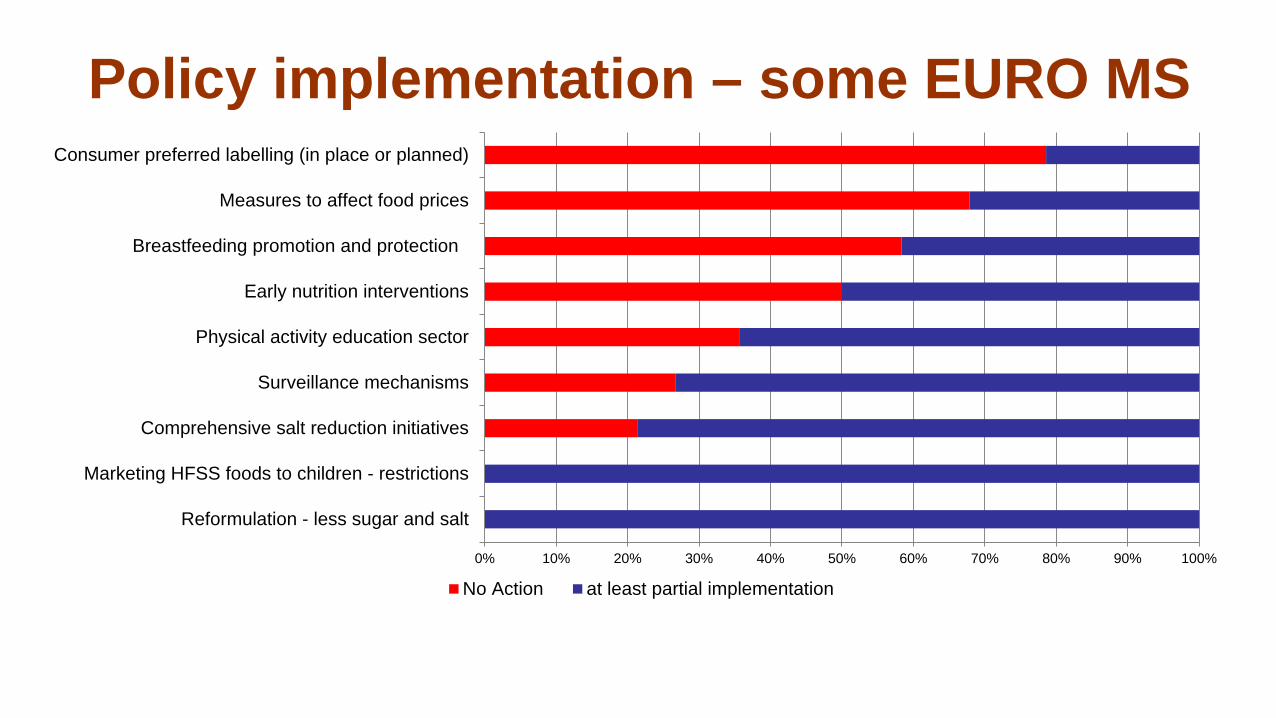
Consumer preferred labelling (in place or planned)
No Action at least partial implementation
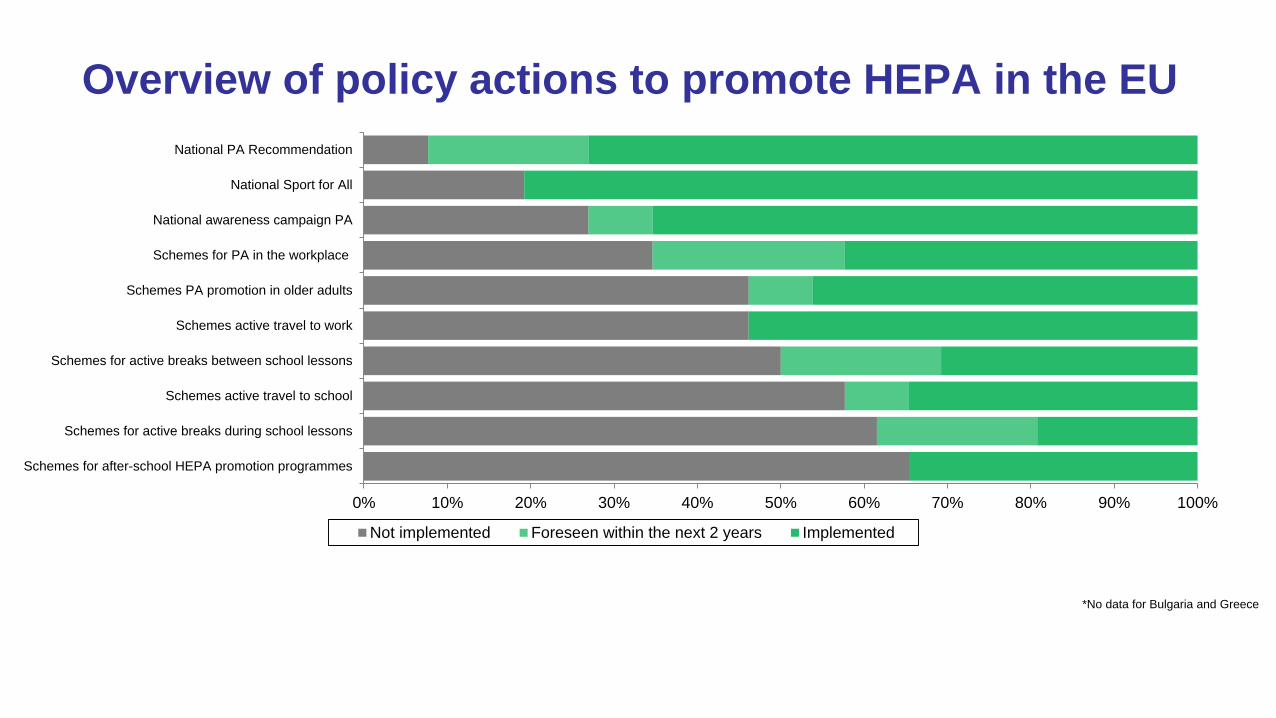
Overview of policy actions to promote HEPA in the EU Po
licy
Act
ions
0% 10% 20% 30% 40% 50% 60% 70% 80% 90% 100%
Schemes for after-school HEPA promotion programmes
Schemes for active breaks during school lessons
Schemes active travel to school
Schemes for active breaks between school lessons
Schemes active travel to work
Schemes PA promotion in older adults
Schemes for PA in the workplace
National awareness campaign PA
National Sport for All
National PA Recommendation
Not implemented Foreseen within the next 2 years Implemented
*No data for Bulgaria and Greece
WHO GUIDELINES AND MANDATE
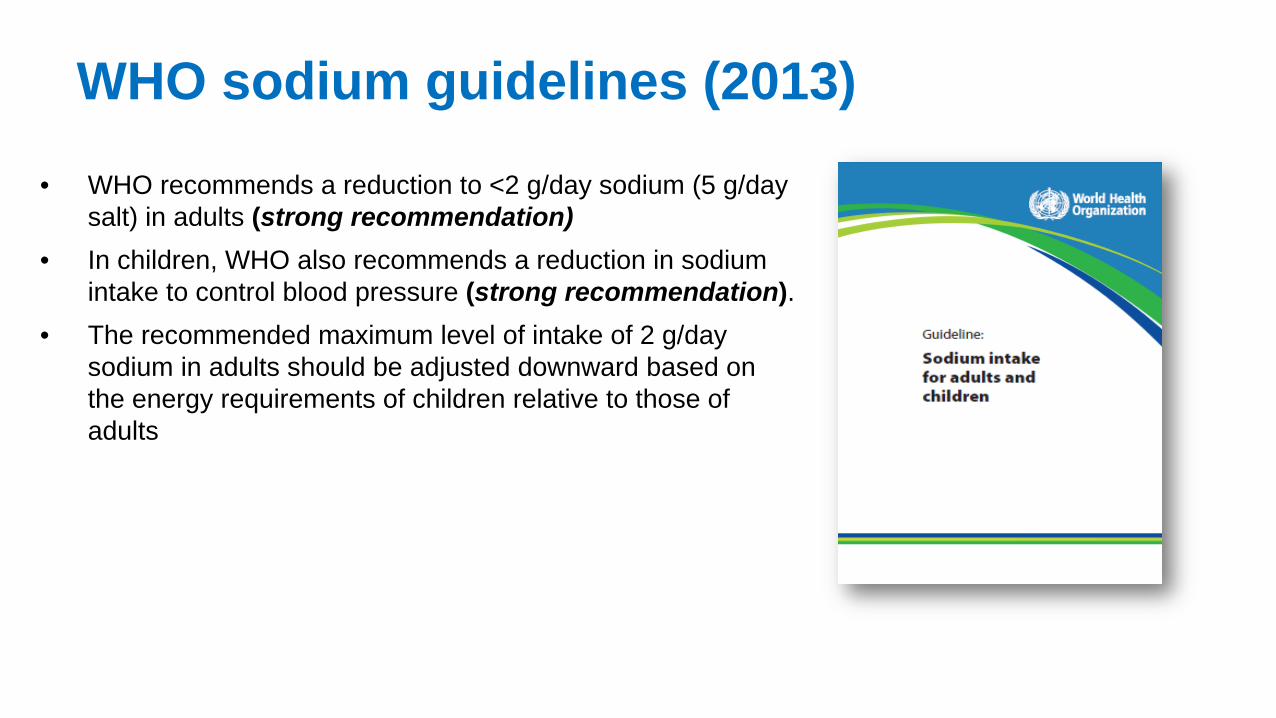
WHO sodium guidelines (2013)
• WHO recommends a reduction to <2 g/day sodium (5 g/day salt) in adults (strong recommendation)
• In children, WHO also recommends a reduction in sodium intake to control blood pressure (strong recommendation).
• The recommended maximum level of intake of 2 g/day sodium in adults should be adjusted downward based on the energy requirements of children relative to those of adults
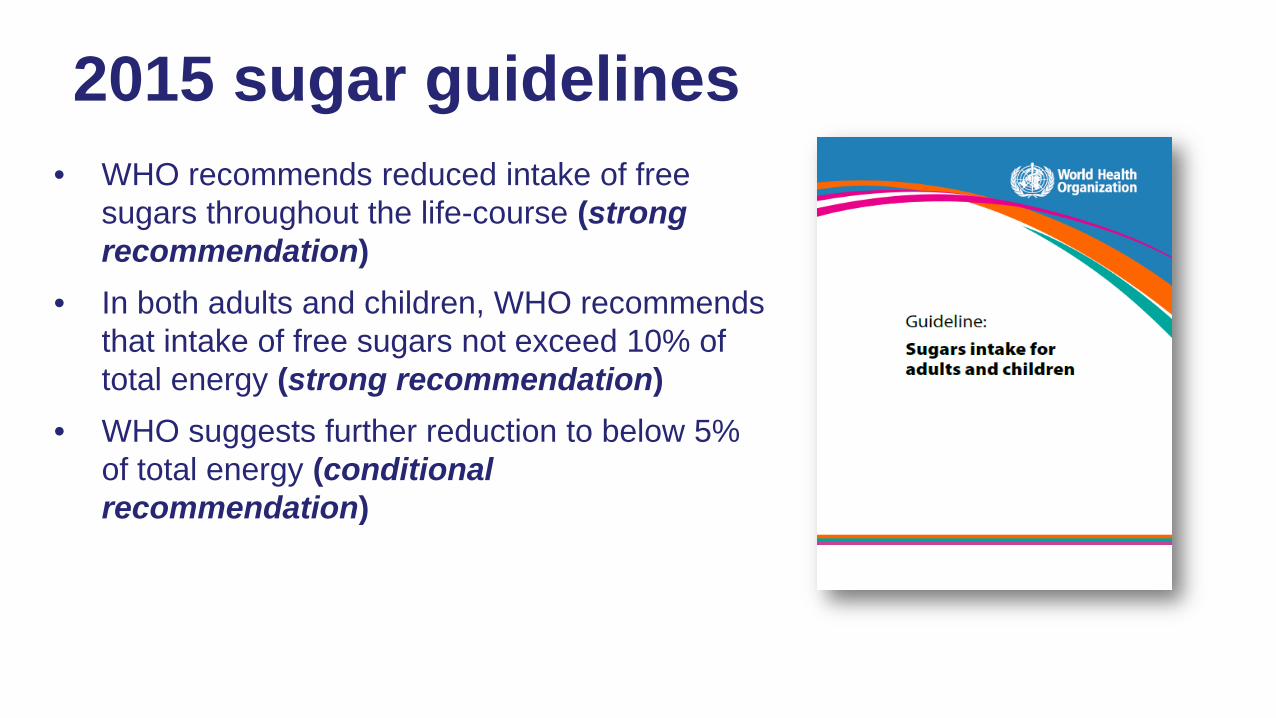
2015 sugar guidelines • WHO recommends reduced intake of free
sugars throughout the life-course (strong recommendation)
• In both adults and children, WHO recommends that intake of free sugars not exceed 10% of total energy (strong recommendation)
• WHO suggests further reduction to below 5% of total energy (conditional recommendation)
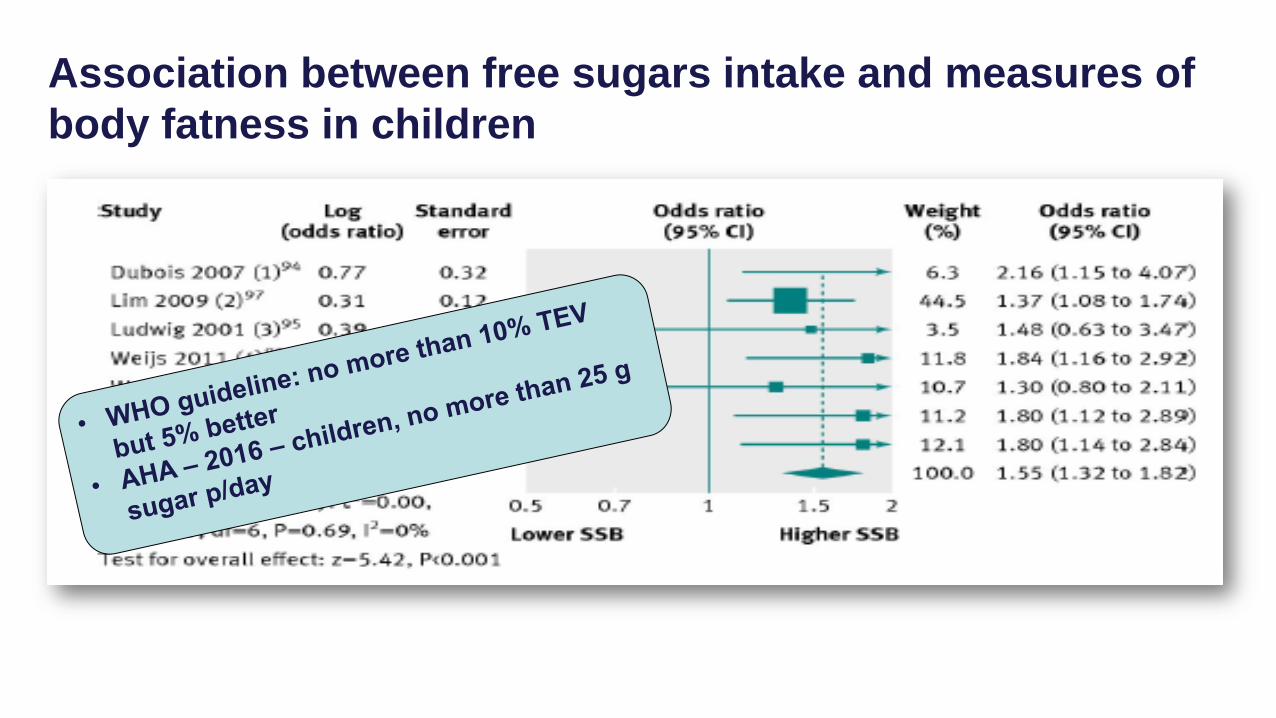
Association between free sugars intake and measures of body fatness in children
Source : Te Morenga et al., 2012
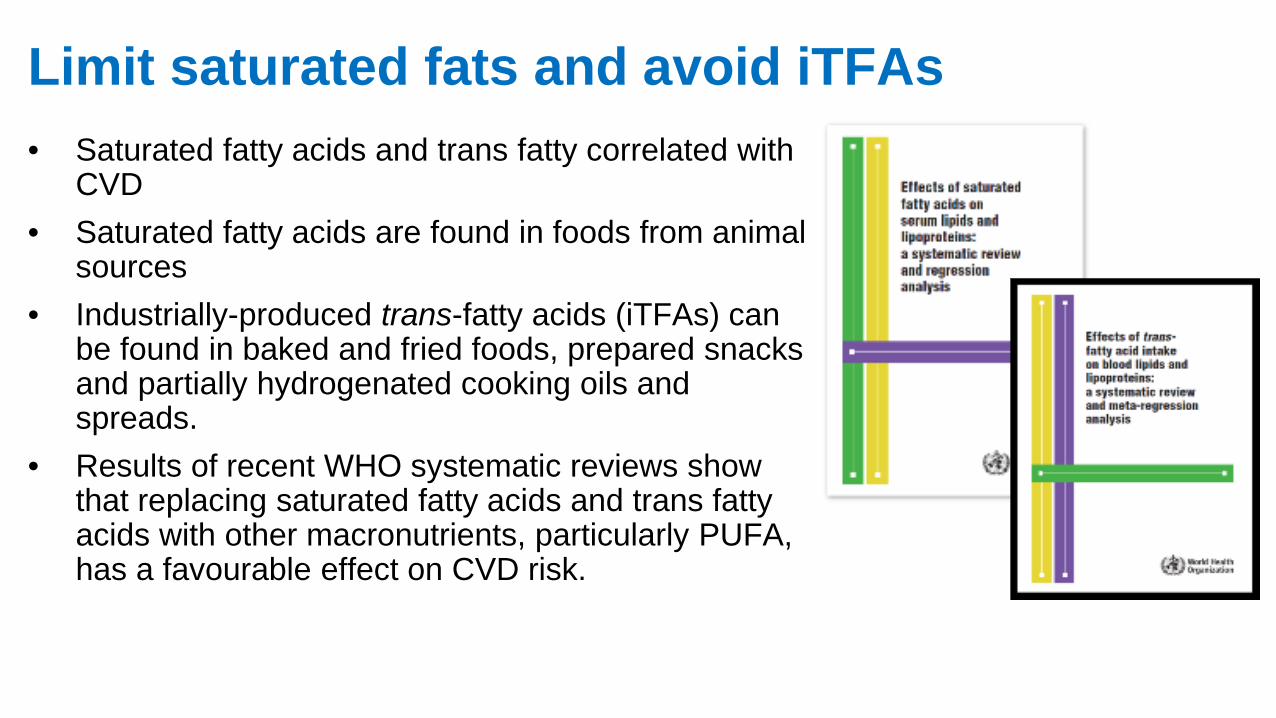
Limit saturated fats and avoid iTFAs • Saturated fatty acids and trans fatty correlated with
CVD • Saturated fatty acids are found in foods from animal
sources • Industrially-produced trans-fatty acids (iTFAs) can
be found in baked and fried foods, prepared snacks and partially hydrogenated cooking oils and spreads.
• Results of recent WHO systematic reviews show that replacing saturated fatty acids and trans fatty acids with other macronutrients, particularly PUFA, has a favourable effect on CVD risk.
IARC monographs (Aug 2016)
• Overweight / Obesity • Confirmed: colorectal, oesophagus, kidney, breast in
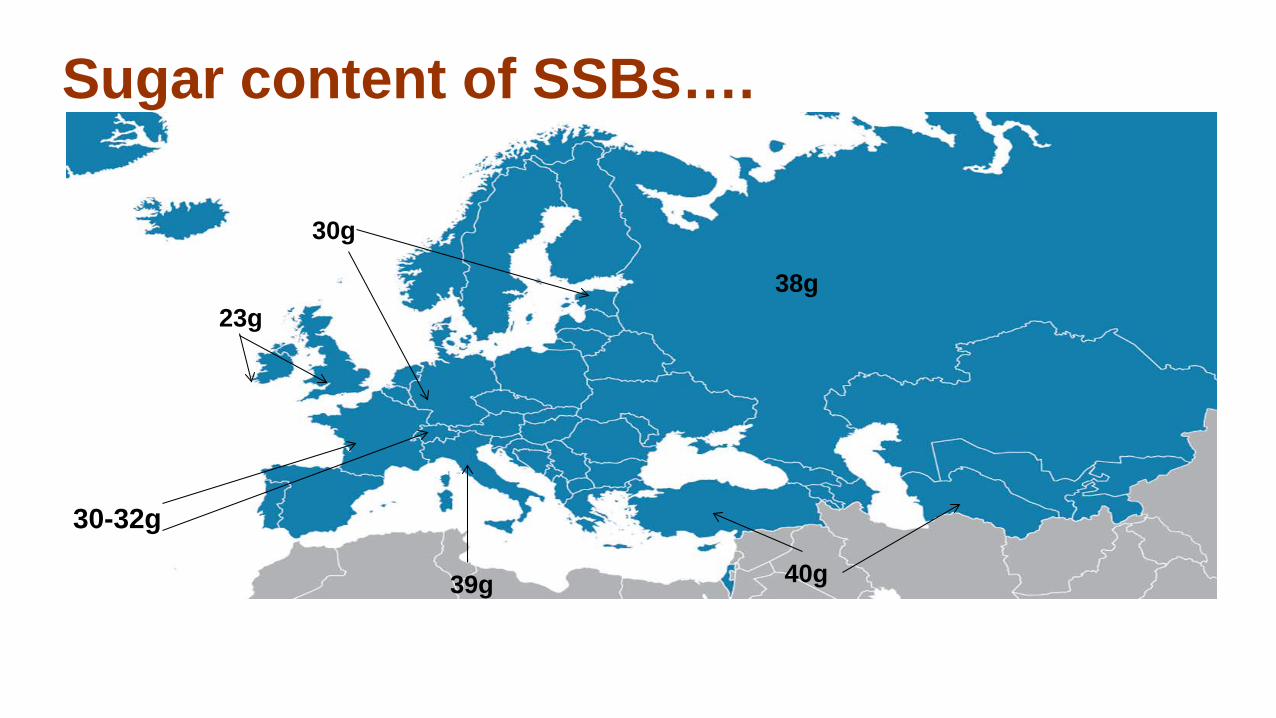
Refers to the sugar content of a 330ml can of a popular international soft drink brand. Source: Action on Sugar, 2015 & WHO/Europe
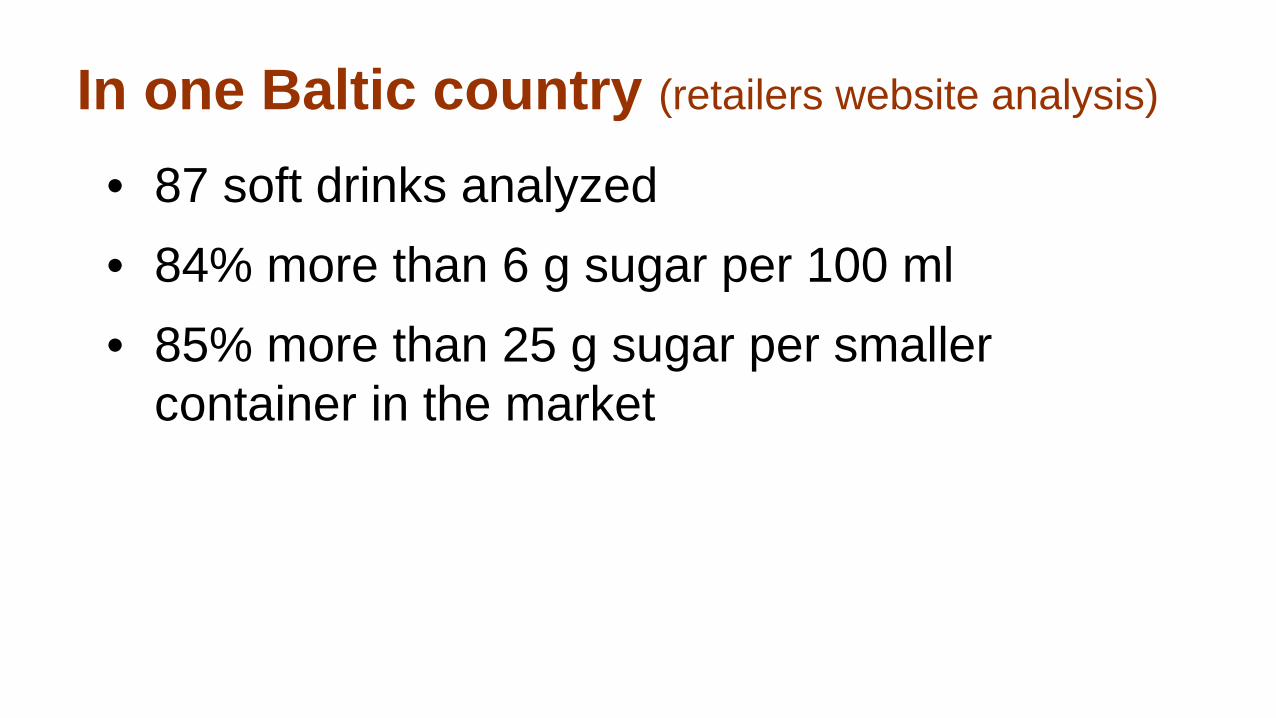
In one Baltic country (retailers website analysis)
• 87 soft drinks analyzed • 84% more than 6 g sugar per 100 ml • 85% more than 25 g sugar per smaller
container in the market
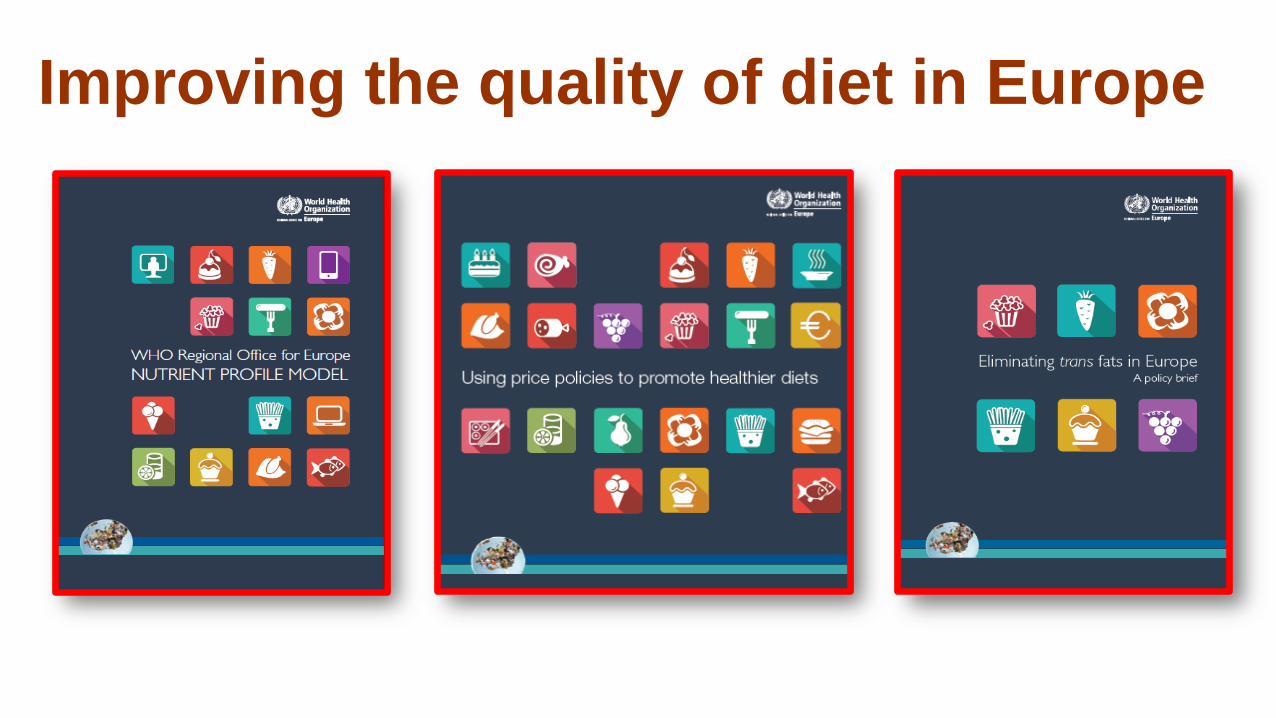
Improving the quality of diet in Europe
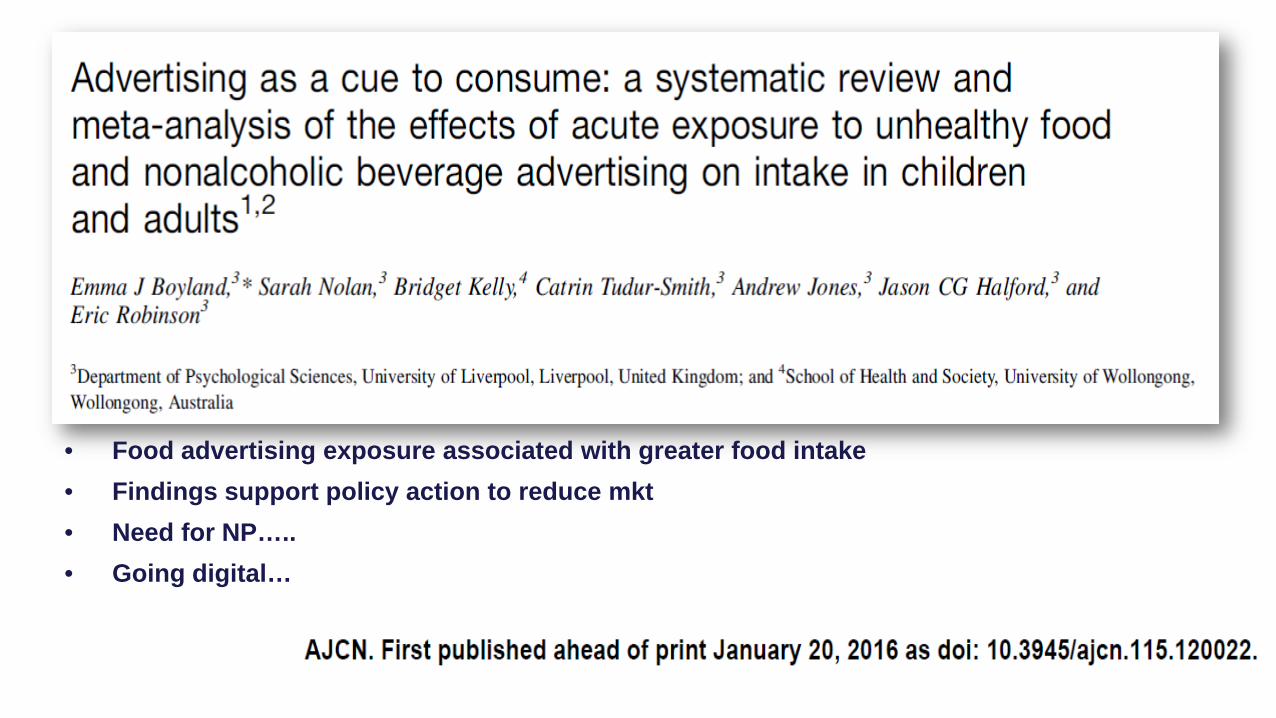
• Food advertising exposure associated with greater food intake • Findings support policy action to reduce mkt • Need for NP….. • Going digital…
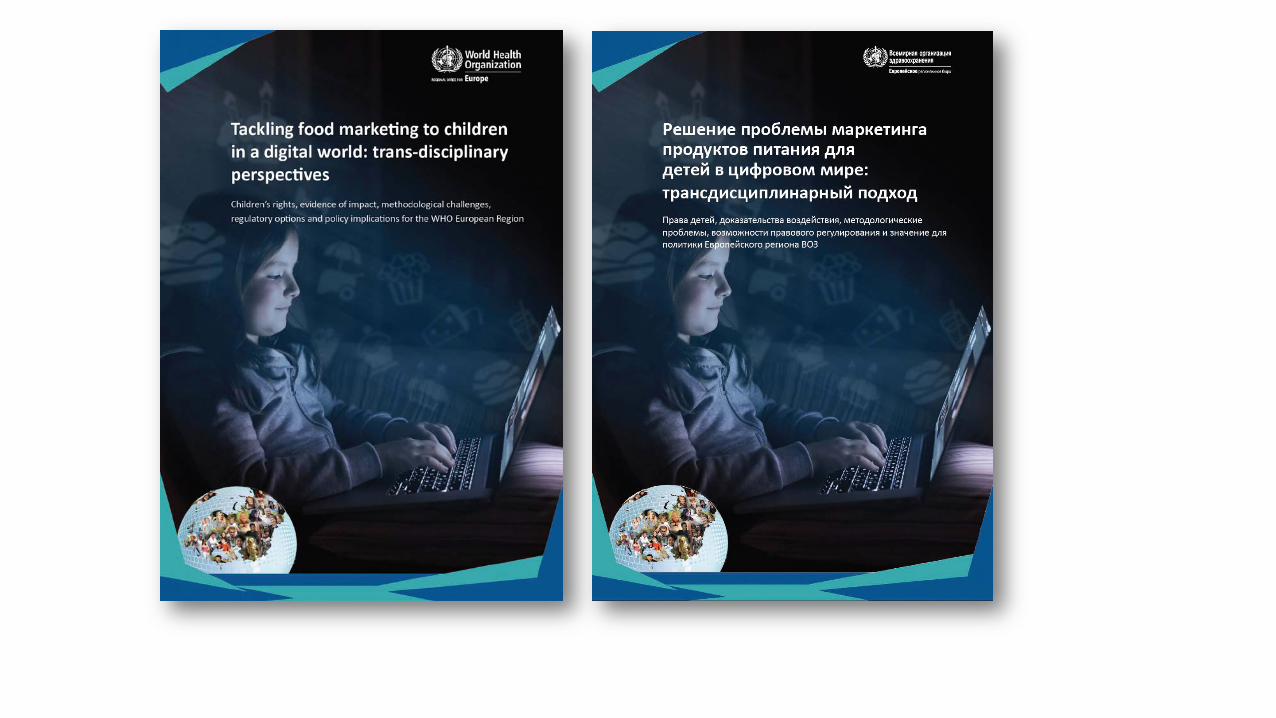
New WHO report suggests clear steps for effective policy-making • Governments in the Region should recognize the problem and acknowledge
their duty to protect children online – “parental responsibility” argument unfair and insufficient
• Offline protections (e.g. TV restrictions) should logically be extended to online areas;
• The age range to which protection applies should be defined by governments, not commercial entities (at least 16 years according to WHO);
• Clear definition of the types of marketing covered and what is considered “marketing to children” (e.g. X Factor??)
• Compel private Internet platforms to remove marketing of foods high in saturated fat, salt and/or free sugars
• Action on internet marketing – by its nature cross-border – lends itself particularly well to EU level action (AVMS Directive an opportunity?)
Using price policies for healthier diets • Well-established role of price as a driver of food choice.. • Interest in taxes and subsidies to improve diets and prevent NCDs • Taxation specialists recognize that tax system plays a role in supporting other policy objectives
(i.e. tobacco and alcohol) • Governments to correct the tendency of the market to encourage the consumption of products with
a documented negative impact on health
Evidence – summary • Price policies applied to food can influence what consumers
buy and contribute to improving health • Effects are highly dependent on way that they are designed –
likely to be a knock-on effect for foods and/or nutrients beyond those that are targeted
• Taxes are more effective when applied to non-core foods for which there are close untaxed healthy alternatives, such as SSBs
• Non-trivial taxes may be needed (i.e. 20%) • Absolute impact of taxes on low socioeconomic groups is likely
to favour health
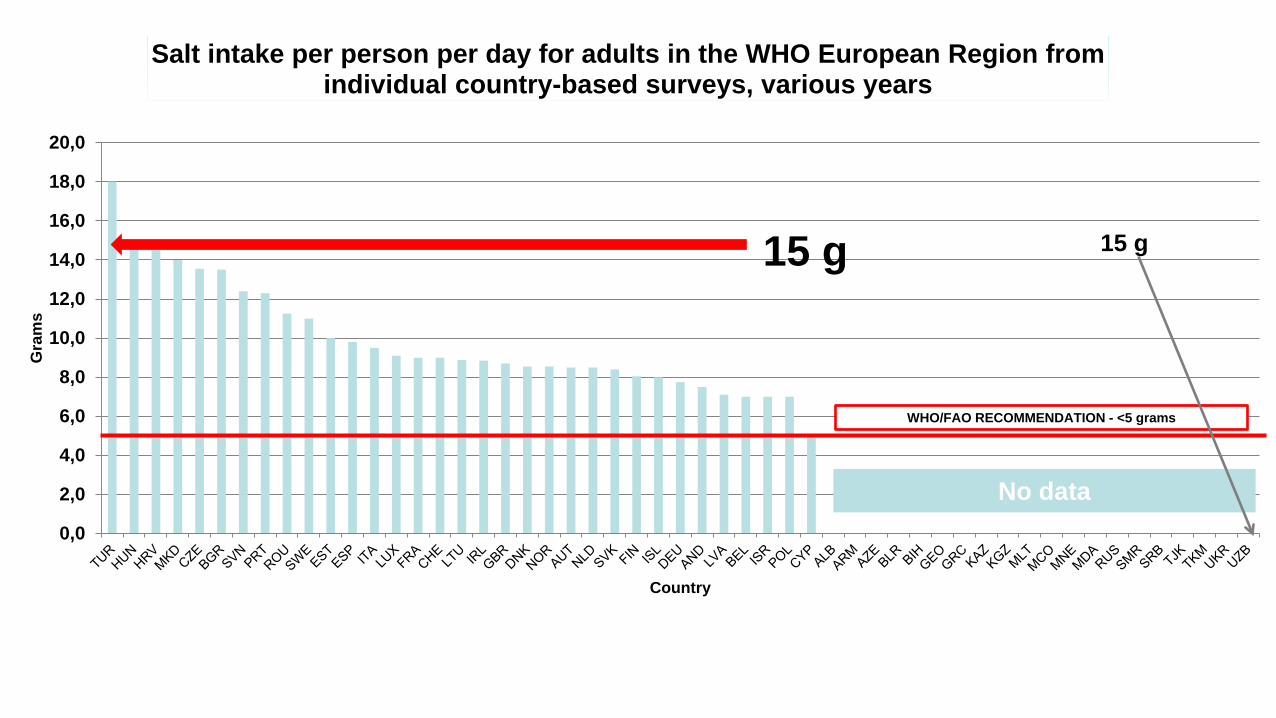
0,0
2,0
4,0
6,0
8,0
10,0
12,0
14,0
16,0
18,0
20,0
Gra
ms
Country
Salt intake per person per day for adults in the WHO European Region from individual country-based surveys, various years
WHO/FAO RECOMMENDATION - <5 grams
15 g
No data
15 g
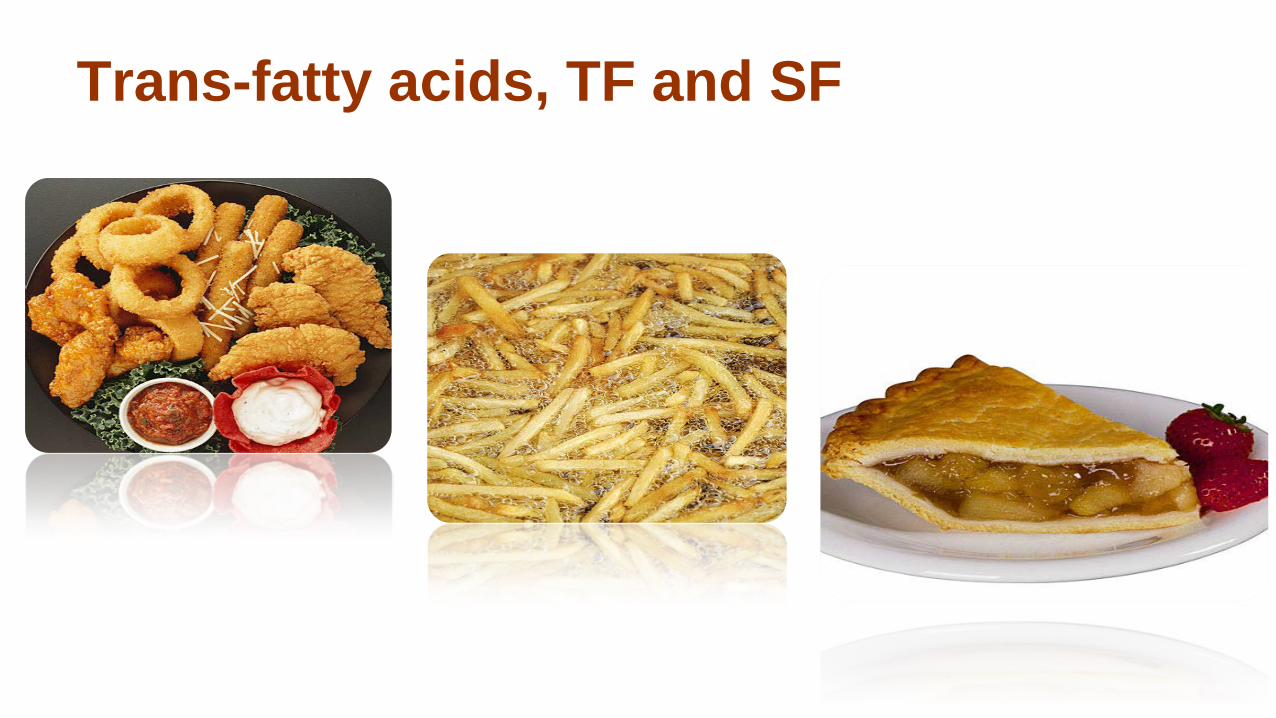
Trans-fatty acids, TF and SF
In one Baltic MS:partly hydrogenated vegetable fat/oil (survey based) 43% of the producers used PHVF in their products
Handlers that produce: pastries, confectionery products made of flour, confectionery containing sugar, half-fabricates, ice cream, mayonnaise and other sauces
Out of the 47 producers that used PHVF, 43 were based in the capital (92%)
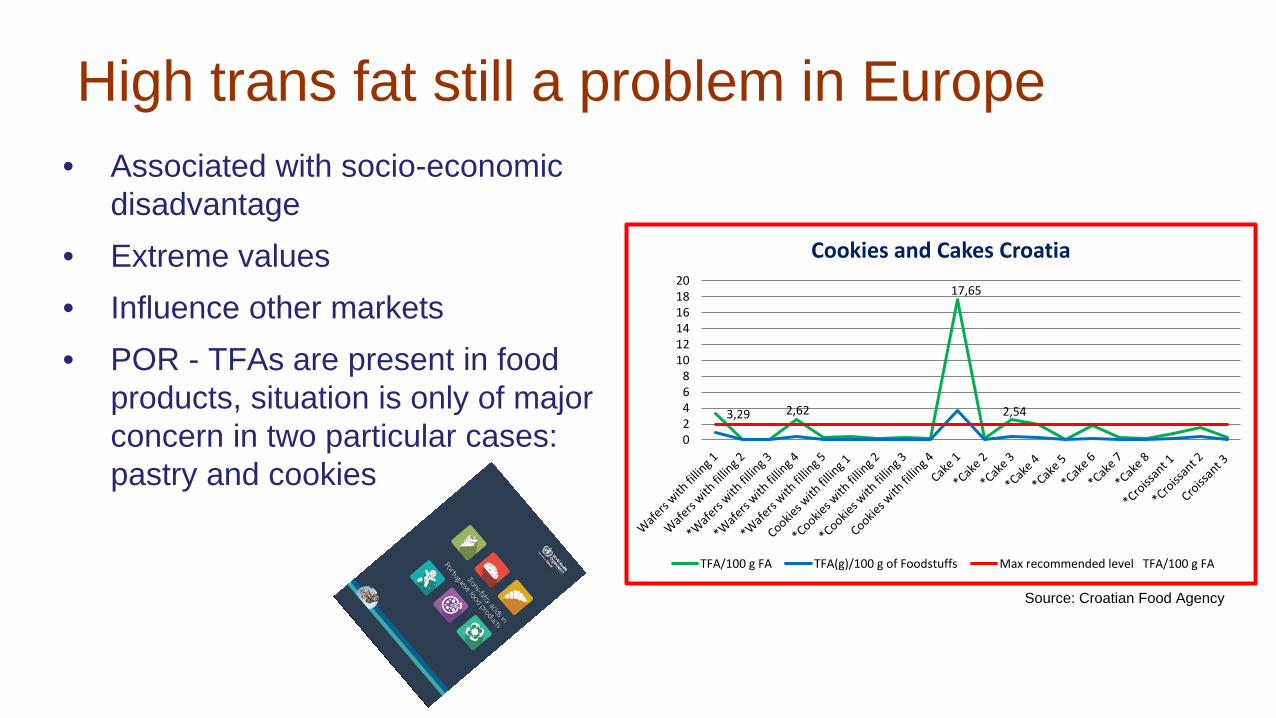
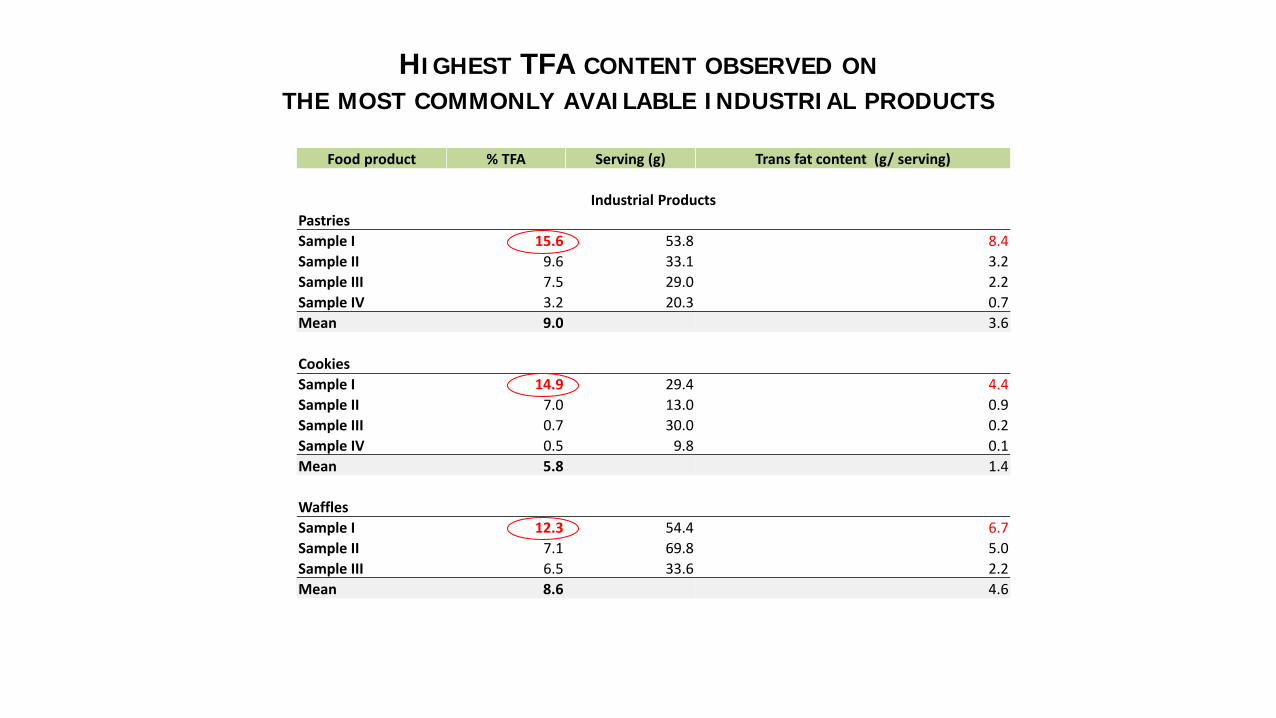
High trans fat still a problem in Europe • Associated with socio-economic
disadvantage • Extreme values • Influence other markets • POR - TFAs are present in food
products, situation is only of major concern in two particular cases: pastry and cookies
3,29
17,65
2,62 2,54
02468
101214161820
Cookies and Cakes Croatia
TFA/100 g FA TFA(g)/100 g of Foodstuffs Max recommended level TFA/100 g FA
Industrial Products Pastries Sample I 15.6 53.8 8.4 Sample II 9.6 33.1 3.2 Sample III 7.5 29.0 2.2 Sample IV 3.2 20.3 0.7 Mean 9.0 3.6 Cookies Sample I 14.9 29.4 4.4 Sample II 7.0 13.0 0.9 Sample III 0.7 30.0 0.2 Sample IV 0.5 9.8 0.1 Mean 5.8 1.4 Waffles Sample I 12.3 54.4 6.7 Sample II 7.1 69.8 5.0 Sample III 6.5 33.6 2.2 Mean 8.6 4.6
HIGHEST TFA CONTENT OBSERVED ON THE MOST COMMONLY AVAILABLE INDUSTRIAL PRODUCTS
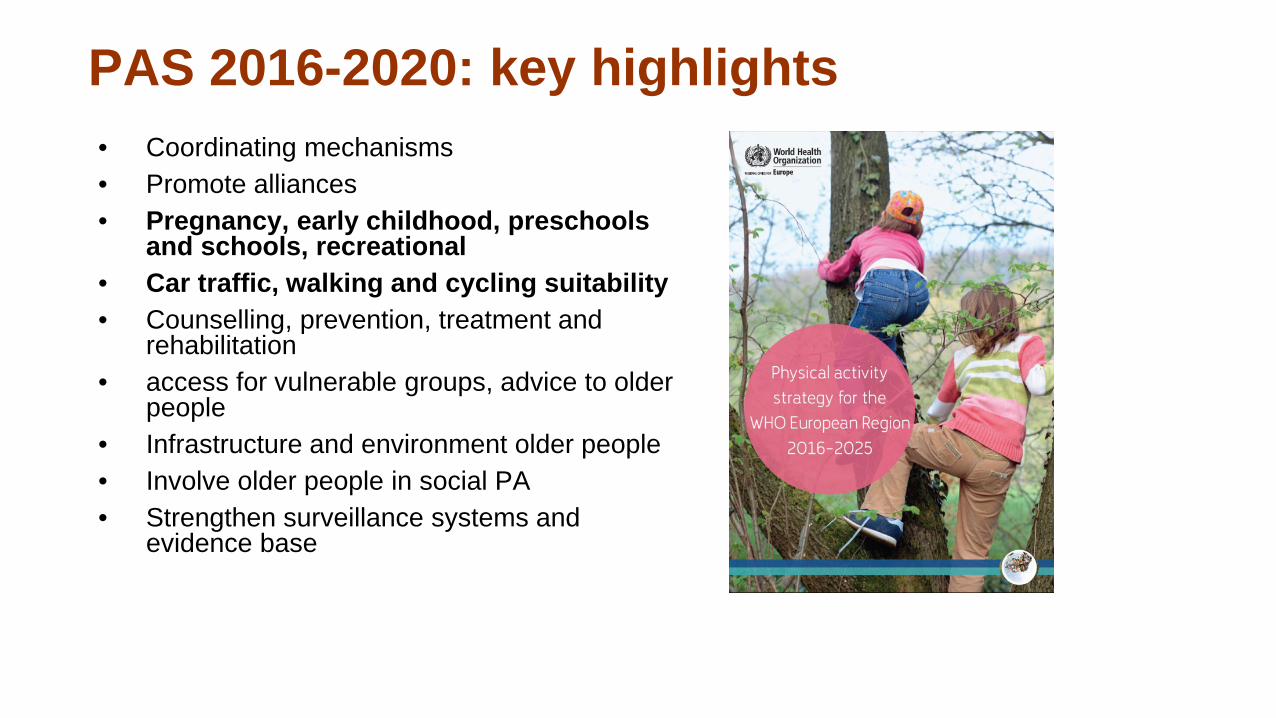
PAS 2016-2020: key highlights • Coordinating mechanisms • Promote alliances • Pregnancy, early childhood, preschools
and schools, recreational • Car traffic, walking and cycling suitability • Counselling, prevention, treatment and
rehabilitation • access for vulnerable groups, advice to older
people • Infrastructure and environment older people • Involve older people in social PA • Strengthen surveillance systems and
evidence base
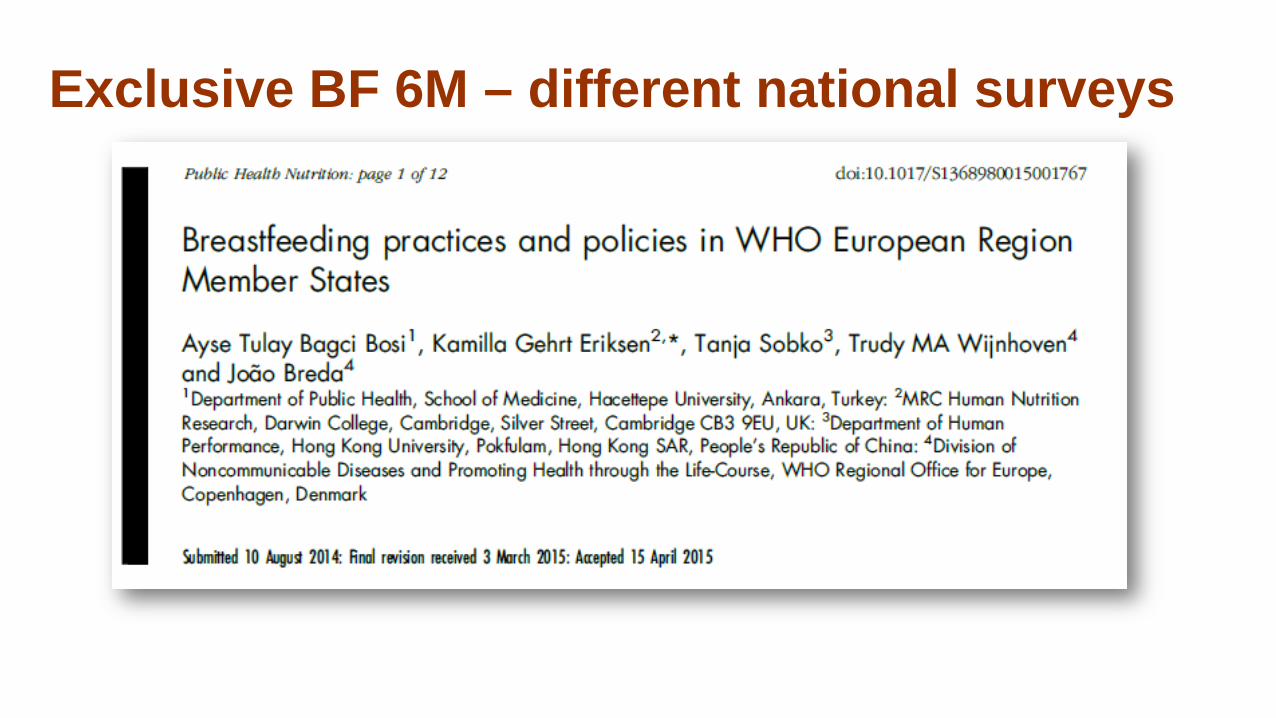
Exclusive BF 6M – different national surveys
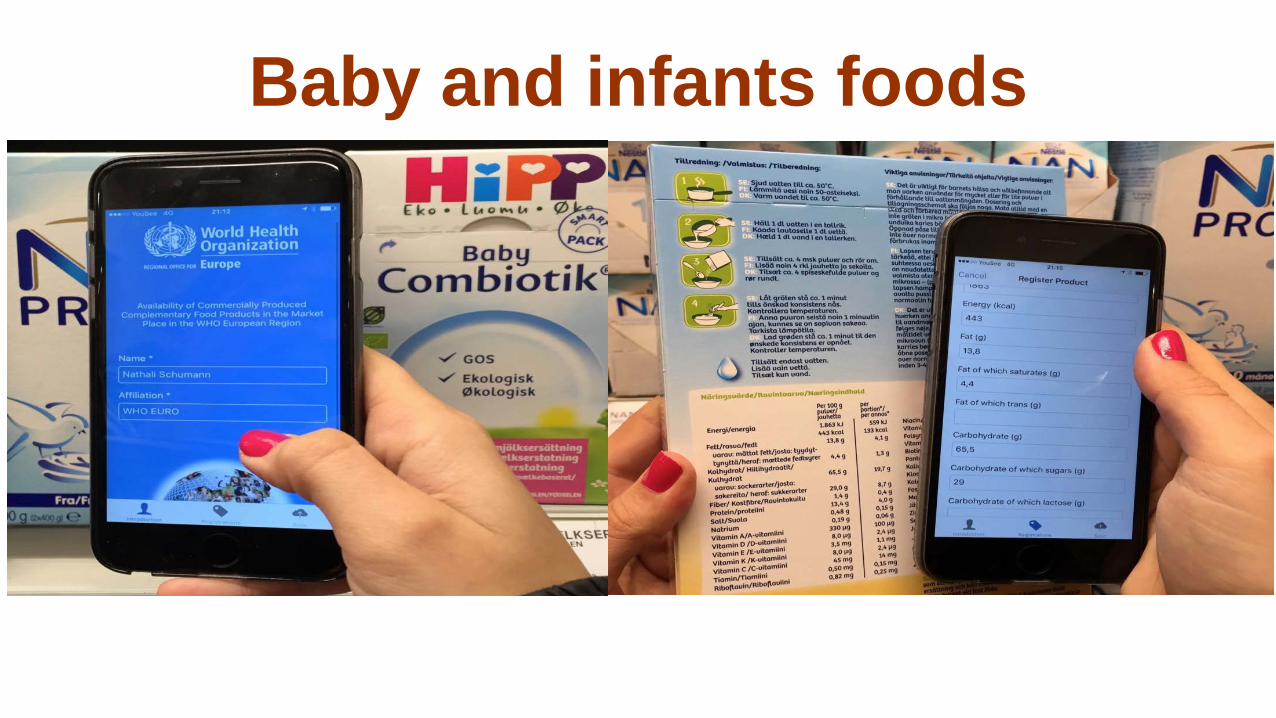
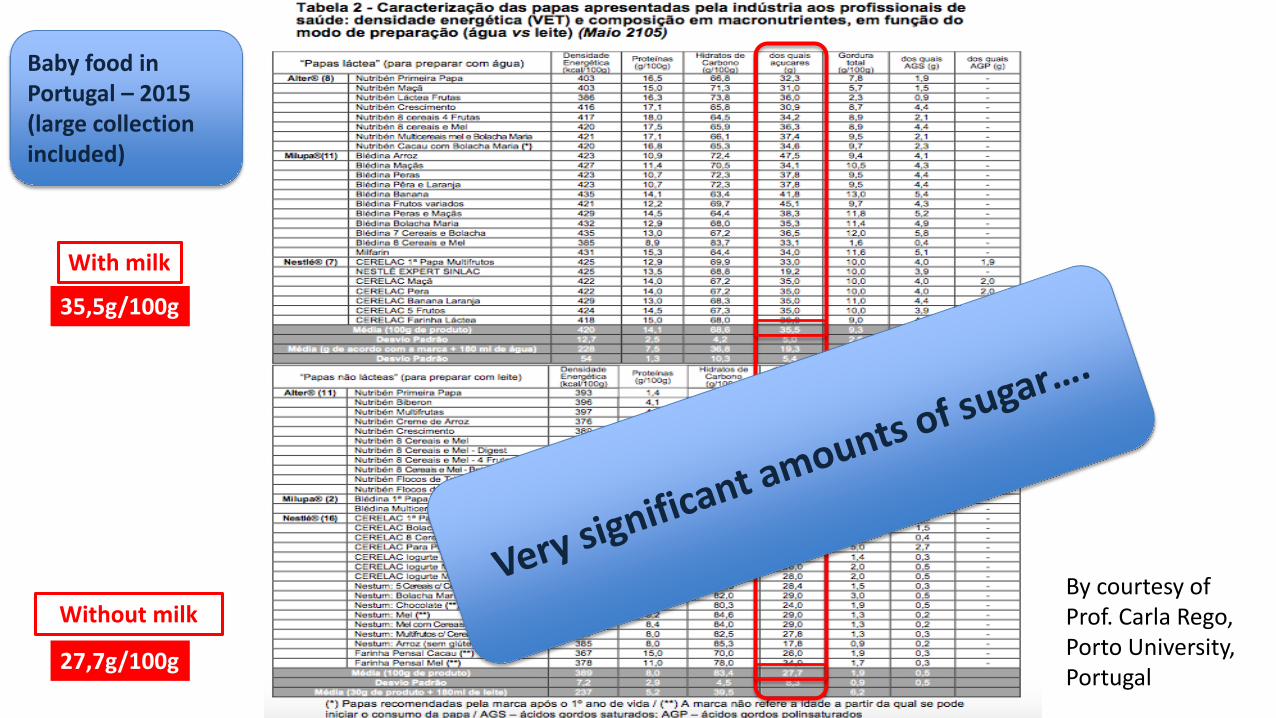
Baby and infants foods
With milk
Without milk
35,5g/100g
27,7g/100g
By courtesy of Prof. Carla Rego, Porto University, Portugal
Baby food in Portugal – 2015 (large collection included)
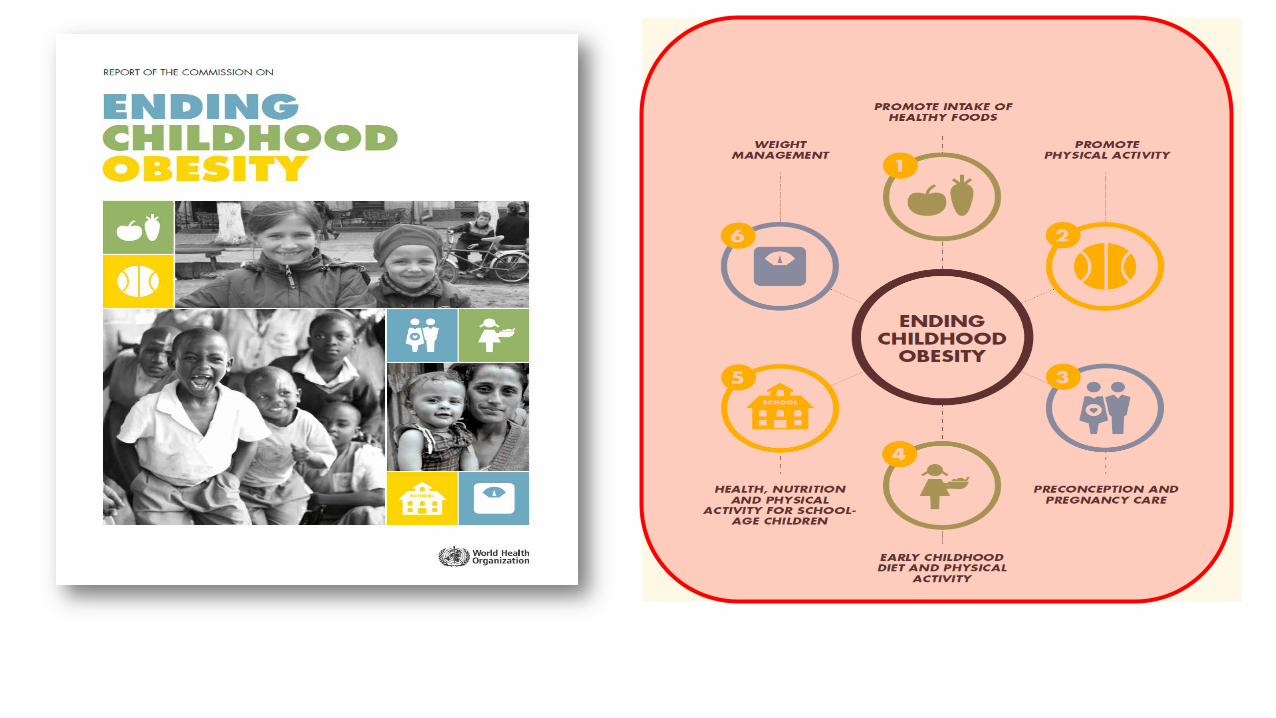
Next steps towards ending childhood obesity
• Implementation • Scaling-up • Accountability • Monitoring and surveillance