ORION SPACE CRAFT WATER AND LAND LANDING SYSTEM SIMULATION; AN INJURY CASE STUDY Ala (Al) Tabiei The University of Cincinnati, Cincinnati OH 45221 [email protected]Chuck Lawrence NASA Glenn Research Center, Cleveland, OH [email protected]Abstract NASA’s return to moon program had kept the NESC (NASA Engineering and Safety Center) busy for the past several years. The NESC was charged to come up with a safe landing for the Orion capsule. Water and land landing is considered for the Orion capsule. The NESC took major initiative to come up with recommendation to the program. Part of this initiative is to come up with Injury criteria recommendation during the landing of the Orion capsule. Impact simulation is used to assess the injury and pulse responses of the Orion during landing. Major tasks were under taken to validate the steps of the impact simulations. The models used in water landing, soil landing, and the finite element dummies were validated through experimental testing. In here some of the validation is presented. The paper finally compares the injury values of the astronauts during water and land landing. Introduction 1
Transcript
ORION SPACE CRAFT WATER AND LAND LANDING SYSTEM SIMULATION; ANINJURY CASE STUDY
NASA’s return to moon program had kept the NESC (NASA Engineering andSafety Center) busy for the past several years. The NESC was charged to come up witha safe landing for the Orion capsule. Water and land landing is considered for the Orioncapsule. The NESC took major initiative to come up with recommendation to theprogram. Part of this initiative is to come up with Injury criteria recommendation duringthe landing of the Orion capsule. Impact simulation is used to assess the injury andpulse responses of the Orion during landing. Major tasks were under taken to validatethe steps of the impact simulations. The models used in water landing, soil landing, andthe finite element dummies were validated through experimental testing. In here someof the validation is presented. The paper finally compares the injury values of theastronauts during water and land landing.
Introduction
1
During the landing of the Orion crew vehicle on hard surfaces, significant impulseloads could be transmitted to the astronauts through the vehicle-occupant interfacessuch as the floor and seat. If these loads are not attenuated to survivable levels, theycould lead severe injuries or fatality of the occupants. Simple seat structures are notsufficient to protect the occupant against hard landing, and thus further protectivetechniques need to be investigated.
The original recommendation was for water landings with parachutes and retro rockets.Once landing systems were validated, transitions to land landing. Residual landingvelocities and requirement for vehicle re-usability led to need for crushable material onbottom of vehicle. Retro rockets and crushable material is less efficient design thandeployable airbags for land landings. Vehicle weight exceeded launch vehicle capacityso all landing systems removed and water landing set as baseline. However the vehicledesign must meet crew safety requirements for contingency land landing (Figure 1).
The parachutes lower landing velocity to under 30 fps and provide primary mode ofcrew protection. Water, and to a certain extent land, provide landing load attenuation.Crushable structure between heat shield and vehicle were added to provide further crewprotection and vehicle reusability. Crew seat pallet struts were also added to providestroking for extreme off-nominal load cases. Crew seats, helmets, suits, and harnessesprovide additional layer of final crew protection.
Figure (1) water and land landing
In here the water and land landing is evaluated through the explicit dynamic finiteelement system simulation using LSDYNA. The Orion finite element model isconsidered with six astronauts placed in their seats for the impact simulations. TheLSDYNA dummy models are used in the simulations. In order to determine theeffectiveness of the finite element models a validation is performed using test data. A
2
set of experiments are conducted at the Wright-Patterson Air Force Base in DaytonOhio. These tests are used to validate the finite element crash test dummy models.Occupant crash data such as forces, moments and accelerations are collected fromsimulations and then compared to these injury criteria to assess Occupant Survivabilityand Human Injury.
Models Validation
Before accepting the results of any simulation validation of the finite elementmodel is necessary. In the case of a system simulation which can cost significantamount of money and effort, components validation is necessary. In the Orion systemsimulation there exist several sub-models that need validation. Of the major concern isthe water landing model, the soil landing model, and the dummy model used in thesystem simulation. The validation of the LSDYNA model of the system in whole is verycostly and next to impossible considering human astronauts. However an effort can beunder taken to validate components of the simulation and reduce the potential deviationof the system simulation from the real behavior. In the subsequent sections some of thedata used to validate the components is presented.
Water Landing Validation
The LSDYNA code can perform water impact simulation with good accuracy.However, it needs to be validated for Orion water landing system simulation. Thereexists some data from the Apollo program of one fourth scale model impacted intowater. Some acceleration data and some pressure data were taken at that time when itwas tested. A finite element model of the one fourth scale Apollo capsule is developedfor the water impact validation. Figure (2) depicts the finite element simulation with oneof the landing cases validated. Table (1) summaries the predication of the finite elementmodel and one of the tests conducted. Reasonable prediction is obtained and the waterlanding is validated.
3
Figure (2) ¼ Scale Apollo Water Impact @ 11 degrees
Several tests were conducted by NASA on the soil in the potential landing sites.The tests were conducted at several locations in the site and at different seasons.Different moisture content are considered to cover different soils ranging from muddysift soil to dry hard soil. One of the tests conducted is the half sphere drop tests shownin Figure (3). In here one of the test cases that is conducted during the month of Augustis considered for the validation. This test case is a representative of dry hard soil. Figure(4) shows the LSDYNA predication versus test. Good correlation between the material
4
model used in LSDYNA and test is obtained.
Figure (3) Soil Testing in The Potential Landing site
Figure (4) Soil Drop Test Validation
Dummy Validation
Major sets of experiments are conducted at Wright-Patterson Air Force Base(WPAFB) in Dayton, Ohio. These tests consisted of a belted Hybrid III dummy in severalconfigurations and various pulses. The tests consisted of 10-20 g’s in the +x-direction,-x-direction, y-lateral-direction, and the z-spinal-direction. The tests also considered forvarious rise-to-peak duration. Three tests are conducted for each case to show
5
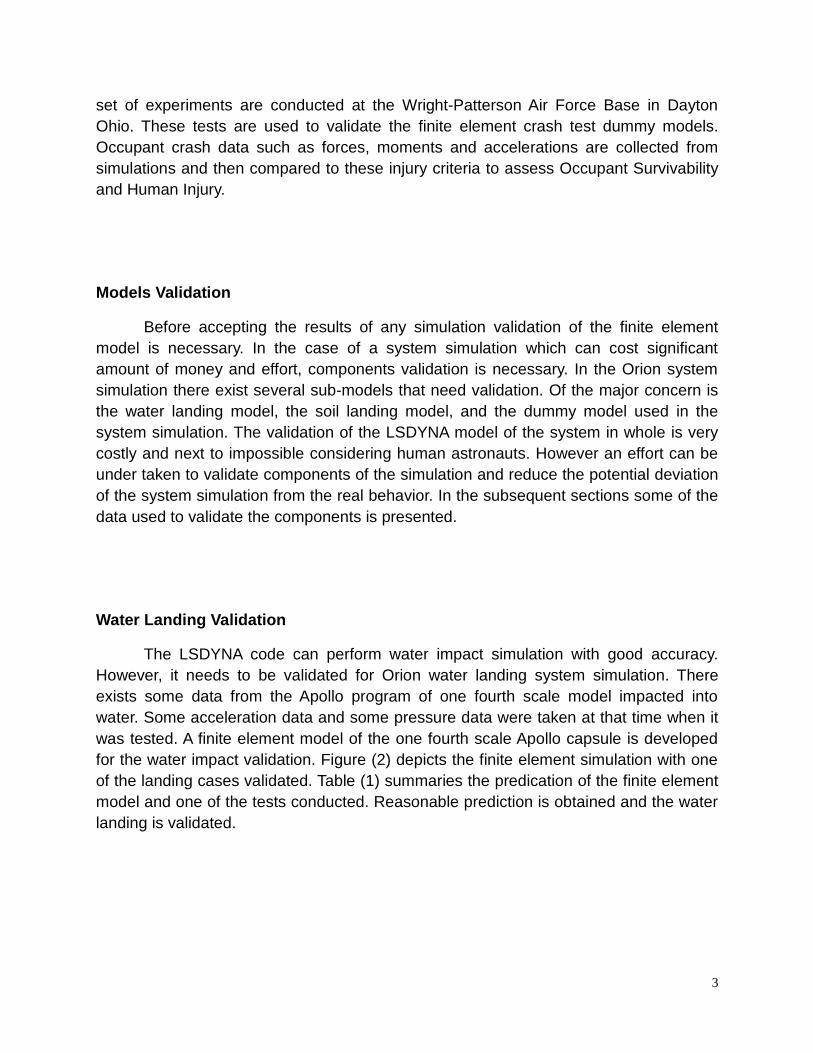
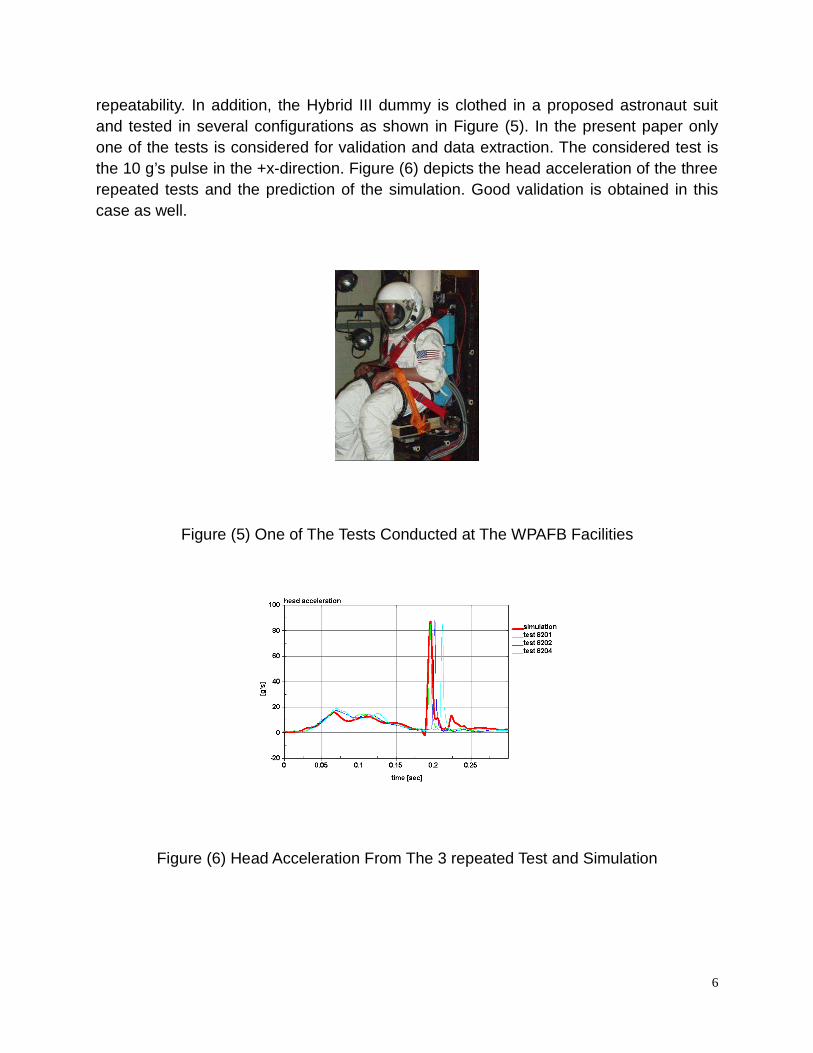
repeatability. In addition, the Hybrid III dummy is clothed in a proposed astronaut suitand tested in several configurations as shown in Figure (5). In the present paper onlyone of the tests is considered for validation and data extraction. The considered test isthe 10 g’s pulse in the +x-direction. Figure (6) depicts the head acceleration of the threerepeated tests and the prediction of the simulation. Good validation is obtained in thiscase as well.
Figure (5) One of The Tests Conducted at The WPAFB Facilities
Figure (6) Head Acceleration From The 3 repeated Test and Simulation
6
System Simulations
The finite element model of the Orion with the seats and six dummies isdeveloped and simulated. Figure (7) shows the water and soil landing model with the sixrestrained astronauts in position in their seats. The six astronauts are numbered asshown in the figure. The two models are considered for the equal lading conditions. Thelanding conditions consists of the following velocities: Vx=429.9, Vz=-552.00 [in/sec].The Orion landing orientation considered is as follows: Pitch=20.0, Yaw=-4.1, Roll=30.0degrees. The initial orientation of the water landing and land landing and the finalorientation of the Orion is shown in Figure (8) at time 160 ms. One can observe thateven though the initial orientation and landing condition is the same, the final orientationof the capsule is totally different. Figure (9) depicts the water lading situation. Injurynumbers are extracted for the two cases and compared.
Figure (7) The Orion System Finite Element Model
7
Figure (8) Orion Initial and Subsequent Orientation During Water Landing (Top) andLand Landing (bottom)
Figure (9) Water Landing System Simulation
Injury Criteria (txt taken from the NASA report, please modify as you think is fit)
The core of the occupant protection criteria is based on the Brinkley DynamicResponse Index (DRI) model. This model has been and is currently used by NASA andthe military to determine the risk of injury or adverse physiological response to vehicleoccupants based on seat acceleration. While this model is useful for generating anoverall estimate of the probability of injury, the model has limitations. The modelassumes a basic seat geometry, restraint, and head protection and is therefore only anapproximation for other seat designs and protection systems. Furthermore, the modelcannot be used to predict risk when improvements are made to the seated environment.Risk can only be lowered by reducing the driving loads into the seat.To complement the Brinkley DRI, additional injury criteria, specific to the head, neck andlegs have been incorporated into the Human System Interface Requirements (HSIR).
8
These injury criteria were developed primarily for the automotive industry and areregularly used to insure automotive safety. The injury criteria used by the automotiveindustry are designed for automobile accidents and considerably higher allowableprobability of injuries than are acceptable for NASA and manned vehicle landings sojudgment was used to extrapolate the criteria for use for manned space flight. Thecriteria provide more understanding of the location and type of occupant injury and theeffect of seating conditions and occupant protection and when used in conjunction withthe Brinkley DRI provide a more complete assessment of occupant protection. In heresome of the Injury criteria adopted by the HSRI is presented and compared for the twolanding situations.
Comparison
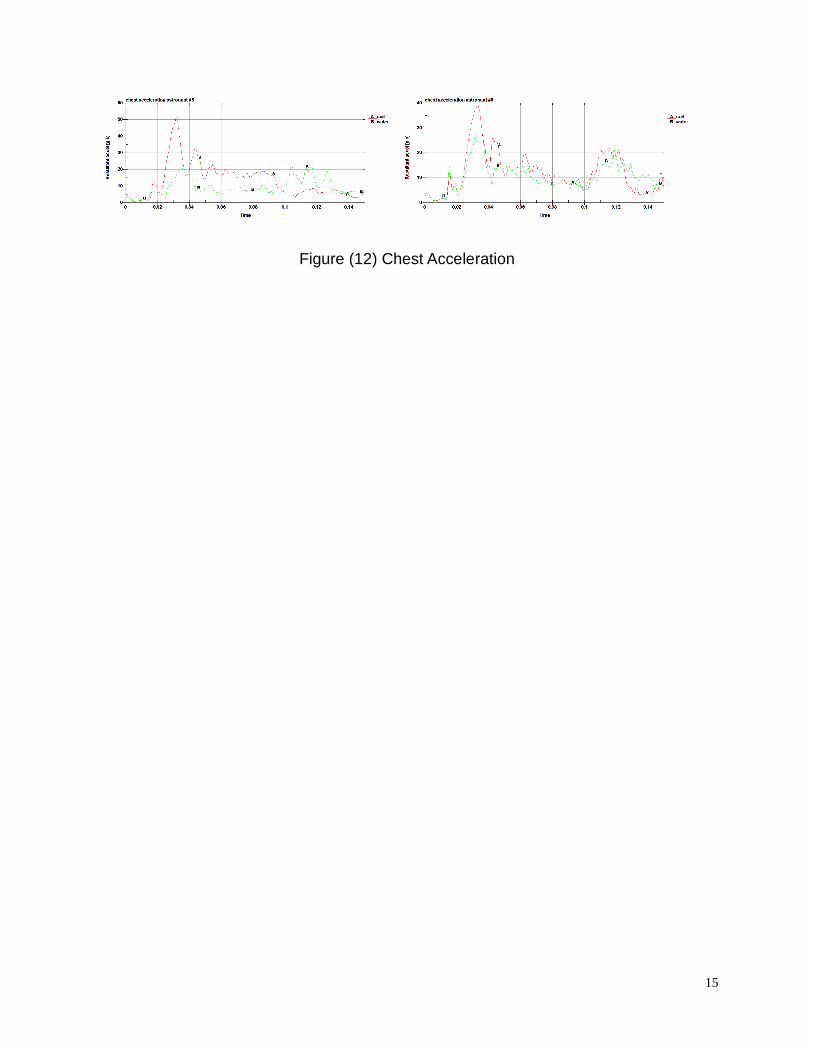
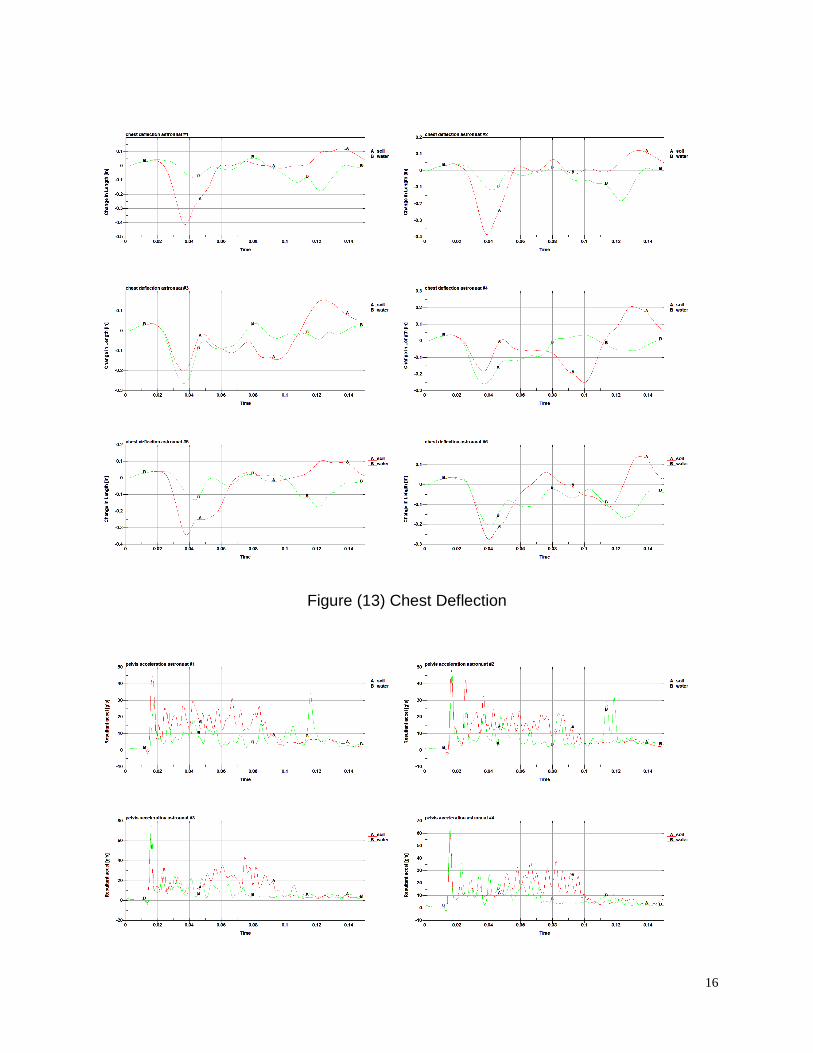
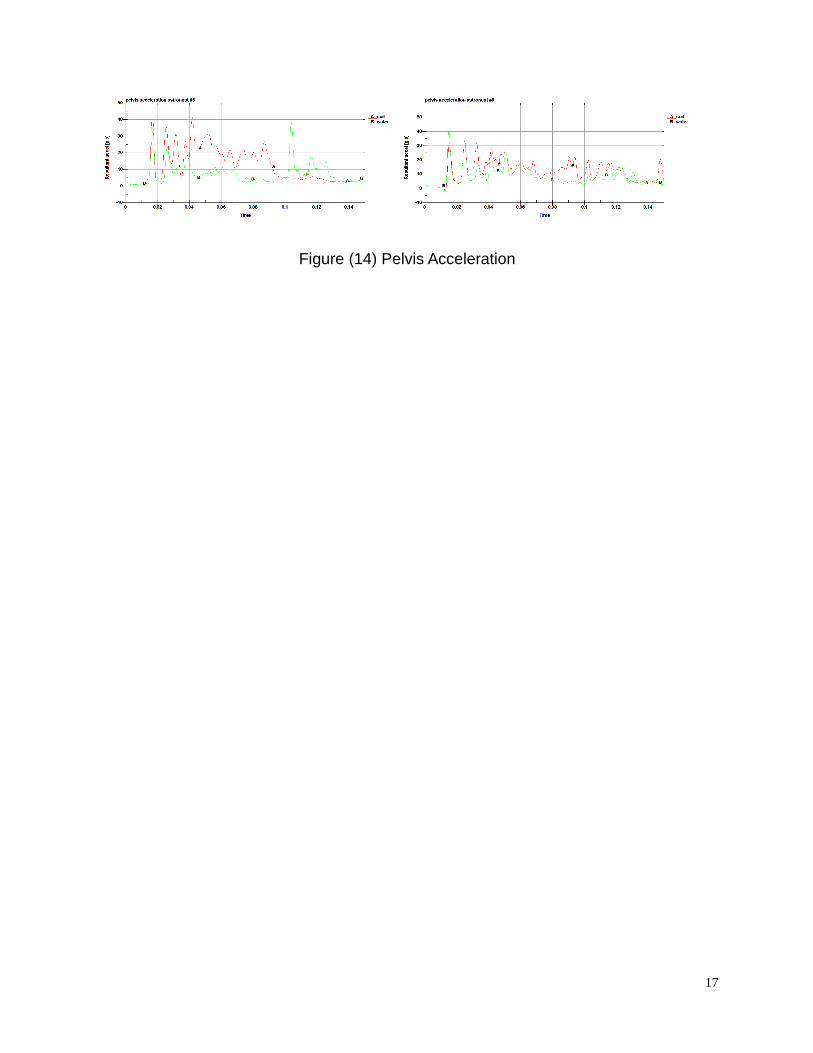
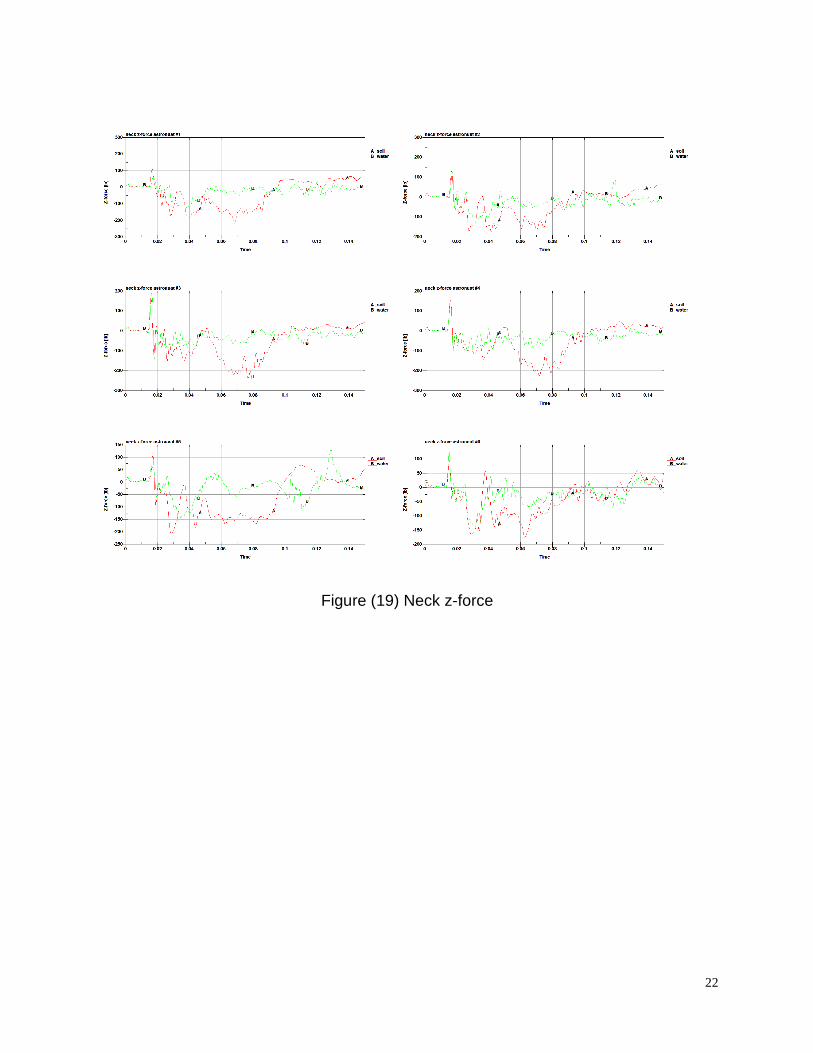
The two system simulations are carried out with LSDYNA version 971-R4. Thewater landing simulation was much more CPU intensive than the land landing becauseof the fluid structure interaction algorithm. The two simulations are post processed toobtain the injury parameters and compared to each other. Figure (10) depicts thepositions and movements of the dummies at time 160 ms for both the water landing andland landing cases. Once can observe that the land landing case yield highermovements in the dummies. The injury values and compared graphically for all sixastronauts. However, for the purpose of peak value comparison only two injuryparameters are presented. Tables (2) and (3) show the Head Injury Criterion (HIC) andthe neck x-force for the sin astronauts during land and water landing. The followinginjury parameters are extracted and compared for all six astronauts; Head acceleration,chest acceleration, chest deflection, pelvis acceleration, all neck forces, and all lumbarforces. Figures (11)-(19) depicts all these injury parameters during the water and landlanding event.
9
10
Figure (10) Comparison of The Dummies Behavior During Water (bottom) and Land(top) Landing at 160 ms.
Conclusion
The impact simulation is used to assess the injury and pulse responses of theOrion during landing. Both water and land landing is considered. Major tasks wereunder taken to validate the steps of the Orion impact system simulations. The modelsused in water landing, soil landing, and the finite element dummies were validatedthrough experimental testing. In here some of the validation is presented. The paperfinally compares the injury values of the astronauts during water and land landing. Asexpected the land landing situation leads to a much higher injury values in almost allinjury criteria. These simulations provide the level of accelerations, forces, and momentdifferences between the land and water landing.
References
11
1. Tabiei, Ala; Lawrence, Charles; Fasanella, Edwin, L., “Validation of FiniteElement Crash Test Dummy Models for Predicting Orion Crew Member InjuriesDuring a Simulated Vehicle Landing”, NASA/TM-2009-215476, 2009.
2. Lawrence, Charles; Littell, Justin D.; Fasanella, Edwin L.; Tabiei, Ala, “OrionCrew Member Injury Predictions during Land and Water Landings”, NASA/TM-2008-215171, 2008.
3. Lawrence, Charles; Fasanella, Edwin L.; Tabiei, Ala; Brinkley, James W.;Shemwell, David , “The Use of a Vehicle Acceleration Exposure Limit Model anda Finite Element Crash Test Dummy Model to Evaluate the Risk of InjuriesDuring Orion Crew Module Landings”, NASA/TM-2008-215198, 2008.
Disclaimer
The results presented herein are the views and analysis performed by theauthors. All data are solely the opinions of the authors and in no way represent theviews and policies taken by NASA.
12
Table (2) Head Injury Data Comparison For The six Astronauts Positions During Waterand Land Landing
Astronaut Water landing (HIC) Soil landing (HIC)
#1 15 294
#2 42 282
#3 47 85
#4 55 65
#5 50 223
#6 47 174
Table (3) Neck Injury Data [lb] Comparison For The six Astronauts Positions DuringWater and Land Landing
Astronaut # Neck Force Parameters Water landing Soil landing