9
REGIONAL INTELLIGENCE REPORT 1 REGIONAL INTELLIGENCE REPORT INLAND EMPIRE First Quarter 2019 School of Business CENTER FOR ECONOMIC FORECASTING & DEVELOPMENT

REGIONAL INTELLIGENCE REPORT
1
REGIONAL INTELLIGENCE REPORTINLAND EMPIRE
First Quarter 2019
School ofBusiness
C E N T E R F O R E C O N O M I C F O R E C A S T I N G & D E V E L O P M E N T
INLAND EMPIRE REGIONAL INTELLIGENCE REPORT
2
The Inland Empire began 2019 where it left off last year, outpacing the rest of Southern California in job gains.
The increases were led by Health Care, Government, and Transportation and Warehousing. Job growth result-
ed in an unemployment rate within range of its record low despite recent increases in the region’s labor force.
Wage growth over the past year fueled activity in many sectors, reflected in recent impressive increases in
taxable sales. With interest rates retreating from their highs in late 2018, there is potential for housing to per-
form better than expected in the forthcoming peak season.
INTRODUCTION
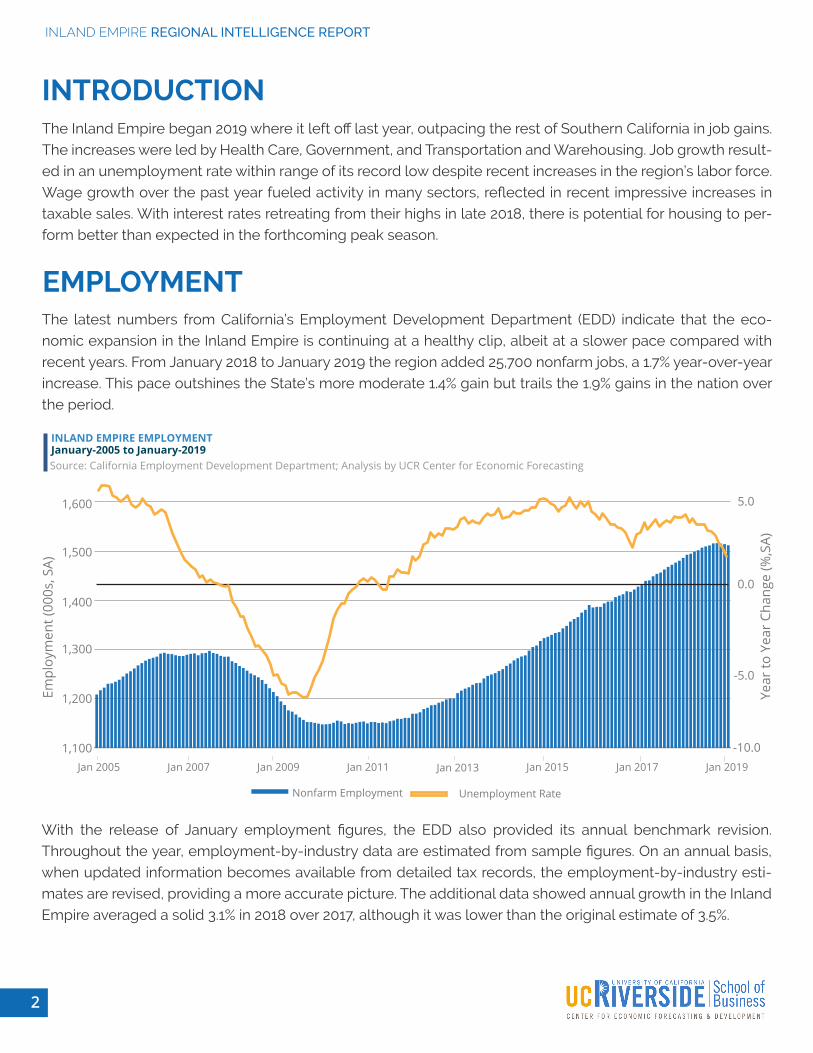
EMPLOYMENTThe latest numbers from California’s Employment Development Department (EDD) indicate that the eco-
nomic expansion in the Inland Empire is continuing at a healthy clip, albeit at a slower pace compared with
recent years. From January 2018 to January 2019 the region added 25,700 nonfarm jobs, a 1.7% year-over-year
increase. This pace outshines the State’s more moderate 1.4% gain but trails the 1.9% gains in the nation over
the period.
1,400
1,300
1,100
1,200Empl
oym
ent (
000s
, SA)
Jan 2005
INLAND EMPIRE EMPLOYMENT January-2005 to January-2019Source: California Employment Development Department; Analysis by UCR Center for Economic Forecasting
Nonfarm Employment Unemployment Rate
1,600
1,500
Jan 2007 Jan 2009 Jan 2011 Jan 2013 Jan 2015 Jan 2017 Jan 2019
5.0
Year
to Y
ear
Chan
ge (%
,SA)
0.0
-5.0
-10.0
With the release of January employment figures, the EDD also provided its annual benchmark revision.
Throughout the year, employment-by-industry data are estimated from sample figures. On an annual basis,
when updated information becomes available from detailed tax records, the employment-by-industry esti-
mates are revised, providing a more accurate picture. The additional data showed annual growth in the Inland
Empire averaged a solid 3.1% in 2018 over 2017, although it was lower than the original estimate of 3.5%.

INLAND EMPIRE REGIONAL INTELLIGENCE REPORT
3
Wages in the Inland Empire are also increasing, although at a modest rate. Overall earnings in the region
grew 2.8% from the first three quarters of 2017 to the first three quarters of 2018, with wages increasing 2.7%
in Riverside County and 2.8% in San Bernardino County. Over the same period, wages in the State overall
grew 4.3%. Continued upward pressure on wages is anticipated as labor markets tighten throughout
Southern California.
Sector
Transport/Warehouse
Prof, Sci & Tech
Admin Support
Education/Health
Government
Jan-19 Employment(000s)
246.8
42.4
128.1
260.1
99.4
105.5
101.2
170.0
181.8
64.3
11.1
5.0
8.3
43.5
44.4
1,512.0
4.9
3.5
3.0
1.8
1.3
1.1
0.9
0.8
0.7
0.4
0.0
0.0
-0.1
-1.4
-3.2
1.7
11.5
1.4
3.8
4.7
1.3
1.2
0.9
1.4
1.3
0.3
0.0
0.0
0.0
-0.6
-1.5
25.7
INLAND EMPIRE EMPLOYMENT BY INDUSTRYSource: California Employment Development Department; Analysis by UCR Center for Economic Forecasting
1-YearChange (%)
1-YearChange (000s)
Leisure and Hospitality
Manufacturing
Wholesale Trade
NR/Construction
Retail Trade
Information
Financial Activities
Management
Total Nonfarm
Utilities
Other Services
The Inland Empire’s affordability advantage has helped the region sustain gains in its labor force. From January
2018 to January 2019, the Inland Empire’s labor force expanded 2.3%, growing by roughly 46,000, outpacing
both Los Angeles (0.7%) and Orange (1.7%) counties. In contrast, the labor force in California expanded 1.5% over
the period. Labor force gains have eclipsed gains in household employment, which pushed the unemploy-
ment rate up to 4.5%, which is in line with the rate a year earlier but above the historic lows of recent months.
At the industry level, job growth has been broad-based, with most Inland Empire sectors expanding payrolls
over the last year. Health Care and Education has provided the largest number of new jobs; payrolls grew by
11,500 (4.9%) positions from January 2018 to January 2019. The Government sector was second, adding 4,700
(1.8%) jobs over the year. Most of the new Government positions came from Local Government (3,000), with
Local Government Education (1,900) driving much of the growth. The Transportation and Warehousing sector
also continued to provide a significant number of new jobs, with payrolls growing by 3,800 (3.0%) positions.
This was followed by Professional, Scientific and Technical Services, which added 1,400 (3.5%) positions, and
Administrative Support, which added 1,300 (1.3%) positions.
INLAND EMPIRE REGIONAL INTELLIGENCE REPORT
4
BUSINESS ACTIVITY
A few sectors in the Inland Empire lost positions over the last year. Losses were most prominent in the Other
Services sector, which shed 1,500 (-3.2%) jobs over the last year. Jobs in this sector include equipment and
machinery repairing, dry cleaning and laundry services, and personal care services. Financial Activities was
the only other major sector to lose positions over the last year, with payrolls declining by 600 (-1.4%).
An uptick in construction spending and sustained gains in job counts have spurred local spending. Taxable
sales in the Inland Empire increased 7.3% in 2018 over 2017. Riverside County’s overall taxable sales increased
8.7% during this period, and within the County, the cities of Corona (4.8%) and Riverside (3.0%) had considerable
gains, while taxable sales grew modestly in Moreno Valley (1.0%). In San Bernardino County, taxable sales in-
creased 6.1%, and within the County, Fontana (5.0%), Rancho Cucamonga (3.4%) and San Bernardino (5.8%) led
the way. With solid growth in taxable sales, consumer and business spending in Riverside County (8.7%) and
San Bernardino County (6.1%) outpaced the State overall (5.2%) compared with 2017 levels.
Every spending category in the Inland Empire grew in 2018. Fuel and Services Stations led the way, with a
6.6% increase from the fourth quarter of 2017 to the fourth quarter of 2018. Rising fuel prices were primarily
responsible for the gain, a trend that will probably be tempered by the recent sharp decrease in prices. Con-
sumer spending at Food and Drug stores increased 3.8%, followed by Restaurants and Hotels, where spending
increased 3.0% over the period.
It was a good year for Hospitality and Tourism. Following the gains in Leisure and Hospitality employment
and Restaurant and Hotel spending, occupancy rates at local hotels averaged 78.7% in 2018, holding steady
relative to 2017. The average daily rate for local hotels grew to $124.50 in 2018, a 3.4% increase over 2017 lev-
els. All told, revenue per available unit grew 3.5%. Passenger traffic at Ontario International Airport continued
to expand. 2017’s passenger growth was the best since 2010, and 2018 was even better. A total of 5.12 million
passengers passed through the airport in 2018, a 12.4% increase over 2017 and the highest since 2008.
The uptick in construction activity throughout the Inland Empire and other parts of Southern California boost-
ed sales tax receipts 6.6% in the Building and Construction category from the fourth quarter of 2017 to the
fourth quarter of 2018. The increase indicates that developers are using local suppliers for projects and, more
important, are building desperately needed housing stock, which will be critical for continued economic vital-
ity in the region.
Business-to-business spending also grew over the last year in the Inland Empire, with Business and Industry
sales tax receipts increasing 3.5% from the fourth quarter of 2017 to the fourth quarter of 2018.

INLAND EMPIRE REGIONAL INTELLIGENCE REPORT
5
Category
Food and Drugs
Building and Construction
Resturants and Hotels
Fuel and Service Stations
Business and Industry
Q4-18($ Thousands)
$19,949
$20,055
$9,158
$33,494
$21,236
$32,815
$38,968
$200,975
6.6
6.6
3.8
3.5
3.0
1.4
1.2
4.7
21.0
21.3
11.2
11.9
18.2
10.3
2.7
14.6
INLAND EMPIRE SALES TAX RECEIPTS BY CATEGORYSource: HdL Companies; Analysis by UCR Center for Economic Forecasting
1-YearChange (%)
3-YearChange (&)
TotalGeneral Consumer Goods
Autos and Transportation
Total trade through the Ports of Long Beach and Los Angeles reached $408 billion in 2018, a 5.8% increase
over 2017 levels, despite concerns about the Trump administration’s current and proposed trade policies. Port
activity increased in 2018 partly because the worst-case scenarios did not materialize. Rather than unilaterally
pull out of NAFTA as threatened, the United States negotiated a new trade agreement with our two
neighbors and largest trading partners that looks almost exactly like the old trade agreement. A brewing
trade fight with the European Union that began with steel tariffs has also settled down, and there are now
discussions about renewing talks and working toward a new trade agreement. Although the China trade
dispute is still brewing, even a major trade war with China would not be enough to end the current
economic expansion.
INLAND EMPIRE REGIONAL INTELLIGENCE REPORT
6
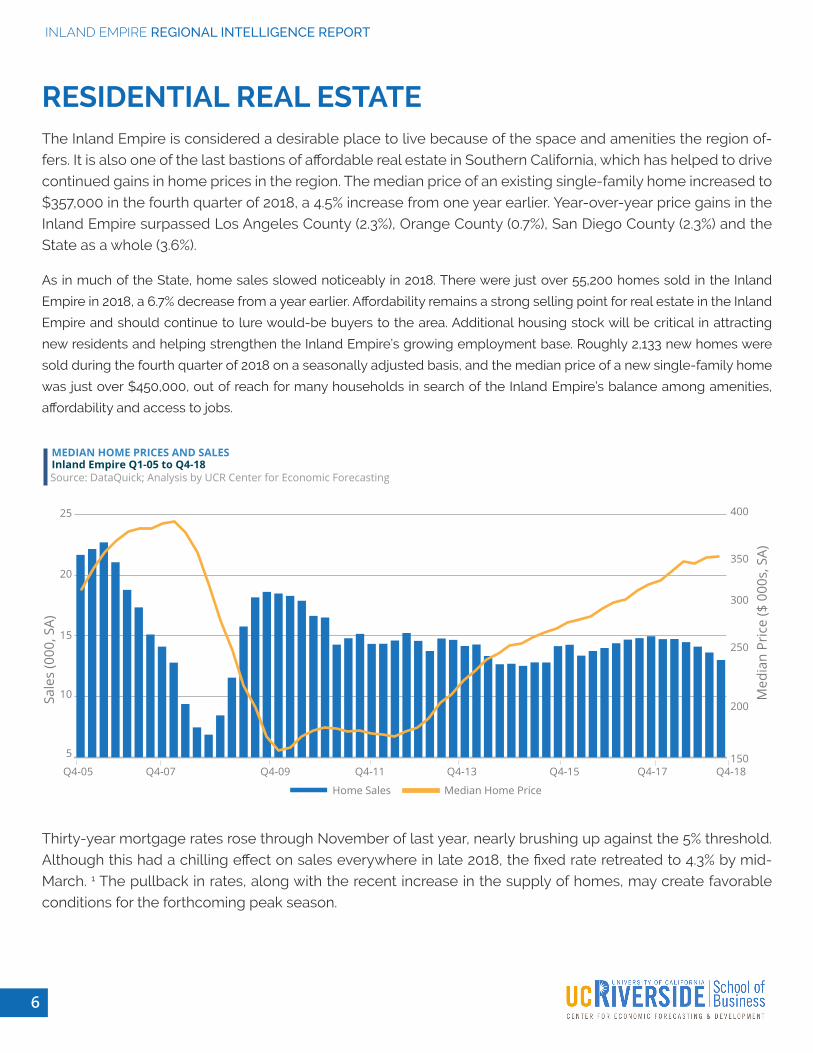
RESIDENTIAL REAL ESTATEThe Inland Empire is considered a desirable place to live because of the space and amenities the region of-
fers. It is also one of the last bastions of affordable real estate in Southern California, which has helped to drive
continued gains in home prices in the region. The median price of an existing single-family home increased to
$357,000 in the fourth quarter of 2018, a 4.5% increase from one year earlier. Year-over-year price gains in the
Inland Empire surpassed Los Angeles County (2.3%), Orange County (0.7%), San Diego County (2.3%) and the
State as a whole (3.6%).
As in much of the State, home sales slowed noticeably in 2018. There were just over 55,200 homes sold in the Inland
Empire in 2018, a 6.7% decrease from a year earlier. Affordability remains a strong selling point for real estate in the Inland
Empire and should continue to lure would-be buyers to the area. Additional housing stock will be critical in attracting
new residents and helping strengthen the Inland Empire’s growing employment base. Roughly 2,133 new homes were
sold during the fourth quarter of 2018 on a seasonally adjusted basis, and the median price of a new single-family home
was just over $450,000, out of reach for many households in search of the Inland Empire’s balance among amenities,
affordability and access to jobs.
15
10
5
Sale
s (0
00, S
A)
Q4-05
MEDIAN HOME PRICES AND SALESInland Empire Q1-05 to Q4-18Source: DataQuick; Analysis by UCR Center for Economic Forecasting
25
20
Q4-07 Q4-09 Q4-11 Q4-13 Q4-15 Q4-17 Q4-18
400
Med
ian
Pric
e ($
000
s, S
A)350
300
250
200
150
Home Sales Median Home Price
Thirty-year mortgage rates rose through November of last year, nearly brushing up against the 5% threshold.
Although this had a chilling effect on sales everywhere in late 2018, the fixed rate retreated to 4.3% by mid-
March. 1 The pullback in rates, along with the recent increase in the supply of homes, may create favorable
conditions for the forthcoming peak season.

INLAND EMPIRE REGIONAL INTELLIGENCE REPORT
7
COMMERCIAL REAL ESTATEAs the Inland Empire’s economic expansion continues, the local commercial real estate market is on the rise.
New stock continues to come online, vacancy rates are falling, and rents remain affordable relative to Los
Angeles and Orange counties. These attributes make the region a prime location for businesses to start up,
expand or relocate.
The Inland Empire’s expanding Logistics sector is driving demand for warehouse and distribution space. New
stock, rather than declining demand, caused the vacancy rate to edge up 2.2 percentage points to 8.5% over
the prior year in the fourth quarter of 2018. And the 4.1% gain in asking rents from the fourth quarter of 2017 to
the fourth quarter of 2018 reaffirms that demand for warehouse and logistic space remains strong. This pace of
growth is the swiftest in Southern California, with Los Angeles (3.6%), Orange (2.2%) and San Diego (3.0%) coun-
ties all growing at a more modest pace. Occupied warehouse stock in the region grew 3.2% from the fourth
quarter of 2017 to the fourth quarter of 2018, as tenants clamored for warehouse and distribution center space.
Research and development industrial space is also in high demand in the Inland Empire. Vacancy rates fell
to 5.1% in the fourth quarter of 2018, a 0.2-percentage-point decline from a year earlier. Asking rents are also
rising steadily, increasing 2.9% from the fourth quarter of 2017 to the fourth quarter of 2018, to an annual rate of
$8.61 per square foot. Although asking rent has grown more rapidly in the Inland Empire relative to Los Ange-
les (2.2%) and Orange (2.0%) counties, they remain significantly more affordable, with Inland Empire companies
enjoying a roughly 33% savings relative to Los Angeles and a roughly 28% savings over Orange County.
Because homeownership remains out of reach for many Inland Empire residents, significant pressure in the
rental market has continued. Although new units pushed up apartment vacancy rates from recent lows, the
rate stood at 3.1% in the fourth quarter of 2018, lower than Los Angeles County (3.8%), Orange County (4.0%)
and San Diego County (4.0%). At the same time, the average asking rent increased to $1,365 per month, up
4.4% from the fourth quarter of 2017. Renters enjoy significant cost savings compared with the coastal mar-
kets, with average asking rents in Los Angeles County ($2,004), Orange County ($1,948) and San Diego County
($1,822) significantly higher.
Residential construction activity remains steady in the Inland Empire. There were 13,572 residential units per-
mitted in 2018, a 0.2% decrease over 2017. Residential construction is being driven by single-family units, which
increased 4.1% to 10,730 units in 2018. Multifamily slowed relative to last year, with 2,842 permits issued in 2018,
a 13.5% decline. Given that population growth in the Inland Empire (1.2%) outpaced that of the State (0.8%), Los
Angeles County (0.5%) and Orange County (0.7%) from 2017 to 2018, construction activity must also maintain a
steady pace to preserve the region’s affordability and enable growth.

INLAND EMPIRE REGIONAL INTELLIGENCE REPORT
8
Rising employment is driving demand for office space in the Inland Empire. Vacancy rates declined to 16.8%
in the fourth quarter of 2018, down 0.2 percentage point from the fourth quarter of 2017. At the same time, the
average asking rent for office space increased to an annual rate of $22.93 per square foot, up 1.9% from one
year earlier. Businesses can gain significant cost savings in the Inland Empire relative to the pricier coastal
communities. Moreover, asking rents grew more rapidly in these coastal markets over the past year, with
asking rents increasing 3.2% in Los Angeles County and 4.0% in Orange County.
Higher wages and continued gains in consumer spending are leading to higher demand for retail space in
the Inland Empire. Retail vacancy rates remained at their lowest point since before the recession, declining
to 9.2% in the fourth quarter of 2018, 0.4% decline from a year earlier. This decrease occurred as 379,000
square feet of new retail space came online over the last year. Strong demand drove the average asking rent
for retail space to an annual rate of $22.99 per square foot in the fourth quarter of 2018, a 1.5% increase over
the fourth quarter of 2017.
500
400
200
300
Perm
it Va
lues
($ M
illio
ns, S
A)
Q1-08
TOTAL NON-RESIDENTIAL PERMITSInland Empire, Q1-08 to Q4-18Source: CIRB (Construction Industry Research Board); Analysis by UCR Center for Economic Forecasting
700
600
Q1-10 Q1-12 Q1-14 Q1-16 Q1-18
100
Year
-Ove
r-Ye
ar C
hang
e (%
,SA)
50
0
-500
100
Steady demand is also responsible for higher permitting activity for nonresidential buildings. Permitting for
new nonresidential structures in 2018 was 6.3% higher than in 2017 and 52.3% higher than in 2016, reaching
nearly $2.6 billion in total value. A significant portion of the permitting was for industrial space, with valuations
totaling over $945 million in 2018, substantially higher than the same period in 2017 and 2016. Permitting
activity for office space in the Inland Empire also increased over the last year, with $123.7 million in permits
issued in 2018, roughly 49.6% higher than 2017. Although it is down from a year earlier, permitting activity for
retail space remained solid, totaling $431 million in 2018.
Non-Res Permits Growth Rate

INLAND EMPIRE REGIONAL INTELLIGENCE REPORT
9
951-827-2792
UCREconomicForecast.org
Question or Comments?Please email [email protected]
900 University Ave.Anderson Hall 0162Riverside, CA 92521


