56
A CLEAN ENERGY ACTION PLAN INNOVATE, MANUFACTURE, COMPETE: INNOVATE, MANUFACTURE, COMPETE INNOVATE, MANUFACTURE, COMPETE INNOVATE, MANUFACTURE, COMPETE
A CLEAN ENERGY ACTION PLAN
INNOVATE,MANUFACTURE,
COMPETE:INNOVATE,
MANUFACTURE,COMPETE
INNOVATE,MANUFACTURE,
COMPETE
INNOVATE,MANUFACTURE,
COMPETE

THE PEW CHARITABLE TRUSTS
The Pew Charitable Trusts applies the power of knowledge to solve today’s most challenging problems. Pew employs a rigorous, analytical approach to improve public policy, inform the public, and stimulate civic life. We partner with a diverse range of donors, public and private organizations, and concerned citizens who share our commitment to fact-based solutions and goal-driven investments to improve society. For additional information on The Pew Charitable Trusts, please visit www.PewTrusts.org.
THE PEW ENVIRONMENT GROUP
The Pew Environment Group promotes practical, meaningful solutions to some of the world’s most pressing environmental problems.
Joshua Reichert, Executive Vice PresidentTom Wathen, Deputy Director, Programs,
Pew Environment Group Phyllis Cuttino, Clean Energy Program Director Jessica Frohman Lubetsky, ManagerTom Swanson, Manager Joseph Dooley, Senior AssociateSarah Greene, AssociateAdam Meyer, AssociateTrisch Curtis, Administrative Associate
For additional information on the Pew Environment Group, please visit www.PewEnvironment.org. For additional information about the Pew Clean Energy Program, please visit www.PewTrusts.org/CleanEnergy
ABOUT THE REPORT
Innovate, Manufacture, Compete: A Clean Energy Action Plan was developed for public
informational and educational purposes. References to specific products and projects have been included solely to advance these purposes and do not constitute an endorsement, sponsorship, or recommendation by The Pew Charitable Trusts.
Original data presented in this report were compiled by Pike Research, a component of Navigant Consulting’s global energy practice. Pike Research is a leading market research firm that provides in-depth analysis of global clean energy technology markets. A full description of the methodology and parameters employed by Pike Research in the development of data for this report can be found in Appendix I.
ACKNOWLEDGMENTS
We are grateful to the research team at Pike Research, including Kerry-Ann Adamson, Peter Asmus, Dexter Gauntlett, Bob Gohn, and Mackinnon Lawrence. We would also like to thank our Pew colleagues—Tracy Schario, Kymberly Escobar, Justin Kenney, Leah Weiser, Carol Hutchinson, and Jerry Tyson—as well Liz Boyd of Liz Boyd Public Relations. Special thanks to Alex Bratty of Public Opinion Strategies for moderating, and Emily Bryan and Bradley Jackson of Cooley Public Strategies, Tom Bullock, Rusty Paul of iSquared Communications, and Chip Reno of the Talon Group for organizational support of the roundtable discussions held in conjunction with this project. We thank Alziro Braga of InArt Design Works for graphic assistance. Finally, we thank David Harwood and Allison Wold of Good Works Group for their help in organizing the roundtables and overall preparation of this report.
Copyright © 2012 The Pew Charitable Trusts
TABLE ofCONTENTS
LIST OF FIGURES AND TABLES
EXECUTIVE SUMMARY
INTRODUCTION
CHAPTER 1 – The Clean Energy Tipping Point
CHAPTER 2 – Where the U.S. Stands in the Clean Energy Race
CHAPTER 3 – Industry Perspectives on U.S. Clean Energy Competitiveness
CHAPTER 4 – Policies to Strengthen U.S. Clean Energy Competitiveness
CONCLUSION
APPENDIX I – Overview of Methodology, Definitions, and Sources
5
6
10
12
20
26
38
50
52
INNOVATE, MANUFACTURE, COMPETE: A CLEAN ENERGY ACTION PLAN 5
Global Clean Energy Investment, 2004-2011
Cost of Solar Energy Modules, 1985-2011
Installed Wind and Solar Energy Generating Capacity, 2000-2012
Global Installed Clean Energy Generating Capacity
U.S. Clean Energy Power Generation 2001 vs. 2011
Revenue from Annual Installations by Market Segment, World, 2012-2018
Annual Installed Capacity by Market Segment, World, 2012-2018
Annual Installed Capacity by Market Segment, United States, 2012-2018
Revenue from Annual Installations by Market Segment, United States, 2012-2018
Installed Biomass Capacity Additions, 2009-2011
Revenues Associated with Biomass Installations, 2009-2011
Installed Wind Capacity Additions, 2009-2011
Revenues Associated with Wind Installations, 2009-2011
Installed Solar Capacity Additions, 2009-2011
Revenues Associated with Solar Installations, 2009-2011
Market Shares of Top 15 Solar PV Module Manufacturers, 2011
Market Share of Top 10 Wind Turbine Manufacturers, 2011
Trends in Nondefense R&D by Function, 1953-2013
Public Energy R&D Spending as a Share of GDP, 2007
Historic Impact of PTC Expiration on Annual Wind Installation
Levelized Cost of Energy Comparison
Growth of Third-Party Financing in California, 2011-2012
States with Renewable Portfolio Standards as of January, 2012
Cumulative Historical Federal Subsidies
Historical Average Energy Subsidies
U.S. Renewable Energy Exports 2007-2009
TABLES
States With Renewable Energy Standards
Countries Without Renewable Energy Targets
LIST OF FIGURES and TABLES
Figure No. Page
13
13
14
14
15
17
18
18
19
21
21
22
22
23
23
23
24
25
25
28
31
31
41
45
45
49
15
39
1
2
3
4
5
6
7
8
9
10
11
12
13
14
15
16
17
18
19
20
21
22
23
24
25
26
1
2

INNOVATE, MANUFACTURE, COMPETE: A CLEAN ENERGY ACTION PLAN 6
EXECUTIVE SUMMARY
The clean energy industry is gathering momentum around the world. Innovation and investment are helping to bring down the cost of solar, wind, and other emerging technologies. As a result, markets for clean energy goods and services are growing, and a new global competition is developing among companies and countries alike.
In the United States, however, the outlook is less positive. The country that helped to pioneer a wide variety of advanced energy technologies finds itself in a precarious competitive position heading into 2013. America is no longer the clean energy superpower, and its position in innovation, manufacturing, and deployment is being challenged by competitors in Europe and Asia. Although initiatives in recent years have helped to stimulate clean energy progress in the United States, the future of government policy is now uncertain and weighs heavily on U.S. industry and its competitive prospects.
The Pew Charitable Trusts explored clean energy market trends, international competitive conditions, and industry perspectives on strategies for enhancing the prospects of U.S. industry in the clean energy sector. Our analysis included new economic research presented in this report that projects current and future market trends
in the sector. In addition, we gathered opinions of industry leaders by convening a series of roundtable discussions in various regions of the country to discuss issues related to innovation, manufacturing, and deployment of clean energy technologies and strategies for strengthening U.S. competitiveness in the sector.
Our research shows that clean energy investment has undergone a decade-long rally, increasing by 600 percent from 2004 to 2011 and rising 6.5 percent to a record $263 billion.1 Renewable energy sources accounted for almost half of all generating capacity added to the world’s power sector.2
National governments, businesses, and consumers are turning to clean energy for a variety of reasons, including falling prices; growing demand for power, especially in emerging economies; the desire to create jobs and economic opportunities; and the need to reduce local and global air pollutants.
1 The Pew Charitable Trusts. Who’s Winning the Clean Energy Race? 2011 Edition. Page 2. http://www.pewenvironment.org/uploadedFiles/PEG/Publications/Report/FINAL_forweb_WhoIsWinningTheCleanEnergyRace-REPORT-2012.pdf
All monetary values are in United States dollars (USD) unless otherwise noted.
2 Renewable Energy Policy Network for the 21st Century (REN21). 2012. Renewables 2012 Global Status Report. Paris: REN21 Secretariat. Page 23. http://www.map.ren21.net/GSR/GSR2012.pdf
- Original data presented in this report were compiled by Pike Research, a component of Navigant Consulting’s global energy practice. Pike Research is a leading market research firm that provides in-depth analysis of global clean energy technology markets. A full description of the methodology and parameters employed by Pike Research in the development of data for this report can be found in Appendix I.
INNOVATE, MANUFACTURE, COMPETE: A CLEAN ENERGY ACTION PLAN 7
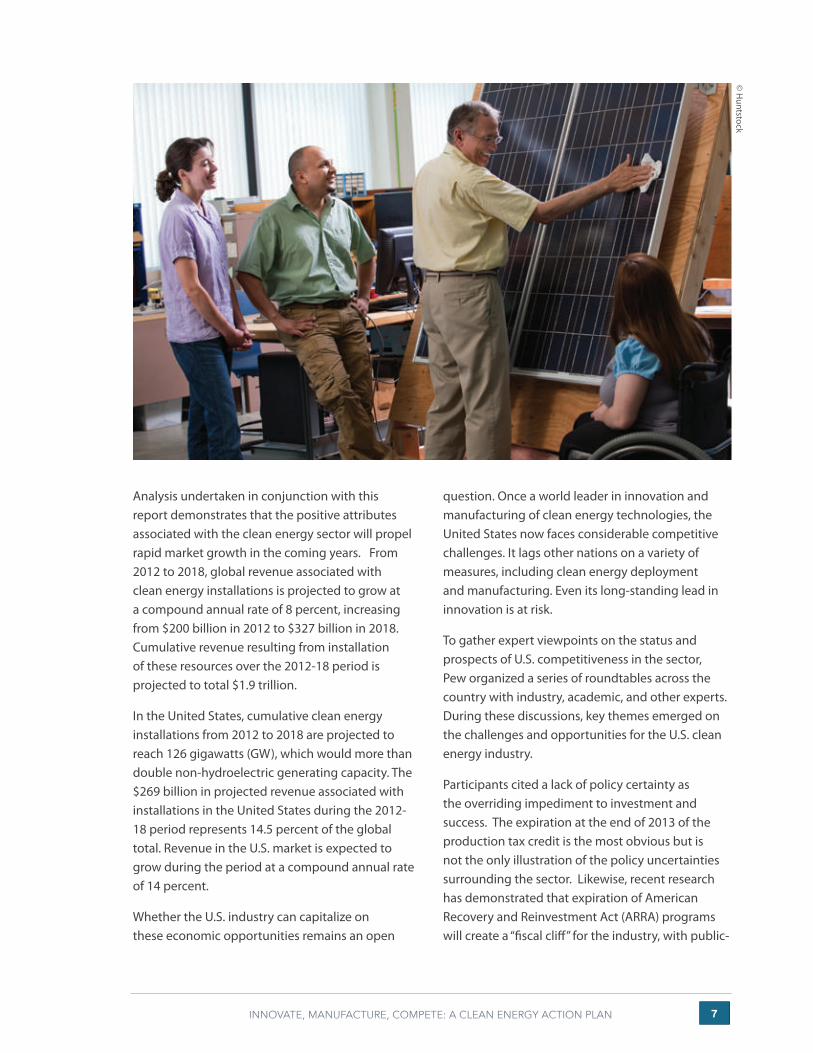
Analysis undertaken in conjunction with this report demonstrates that the positive attributes associated with the clean energy sector will propel rapid market growth in the coming years. From 2012 to 2018, global revenue associated with clean energy installations is projected to grow at a compound annual rate of 8 percent, increasing from $200 billion in 2012 to $327 billion in 2018. Cumulative revenue resulting from installation of these resources over the 2012-18 period is projected to total $1.9 trillion.
In the United States, cumulative clean energy installations from 2012 to 2018 are projected to reach 126 gigawatts (GW), which would more than double non-hydroelectric generating capacity. The $269 billion in projected revenue associated with installations in the United States during the 2012-18 period represents 14.5 percent of the global total. Revenue in the U.S. market is expected to grow during the period at a compound annual rate of 14 percent.
Whether the U.S. industry can capitalize on these economic opportunities remains an open
question. Once a world leader in innovation and manufacturing of clean energy technologies, the United States now faces considerable competitive challenges. It lags other nations on a variety of measures, including clean energy deployment and manufacturing. Even its long-standing lead in innovation is at risk.
To gather expert viewpoints on the status and prospects of U.S. competitiveness in the sector, Pew organized a series of roundtables across the country with industry, academic, and other experts. During these discussions, key themes emerged on the challenges and opportunities for the U.S. clean energy industry.
Participants cited a lack of policy certainty as the overriding impediment to investment and success. The expiration at the end of 2013 of the production tax credit is the most obvious but is not the only illustration of the policy uncertainties surrounding the sector. Likewise, recent research has demonstrated that expiration of American Recovery and Reinvestment Act (ARRA) programs will create a “fiscal cliff” for the industry, with public-
© H
untstock

INNOVATE, MANUFACTURE, COMPETE: A CLEAN ENERGY ACTION PLAN 8
sector support declining 75 percent in 2014 from 2009 levels.3
Although policy is uncertain in the United States, businesses are taking advantage of strong national goals and policies in other countries where markets are growing more rapidly. Internationally, there has been a rush of investment in clean energy manufacturing capacity in recent years, resulting in significant excess production of wind and solar equipment. China’s government and industry are at the forefront of these efforts and are having a profound impact in the marketplace, gaining market share and driving down prices globally. China’s activities in the sector have spurred trade complaints in the United States and Europe. While acknowledging difficulties, roundtable participants concluded that the U.S.-China trade relationship is complex and that the United States must be careful to avoid a trade war in the sector.
The speed and scale at which production capacity is expanding have spurred dramatic reductions in the market prices for solar and wind technologies, which is good news for consumers and certain players within the industry. However, these steep cost declines have been detrimental to technology producers. Consequently, manufacturers are making more products but at less profit. The reality of today’s marketplace is that many companies will not survive, and a period of consolidation is anticipated. Over the long term, competitive pressures should strengthen the industry for the future.
Access to credit and the capital needed to develop businesses and technologies is a major challenge to the clean energy industry. Greater policy certainty would help alleviate this obstacle. The private sector is developing innovative models for mobilizing capital, but public-sector incentives will still be needed through this decade. Beyond 2020, experts
envision an industry that is fully cost-competitive and free from the need for federal incentives.
Finally, roundtable participants noted the inequities within the energy arena. Subsidies have long been employed there, with conventional technologies benefiting from public-sector incentives and payments for almost a century. There is a widespread sentiment in the clean energy industry that the current system tilts heavily in favor of conventional fossil fuels in terms of rules, regulations, subsidies, and health and environmental costs that are not accounted for. If these costs, ultimately borne by society, were fully quantified in the price of various energy options, clean energy sources would be cost-competitive immediately.
To compete effectively for a substantial share of the growing clean energy marketplace, the United States must overcome a series of challenges and harness opportunities identified by industry leaders. If there is one overarching message from Pew’s clean energy research in recent years, it is that policy matters.
In 2013, elected leaders will have an opportunity to consider and enact long-term energy policies that help industry and consumers harness the nation’s abundant energy resources—conventional and emerging, above and below ground—in a manner that is consistent with long-term economic, security, and environmental interests.
Although numerous ideas have been offered for improving U.S. competitive success in the clean energy sector, the consensus of stakeholders participating in our nationwide series of roundtables is that a relatively narrow, straightforward, and mutually reinforcing policy agenda should be pursued. Based on expert guidance and research, this report recommends that policymakers work to:
E X E C U T I V E S U M M A R Y
3 Brookings Institution. Beyond Boom and Bust: Putting Clean Tech on a Path to Subsidy Independence. April 2012. http://www.brookings.edu/research/papers/2012/04/18-clean-investments-muro

INNOVATE, MANUFACTURE, COMPETE: A CLEAN ENERGY ACTION PLAN 9
• Establish a clean energy standard to guide deployment and investment for the long term.
• Significantly increase investment in energy research and development.
• Enact a multiyear but time-limited extension of tax credits for clean energy sources.
• Level the playing field across the energy sector by evaluating barriers to competition.
• Enhance clean energy manufacturing in the United States.
• Expand markets for U.S. goods and services.
Shutterstock © M
organ DD
L
Discussions with industry and other experts across the United States reveal deep-seated frustration about the inability of American interests to capitalize more fully on the clean energy moment. Having invented and brought to market many of the prevailing technologies, U.S. scientists and entrepreneurs now find themselves buffeted by weak national policies and strong international competitors.
The United States has a proud history of public-private partnership in advancing national competitiveness in key sectors, from railroads and automobiles to telecommunications and conventional energy sources. In view of current and projected investment trends, U.S. interests in clean energy warrant similar priority and partnership.
Industry leaders are highly confident of the ability of American industry to succeed as the clean energy marketplace expands at home and around the world, provided there is consistency and consensus in policy.

INNOVATE, MANUFACTURE, COMPETE: A CLEAN ENERGY ACTION PLAN 1 0
INTRODUCTION
The clean energy industry is gathering momentum around the world. Innovation and investment are helping to reduce the cost of solar, wind, and other emerging technologies. Countries and companies are working to harness the economic opportunity associated with these new products, and deployment of clean energy technologies is accelerating globally.
In the United States, however, the outlook is less positive. Although the global future of clean energy is bright, the U.S. position in this emerging sector is beset by uncertainty. America is no longer the clean energy superpower, and its position in innovation, manufacturing, and deployment is challenged as never before. Clean energy initiatives supported by the American Recovery and Reinvestment Act have expired, and other policies require urgent attention.
The Pew Charitable Trusts believes that advanced clean energy technologies can strengthen America’s economic and environmental future as well as its security. Pew’s research in recent years indicates that clean energy helps create employment, manufacturing, and export opportunities while reducing the pollution and risks associated with current energy patterns and technologies. To reclaim a leadership position in the worldwide competition, the public and private sectors in the United States must work together to strengthen the clean energy industry.
In order to enhance public understanding of opportunities and U.S. competitiveness in the sector, the Pew Clean Energy Program has worked throughout 2012 to compile projections of future energy investment patterns as well as expert perspectives on the current status and future prospects of the industry. In both of these fact-finding endeavors, our focus is on clean energy generating capacity, including solar, wind, geothermal, biomass, and marine power. This project has not explored data or viewpoints on energy efficiency, energy storage, transmission, transportation, or “smart-grid” technologies.
To get a picture of current and future market trends in the United States and around the world, Pike Research, a part of Navigant Consulting, was commissioned to develop projections of how much clean generating capacity has been deployed in the United States and globally over two time periods: retrospectively from 2009 to 2011, and prospectively from 2012 to 2018. We also developed data on the revenue associated with
INNOVATE, MANUFACTURE, COMPETE: A CLEAN ENERGY ACTION PLAN 1 1
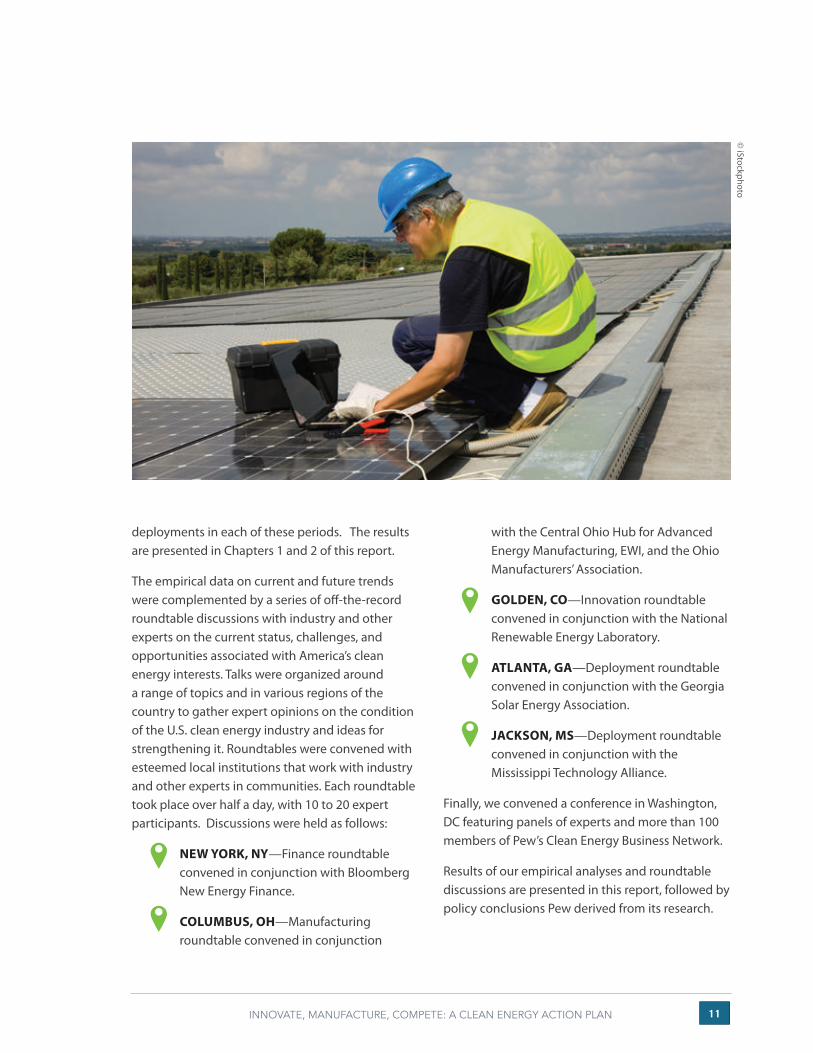
deployments in each of these periods. The results are presented in Chapters 1 and 2 of this report.
The empirical data on current and future trends were complemented by a series of off-the-record roundtable discussions with industry and other experts on the current status, challenges, and opportunities associated with America’s clean energy interests. Talks were organized around a range of topics and in various regions of the country to gather expert opinions on the condition of the U.S. clean energy industry and ideas for strengthening it. Roundtables were convened with esteemed local institutions that work with industry and other experts in communities. Each roundtable took place over half a day, with 10 to 20 expert participants. Discussions were held as follows:
• NEW YORK, NY—Finance roundtable convened in conjunction with Bloomberg New Energy Finance.
• COLUMBUS, OH—Manufacturing roundtable convened in conjunction
with the Central Ohio Hub for Advanced Energy Manufacturing, EWI, and the Ohio Manufacturers’ Association.
• GOLDEN, CO—Innovation roundtable convened in conjunction with the National Renewable Energy Laboratory.
• ATLANTA, GA—Deployment roundtable convened in conjunction with the Georgia Solar Energy Association.
• JACKSON, MS—Deployment roundtable convened in conjunction with the Mississippi Technology Alliance.
Finally, we convened a conference in Washington, DC featuring panels of experts and more than 100 members of Pew’s Clean Energy Business Network.
Results of our empirical analyses and roundtable discussions are presented in this report, followed by policy conclusions Pew derived from its research.
© iStockphoto

INNOVATE, MANUFACTURE, COMPETE: A CLEAN ENERGY ACTION PLAN 1 2
CHAPTER 1
Worldwide data on investment and installations indicate that the clean energy sector has passed a tipping point. Solar, wind, and other clean electric generation technologies have moved from the margins to the mainstream of global energy markets.
The Pew Charitable Trusts has chronicled clean energy investment trends in the world’s leading economies, documenting a near-decade-long rally. Last year, worldwide investments rose 6.5 percent, reaching a record $263 billion.4 Renewable energy sources accounted for almost half of all generating capacity added to the world’s power sector.5
Excluding research and development, investment in the sector is now more than 600 percent higher than in 2004 (Figure 1). The world’s leading economies (members of the Group of 206) dominate the sector, accounting for 95 percent of all global investments in clean energy, but investment and deployment in parts of Africa, Asia, and Latin America are expected to grow by 10 to 20 percent annually over the next decade.7
THE CLEAN ENERGY TIPPING POINT
4 Who’s Winning the Clean Energy Race? 2011 Edition. Page 2.
5 Renewables 2012 Global Status Report. Page 23.
6 The Group of 20 was established in 1999 to bring together leading industrialized and developing economies to discuss key global economic issues. The G-20 is made up of finance ministers and central bank governors representing the European Union and 19 countries: Argentina, Australia, Brazil, Canada, China, France, Germany, India, Indonesia, Italy, Japan, Mexico, Russia, Saudi Arabia, South Africa, South Korea, Turkey, the United Kingdom, and the United States.
7 Who’s Winning the Clean Energy Race? 2011 Edition. Page 2.

INNOVATE, MANUFACTURE, COMPETE: A CLEAN ENERGY ACTION PLAN 1 3
FIGURE 1: GLOBAL CLEAN ENERGY INVESTMENT* 2004-11 (BILLIONS OF $)
*Does not include R&D investmentsSource: Who’s Winning the Clean Energy Race: 2011 Edition
FIGURE 2: COST OF SOLAR ENERGY MODULES 1985-2011 (IN $/ WATT)
Source: 1986-2006 Paula Mints/Strategies Unlimited, 2006-2011 Paula Mints, Navigant
National governments, businesses, and consumers are turning to clean energy for a variety of reasons.
CLEAN ENERGY PRICES ARE DROPPING RAPIDLY
Technological advances and growing international competition have combined to dramatically lower the cost of emerging clean energy technologies in recent years.
The American Wind Energy Association estimates that the cost of wind energy has declined 90 percent since 19808 and is now cost-competitive in some energy markets domestically and internationally.
Figure 2 shows the sharp drop in the price paid for solar photovoltaic energy modules in recent decades. The average global cost of solar modules has fallen 75 percent in the past three years alone.9
CLEAN ENERGY HELPS MEET GROWING POWER DEMAND GLOBALLY…
The U.S. Energy Information Administration estimates that global energy consumption will increase by 47 percent from 2010 to 2035 to meet worldwide demand.10 Eighty-five percent of that growth will occur in emerging and developing economies. The International Energy Agency estimates that clean energy will provide half of the electric generating capacity installed over the next 25 years.11 During that period, renewable energy could attract up to $5.9 trillion worth of investment.12
8 American Wind Energy Association. Federal Production Tax Credit for Wind Energy. http://awea.org/issues/federal_policy/upload/PTC-Fact-Sheet.pdf
9 Greentech Media. 2Q 2012. Global Clean Energy Investment Reaches $59.6B. July 13, 2012. http://www.greentechmedia.com/articles/read/2q-2012-global-clean-energy-investment-reaches-59.6b
10 U.S. Energy Information Administration. Annual Energy Outlook 2012. June 2012. Page 74. http://www.eia.gov/forecasts/aeo/pdf/0383(2012).pdf
11 International Energy Association. World Energy Outlook. 2011. Executive Summary. Page 2. http://www.iea.org/Textbase/npsum/weo2011sum.pdf
12 U.S. Department of State. Global Economic Statecraft Day: Energy and Economics. http://blogs.state.gov/index.php?/mobile/display/5004
250
200
150
100
50
0
2004 2005 2006 2007 2008 2009 2010 2011
Non-G-20 Countries G-20 Countries
Due to Silicon Shortage
$0
$1
$2
$3
$4
$5
$6
$7
$8
1985 1990 1995 2000 2005 2010 2011
Curr
ent $
Wat
t-pe
ak
INNOVATE, MANUFACTURE, COMPETE: A CLEAN ENERGY ACTION PLAN 1 4
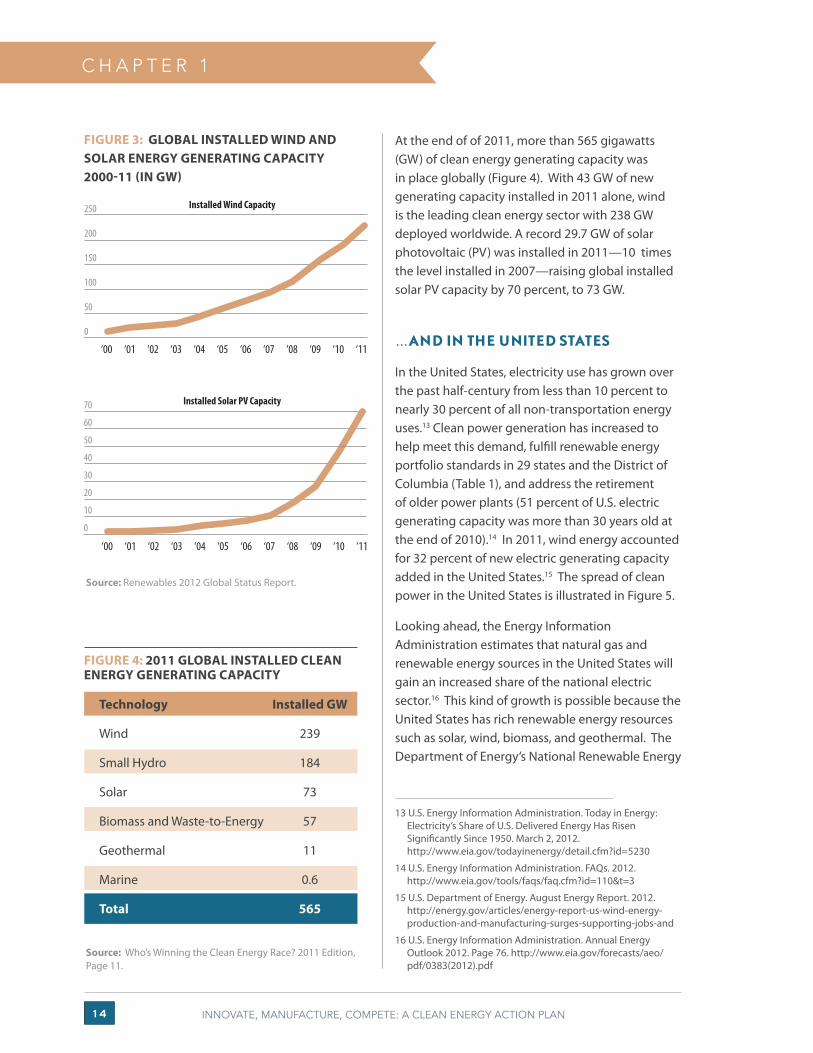
FIGURE 3: GLOBAL INSTALLED WIND AND SOLAR ENERGY GENERATING CAPACITY 2000-11 (IN GW)
Source: Renewables 2012 Global Status Report.
FIGURE 4: 2011 GLOBAL INSTALLED CLEAN ENERGY GENERATING CAPACITY
C H A P T E R 1
Source: Who’s Winning the Clean Energy Race? 2011 Edition, Page 11.
Technology
Wind
Small Hydro
Solar
Biomass and Waste-to-Energy
Geothermal
Marine
Total
Installed GW
239
184
73
57
11
0.6
565
At the end of of 2011, more than 565 gigawatts (GW) of clean energy generating capacity was in place globally (Figure 4). With 43 GW of new generating capacity installed in 2011 alone, wind is the leading clean energy sector with 238 GW deployed worldwide. A record 29.7 GW of solar photovoltaic (PV) was installed in 2011—10 times the level installed in 2007—raising global installed solar PV capacity by 70 percent, to 73 GW.
…AND IN THE UNITED STATES
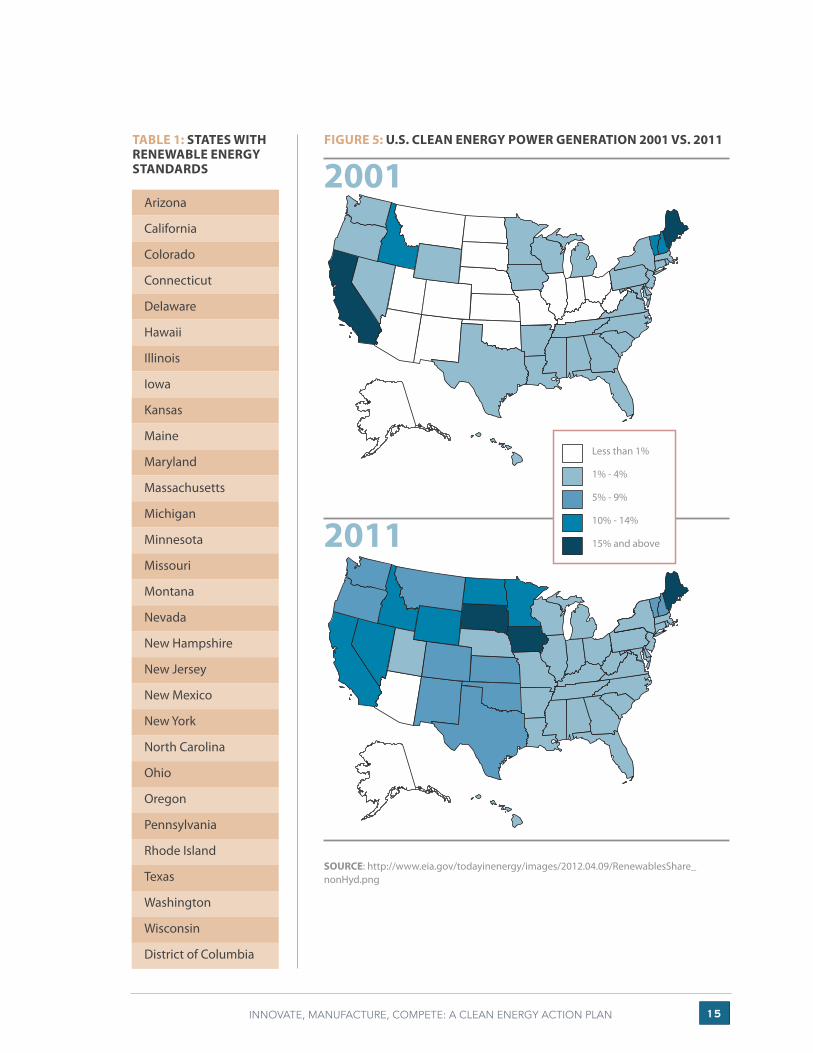
In the United States, electricity use has grown over the past half-century from less than 10 percent to nearly 30 percent of all non-transportation energy uses.13 Clean power generation has increased to help meet this demand, fulfill renewable energy portfolio standards in 29 states and the District of Columbia (Table 1), and address the retirement of older power plants (51 percent of U.S. electric generating capacity was more than 30 years old at the end of 2010).14 In 2011, wind energy accounted for 32 percent of new electric generating capacity added in the United States.15 The spread of clean power in the United States is illustrated in Figure 5.
Looking ahead, the Energy Information Administration estimates that natural gas and renewable energy sources in the United States will gain an increased share of the national electric sector.16 This kind of growth is possible because the United States has rich renewable energy resources such as solar, wind, biomass, and geothermal. The Department of Energy’s National Renewable Energy
13 U.S. Energy Information Administration. Today in Energy: Electricity’s Share of U.S. Delivered Energy Has Risen Significantly Since 1950. March 2, 2012. http://www.eia.gov/todayinenergy/detail.cfm?id=5230
14 U.S. Energy Information Administration. FAQs. 2012. http://www.eia.gov/tools/faqs/faq.cfm?id=110&t=3
15 U.S. Department of Energy. August Energy Report. 2012. http://energy.gov/articles/energy-report-us-wind-energy-production-and-manufacturing-surges-supporting-jobs-and
16 U.S. Energy Information Administration. Annual Energy Outlook 2012. Page 76. http://www.eia.gov/forecasts/aeo/pdf/0383(2012).pdf
250
200
150
100
50
0
‘00 ‘01 ‘02 ‘03 ‘04 ‘05 ‘06 ‘07 ‘08 ‘09 ‘10
Installed Wind Capacity
70
60
50
40
30
20
10
0
Installed Solar PV Capacity
‘11
‘00 ‘01 ‘02 ‘03 ‘04 ‘05 ‘06 ‘07 ‘08 ‘09 ‘10 ‘11
INNOVATE, MANUFACTURE, COMPETE: A CLEAN ENERGY ACTION PLAN 1 5
TABLE 1: STATES WITH RENEWABLE ENERGY STANDARDS
SOURCE: http://www.eia.gov/todayinenergy/images/2012.04.09/RenewablesShare_nonHyd.png
FIGURE 5: U.S. CLEAN ENERGY POWER GENERATION 2001 VS. 2011
Arizona
California
Colorado
Connecticut
Delaware
Hawaii
Illinois
Iowa
Kansas
Maine
Maryland
Massachusetts
Michigan
Minnesota
Missouri
Montana
Nevada
New Hampshire
New Jersey
New Mexico
New York
North Carolina
Ohio
Oregon
Pennsylvania
Rhode Island
Texas
Washington
Wisconsin
District of Columbia
2001
Less than 1%
1% - 4%
5% - 9%
10% - 14%
15% and above2011
INNOVATE, MANUFACTURE, COMPETE: A CLEAN ENERGY ACTION PLAN 1 6
C H A P T E R 1
Laboratory reports that these resources are more than sufficient to meet 80 percent of U.S. electric energy needs in coming decades.17 This domestic availability will help ensure that we have a diverse, secure, and affordable supply of energy.
CLEAN ENERGY HELPS CREATE JOBS
Progress in the clean energy sector is helping to create thousands of jobs in the United States and around the world. Globally, an estimated 5 million jobs were connected to the clean energy sector by the end of 2011.18 In the United States, an estimated 152,000 Americans are employed in the biomass sector, 100,000 in solar, and 75,000 in wind.19
The expansion of clean energy is also helping to provide new manufacturing opportunities in the United States and other nations. According to the Solar Energy Industries Association, one-fourth (25,000) of all jobs in the U.S. solar sector are in manufacturing.20 In the past five years, American wind power has created almost 500 domestic manufacturing facilities, and today the manufacturing sector accounts for 30,000 domestic wind jobs.21 The U.S. wind supply chain has grown in recent years, with nearly 70 percent of the component parts of wind installations in the United States being sourced domestically.22 Recent research shows that investments in clean
energy have yielded more than three times the number of jobs as have comparable investments in conventional fossil fuels.23
CLEAN ENERGY HELPS REDUCE EMISSIONS
Globally, concern about emissions associated with the combustion of fossil fuels that are harmful to human health and the environment is spurring the deployment of clean energy technologies. Both the public and private sectors are embracing clean energy as a means of reducing local and global air pollution.
The U.S. Environmental Protection Agency estimates that electricity generation creates the lion’s share of industrial air emissions in the United States, including “67 percent of the nation’s sulfur dioxide emissions, 23 percent of nitrogen oxide emissions, and 40 percent of man-made carbon dioxide emissions.”24
The predominant fossil fuels used to generate electricity produce much more global-warming-related pollution than do clean energy sources. Accounting for all aspects of production and use, coal results in about 20 times and natural gas 10 times the global-warming-related pollution of their clean energy counterparts.25
17 National Renewable Energy Laboratory. 2012. Renewable Electricity Futures Study. Hand, M.M., S. Baldwin, E. DeMeo, J.M. Reilly, T. Mai, D. Arent, G. Porro, M. Meshek, D. Sandor (eds.). Four volumes. NREL/TP-6A20-52409. Golden, Colo.: National Renewable Energy Laboratory. Vol. 1, Page 31. http://www.nrel.gov/docs/fy12osti/52409-1.pdf
18 Renewables 2012 Global Status Report. Page 26.
19 Ibid. Page 27.
20 Platzer, M.D. Congressional Research Service. June 2012. U.S. Solar Photovoltaic Manufacturing: Industry Trends, Global Competition, Federal Support. Page 14. http://www.fas.org/sgp/crs/misc/R42509.pdf
21 American Wind Energy Association. April 2012. Annual Report press release. Wind Power Bringing Innovation, Manufacturing Back to American Industry. http://www.renewableenergyworld.com/rea/partner/american-wind-energy-association/news
22 U.S. Department of Energy. August 2011. 2011 wind Technologies Market Report. http://www1.eere.energy.gov/wind/pdfs/2011_wind_technologies_market_report.pdf.
23 Political Economy Research Institute and Center for American Progress. Economic Benefits of Investing in Clean Energy. 2009. Page 30. http://www.peri.umass.edu/fileadmin/pdf/other_publication_types/green_economics/economic_benefits/economic_benefits.PDF
24 U.S. Environmental Protection Agency. 2007. http://www.epa.gov/cleanenergy/energy-and-you/affect/air-emissions.html
25 National Renewable Energy Laboratory. May 2012. Narrows Energy Tech Emissions Estimates.http://www.nrel.gov/news/features/feature_detail.cfm/feature_id=1836.
INNOVATE, MANUFACTURE, COMPETE: A CLEAN ENERGY ACTION PLAN 1 7
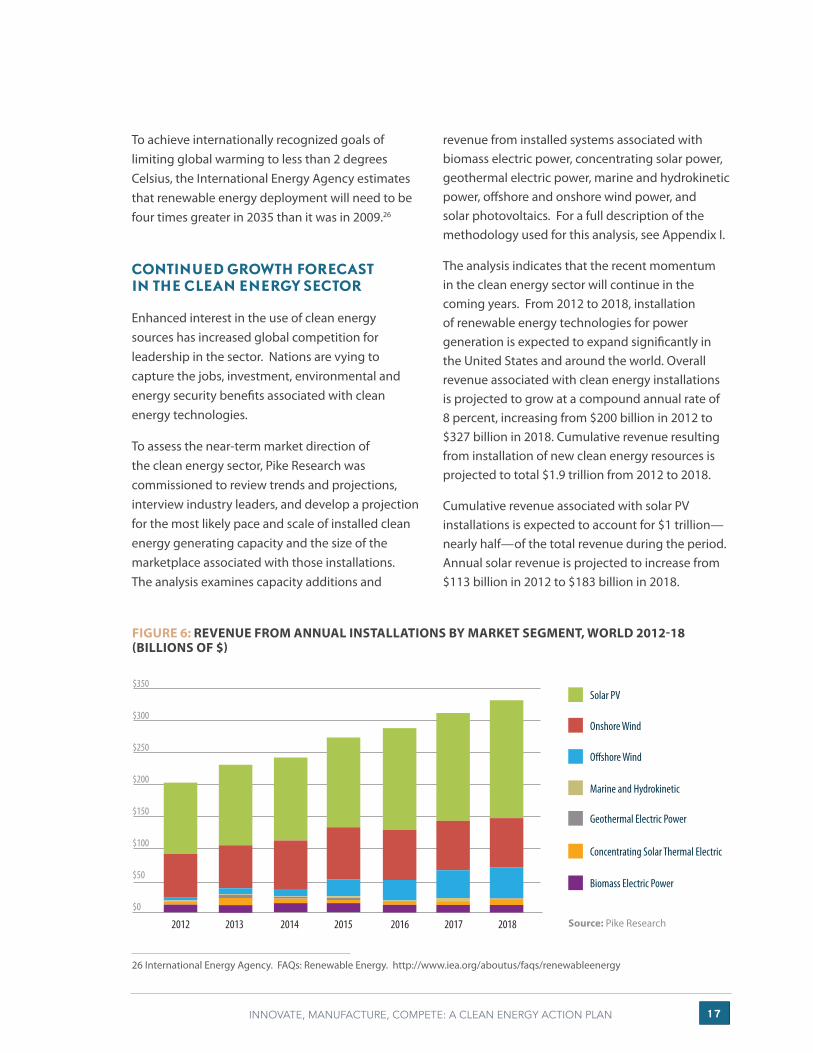
FIGURE 6: REVENUE FROM ANNUAL INSTALLATIONS BY MARKET SEGMENT, WORLD 2012-18 (BILLIONS OF $)
To achieve internationally recognized goals of limiting global warming to less than 2 degrees Celsius, the International Energy Agency estimates that renewable energy deployment will need to be four times greater in 2035 than it was in 2009.26
CONTINUED GROWTH FORECAST IN THE CLEAN ENERGY SECTOR
Enhanced interest in the use of clean energy sources has increased global competition for leadership in the sector. Nations are vying to capture the jobs, investment, environmental and energy security benefits associated with clean energy technologies.
To assess the near-term market direction of the clean energy sector, Pike Research was commissioned to review trends and projections, interview industry leaders, and develop a projection for the most likely pace and scale of installed clean energy generating capacity and the size of the marketplace associated with those installations. The analysis examines capacity additions and
26 International Energy Agency. FAQs: Renewable Energy. http://www.iea.org/aboutus/faqs/renewableenergy
revenue from installed systems associated with biomass electric power, concentrating solar power, geothermal electric power, marine and hydrokinetic power, offshore and onshore wind power, and solar photovoltaics. For a full description of the methodology used for this analysis, see Appendix I.
The analysis indicates that the recent momentum in the clean energy sector will continue in the coming years. From 2012 to 2018, installation of renewable energy technologies for power generation is expected to expand significantly in the United States and around the world. Overall revenue associated with clean energy installations is projected to grow at a compound annual rate of 8 percent, increasing from $200 billion in 2012 to $327 billion in 2018. Cumulative revenue resulting from installation of new clean energy resources is projected to total $1.9 trillion from 2012 to 2018.
Cumulative revenue associated with solar PV installations is expected to account for $1 trillion—nearly half—of the total revenue during the period. Annual solar revenue is projected to increase from $113 billion in 2012 to $183 billion in 2018.
$350
$300
$250
$200
$150
$100
$50
$0
Solar PV
Onshore Wind
Marine and Hydrokinetic
Geothermal Electric Power
2012
Offshore Wind
2013 2014 2015 2016 2017 2018 Source: Pike Research
Biomass Electric Power
Concentrating Solar Thermal Electric
INNOVATE, MANUFACTURE, COMPETE: A CLEAN ENERGY ACTION PLAN 1 8
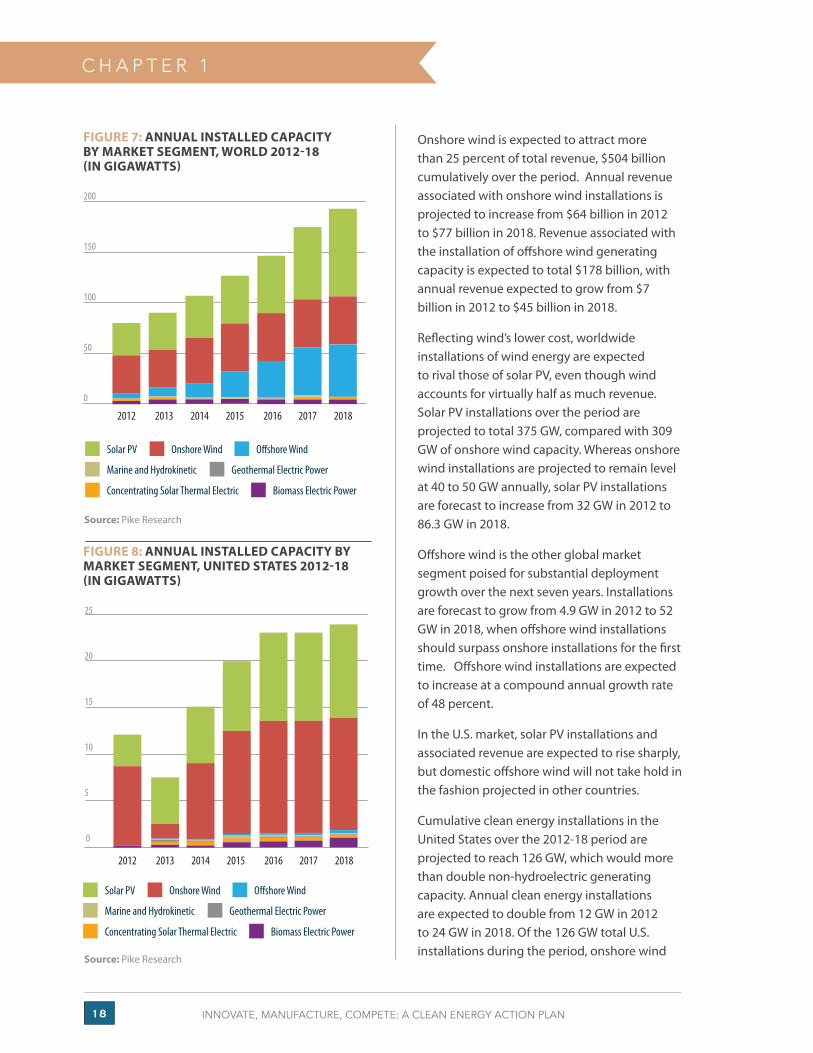
FIGURE 8: ANNUAL INSTALLED CAPACITY BY MARKET SEGMENT, UNITED STATES 2012-18 (IN GIGAWATTS)
C H A P T E R 1
Onshore wind is expected to attract more than 25 percent of total revenue, $504 billion cumulatively over the period. Annual revenue associated with onshore wind installations is projected to increase from $64 billion in 2012 to $77 billion in 2018. Revenue associated with the installation of offshore wind generating capacity is expected to total $178 billion, with annual revenue expected to grow from $7 billion in 2012 to $45 billion in 2018.
Reflecting wind’s lower cost, worldwide installations of wind energy are expected to rival those of solar PV, even though wind accounts for virtually half as much revenue. Solar PV installations over the period are projected to total 375 GW, compared with 309 GW of onshore wind capacity. Whereas onshore wind installations are projected to remain level at 40 to 50 GW annually, solar PV installations are forecast to increase from 32 GW in 2012 to 86.3 GW in 2018.
Offshore wind is the other global market segment poised for substantial deployment growth over the next seven years. Installations are forecast to grow from 4.9 GW in 2012 to 52 GW in 2018, when offshore wind installations should surpass onshore installations for the first time. Offshore wind installations are expected to increase at a compound annual growth rate of 48 percent.
In the U.S. market, solar PV installations and associated revenue are expected to rise sharply, but domestic offshore wind will not take hold in the fashion projected in other countries.
Cumulative clean energy installations in the United States over the 2012-18 period are projected to reach 126 GW, which would more than double non-hydroelectric generating capacity. Annual clean energy installations are expected to double from 12 GW in 2012 to 24 GW in 2018. Of the 126 GW total U.S. installations during the period, onshore wind
FIGURE 7: ANNUAL INSTALLED CAPACITY BY MARKET SEGMENT, WORLD 2012-18 (IN GIGAWATTS)
25
20
15
10
5
0
2012 2013 2014 2015 2016 2017 2018
200
150
100
50
0
2012 2013 2014 2015 2016 2017 2018
Source: Pike Research
Source: Pike Research
Solar PV Onshore Wind
Marine and Hydrokinetic Geothermal Electric Power
Offshore Wind
Biomass Electric PowerConcentrating Solar Thermal Electric
Solar PV Onshore Wind
Marine and Hydrokinetic Geothermal Electric Power
Offshore Wind
Biomass Electric PowerConcentrating Solar Thermal Electric
INNOVATE, MANUFACTURE, COMPETE: A CLEAN ENERGY ACTION PLAN 1 9
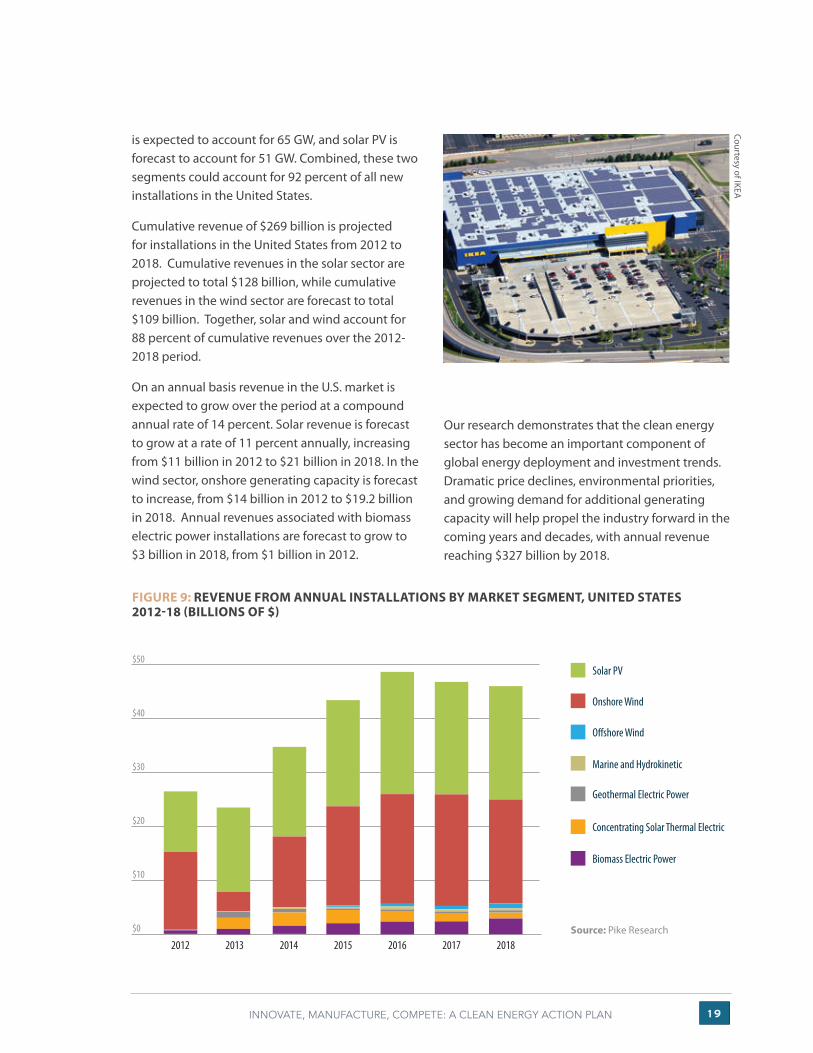
FIGURE 9: REVENUE FROM ANNUAL INSTALLATIONS BY MARKET SEGMENT, UNITED STATES 2012-18 (BILLIONS OF $)
is expected to account for 65 GW, and solar PV is forecast to account for 51 GW. Combined, these two segments could account for 92 percent of all new installations in the United States.
Cumulative revenue of $269 billion is projected for installations in the United States from 2012 to 2018. Cumulative revenues in the solar sector are projected to total $128 billion, while cumulative revenues in the wind sector are forecast to total $109 billion. Together, solar and wind account for 88 percent of cumulative revenues over the 2012-2018 period.
On an annual basis revenue in the U.S. market is expected to grow over the period at a compound annual rate of 14 percent. Solar revenue is forecast to grow at a rate of 11 percent annually, increasing from $11 billion in 2012 to $21 billion in 2018. In the wind sector, onshore generating capacity is forecast to increase, from $14 billion in 2012 to $19.2 billion in 2018. Annual revenues associated with biomass electric power installations are forecast to grow to $3 billion in 2018, from $1 billion in 2012.
Courtesy of IKEA
Our research demonstrates that the clean energy sector has become an important component of global energy deployment and investment trends. Dramatic price declines, environmental priorities, and growing demand for additional generating capacity will help propel the industry forward in the coming years and decades, with annual revenue reaching $327 billion by 2018.
$50
$40
$30
$20
$10
$0
2012 2013 2014 2015 2016 2017 2018Source: Pike Research
Solar PV
Onshore Wind
Marine and Hydrokinetic
Geothermal Electric Power
Offshore Wind
Biomass Electric Power
Concentrating Solar Thermal Electric
INNOVATE, MANUFACTURE, COMPETE: A CLEAN ENERGY ACTION PLAN 20
CHAPTER 2
With the global clean energy sector growing in size and reach, the United States finds itself at a competitive crossroads. Once a world leader in innovation and manufacturing of clean energy technologies, it now faces considerable competitive challenges as worldwide clean energy leadership shifts from the industrialized Western powers to the emerging economies of Asia.
WHERE THE U.S. STANDS IN THE CLEAN ENERGY RACE
In 2011, the United States attracted a record $48.1 billion worth of private clean energy investments to lead the world. Last year’s robust figures, however, mask what appear to be serious shortcomings in America’s clean energy competitiveness. On a variety of measures, the United States lags other nations: It is not among the top 10 countries in investment growth rate over the past five years,27 and it ranks 10th in the world in its installed clean energy capacity growth rate since 2006. Finally, the United States is ranked eighth among the G-20 nations in terms of investment intensity, which compares clean energy investments with national economic output.
In fact, research for this report shows the United States trailing in deployment across a range of clean energy technologies in recent years. In the biomass sector, China’s installed capacity additions over the past three years have
27 Who’s Winning the Clean Energy Race? 2011 Edition. Page 4.
INNOVATE, MANUFACTURE, COMPETE: A CLEAN ENERGY ACTION PLAN 2 1
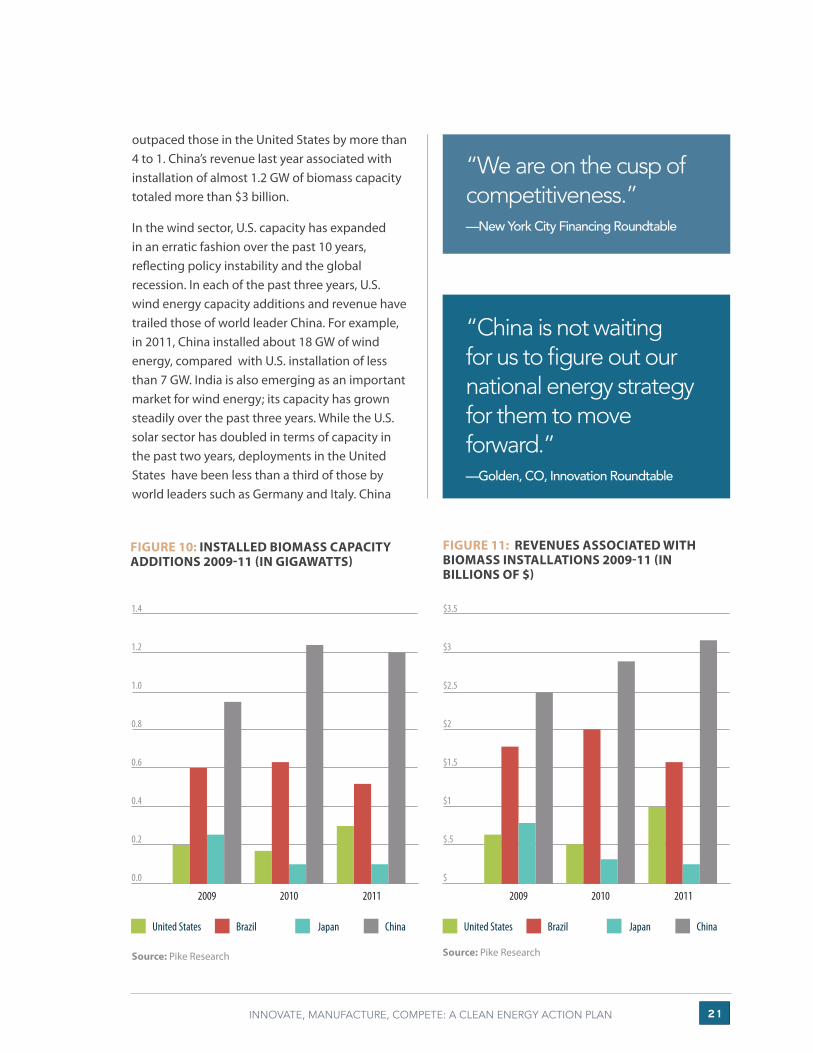
outpaced those in the United States by more than 4 to 1. China’s revenue last year associated with installation of almost 1.2 GW of biomass capacity totaled more than $3 billion.
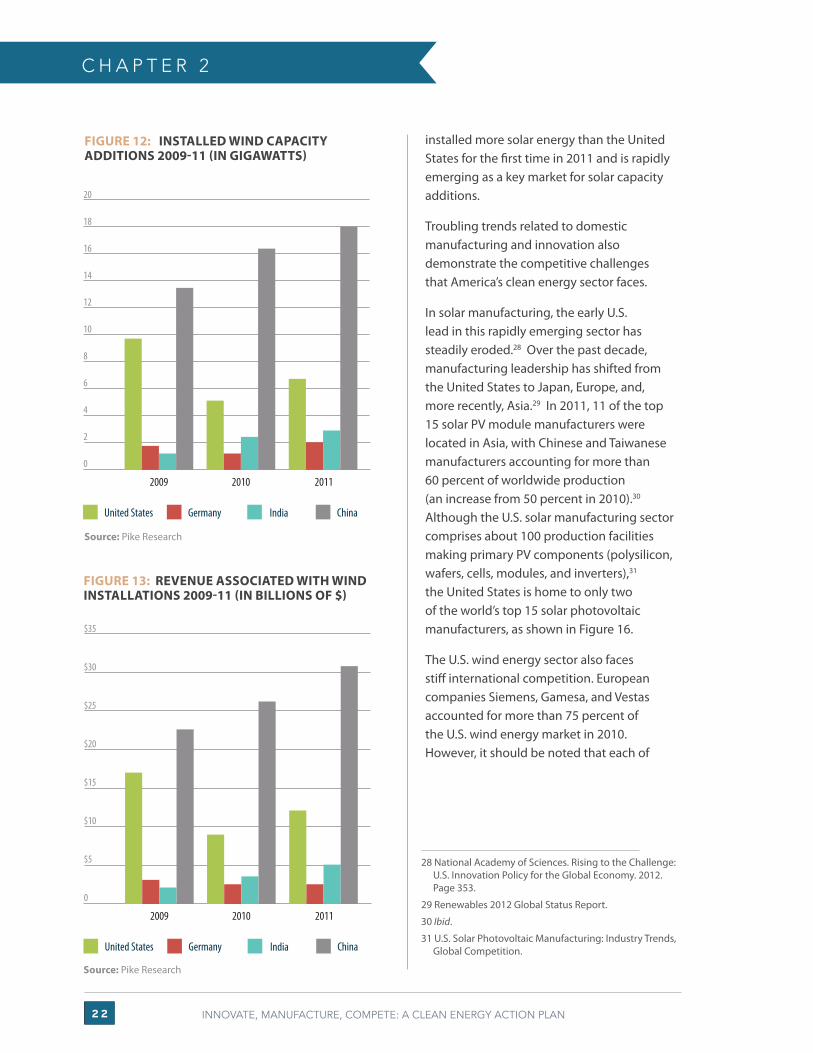
In the wind sector, U.S. capacity has expanded in an erratic fashion over the past 10 years, reflecting policy instability and the global recession. In each of the past three years, U.S. wind energy capacity additions and revenue have trailed those of world leader China. For example, in 2011, China installed about 18 GW of wind energy, compared with U.S. installation of less than 7 GW. India is also emerging as an important market for wind energy; its capacity has grown steadily over the past three years. While the U.S. solar sector has doubled in terms of capacity in the past two years, deployments in the United States have been less than a third of those by world leaders such as Germany and Italy. China
FIGURE 10: INSTALLED BIOMASS CAPACITY ADDITIONS 2009-11 (IN GIGAWATTS)
“China is not waiting for us to figure out our national energy strategy for them to move forward.”—Golden, CO, Innovation Roundtable
FIGURE 11: REVENUES ASSOCIATED WITH BIOMASS INSTALLATIONS 2009-11 (IN BILLIONS OF $)
“We are on the cusp of competitiveness.”—New York City Financing Roundtable
1.4
1.2
1.0
0.8
0.6
0.4
0.2
0.0
United States Brazil Japan China
2009 2010 2011
$3.5
$3
$2.5
$2
$1.5
$1
$.5
$
United States Brazil Japan China
2009 2010 2011
Source: Pike Research Source: Pike Research
INNOVATE, MANUFACTURE, COMPETE: A CLEAN ENERGY ACTION PLAN 22
C H A P T E R 2
installed more solar energy than the United States for the first time in 2011 and is rapidly emerging as a key market for solar capacity additions.
Troubling trends related to domestic manufacturing and innovation also demonstrate the competitive challenges that America’s clean energy sector faces.
In solar manufacturing, the early U.S. lead in this rapidly emerging sector has steadily eroded.28 Over the past decade, manufacturing leadership has shifted from the United States to Japan, Europe, and, more recently, Asia.29 In 2011, 11 of the top 15 solar PV module manufacturers were located in Asia, with Chinese and Taiwanese manufacturers accounting for more than 60 percent of worldwide production (an increase from 50 percent in 2010).30 Although the U.S. solar manufacturing sector comprises about 100 production facilities making primary PV components (polysilicon, wafers, cells, modules, and inverters),31 the United States is home to only two of the world’s top 15 solar photovoltaic manufacturers, as shown in Figure 16.
The U.S. wind energy sector also faces stiff international competition. European companies Siemens, Gamesa, and Vestas accounted for more than 75 percent of the U.S. wind energy market in 2010. However, it should be noted that each of
FIGURE 12: INSTALLED WIND CAPACITY ADDITIONS 2009-11 (IN GIGAWATTS)
FIGURE 13: REVENUE ASSOCIATED WITH WIND INSTALLATIONS 2009-11 (IN BILLIONS OF $)
28 National Academy of Sciences. Rising to the Challenge: U.S. Innovation Policy for the Global Economy. 2012. Page 353.
29 Renewables 2012 Global Status Report.
30 Ibid.
31 U.S. Solar Photovoltaic Manufacturing: Industry Trends, Global Competition.
20
18
16
14
12
10
8
6
4
2
0
United States Germany India China
2009 2010 2011
$35
$30
$25
$20
$15
$10
$5
0
United States Germany India China
2009 2010 2011
Source: Pike Research
Source: Pike Research

INNOVATE, MANUFACTURE, COMPETE: A CLEAN ENERGY ACTION PLAN 23
FIGURE 14: INSTALLED SOLAR CAPACITY ADDITIONS 2009-11 (IN GW)
FIGURE 15: REVENUE ASSOCIATED WITH SOLAR INSTALLATIONS 2009-11 (BILLIONS OF $)
FIGURE 16: MARKET SHARES OF TOP 15 SOLAR PV MODULE MANUFACTURERS BY COUNTRY 2011
Source: Renewables 2012 Global Status Report.
TOTAL SALES: > 40 GW
10
9
8
7
6
5
4
3
2
1
0
United States Germany China Italy
2009 2010 2011
$40
$35
$30
$25
$20
$15
$10
$5
0
United States Germany China Italy
2009 2010 2011
C H I N A
5.8% Suntech Power
4.8% Yingli Green Energy
4.3% Trina Solar
2.7% Tianwei New Energy
2.7% Hanwha SolarOne
2.5% LDK Solar
2.5% Hareon Solar
2.4% JA Solar
2.4% Jinko Solar
U S A
6.7% First Solar
2.8% Sun Power
C A N A D A
4.0% Canadian Solar
J A P A N
1.9% Kyocera
2.8% Sharp
N O R W A Y
1.9% REC
51% Other
Source: Pike ResearchSource: Pike Research
INNOVATE, MANUFACTURE, COMPETE: A CLEAN ENERGY ACTION PLAN 24
U N I T E D S T A T E S
C H A P T E R 2
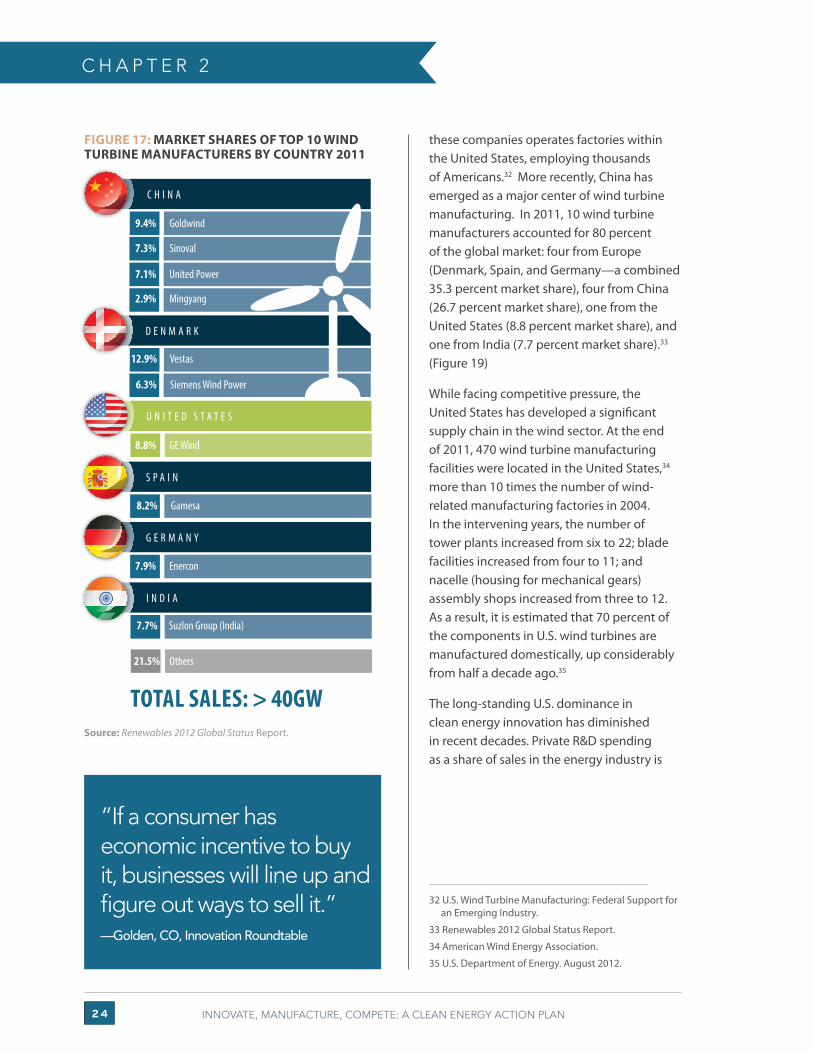
these companies operates factories within the United States, employing thousands of Americans.32 More recently, China has emerged as a major center of wind turbine manufacturing. In 2011, 10 wind turbine manufacturers accounted for 80 percent of the global market: four from Europe (Denmark, Spain, and Germany—a combined 35.3 percent market share), four from China (26.7 percent market share), one from the United States (8.8 percent market share), and one from India (7.7 percent market share).33
(Figure 19)
While facing competitive pressure, the United States has developed a significant supply chain in the wind sector. At the end of 2011, 470 wind turbine manufacturing facilities were located in the United States,34 more than 10 times the number of wind-related manufacturing factories in 2004. In the intervening years, the number of tower plants increased from six to 22; blade facilities increased from four to 11; and nacelle (housing for mechanical gears) assembly shops increased from three to 12. As a result, it is estimated that 70 percent of the components in U.S. wind turbines are manufactured domestically, up considerably from half a decade ago.35
The long-standing U.S. dominance in clean energy innovation has diminished in recent decades. Private R&D spending as a share of sales in the energy industry is
FIGURE 17: MARKET SHARES OF TOP 10 WIND TURBINE MANUFACTURERS BY COUNTRY 2011
Source: Renewables 2012 Global Status Report.
32 U.S. Wind Turbine Manufacturing: Federal Support for an Emerging Industry.
33 Renewables 2012 Global Status Report.
34 American Wind Energy Association.
35 U.S. Department of Energy. August 2012.
“If a consumer has economic incentive to buy it, businesses will line up and figure out ways to sell it.”—Golden, CO, Innovation Roundtable
12.9% Vestas
TOTAL SALES: > 40GW
6.3% Siemens Wind Power
8.8% GE Wind
C H I N A
9.4% Goldwind
7.3% Sinoval
7.1% United Power
2.9% Mingyang
D E N M A R K
S P A I N
8.2% Gamesa
G E R M A N Y
7.9% Enercon
I N D I A
7.7% Suzlon Group (India)
21.5% Others

INNOVATE, MANUFACTURE, COMPETE: A CLEAN ENERGY ACTION PLAN 25
only 0.4 percent, compared with 20.5 percent in pharmaceuticals, 11.5 percent in aerospace and defense, 7.9 percent in computers and electronics, and 2.4 percent in the automotive industry.36 Public-sector energy research has fallen since its peak in the late 1970s ($8.8 billion in constant 2012 dollars) to $4.4 billion in 2012.37
FIGURE 18: TRENDS IN NONDEFENSE RESEARCH AND DEVELOPMENT BY FUNCTION 1953-2013 (IN BILLIONS OF $)
In contrast, governments in Europe and Asia are more actively engaged in energy R&D, challenging U.S. leadership. As Figure 19 shows, the United States spends a smaller fraction of gross domestic product (GDP) on energy research, development, and demonstration than do many of its competitors.38
FIGURE 19: TOTAL CLEAN ENERGY RESEARCH, DEVELOPMENT, AND DEPLOYMENT SPENDING AS PERCENT SHARE OF GDP 2010 *
Source: International Energy Agency
36 American Energy Innovation Council. Catalyzing American Ingenuity: The Role of Government in Energy Innovation. 2011.
37 American Association for the Advancement of Science. Trends in Federal R&D by Function. http://americanenergyinnovation.org/wp-content/uploads/2012/04/AEIC_Catalyzing_Ingenuity_2011.pdf
38 President’s Council of Advisors on Science and Technology. Report to the President on Accelerating the Pace of Change in Energy Technologies Through an Integrated Federal Energy Policy. November 2010. Page 13. http://www.whitehouse.gov/sites/default/files/microsites/ostp/pcast-energy-tech-report.pdf
0.035
0.03
0.025
0.02
0.015
0.01
0.005
0
South Korea United Kingdom Germany
Japan U.S.
$70
$60
$50
$40
$30
$20
$10
$0
Health Space Energy Other
Natural Resources/Environment
1953 1958 1963 1968 1973 1978 1983 1988 1993 1998 2003 2008 2013
General Science
* Includes funding for energy efficiency, renewable energy and other power and storage technologies.
Source: American Academy for the Advancement of Science. www.aaas.org/spp/rd/histda13.pdf
INNOVATE, MANUFACTURE, COMPETE: A CLEAN ENERGY ACTION PLAN 26
CHAPTER 3
INDUSTRY PERSPECTIVES ON U.S. CLEAN ENERGY COMPETITIVENESSThe trends explored in Chapter 2 suggest that the public and private sectors in the United States need to increase cooperation to bolster America’s competitive success in the clean energy marketplace.
The Pew Charitable Trusts has contacted public- and private-sector experts to gauge opinion about the state of the clean energy industry in the United States: its strengths, weaknesses, and opportunities for progress. Roundtable discussions were organized across the country to gather input from industry leaders on issues of clean energy innovation, manufacturing, financing, and deployment. Talks were held with diverse experts—from industry, government, academia, and business—involved in various sectors of the clean energy industry. The roundtables were also geographically diverse. Discussions were convened with esteemed local institutions in New York City; Columbus, OH; Golden, CO; Atlanta, GA; and Jackson, MS. In addition, Pew convened a conference in Washington, DC, featuring panels of experts and members of its Clean Energy Business Network. In all, more than 200 individuals participated in these discussions.
The remainder of this report details the key findings emanating from these conversations and steps that federal policymakers should consider to enhance our clean energy competitive prospects in the future.

INNOVATE, MANUFACTURE, COMPETE: A CLEAN ENERGY ACTION PLAN 27
K E Y C H A L L E N G E S
POLICY UNCERTAINTY INHIBITS PROGRESS AND INVESTMENT
Industry participants at the Pew roundtables identified the lack of certainty associated with U.S. energy policy as the overriding impediment to clean energy investment and progress. Concern about policy uncertainty was expressed in a variety of ways.
Participants stated that U.S. energy policy lacks a clear sense of purpose or direction. In the past, the energy sector has been successful in meeting significant public policy goals set for the industry, such as making affordable electricity universally available in the United States. Similar goals are needed now to help focus the interests and efforts of scientists, investors, businesses, and the citizenry. Policymakers should to set long-term goals that
foster an economy-wide transformation toward advanced energy technologies that are cheaper, cleaner, and domestically available, thereby advancing the prosperity of the United States.
The clean energy sector is particularly affected by policy uncertainty. For several decades, renewable power policies have been episodic. Funding for research, for example, has gone through frequent and significant swings, hampering innovation efforts. Incentives for clean energy technologies have typically been renewed on a short-term basis and sometimes on an annual basis. The boom-and-bust nature of U.S. clean energy programs makes it extremely difficult for emerging industries to
“If there aren’t consistent policies, then we can’t rely on them to make decisions.”—Columbus, OH, Manufacturing Roundtable
“As a result of politicization, private investment has backed out of the space to invest in more secure investments with less uncertainty and risk.”—Golden, CO, Innovation Roundtable

INNOVATE, MANUFACTURE, COMPETE: A CLEAN ENERGY ACTION PLAN 28
develop the supply chains and business models needed to establish a foothold in the competitive energy marketplace. Uncertainty also shakes the confidence of potential investors and keeps capital on the sidelines.
The uncertainty surrounding the production tax credit’s (PTC) renewal at the end of the year was cited repeatedly as the most obvious and serious example of the difficulties associated with policy uncertainty. Earlier episodes of uncertainty surrounding renewal of the PTC resulted in a 76 to 94 percent drop in wind energy orders in 2000, 2002, and 2004.39
In addition, participants in several of the roundtable discussions expressed disappointment over the expiration of key clean energy initiatives launched as part of the American Recovery and Reinvestment Act (ARRA), including the much-discussed loan guarantee programs and the 1603 Treasury Grant Program. These initiatives were deemed by industry leaders to have been successful at
39 American Wind Energy Association. Federal Production Tax Credit for Wind Energy. http://www.awea.org/issues/federal_policy/upload/PTC-Fact-Sheet.pdf
40 Brookings Institution. Beyond Boom and Bust: Putting Clean Tech on a Path to Subsidy Independence. April 2012. http://www.brookings.edu/research/papers/2012/04/18-clean-investments-muro
FIGURE 20: HISTORIC IMPACT OF PTC EXPIRATION ON ANNUAL WIND INSTALLATION (IN MW)
C H A P T E R 3
1999
2000
2001
2002
2003
2004
2005
2006
2007
2008
2009
2010
2011
94%Drop
12,000
10,000
8,000
6,000
4,000
2,000
0
encouraging private investment. Recent research demonstrates that the expiration of the ARRA programs will create a fiscal cliff for the industry, with public-sector support declining from 2009 levels by 75 percent in 2014.40
The lack of certainty in the United States puts our domestic clean energy industry at a disadvantage compared with those in countries that have clear and long-term clean energy policies. Participants noted that Asian and European competitors have established ambitious clean energy and carbon reduction goals that help guide private investment decisions and reduce risk across the marketplace.
INTERNATIONAL COMPETITION SQUEEZES THE CLEAN ENERGY SECTOR
Worldwide interest in low-carbon and domestically sourced energy supplies is creating momentum in clean energy deployment, as outlined in Chapter 1.
76%Drop
76%Drop
Source: AWEA

INNOVATE, MANUFACTURE, COMPETE: A CLEAN ENERGY ACTION PLAN 29
Governments and industry around the world perceive clean energy as an important economic opportunity. The result has been a rush of investment in clean energy manufacturing in recent years.
Roundtable participants indicated that excess production capacity in the solar and wind sectors is acute, with supply in the solar sector outstripping demand by 2 to 1.41 The speed and scale of investment in clean energy manufacturing capacity has spurred dramatic reductions in the market price of solar and wind products. The price of solar modules dropped 50 percent in 2011 alone, and wind prices were down 10 percent. Recent estimates suggest that for every doubling of production capacity, the cost of manufacturing solar drops by 17 percent.42
Although consumers and society as a whole are benefiting from rapidly declining production costs for clean energy technologies, experts participating in Pew’s clean energy roundtables described a range of profound challenges confronting the industry.
In response to falling prices and rising deployment, manufacturers are making more product but at less profit. Many of those we heard from indicated that they are hard-pressed to make money and instead are struggling to survive. In the United States, Spain, Germany, and China, several manufacturers have ceased or slowed production or gone out of business altogether, and more may soon follow. These are the realities of today’s intensely competitive marketplace.
Several roundtable participants noted that the current difficulties faced by in the clean energy sector are similar to those experienced in the past by other emerging technologies. The early stages of the computer and automobile industries were characterized by scores of market entrants
41 Greentech Solar. When Will the Pain Subside? GTM Forecasts 21 GW of PV Module Capacity to Retire by 2015. July 2012. http://www.greentechmedia.com/articles/read/When-Will-the-Pain-Subside-GTM-Forecasts-21GW-of-PV-Module-Capacity-to-Ret/
42 National Academy of Sciences. Rising to the Challenge: U.S. Innovation Policy for Global Economy. 2012. Page 367.
43 Bloomberg Businessweek. Consolidation Expected in Clean Energy in 2012, E&Y Says. May 2012. http://www.businessweek.com/news/2012-05-27/consolidation-expected-in-clean-energy-in-2012-e-and-y-says
and subsequent consolidation. For example, it was noted that there were more than 100 car manufacturers in the early days of the industry. Experts involved in our discussions indicated that partnerships and consolidation between large and small businesses are likely to occur in the coming months and years. Lending credence to this idea, Ernst & Young reported in mid-2012 that mergers and acquisitions increased by more than 40 percent in the first quarter of this year, to $21.7 billion.43
Over the long term, today’s intense competitive pressures are likely to strengthen the industry. To survive and prosper, companies will have to aggressively pursue cost-saving measures, some of which will occur through improved materials and technological innovation. But industry representatives participating in our roundtables describe how they are vigorously exploring ways to reduce “balance of system” costs across the value chain, from improved manufacturing processes to reduced financial, legal, transportation, permitting, and installation costs.
It was also noted that, over the long term, competitive pressures will place a premium on some of the strengths of American business, including its commitment to producing high-
“Money seeks the best return, and people are holding out for either the lowest risk or the highest return.”—Golden, CO, Innovation Roundtable
INNOVATE, MANUFACTURE, COMPETE: A CLEAN ENERGY ACTION PLAN 30
quality products and its ability to innovate across the supply chain. For example, General Electric has staked a leadership position in the production of larger and taller wind turbines that are more productive and cost-effective for customers.
TIGHT CREDIT SLOWS GROWTH
Recent global economic challenges and associated tight credit markets have made it difficult to raise the capital needed to develop businesses and technologies in many sectors of the economy, including clean energy. Beyond the well-documented credit crunch, Pew’s roundtables in 2012 revealed a number of special and distinct challenges facing clean energy businesses in the United States.
As noted previously, financing in the clean energy sector has been inhibited by perceived federal policy uncertainty. In addition, clean energy and other emerging technologies must overcome stubborn perceptions of risk, which discourage investment and increase the cost of capital.
Clean energy also faces challenges associated with the scale of its financial requirements. It was pointed out that the energy sector is unlike the information technology or other high-tech industries, which can be brought to scale at relatively low cost. In the energy world, considerable amounts of initial capital are needed to finance newer technologies. Lenders are reluctant to expend capital for projects of such scale and risk. Although the United States leads the world in private venture capital investments associated with clean energy, these investments typically occur in the earlier, proof-of-concept stage of technological development. Venture capital funding may not be a good fit for the commercialization of promising clean energy technologies and projects, we learned, because of the large up-front capital requirements involved.
There are a number of compelling reasons for public support of the emerging clean energy sector.
C H A P T E R 3
Advanced energy sources can reduce health, environmental, and other costs to society. As prices for energy innovations come down, access to reliable and affordable energy services increases. But development of new energy products and services requires a public-private partnership. In the near term, public-sector incentives are essential to industry development and realization of the economic, environmental, security, and other benefits associated with cost-competitive clean energy sources.
Financial incentives related to clean energy have primarily taken the form of tax credits. Throughout the roundtable process, extension of these tax credits for the balance of this decade was identified as an essential step for clean energy deployment and industry development in the United States.
Declining prices, however, are moving clean energy technologies closer to cost-competitiveness without subsidies. Several participants noted that clean energy is cost-competitive in certain domestic markets (e.g., residential markets in areas with high electricity costs). And throughout the roundtable process, participants made clear that the industry envisions and welcomes a subsidy-free and truly competitive marketplace.
Participants noted key limitations of the predominant public incentives associated with clean energy finance. Financing for clean energy projects is dependent on costly and complicated tax-equity and debt-financing models that involve substantial transaction costs (e.g., legal and accounting fees) and demand unusually high rates of return. Because of the competitive pressures in
“Energy requires scale, and scale requires big capital dollars.”—Columbus, OH, Manufacturing Roundtable
INNOVATE, MANUFACTURE, COMPETE: A CLEAN ENERGY ACTION PLAN 3 1
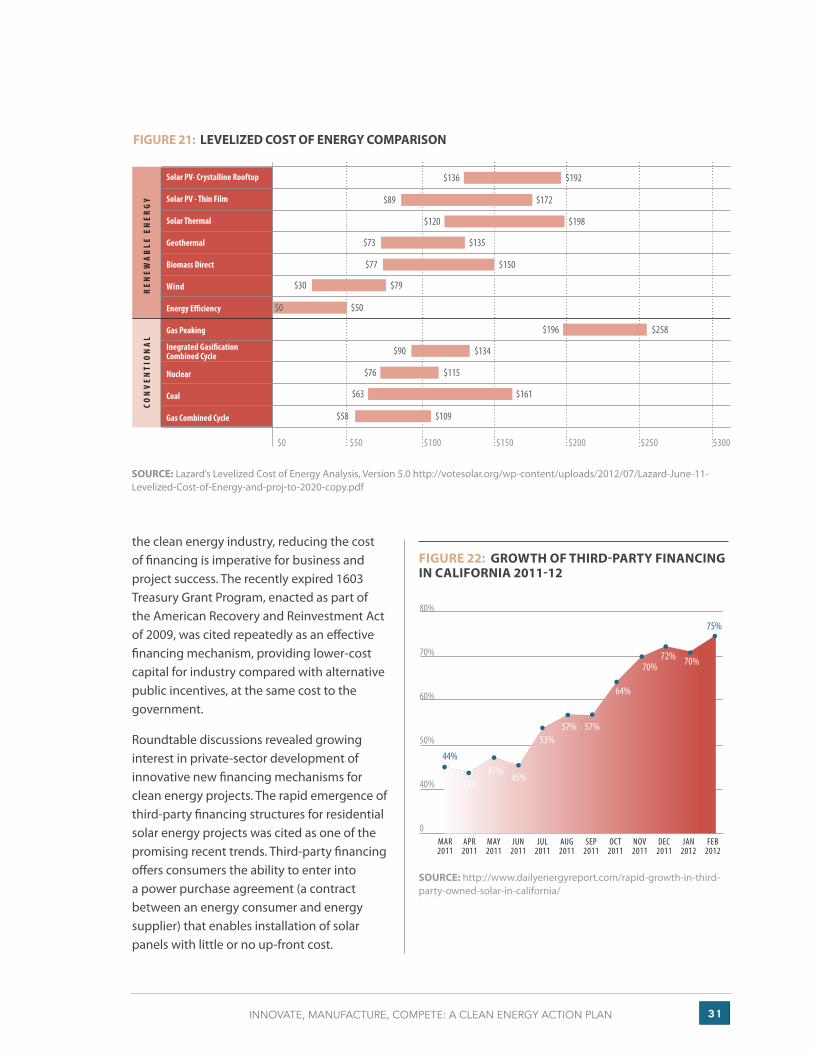
the clean energy industry, reducing the cost of financing is imperative for business and project success. The recently expired 1603 Treasury Grant Program, enacted as part of the American Recovery and Reinvestment Act of 2009, was cited repeatedly as an effective financing mechanism, providing lower-cost capital for industry compared with alternative public incentives, at the same cost to the government.
Roundtable discussions revealed growing interest in private-sector development of innovative new financing mechanisms for clean energy projects. The rapid emergence of third-party financing structures for residential solar energy projects was cited as one of the promising recent trends. Third-party financing offers consumers the ability to enter into a power purchase agreement (a contract between an energy consumer and energy supplier) that enables installation of solar panels with little or no up-front cost.
FIGURE 21: LEVELIZED COST OF ENERGY COMPARISON
SOURCE: Lazard’s Levelized Cost of Energy Analysis, Version 5.0 http://votesolar.org/wp-content/uploads/2012/07/Lazard-June-11-Levelized-Cost-of-Energy-and-proj-to-2020-copy.pdf
FIGURE 22: GROWTH OF THIRD-PARTY FINANCING IN CALIFORNIA 2011-12
SOURCE: http://www.dailyenergyreport.com/rapid-growth-in-third-party-owned-solar-in-california/
80%
70%
60%
50%
40%
0
43%47%
45%
53%57% 57%
64%
70%72% 70%
75%
MAR2011
44%
APR2011
MAY2011
JUN2011
AUG2011
SEP2011
OCT2011
NOV2011
DEC2011
JAN2012
FEB2012
JUL2011
Solar PV- Crystalline Rooftop
Biomass Direct
Inegrated Gasification Combined Cycle
Nuclear
Coal
Gas Combined Cycle
$300
Energy Efficiency
Solar Thermal
Wind
Gas Peaking
Solar PV - Thin Film
Geothermal
$250 $200 $150 $100$50$0
RE
NE
WA
BLE
EN
ER
GY
CON
VE
NT
ION
AL
$136 $192
$89 $172
$120 $198
$73 $135
$77 $150
$30 $79
$0 $50
$196 $258
$90 $134
$76 $115
$63 $161
$58 $109
INNOVATE, MANUFACTURE, COMPETE: A CLEAN ENERGY ACTION PLAN 32
More broadly, experts welcome a move in the private sector to develop financial instruments suited to raising capital through broader pools of investors. Asset-backed securities, bonds, and investment trusts are among the tools that private-sector interests are looking at to increase liquidity. In this regard, participants applauded the entry into clean energy finance of large financial institutions such as Goldman Sachs, Bank of America, Wells Fargo, Citigroup, and Warren Buffett’s MidAmerican Energy Holdings.
The emergence of new investors and investment vehicles was embraced by those who prefer that the government’s role in clean energy finance diminish over time. Private-sector participants noted the importance of the federal government in clean energy R&D and see a need for continued funding for tax credits through the end of this decade as technologies move toward cost-competitiveness. The clean energy industry also sees a role for government in promoting a level playing field by establishing fair incentives and rules to govern the energy marketplace. Finally, it was suggested that the government do more to make investors and financial institutions aware of the technical and financial potential of today’s mature and emerging clean energy technologies. The National Renewable Energy Laboratory’s Industry Growth Forum was noted as a promising example.
THE CHINA JUGGERNAUT
The dramatic and determined push by China for leadership in the clean energy marketplace is alarming to U.S. industry insiders who believe that policymakers underestimate the scale of China’s clean energy ambitions. China has established a goal of obtaining 15 percent of its energy from
C H A P T E R 3
non-fossil sources by 2020, a dramatic increase from just 2 percent in 2010.44 In less than a decade, the country has become the world’s largest wind market and may soon be the largest solar market. China recently increased its 2015 deployment targets for solar energy from 15 GW to 21 GW of cumulative installed capacity.45
Overall, there is broad consensus that China is working to become the dominant global producer of both solar and wind technologies, which account for the overwhelming majority of the world’s clean energy investment.
China’s extension of generous incentives, including low- and no-cost loans to manufacturers and the establishment of ambitious clean energy targets, have ignited investment in the country’s clean energy manufacturing sector. Whereas financing is a major concern for scaling up clean energy businesses and facilitating projects in the United States, Chinese businesses have access to tens of billions of dollars in low- or no-cost government loans. This is having a worldwide impact on manufacturers and technology prices.
According to roundtable participants, the entry of the government-backed Chinese industry in the solar and wind manufacturing has had a profound effect on the U.S. and global marketplace by driving down prices and putting immense financial pressure on American and other producers. A massive surge in Chinese exports of subsidized solar cells and modules, from $1.2 billion worth in 2010 to more than $2.8 billion worth in 2011, initiated a decrease in America’s solar trade balance. In 2010 and 2011, shipments of solar cells and modules from China to the United States increased by 303 percent and 309 percent, respectively, while the value of American exports to China of
44 KPMG. China’s 12th Five-Year Plan: Energy. April 2011. Page 2. http://www.kpmg.com/cn/en/IssuesAndInsights/ArticlesPublications/Documents/China-12th-Five-Year-Plan-Energy-201104.pdf
45 Shahan, Z. Clean Technica. China Quadruples 2015 Solar Power Target! July 2012. http://cleantechnica.com/2012/07/02/china-quadruples-2015-solar-power-target
INNOVATE, MANUFACTURE, COMPETE: A CLEAN ENERGY ACTION PLAN 33
polysilicon and solar manufacturing equipment decreased by 22 percent and 20 percent.46
Still, roundtable experts noted that the U.S.-China trade relationship is complex and that America has an interest in market access. For example, China imports large amounts of polysilicon and component parts from the United States. In addition, the Chinese marketplace is large and increasingly important for industry progress on a global basis. China’s engagement in manufacturing has resulted in the lower consumer prices that project developers now enjoy.
For all of these reasons, participants suggested that the United States walk a careful line with respect to China. Recent trade complaints have resulted in the imposition of countervailing duties on Chinese product dumping and non-compliant subsidies. China is exploring its own complaints in the clean energy sector. Given the interest of American businesses in the expanding Chinese marketplace, there was broad consensus in the Pew roundtable discussions that the United States should be careful to avoid a clean energy trade war with China.
THE ENERGY PLAYING FIELD IS NOT LEVEL
Participants expressed a keen interest in “leveling the playing field” between conventional and clean power technologies. Clean energy business leaders welcome the opportunity to compete head-to-head with incumbent technologies but do not believe that the current marketplace allows for this kind of fair competition.
46 Coalition for American Solar Manufacturing. The United States Suffered a Dramatic Reversal in Solar Trade Balance for 2011, Resulting in Significant Trade Deficits With China and the World. Page 1. http://www.americansolarmanufacturing.org/news-releases/casm-export-report-3-1-12.pdf
47 Congressional Budget Office. Federal Financial Support for the Development and Production of Fuels and Energy Technologies. March 2012. http://www.cbo.gov/sites/default/files/cbofiles/attachments/03-06-FuelsandEnergy_Brief.pdf
48 Ibid, Page 3.
First, industry participants point to the subsidies that conventional energy technologies have received for decades, including some for close to 100 years.47 Similarly, they noted that the energy sector has only four permanent tax credits, three of which are enjoyed by the oil and gas industry and one by the nuclear industry.48 In contrast, clean energy tax credits are short-term and episodic.
Second, participants noted that the health and environmental costs associated with conventional energy sources are not reflected in the marketplace. If these costs, ultimately borne by society, were included in the price of various energy options, clean energy sources would be cost-competitive immediately. Health costs, the impacts of global climate change, and the expense of securing foreign sources of oil were mentioned as external costs not reflected in energy pricing. Water was also cited as a resource that should be considered in evaluating the relative merits of energy
“If there is some barrier in your way that is slowing you down, government should help to remove it.” —Golden, CO, Innovation Roundtable

INNOVATE, MANUFACTURE, COMPETE: A CLEAN ENERGY ACTION PLAN 34
technologies, because conventional electric generating sources require large volumes of water to operate.
Third, the leaders noted the host of ways in which existing laws and regulations create barriers to clean energy development. In particular, participants mentioned rules associated with those who can generate electricity, and barriers
C H A P T E R 3
to connecting to the grid. Georgia, for example, is one of five states that prohibit anyone other than a publicly regulated utility to sell electricity.
Finally, as noted previously, there is a broad perception in the industry that China is not adhering to internationally agreed-upon rules, to the detriment of U.S. commercial interests in the clean energy sector.
K E Y O P P O R T U N I T I E S
LEADERSHIP IN CLEAN ENERGY INNOVATION
It is widely recognized that the United States has been at the forefront of clean energy R&D and remains a world leader in this area. That said, U.S. leadership in the innovation arena is being challenged, especially by emerging economies in Asia. Experts from industry and the research community agree that steps need to be taken to ensure that the United States maintains its leadership in clean energy innovation.
Participants agreed that U.S. clean energy R&D funding should be significantly increased. Experts believe that because of international competitive pressures, the United States must make robust investments to maintain a level of clean energy innovation that will allow it to stay ahead in developing products that compete on cost and
“The nation that wins isn’t the country that puts the most renewable energy on the ground in the next five to 10 years. It will be the one who does the most fundamental research so there will be better technologies.”—Atlanta, GA, Deployment Roundtable

INNOVATE, MANUFACTURE, COMPETE: A CLEAN ENERGY ACTION PLAN 35
quality in the global marketplace. To succeed, U.S. R&D efforts need to be funded on a consistent and long-term basis, they said. Clean energy research and development have suffered as a result of frequent fluctuations in funding.
Participants welcomed recent initiatives in clean energy research, including the establishment through the Department of Energy of Energy Frontier Research Centers, Energy Innovation Hubs, and the Advanced Research Projects Agency-Energy (ARPA-E).49 The Department of Energy’s SunShot Initiative, which aims to make solar energy cost-competitive without subsidies by 2020, was cited as one example of an appropriate, performance-oriented R&D initiative.
Roundtable participants suggested that government R&D efforts be aligned more effectively with U.S. commercial interests and objectives. The national laboratories and other research entities need to be accessible to businesses, and university-funded research should also take account of the needs and interests of American industry, they said. R&D efforts should address innovation needs across the technology development spectrum, from basic research through manufacturing and operations.
The clean energy sector, like the U.S. economy overall, would benefit from a strengthening of the nation’s science, technology, engineering, and math capabilities, which are the foundation of America’s economic strength and innovation infrastructure.
MANUFACTURING
Some participants in the Pew Clean Energy Roundtables suggested that innovation and
associated licensing of intellectual property are
more important than manufacturing. Most experts,
however, cited a variety of opportunities for the
United States in clean energy manufacturing,
particularly in keeping a focus on production
of next-generation technologies that harness
domestic advantages, such as highly skilled labor.
It was noted that in today’s highly competitive
environment, cost-effectiveness across the value
chain is imperative and that, as a result, domestic
manufacturers are likely to have an advantage in
U.S. markets. In turn, servicing of domestic markets
should help U.S. manufacturers become more
competitive in international markets.
49 DOE’s Energy Frontier Research Centers (EFRCs) were initiated to accelerate basic research efforts undertaken by universities, na-tional laboratories, nonprofit organizations, and for-profit firms, both singly and/or partnerships. Currently, there are 46 EFRCs.
DOE’s Energy Innovation Hubs foster multidisciplinary collaboration among universities, laboratories, and researchers to overcome technological barriers to transformative advances in energy technology. Congress has provided funding for five thematic hubs on Eefficient buildings, critical materials, modeling, fuels from sunlight, and energy storage.
Modeled after the highly successful Defense Advanced Research Projects Agency that developed the Internet, GPS, semiconductors, and other critical innovations, ARPA-E promotes applied, high-risk research focused on technologies that have great potential to benefit the market.
“There is not enough infrastructure there right now to manufacture innovation. … Until you can make that transaction, you can’t hit the price point needed to make it competitive.”—Columbus, OH, Manufacturing Roundtable

INNOVATE, MANUFACTURE, COMPETE: A CLEAN ENERGY ACTION PLAN 36
Indeed, it was widely acknowledged that domestic manufacturing must be viewed as part of the innovation process. Commercialization and manufacturing of next-generation technologies help identify opportunities for improved materials, new production processes, and other advances that not only are necessary to reduce technology prices but also can be export opportunities. In this regard, it was noted that the U.S. R&D community must work more closely with manufacturers.
DOMESTIC DEPLOYMENT
Roundtable participants consistently noted the importance of stimulating domestic demand as a means of encouraging the development and success of the U.S. clean energy sector. A domestic demand signal will encourage private investors to provide the capital needed to spur U.S. innovation and manufacturing in the sector, they said. This demand will help encourage domestic manufacturing, because producers prefer to be close to markets for a variety of reasons. In the wind industry, transportation costs and requirements necessitate proximity between manufacturing facilities and wind farms. Several participants noted that U.S. manufacturers are disadvantaged by the fact that demand has been
strongest in Europe and now in Asia. Ambitious national goals and targets for deployment of specific clean energy technologies have spurred local industry in these regions.
Enhanced deployment of clean energy technologies in the United States is expected to stimulate innovations by manufacturers and project developers as they seek to reduce costs and gain a competitive advantage. As noted previously, the experience curve associated with solar and wind suggests that increased production drives down the cost of a given technology over time.
By encouraging price declines and stimulating innovation, a domestic demand signal would allow the public sector to decrease its role in clean energy as the private sector strengthens its position.
FINDING AN APPROPRIATE ROLE FOR GOVERNMENT
Throughout the roundtable process, participants commented on the appropriate role for government in strengthening U.S. clean energy competitiveness. First, it was suggested that the federal government establish long-term national goals in the energy sector. Several participants said the goal of national policy should be to accelerate a transition in the United States toward advanced energy technologies that serve the nation’s interrelated economic, security, and environmental objectives. A transformed energy system should rely on domestically available energy resources that are cleaner, more reliable, more affordable, and more consistent with domestic job creation and prosperity.
Clean energy is compatible with these objectives and can be paired with other domestically available energy resources as part of a comprehensive approach to America’s energy needs and interests. Government’s role should be to work with industry to produce advanced energy technologies that are cost-competitive with conventional resources, participants said.
C H A P T E R 3
“These can’t be Republican or Democrat issues. We need to separate them and realize that the issue isn’t ‘green,’ but it is ‘technology.’ ”—Golden, CO, Innovation Roundtable
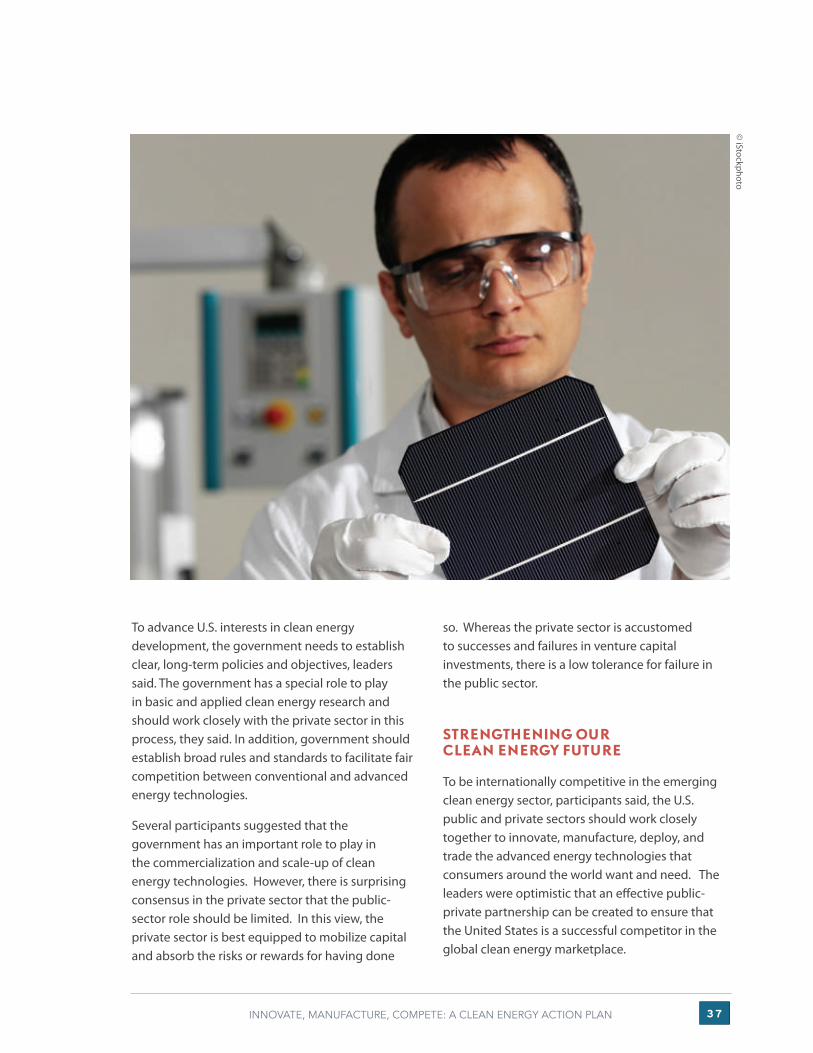
INNOVATE, MANUFACTURE, COMPETE: A CLEAN ENERGY ACTION PLAN 37
To advance U.S. interests in clean energy development, the government needs to establish clear, long-term policies and objectives, leaders said. The government has a special role to play in basic and applied clean energy research and should work closely with the private sector in this process, they said. In addition, government should establish broad rules and standards to facilitate fair competition between conventional and advanced energy technologies.
Several participants suggested that the government has an important role to play in the commercialization and scale-up of clean energy technologies. However, there is surprising consensus in the private sector that the public-sector role should be limited. In this view, the private sector is best equipped to mobilize capital and absorb the risks or rewards for having done
so. Whereas the private sector is accustomed to successes and failures in venture capital investments, there is a low tolerance for failure in the public sector.
STRENGTHENING OUR CLEAN ENERGY FUTURE
To be internationally competitive in the emerging clean energy sector, participants said, the U.S. public and private sectors should work closely together to innovate, manufacture, deploy, and trade the advanced energy technologies that consumers around the world want and need. The leaders were optimistic that an effective public-private partnership can be created to ensure that the United States is a successful competitor in the global clean energy marketplace.
© iStockphoto

INNOVATE, MANUFACTURE, COMPETE: A CLEAN ENERGY ACTION PLAN 38
CHAPTER 4
POLICIES TO STRENGTHEN U.S. CLEAN ENERGY COMPETITIVENESSTo compete effectively for a share of the growing clean energy marketplace, the United States must overcome a series of challenges and harness opportunities identified by industry leaders. If there is one overarching message from Pew’s clean energy research, it is that policy matters. We have found that where effective policies are in place, investment, innovation, and industry follow. As of 2011, 118 countries had established targets for deployment of renewable energy, 109 of which are aimed at spurring clean power generation.50 The United States is one of the countries that does not have a nationwide target, and numerous recent initiatives to encourage clean energy development have expired.
50 Renewables 2012 Global Status Report.
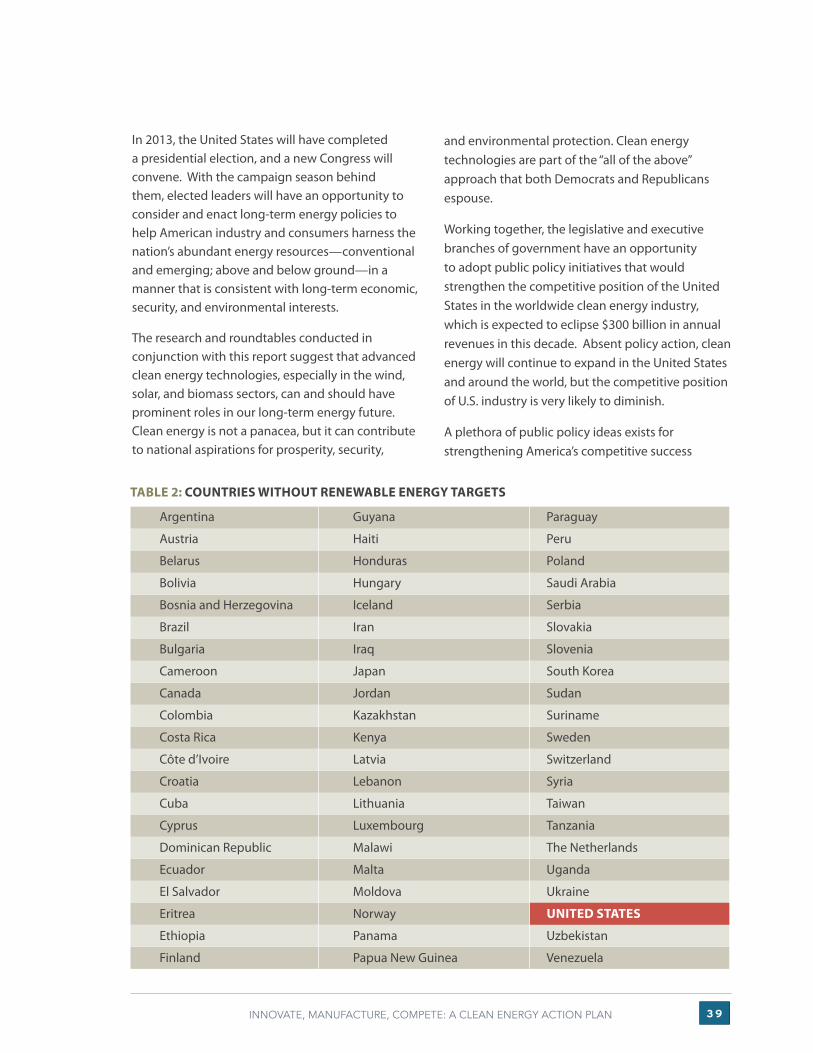
INNOVATE, MANUFACTURE, COMPETE: A CLEAN ENERGY ACTION PLAN 39
TABLE 2: COUNTRIES WITHOUT RENEWABLE ENERGY TARGETS
Argentina
Austria
Belarus
Bolivia
Bosnia and Herzegovina
Brazil
Bulgaria
Cameroon
Canada
Colombia
Costa Rica
Côte d’Ivoire
Croatia
Cuba
Cyprus
Dominican Republic
Ecuador
El Salvador
Eritrea
Ethiopia
Finland
Guyana
Haiti
Honduras
Hungary
Iceland
Iran
Iraq
Japan
Jordan
Kazakhstan
Kenya
Latvia
Lebanon
Lithuania
Luxembourg
Malawi
Malta
Moldova
Norway
Panama
Papua New Guinea
Paraguay
Peru
Poland
Saudi Arabia
Serbia
Slovakia
Slovenia
South Korea
Sudan
Suriname
Sweden
Switzerland
Syria
Taiwan
Tanzania
The Netherlands
Uganda
Ukraine
UNITED STATES
Uzbekistan
Venezuela
In 2013, the United States will have completed a presidential election, and a new Congress will convene. With the campaign season behind them, elected leaders will have an opportunity to consider and enact long-term energy policies to help American industry and consumers harness the nation’s abundant energy resources—conventional and emerging; above and below ground—in a manner that is consistent with long-term economic, security, and environmental interests.
The research and roundtables conducted in conjunction with this report suggest that advanced clean energy technologies, especially in the wind, solar, and biomass sectors, can and should have prominent roles in our long-term energy future. Clean energy is not a panacea, but it can contribute to national aspirations for prosperity, security,
and environmental protection. Clean energy technologies are part of the “all of the above” approach that both Democrats and Republicans espouse.
Working together, the legislative and executive branches of government have an opportunity to adopt public policy initiatives that would strengthen the competitive position of the United States in the worldwide clean energy industry, which is expected to eclipse $300 billion in annual revenues in this decade. Absent policy action, clean energy will continue to expand in the United States and around the world, but the competitive position of U.S. industry is very likely to diminish.
A plethora of public policy ideas exists for strengthening America’s competitive success
INNOVATE, MANUFACTURE, COMPETE: A CLEAN ENERGY ACTION PLAN 40
in the clean energy sector. But the consensus of stakeholders participating in our nationwide series of roundtables is that relatively narrow, straightforward, and mutually reinforcing steps should be pursued. There is broad consensus among these leaders that the U.S. government’s role in the sector should be light, limited, and time-bound. Federal policy has helped bring clean energy to the cusp of market acceptance, and with commercial success in sight, now would be an unpropitious time to change course. Based on the guidance gleaned from its research and roundtables, it is recommended that policymakers consider adoption of the following measures to help enhance the competitive standing of the United States in clean energy:
• Provide market certainty by setting long-term energy policy goals and objectives.
• Invest in U.S. energy innovation.
• Reinforce incentives for private investment.
• Level the playing field across the energy sector by evaluating barriers to competition.
• Support American manufacturing.
• Expand markets for U.S. goods and services
Each of these initiatives is elaborated below.
SET A LONG-TERM GOAL FOR CLEAN ENERGY DEPLOYMENT
Establishment of a clear, consistent, and long-term goal for the development of clean energy was identified by roundtable participants as the single most important step that policymakers should take to enhance U.S. industry in this sector. Enactment of a nationwide clean energy standard was by far
C H A P T E R 4
the preferred policy initiative recommended at the roundtable discussions.
Twenty-nine states and the District of Columbia have established renewable energy standards (also called renewable portfolio standards) that require utilities in these jurisdictions to ensure that a fixed percentage of electricity sold is generated from clean energy sources. In addition, some states have created standards to encourage use of various energy sources, including renewables. Initiation of these standards corresponds to increased clean energy investment, manufacturing, and jobs in the United States. As Jeff Immelt, chief executive of General Electric Co., said, “Innovation and supply chain strength gets developed where the demand is the greatest.”51
A national clean energy standard would help provide the long-term certainty needed for innovators to invent, investors to mobilize capital, and manufacturers to scale production. The resulting domestic supply chain of innovation and investment would, in turn, continue to push down prices for clean electric generating capacity. American consumers would have an expanded menu of affordable electricity options, and key clean energy technologies would gain grid parity (cost competitiveness) with conventional energy sources. Price declines should, over time, allow the federal government to gradually reduce tax credits and other incentives intended to help the industry establish itself in the marketplace. As of the end of the 112th Congress, the most prominent legislation for establishment of a clean energy standard has been the Clean Energy Standard Act of 2012 introduced by Sen. Jeff Bingaman, chairman of the Senate Energy and Natural Resources Committee. If enacted, the law would increase demand for renewable energy by 42 percent over baseline projections
51 LaMonica, M. CNET News. GE’s Immelt: U.S. Lagging in Clean Energy. March 2010. http://news.cnet.com/8301-11128_3-10462182-54.html
52 U.S. Energy Information Administration. Analysis and Projections. May 2012. http://www.eia.gov/analysis/requests/bces12

INNOVATE, MANUFACTURE, COMPETE: A CLEAN ENERGY ACTION PLAN 4 1
in 2025, according to the U.S. Energy Information Administration.52
In developing legislation to establish a national clean energy standard, policymakers will consider a variety of design options. For example, the clean energy standard can be narrowly targeted toward renewable energy sources, or more broadly construed to include energy efficiency, carbon capture and storage technologies, and cleaner-burning natural gas. The design of a national clean energy standard should also account for practical realities, such as different levels of potential in different regions. In addition, policymakers should consider adopting measures that encourage flexibility and lower costs, such as trading mechanisms and exemptions for small electric entities.
FIGURE 23: STATES WITH RENEWABLE PORTFOLIO STANDARDS AS OF JANUARY 2012
“There is not enough focus on demand. Demand would pull manufacturing and innovation.”—New York City, Financing Roundtable
Standards Goal

INNOVATE, MANUFACTURE, COMPETE: A CLEAN ENERGY ACTION PLAN 42
A long-term clean energy standard (with goals in the next 10 to 30 years) that is broadly inclusive of advanced technologies from renewables (e.g., solar, wind, and biomass) to traditional fuels should be considered by policy makers according to industry guidance. Specific targets for renewable energy sources would go a long way toward ensuring that the United States develops a robust supply chain in the rapidly emerging solar and wind sectors, making domestic products more globally competitive in key growth markets. It will also be essential to recognize regional differences, such as resource attributes and baselines, between states with and states without existing renewable portfolio standards.
INVEST IN CLEAN ENERGY INNOVATION
America’s innovative capacity in the clean energy space is widely recognized by public- and private-sector energy experts as one of the nation’s most important competitive assets. Maintaining and enhancing capacity for energy innovation is viewed as a second essential element of a clean energy competitiveness strategy.
According to experts, the United States is unlikely to win a race that involves first-generation clean energy commodities. Rather, our competitive future hinges on the ability to maintain a pipeline
C H A P T E R 4
of ideas and innovations for driving down the cost and ratcheting up the performance of advanced clean energy technologies. As in other high-tech industries, leadership in innovation is critical to long-term economic success in clean energy. Innovation leads to job creation, economic growth, and market expansion by constantly launching new and more efficient products and processes that deliver clean, affordable energy options in the U.S. and global marketplaces.
The public sector has a special role to play in clean energy innovation, because the intensity of international competition in the energy industry limits the ability of the private sector to undertake R&D. In the United States, national laboratories and university research capabilities provide the foundation for basic and applied energy research that is fundamental to developing advanced energy technologies in conventional and emerging sectors. Consistent and ample funding for federally supported research is essential to our long-term competitive position.
In recent years, expert commissions and panels have looked at the scale and scope of U.S. energy research efforts. These have included the President’s Council of Advisors on Science and Technology; the American Energy Innovation Council, composed of distinguished American business leaders; and academic entities such as
“Think about what made America great. Innovation is one of those things.”—Columbus, OH, Manufacturing Roundtable
Courtesy of Ben Vander Veen
INNOVATE, MANUFACTURE, COMPETE: A CLEAN ENERGY ACTION PLAN 43
Harvard University’s Belfer Center for Science and International Affairs. Although the findings published by each of these groups emphasize different points, the overarching conclusion is the same: The United States is substantially under-investing in energy research. The consensus view is that energy R&D. funding should be increased by two to five times over the fiscal year 2012 level of $4.36 billion.53
Expert studies and our roundtable discussions demonstrate considerable support for the current direction and structure of both basic and applied U.S. energy research and development efforts. Relatively new initiatives such as the network of Energy Frontier Research Centers for basic research and Energy Innovation Hubs for applied research are widely applauded. The Advanced Research Projects Agency-Energy garners consistent high praise for its mission orientation and effective project priorities. Experts strongly support full funding for these initiatives.
Consensus is emerging that U.S. R&D efforts should be effectively aligned with the interests and needs of industry. Providing access to federal labs and R&D assets is encouraged. In addition, there is broad agreement that public research efforts should be linked with deployment policies to help industry identify ways to reduce costs and improve processes throughout the value chain, from manufacturing and systems integration to permitting and installation.
It is also recognized that private-sector energy research is essential. Historically, the private sector has not invested in energy R&D at levels comparable with those of other industries. Private R&D spending as a share of sales in the energy industry is only 0.4 percent, compared with
20.5 percent for pharmaceuticals, 11.5 percent
for aerospace and defense, and 8 percent for
computers and electronics.54 As is the case with
other key sectors of the U.S. economy, there is
sentiment in industry and elsewhere that the R&D
tax credit should be made permanent in order
to incentivize private-sector research and help
industry overcome cost and risk barriers associated
with technology development.
Finally, the energy industry, and clean energy
in particular, relies on a highly skilled workforce
educated in science, technology, engineering,
and math (STEM). Industry participants in our
roundtables endorsed ongoing efforts to enhance
U.S. STEM capabilities and to train and retrain
workers for the high-skill, high-wage jobs that are
associated with advanced clean energy production
and deployment. Educational institutions should
also be encouraged to develop curricula and
training programs for students and workers in
energy fields.
53 American Association for the Advancement of Science. Trends in Federal R&D by Function.
54 American Energy Innovation Council. Catalyzing American Ingenuity: The Role of Government in Energy Innovation.
“We need to fix the educational challenge so that we have a growing number of science engineers with each generation.”—Golden, CO, Innovation Roundtable

INNOVATE, MANUFACTURE, COMPETE: A CLEAN ENERGY ACTION PLAN 44
REINFORCE INCENTIVES FOR PRIVATE INVESTMENT
Given the importance of energy to the economic and security interests of the United States and the quality of life of the American people, government policy has long provided incentives to help advance energy development and services. Tax incentives were initiated in the early 20th century to help stimulate the investment needed to advance oil and gas development.55 The government also has insurance and other programs that help reduce risk associated with nuclear and other technologies. More recently, successful incentives have been put in place to stimulate private investment in renewable energy sources.
Industry representatives make the case that incentives are needed in the clean energy sector until emerging technologies can compete with the incumbents. They also noted that financial incentives, in the form of tax credits or grants, can help overcome stubborn barriers to emerging technologies, such as the high premium that lenders command when financing new energy technologies, or the failure of the marketplace to account for external costs of conventional energy options.
Repeatedly, roundtable participants identified access to low-cost capital as one of the most significant roadblocks to progress in the U.S. clean energy sector. Participants suggested that the federal government use incentives to help leverage private investment in the energy marketplace so that technologies can scale up, costs can come down, and private initiatives can achieve commercial viability. To this end, policymakers are urged to consider long-term, time-limited extension of key clean energy tax credits.
The federal government has offered production and investment tax credits for qualified clean energy technologies in recent years. These credits have been used primarily since the mid-2000s, when
C H A P T E R 4
clean energy deployment reached commercially relevant levels. And they have worked, stimulating investment, deployment, and manufacturing and helping to drive down the cost of technology. But unlike some tax incentives in other parts of the energy industry, the production and investment tax credits are clouded in uncertainty on an almost annual basis, creating a boom-and-bust investment environment that inhibits consistent progress. The production tax credit for wind is to expire at the end of 2013. The uncertainty surrounding its renewal at the end of the year had deleterious effects on the industry.
To preserve the competitive viability of the U.S. clean energy sector, industry leaders urge policymakers to provide a long-term renewal of the production and investment tax credits. Several participants called for use of “shallow incentives” for technologies that are close to cost competitiveness but need help getting over the line. Participants in the roundtable process also noted that the tax credits cannot and should not go on forever.
With these considerations in mind, policy makers should consider a multiyear but time-limited extension of the production and investment tax credits for clean energy sources. In light of industry statements that cost-competitive clean generating capacity is possible in this decade, an extension through 2020 would help foster cost competitiveness, provide certainty, and give industry the necessary lead time to prepare for a post-subsidy world.
“Leveraging private-sector investment will drive innovation.”—Golden, CO, Innovation Roundtable
55 Congressional Budget Office. Federal Support for the Development and Production of Fuels and Energy Technologies. March 2012. http://www.cbo.gov/sites/default/files/cbofiles/attachments/03-06-FuelsandEnergy_Brief.pdf
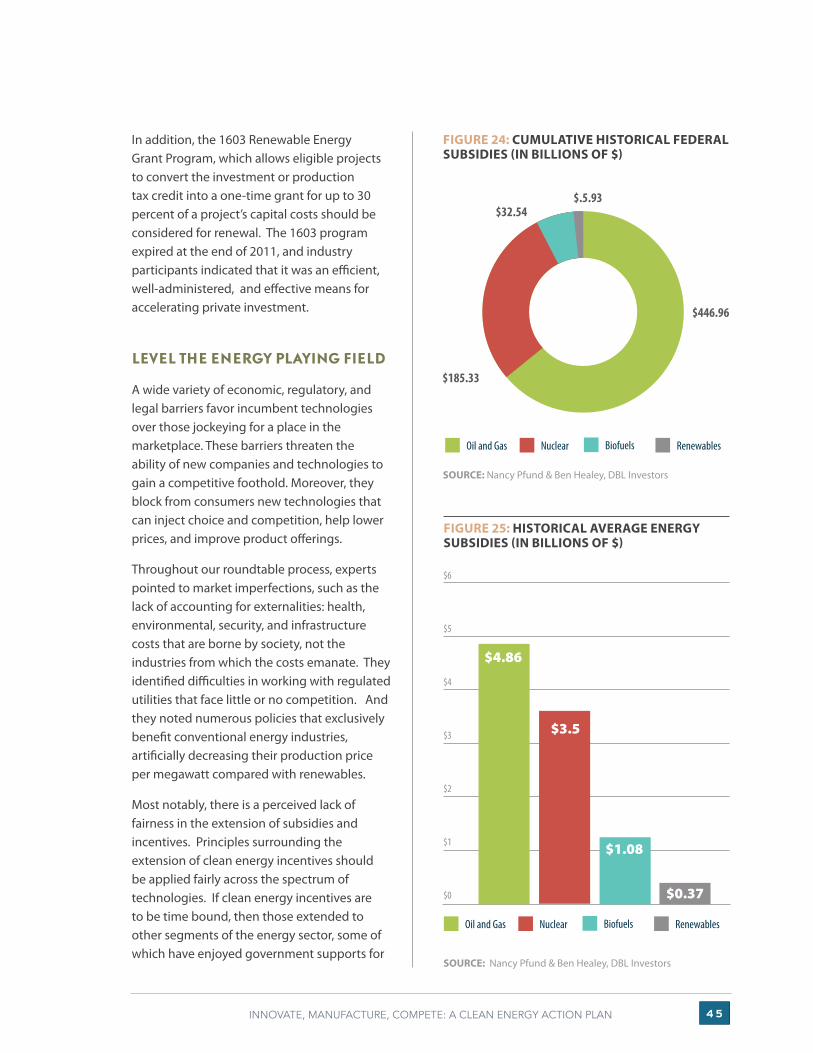
INNOVATE, MANUFACTURE, COMPETE: A CLEAN ENERGY ACTION PLAN 45
In addition, the 1603 Renewable Energy Grant Program, which allows eligible projects to convert the investment or production tax credit into a one-time grant for up to 30 percent of a project’s capital costs should be considered for renewal. The 1603 program expired at the end of 2011, and industry participants indicated that it was an efficient, well-administered, and effective means for accelerating private investment.
LEVEL THE ENERGY PLAYING FIELD
A wide variety of economic, regulatory, and legal barriers favor incumbent technologies over those jockeying for a place in the marketplace. These barriers threaten the ability of new companies and technologies to gain a competitive foothold. Moreover, they block from consumers new technologies that can inject choice and competition, help lower prices, and improve product offerings.
Throughout our roundtable process, experts pointed to market imperfections, such as the lack of accounting for externalities: health, environmental, security, and infrastructure costs that are borne by society, not the industries from which the costs emanate. They identified difficulties in working with regulated utilities that face little or no competition. And they noted numerous policies that exclusively benefit conventional energy industries, artificially decreasing their production price per megawatt compared with renewables.
Most notably, there is a perceived lack of fairness in the extension of subsidies and incentives. Principles surrounding the extension of clean energy incentives should be applied fairly across the spectrum of technologies. If clean energy incentives are to be time bound, then those extended to other segments of the energy sector, some of which have enjoyed government supports for
FIGURE 24: CUMULATIVE HISTORICAL FEDERAL SUBSIDIES (IN BILLIONS OF $)
SOURCE: Nancy Pfund & Ben Healey, DBL Investors
FIGURE 25: HISTORICAL AVERAGE ENERGY SUBSIDIES (IN BILLIONS OF $)
SOURCE: Nancy Pfund & Ben Healey, DBL Investors
$6
$5
$4
$3
$2
$1
$0
$4.86
$3.5
$1.08
$0.37
Oil and Gas Nuclear Biofuels Renewables
$446.96
$185.33
$32.54$.5.93
Oil and Gas Nuclear Biofuels Renewables

INNOVATE, MANUFACTURE, COMPETE: A CLEAN ENERGY ACTION PLAN 46
almost 100 years, should be evaluated in the same manner. These incentives may have been sensible as a means of stimulating development of nascent industries, but they cannot be justified in perpetuity on economic or budgetary grounds. Of the energy tax expenditures in the U.S. tax code, only four are permanent: three related to oil and gas production and one related to nuclear energy.56 None of them relates or applies to clean energy—a clear competitive disadvantage to the sector.
C H A P T E R 4
Roundtable participants indicated throughout the process that the federal government should play a limited role in clean energy finance. In fact, experts believe that if there is a demand for clean energy goods and services, the private sector will be able to mobilize the capital needed to scale up the most promising technologies for fulfilling that demand. The role of the federal government is to break down barriers to competition and allow the clean energy industry to flourish.
If barriers are eliminated, broader pools of private capital can be leveraged through innovative financing mechanisms that help lower the cost of capital. For example, master limited partnerships (MLPs) provide incentives for investors to help finance construction of domestic energy infrastructure. Investors can access these opportunities through equity markets and qualify for certain tax advantages. MLPs mobilize large reservoirs of low-cost capital for oil and gas interests, but the law does not allow clean energy businesses access to these sources of finance.
56 Ibid.
“A strong business does not rely on subsidies for the long haul.”—Columbus, OH, Manufacturing Roundtable
© Thom
as Woodruff | D
reamstim
e.com
Wind turbines in hay field in Kansas

INNOVATE, MANUFACTURE, COMPETE: A CLEAN ENERGY ACTION PLAN 47
In the financing arena, other advantageous legal arrangements can be opened up to clean energy interests. At several of our roundtables, participants expressed interest in the use of real estate investment trusts (REITS) to finance renewable energy projects. REITs are corporate entities that receive certain tax benefits in exchange for investing in income-producing real estate. These vehicles allow small investors to participate and mobilize large amounts of capital in real estate development. By qualifying renewable energy infrastructure as an eligible source of REIT financing, any investor would be able to purchase shares in a portfolio of renewable energy projects.
SUPPORT U.S. CLEAN ENERGY MANUFACTURING
The U.S. manufacturing sector employs roughly 12 million Americans, or 9 percent of the nation’s workforce,57 and accounted for 12.2 percent of the GDP in 2011.58 The manufacturing sector serves
American interests by creating well-paying middle-class jobs, spurring innovation and productivity enhancements, and turning out goods and services that can be used at home or exported abroad to reduce the trade deficit.
The numerous international challenges pressuring the U.S. manufacturing sector are well-known, from low-cost labor to intellectual property infringement abroad. Still, the United States has a number of advantages, including a skilled workforce, excellent transportation, thriving innovation capacity, and an enormous marketplace.
Clean electric generation technologies represent an emerging opportunity for America’s high-tech manufacturers. Industry and economic development leaders are pursuing a range of initiatives to spur manufacturing in the clean energy sector, such as enacting renewable portfolio standards that stimulate demand; helping innovators and entrepreneurs develop businesses; and creating clusters of scientists, investors, and business leaders to move ideas out of laboratories and into enterprises that are supported and nurtured to success.
The federal government can also play a role in fostering renewable energy manufacturing at this critical time in the emergence of the U.S. and global marketplace. In recent years, a primary effort to stimulate clean energy manufacturing was the advanced energy manufacturing tax credit, also referred to as Section 48C of the Internal Revenue Code, authorized in 2009 as part of the American Recovery and Reinvestment Act. In an attempt to supply clean energy projects with components made in the United States, the Section 48C program provided a 30 percent credit for investments in clean energy domestic manufacturing facilities capable of producing renewable energy equipment, energy storage systems, carbon dioxide
57 National Association of Manufacturers. Facts About Manufacturing. http://www.nam.org/Statistics-And-Data/Facts-About-Manufac-turing/Landing.aspx
58 U.S. Department of Commerce. Bureau of Economic Analysis. April 2012. http://www.bea.gov/newsreleases/industry/gdpindustry/gdpindnewsrelease.htm
“We need recognition nationally that we have health costs and environmental costs that aren’t recognized on the bottom line when it comes to an energy future.”—Golden, CO, Innovation Roundtable
INNOVATE, MANUFACTURE, COMPETE: A CLEAN ENERGY ACTION PLAN 48
C H A P T E R 4
capture and sequestration equipment, electric grids, energy conservation technologies, and other clean energy products. Tax credits totaling $2.3 billion were granted to domestic projects for the 48C program, leveraging an additional $5.4 billion in private-sector investment.59 Experts also estimate that the tax credit directly created 17,000 jobs and that associated private investment supported roughly 41,000 additional jobs.60 More than 180 manufacturing projects were helped in 43 states. Applications for the 48C credit far exceeded the program budget, which was exhausted in 2010.
To help bolster development of U.S. clean energy manufacturing capabilities, the Obama administration has called on Congress to fund an additional $5 billion for the 48C program as part of the Security in Energy and Manufacturing Act of 2011.
EXPAND MARKETS FOR U.S. CLEAN ENERGY GOODS AND SERVICES
Long-term forecasts for electricity growth and clean energy markets demonstrate that the vast majority of future investment will occur in emerging economies and developing nations.
The U.S. Energy Information Administration estimates that global energy use will grow by 53 percent from 2008 to 2035,61 and that 85 percent of that growth will occur in emerging and developing economies. In other words, almost $6 trillion worth
of clean energy investment is expected to occur in the next 25 years.62
This investment is already shifting from the industrialized economies of the West to the emerging economies in Asia.63 In the coming decade, investment and deployment are expected to grow in parts of Africa, Asia, and Latin America by 10 to 20 percent annually.64
Markets for clean energy goods and services will grow as nations work to close the gap between the energy “haves” and “have-nots.” An estimated 1.5 billion people around the world currently lack access to modern electric services.65 Billions more have only limited, intermittent electric service or rely on wood, charcoal, and diesel generators for heat and cooking. Collecting or purchasing this fuel is burdensome to the energy poor, and extending electric infrastructure is an enormously expensive proposition. Clean energy offers the opportunity for communities to leap past the era of electric wires in the same way that cellphones have allowed the same communities to bypass the era of hard-wired phones. In addition, some countries see opportunities in switching to renewable energy. Saudi Arabia, for example, plans to invest more than $100 billion in solar energy as a means of obtaining 30 percent of its electric needs through renewable energy over the next two decades.66
In recent years, the United States has enhanced efforts to support renewable energy exports.
59 Blue Green Alliance. Advanced Energy Project Credit (Section 48C). December 2011. Page 1. http://www.bluegreenalliance.org/news/publications/document/48C-Fact-Sheet.pdf
60 The White House. Office of the Press Secretary. Fact Sheet: $2.3 Billion in New Clean Energy Manufacturing Tax Credits. January 2010. http://www.whitehouse.gov/the-press-office/fact-sheet-23-billion-new-clean-energy-manufacturing-tax-credits
61 U.S. Energy Information Administration. International Energy Outlook 2011. September 2011. http://www.eia.gov/forecasts/ieo/pdf/0484(2011).pdf
62 U.S. Department of State. Global Economic Statecraft Day: Energy and Economics. http://blogs.state.gov/index.php/site/entry/eco-nomic_statecraft_day
63 Pew Charitable Trusts. Who’s Winning the Clean Energy Race? 2011 Edition. http://www.pewenvironment.org/uploadedFiles/PEG/Publications/Report/FINAL_forweb_WhoIsWinningTheCleanEnergyRace-REPORT-2012.pdf
64 Ibid. Page 2
65 United Nations Sustainable Energy for All Initiative. Fact Sheet. 2012. http://www.sustainableenergyforall.org/
66 Mahdi, W., and M. Roca. Bloomberg. Saudi Arabia Plans $109 Billion Boost for Solar Power. March 2012. http://www.bloomberg.com/news/2012-05-10/saudi-arabia-plans-109-billion-boost-for-solar-power.html

INNOVATE, MANUFACTURE, COMPETE: A CLEAN ENERGY ACTION PLAN 49
According to the Department of Commerce, renewable energy exports increased from $1.3 billion in 2007 to $2.1 billion in 2009.67 During that period, wind energy exports increased by 29 percent annually, and biomass equipment and feedstock trade increased by 54 percent.68
To help coordinate and expand U.S. clean energy efforts as part of the National Export Initiative, the Trade Promotion Coordinating Committee, and an interagency working group chaired by the Secretary of Commerce, has created the Renewable Energy and Energy Efficiency Export Initiative (RE4I). This initiative seeks to help mobilize financing that supports exports by U.S. companies; open international markets to U.S. clean energy goods and services; and promote trade opportunities overseas. Twelve agencies participate in the RE4I initiative.
In recent years, some of the key export assistance arms of the U.S. government have stepped up efforts in the clean energy sector. The Export-Import Bank has dramatically increased its renewable energy portfolio, which doubled to $721 million between fiscal 2010 and 2011.69 Likewise, the Trade and Development Agency has doubled its programmatic focus in the renewable energy arena.70 And the International Trade Administration at the Department of Commerce has established a Renewable Energy and Energy Efficiency Advisory Committee to help bring private-sector ideas into the federal government’s export initiatives in the sector.
In view of the significant growth and potential of clean energy markets and emerging international trade issues, the U.S. trade representative has
67 U.S. Department of Commerce. Renewable Energy and Energy Efficiency Export Initiative. http://web.ita.doc.gov/ete/eteinfo.nsf/0f8e6ea2534d7621852568d30003ba76/5e6009dd66c3fe2d8525781100575d46/$FILE/Renewable%20Energy%20and%20Energy%20Efficiency%20Export%20Initiative.pdf
68 Ibid. Pages 17-19.
69 O’Connor, Craig. Export-Import Bank. Financing Renewable Energy: The Role of Ex-Im Bank. http://www.tusiad.org/__rsc/shared/file/Exim-Bank-ppt.pdf
70 Wood, Elisa. RenewableEnergyWorld.com. U.S. Plans for Green Exports. February 2011. http://www.renewableenergyworld.com/rea/news/article/2011/02/policy-and-markets-exporting-us-renewables
asked the International Trade Commission to do a thorough review of the renewable energy services market. The last ITC review of renewable energy and trade was conducted in 2004-05, when global investment was a fraction of what it is today. The ITC assessment should give U.S. government agencies and policymakers useful guidance on the scale of clean energy markets, key sectors for U.S. priority, and top export markets for U.S. industry.
FIGURE 26: U.S. RENEWABLE ENERGY EXPORTS 2007-09 (IN BILLIONS OF $)
SOURCE: International Trade Commission
2.5
2
1.5
1
0
2007
2008
2009
INNOVATE, MANUFACTURE, COMPETE: A CLEAN ENERGY ACTION PLAN 50
CONCLUSION
After several decades in laboratories and niche applications, clean energy technologies are primed for accelerated and widespread expansion in the world’s power sector. In the United States and around the world, solar, wind, and other renewable energy sources will represent a significant share of the new generating capacity deployed in the coming years and decades.
The advent of the emerging clean energy economy is driven by economic, environmental, and security imperatives. Almost $2 trillion is projected to be invested worldwide from 2012 to 2018, and companies and countries are elbowing for market share in an industry with a projected compound annual growth rate of 8 percent. The need to reduce pollution at the local and global level will also help to accelerate demand for energy technologies that can power economic growth without harming human health or exacerbating global warming. In addition, wind, solar, and other renewable resources bolster national interests by enhancing energy independence.
The future of clean energy is bright, but the forecast for the U.S. competitive position in this fast-growing marketplace is less certain. On a variety of key measures—from innovation to manufacturing to deployment—the United States is struggling to maintain a position of leadership in the global economic and technological race.
Discussions with industry and other experts across the country reveal tremendous frustration about
the inability of American interests to capitalize more fully on the emerging clean energy moment. Having invented and brought to market many of the prevailing technologies, U.S. scientists and entrepreneurs now are buffeted by disparate national and international forces.
The consensus is that a significant international competition has opened up. Countries in Asia and Europe are placing a priority on development and deployment of clean energy technologies and competitive enterprises. This means a robust international trade in clean energy goods and services, with expanding markets opening up opportunities for a variety of U.S. interests. But it also means that the United States must increase its pace to compete in the international race for economic leadership.
The U.S. and global recessions have created both constraints and opportunities for expansion of the clean energy sector. Renewable energy was a priority in a variety of stimulus and recovery programs launched over the past five years, including that in the United States. But those
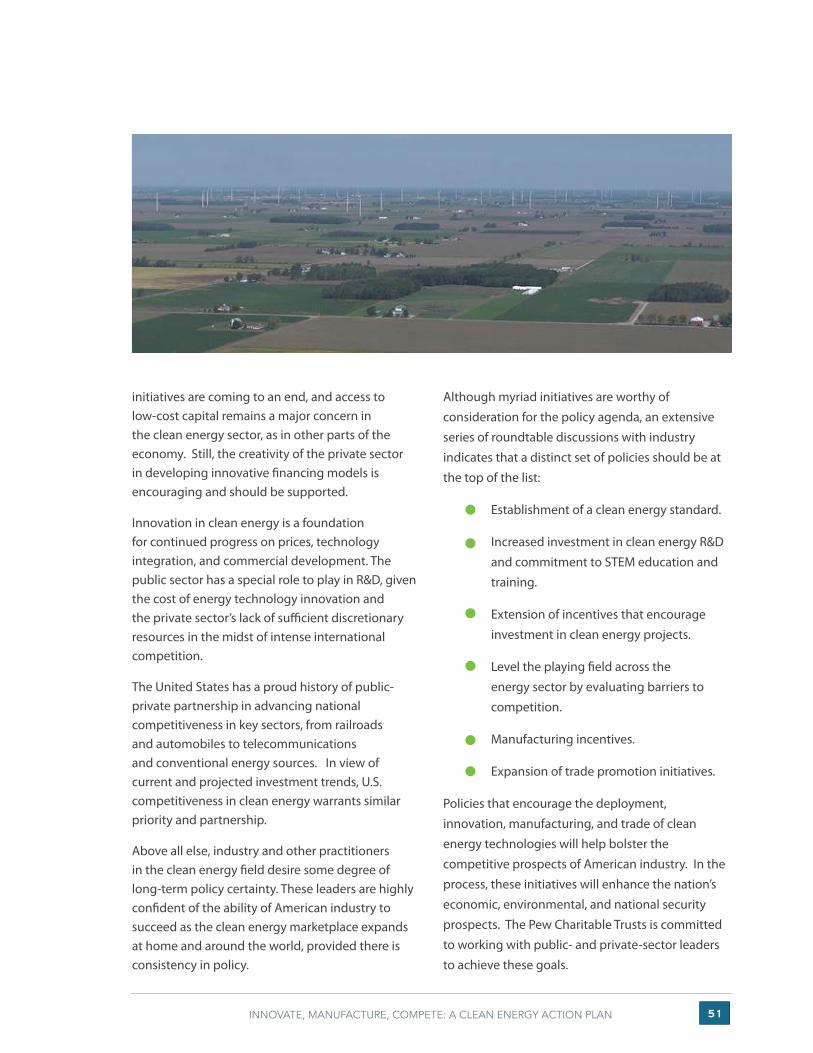
INNOVATE, MANUFACTURE, COMPETE: A CLEAN ENERGY ACTION PLAN 5 1
initiatives are coming to an end, and access to low-cost capital remains a major concern in the clean energy sector, as in other parts of the economy. Still, the creativity of the private sector in developing innovative financing models is encouraging and should be supported.
Innovation in clean energy is a foundation for continued progress on prices, technology integration, and commercial development. The public sector has a special role to play in R&D, given the cost of energy technology innovation and the private sector’s lack of sufficient discretionary resources in the midst of intense international competition.
The United States has a proud history of public-private partnership in advancing national competitiveness in key sectors, from railroads and automobiles to telecommunications and conventional energy sources. In view of current and projected investment trends, U.S. competitiveness in clean energy warrants similar priority and partnership.
Above all else, industry and other practitioners in the clean energy field desire some degree of long-term policy certainty. These leaders are highly confident of the ability of American industry to succeed as the clean energy marketplace expands at home and around the world, provided there is consistency in policy.
Although myriad initiatives are worthy of
consideration for the policy agenda, an extensive
series of roundtable discussions with industry
indicates that a distinct set of policies should be at
the top of the list:
• Establishment of a clean energy standard.
• Increased investment in clean energy R&D
and commitment to STEM education and
training.
• Extension of incentives that encourage
investment in clean energy projects.
• Level the playing field across the
energy sector by evaluating barriers to
competition.
• Manufacturing incentives.
• Expansion of trade promotion initiatives.
Policies that encourage the deployment,
innovation, manufacturing, and trade of clean
energy technologies will help bolster the
competitive prospects of American industry. In the
process, these initiatives will enhance the nation’s
economic, environmental, and national security
prospects. The Pew Charitable Trusts is committed
to working with public- and private-sector leaders
to achieve these goals.
INNOVATE, MANUFACTURE, COMPETE: A CLEAN ENERGY ACTION PLAN 52
APPENDIX I: OVERVIEW OF METHODOLOGY, DEFINITIONS, AND SOURCES
Pike Research developed two distinct data sets for this project: 1) historical data on installed capacity and associated revenue in the 2009-11 period; and 2) forecasts of installed capacity and associated revenue in the 2012-18 period. To compile these data, Pike Research’s industry analysts utilized primary research (based on interviews and discussion with industry leaders) and secondary research conducted by the firm’s analysts.
HISTORICAL DATA (2009-11)
This information was derived from public sources including industry associations, national reporting and statistical agencies, other public data sets and reports, as well as Pike Research’s own project databases. It is common for official installation totals to change because of revisions and definitional differences. The data presented are up to date as of August 2012.
FORECAST DATA (2012-18)
Forecasts are based on a combination of national renewable energy action plans, utility renewable energy targets, technology cost trends, Pike Research’s project databases, company interviews, and the evaluation of the impact of increasing or reducing key financial incentives in leading countries. The forecasts represent the most likely scenario to occur in each country-level market and globally.
INNOVATE, MANUFACTURE, COMPETE: A CLEAN ENERGY ACTION PLAN 53
COUNTRY SELECTION
In addition to providing annual installed capacity and annual installation revenue totals for the United States and world markets (e.g., the sum of all countries), Pike Research provided the same data for three other key countries. These countries were selected on the basis of their relevance to each industry from a deployment perspective during the forecast period but are not always the countries with the most installed capacity each year.
DEFINITION OF ANNUAL INSTALLED CAPACITY
Annual installed capacity is defined as the nameplate capacity of installations completed during the given year, expressed in gigawatts (GW).
DEFINITION OF REVENUE FROM INSTALLATIONS
Revenue from installations is defined as the sum of system hardware, installation, and all other soft costs during the given year—commonly referred to as an industry’s market value. Revenue data for fuel cells are not included. All data are expressed in billions.
TECHNOLOGY DEFINITIONS AND NOTES
Data were compiled for technologies in the following manner:
• BIOMASS ELECTRIC POWER: Includes electricity-generating power systems that use biomass feedstocks. In biomass power systems, electricity is produced from biomass, generally via combustion of the feedstock or a derived product (e.g., biogas), which, in turn, drives power-generating turbines. Data were compiled for biopower, waste-to-energy, and biogas. Historical data for each were collected
from a number of sources, including the Organisation for Economic Co-operation and Development, the International Energy Agency, the U.S. Energy Information Administration, the BP Statistical Review, and the Renewable Energy Policy Network for the 21st Century (REN21).
• CONCENTRATING SOLAR POWER
(CSP): Includes concentrating solar thermal electric-generating stations (CSTE) that direct solar energy to a central point and use this concentrated energy to heat a fluid to drive a steam turbine generator and produce electricity. This is different from concentrating solar PV (CPV), which is included in the solar PV category. In some cases, CSTE-generation systems are connected to fossil fuel plants. In these cases, only the solar thermal electric capacity is included in the total. (Note: In practice, the term CSP is used interchangeably with CSTE. CSTE is more accurate, but CSP is more widely recognized by the public.) Historical and forecast CSP data come from the International Renewable Energy Association (IRENA), CSP World, country-level National Renewable Energy Action Plans (NREAPs), REN21, the National Renewable Energy Laboratory, and Pike Research evaluation of projects in the pipeline.
• SOLAR PV: Includes small (battery-based) and grid-connected solar PV systems installed globally. Historical and forecast data are based on information from the Solar Energy Industries Association, the European Photovoltaic Industry Association, the German Statistical Agency, the Italian GSE Rapporto Statistico 2011, and Pike Research evaluation of incentive programs, economic indicators, and national and state-level solar PV targets.
INNOVATE, MANUFACTURE, COMPETE: A CLEAN ENERGY ACTION PLAN 54
• GEOTHERMAL ELECTRIC POWER: Includes grid-connected geothermal power plants, not geothermal heating systems. Historical data were collected from a combination of data compiled by the International Geothermal Association and the Geothermal Energy Association, cross-referenced with a Pike Research-built global database of current projects online. Capacity figures were checked against REN21-published data.
• MARINE AND HYDROKINETIC POWER: This category includes wave power, tidal power, ocean current power, ocean thermal electric power, and river-based hydrokinetic power. It does not include small hydroelectric systems. Historical and forecast data were based on information from the Crown Estate, Pike Research interviews with MHK companies, HydroWorld, and the U.S. Department of Energy Marine and Hydrokinetic Technology Database. The revenue for historical installations comes from public documents, while forecasts are estimated with the assumption that projects installed on a scale of 100-plus megawatts (MW) will be as low as one-tenth the price per watt of 1 MW demonstration projects, per published research on the topic and Pike Research interviews.
• OFFSHORE WIND: Includes all offshore wind installations in marine environments, including lakes. Historical data were collected from a variety of sources, with the primary contributors being the European Wind Energy Association, the American Wind Energy Association, and
the Deutsche Bank Group analysis of the Chinese market. Figures from these and other organizations were cross-referenced against Pike Research global market forecast generated originally in 2011.
• ONSHORE WIND: Includes small (battery-based) and large grid-connected wind installations. A large percentage of utility-scale wind systems in China are not yet grid-connected, but this capacity will still be included in the total. Historical data come from the American Wind Energy Association and the Global Wind Energy Council. Forecasts are based on Pike Research’s evaluation of National Renewable Energy Action Plans in Europe, the Chinese government’s stated goals for wind energy, and availability of incentives in key countries going forward.
APPENDIX I: OVERVIEW OF METHODOLOGY, DEFINITIONS, AND SOURCES

APPENDIX I: OVERVIEW OF METHODOLOGY, DEFINITIONS, AND SOURCES

Philadelphia, Pa. Tel. 215-575-2000
www.PewTrusts.org
Washington, D.C.Tel. 202-552-2000


