224
INNOVATING THE FUTURE CapitaLand Mall Trust Annual Report 2016

INNOVATING THE FUTURE
CapitaLand Mall Trust
Annual Report 2016
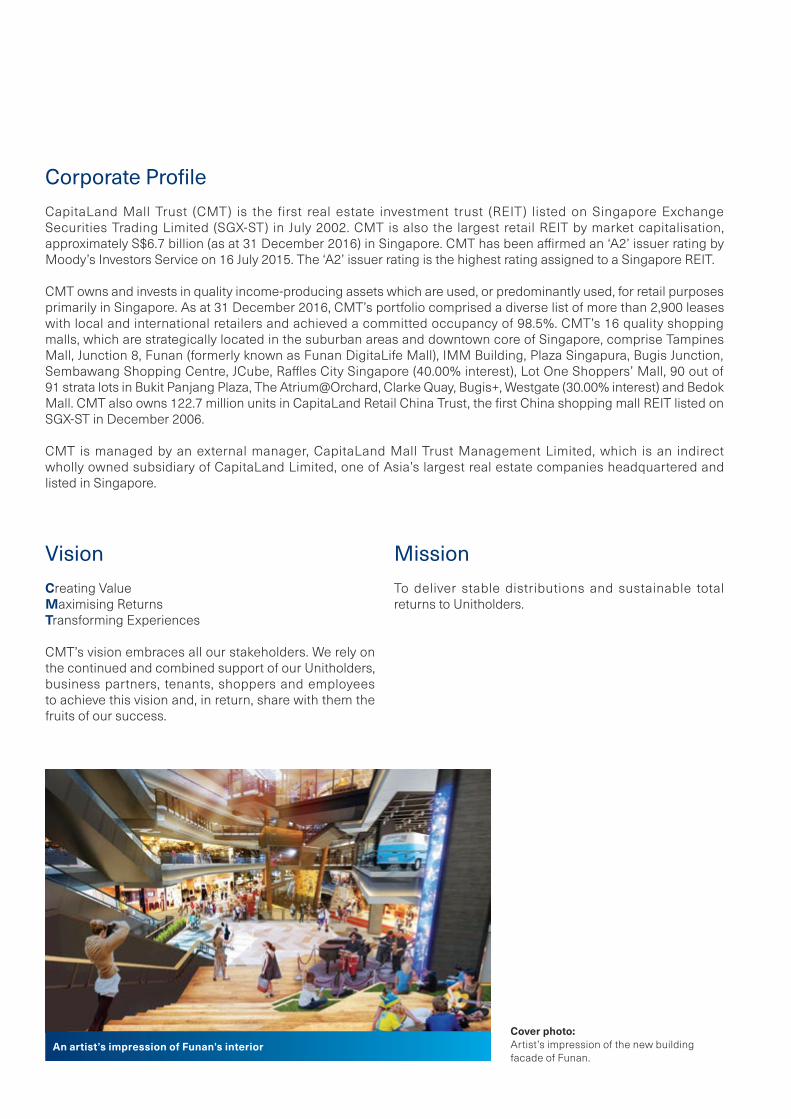
Corporate ProfileCapitaLand Mall Trust (CMT) is the first real estate investment trust (REIT) listed on Singapore Exchange Securities Trading Limited (SGX-ST) in July 2002. CMT is also the largest retail REIT by market capitalisation, approximately S$6.7 billion (as at 31 December 2016) in Singapore. CMT has been affirmed an ‘A2’ issuer rating by Moody’s Investors Service on 16 July 2015. The ‘A2’ issuer rating is the highest rating assigned to a Singapore REIT.
CMT owns and invests in quality income-producing assets which are used, or predominantly used, for retail purposes primarily in Singapore. As at 31 December 2016, CMT’s portfolio comprised a diverse list of more than 2,900 leases with local and international retailers and achieved a committed occupancy of 98.5%. CMT’s 16 quality shopping malls, which are strategically located in the suburban areas and downtown core of Singapore, comprise Tampines Mall, Junction 8, Funan (formerly known as Funan DigitaLife Mall), IMM Building, Plaza Singapura, Bugis Junction, Sembawang Shopping Centre, JCube, Raffles City Singapore (40.00% interest), Lot One Shoppers’ Mall, 90 out of 91 strata lots in Bukit Panjang Plaza, The Atrium@Orchard, Clarke Quay, Bugis+, Westgate (30.00% interest) and Bedok Mall. CMT also owns 122.7 million units in CapitaLand Retail China Trust, the first China shopping mall REIT listed on SGX-ST in December 2006.
CMT is managed by an external manager, CapitaLand Mall Trust Management Limited, which is an indirect wholly owned subsidiary of CapitaLand Limited, one of Asia’s largest real estate companies headquartered and listed in Singapore.
VisionCreating ValueMaximising ReturnsTransforming Experiences
CMT’s vision embraces all our stakeholders. We rely on the continued and combined support of our Unitholders, business partners, tenants, shoppers and employees to achieve this vision and, in return, share with them the fruits of our success.
MissionTo deliver stable distributions and sustainable total returns to Unitholders.
An artist’s impression of Funan’s interiorCover photo:Artist’s impression of the new building facade of Funan.

INNOVATING THE FUTURE
CapitaLand Mall Trust is pushing the boundaries and exploring ways to future-enable our malls and retail services. In response to consumers’ growing desire to engage in more enriching, interactive and innovative experiences, we are reinventing the retail landscape by harnessing technological innovations.
We will continue to work with our business partners to pioneer new possibilities for the future of retail, creating quality and unique experiences that serve the needs of this and future generations of shoppers.
Corporate Governance & Transparency
18 Board of Directors24 Trust Management Team25 Property Management Team26 Corporate Governance48 Enterprise Risk Management51 Investor & Media Relations54 Unit Price Performance
Overview
02 Financial Highlights04 2016 Highlights05 Message to Unitholders11 Trust Structure11 Organisation Structure12 Year in Brief 201614 Growth Strategies16 Property Portfolio
Portfolio Details
114 Portfolio Summary116 Portfolio Details132 CapitaLand Retail China Trust
Sustainability
58 Sustainability Management
Business Review
78 Operations Review88 Financial Review92 Capital Management96 Independent Retail Market Overview103 Singapore REIT Sector105 Marketing & Promotions110 Our Tenants112 Our Shoppers
Financials & Additional Information
133 Financial Statements215 Additional Information217 Statistics of Unitholdings220 Mall DirectoryIBC Corporate Information
Contents

Financial Highlights
661.6
573.2
316.99,159.7 9,220.0
9,858.310,355.7 10,326.7
445.2
380.7
729.2
637.6
356.2
502.7
438.7
774.2
658.9
375.3
530.1787.2
669.0
392.0
552.3807.5
689.7
394.3
566.4
479.7
2013
2013 2013
20132014
2014 2014
20142015
2015 2015
20152012
2012 2012
20122016
2016 2016
2016
CapitaLand Mall Trust
Annual Report 201602
1 With the adoption of Financial Reporting Standards 111 Joint Arrangements from 1 January 2014, CMT’s 40.00% interest in RCS Trust and 30.00% interest in Infinity Mall Trust and Infinity Office Trust (collectively, the Infinity Trusts) are accounted for as investments in joint ventures using equity method. For comparison purpose, 2012 and 2013 have been restated to exclude CMT’s 40.00% interest in RCS Trust and CMT’s 30.00% interest in Infinity Trusts.
2 On 1 October 2015, CMT acquired all the units in Brilliance Mall Trust (BMT) which holds Bedok Mall. Upon acquisition, BMT became a subsidiary. On 15 December 2015, the sale of Rivervale Mall was completed. On 30 August 2016, three private trusts namely Victory Office 1 Trust, Victory Office 2 Trust and Victory SR Trust (collectively, the Victory Trusts, each wholly owned by CMT) were constituted in relation to the redevelopment of Funan. CMT, together with the Victory Trusts jointly own and undertake to redevelop Funan which comprises a retail component (held through CMT), two office towers and serviced residences.
3 Joint ventures refer to CMT’s 40.00% interest in RCS Trust and CMT’s 30.00% interest in Infinity Trusts. Westgate, which is owned by Infinity Mall Trust, commenced operations on 2 December 2013.
448.4 466.2
CMT Group2
Joint ventures3 (For information only) CMT Group2
Joint ventures3 (For information only)
88.4 64.564.0
81.7118.2 86.1 86.7
Gross Revenue1 (S$ million)
Distributable Income(S$ million)
Net Property Income1
(S$ million)
Total Assets1 (S$ million)
115.391.6
117.8

03Overview
Business Review
Corporate Governance & Transparency
Portfolio Details
Sustainability
Financials & Additional Information
1 From 1 January 2014, as a result of Financial Reporting Standards 111 Joint Arrangements, CMT and its subsidiaries (CMT Group) has changed its accounting policy for its interests in joint arrangements and the consolidated results of CMT Group are based on equity accounting. For comparison purpose, the numbers for 2012 and 2013 had been restated. Consequently, the affected key financial indicators (except aggregate leverage) have also been restated accordingly.
2 On 1 October 2015, CMT acquired all the units in Brilliance Mall Trust (BMT) which holds Bedok Mall. Upon acquisition, BMT became a subsidiary. On 15 December 2015, the sale of Rivervale Mall was completed.
3 On 30 August 2016, three private trusts namely Victory Office 1 Trust, Victory Office 2 Trust and Victory SR Trust (collectively, the Victory Trusts, each wholly owned by CMT) were constituted in relation to the redevelopment of Funan. CMT, together with the Victory Trusts jointly own and undertake to redevelop Funan which comprises a retail component (held through CMT), two office towers and serviced residences.
4 Amounts included foreign currency denominated notes which have been swapped into Singapore dollars at their respective swapped rates.5 Excluding the distribution to be paid for the last quarter of the respective financial year.6 On 30 November 2012, 125,000,000 units in CMT with gross proceeds of S$250.0 million were issued via private placement exercise.
On 1 October 2015, 4,100,515 and 72,000,000 units (amounting to S$7.8 million and S$137.0 million) were issued as acquisition fee and partial consideration for the acquisition of BMT respectively.
7 Based on the closing unit prices of S$2.13 on 31 December 2012, S$1.905 on 31 December 2013, S$2.040 on 31 December 2014, S$1.930 on 31 December 2015 and S$1.885 on 30 December 2016.
8 Includes investment properties under development in relation to Funan. 9 Refers to the expenses of CMT Group, excluding property expenses and finance costs but including performance component of CapitaLand Mall Trust
Management Limited’s management fees, expressed as a percentage of weighted average net assets.10 In 2012, this is mainly due to the repayment of commercial mortgage backed securities (CMBS) borrowings under Silver Maple Investment Corporation
Ltd of S$783.0 million on 31 October 2012. Following the repayment, the properties mortgaged under the CMBS borrowings namely Tampines Mall, Junction 8, Funan, IMM Building, Bugis Junction, Sembawang Shopping Centre and JCube were discharged and released.
In 2013, this is mainly due to the redemption and cancellation of the remaining S$98.25 million in principal amount of S$650.0 million 1.0% convertible bonds due 2013 (Convertible Bonds due 2013) at 109.31% of the principal amount upon maturity. Following the redemption and cancellation, the legal mortgage over The Atrium@Orchard had been discharged and released.
11 Net Debt comprises gross debt less temporary cash intended for refinancing and capital expenditure. EBITDA refers to earnings before interest, tax, depreciation and amortisation.
12 In 2012, it was assumed that bondholders of the Convertible Bonds due 2013 would hold to maturity on 2 July 2013. 13 Higher in 2012 mainly due to the long tenures of between six to 12 years for four series of Euro-Medium Term Notes and one series of Medium Term
Notes (MTN Notes) issued under CMT MTN Pte. Ltd. (CMT MTN) in 2012. Higher in 2014 mainly due to the long tenures of between seven to 10.5 years for three series of MTN Notes issued under CMT MTN in 2014,
partially offset by the redemption of the S$350.0 million 2.125% convertible bonds due 2014. Higher in 2015 mainly due to the long tenures of eight and 12 years for two series of MTN Notes issued under CMT MTN in 2015.
Group1
For the Financial Year 2012 2013 2014 20152 20163
Selected Statement of Total Return and Distribution Data (S$ million)Gross Rental Income 526.5 589.3 607.9 615.4 639.6 Car Park Income 17.0 18.2 18.0 18.2 17.1 Other Income 29.7 30.1 33.0 35.4 33.0 Gross Revenue 573.2 637.6 658.9 669.0 689.7 Net Property Income 380.7 438.7 448.4 466.2 479.7 Distributable Income 316.9 356.2 375.3 392.0 394.3
Selected Statement of Financial Position Data (S$ million)Total Assets 9,159.7 9,220.0 9,858.3 10,355.7 10,326.7 Total Borrowings4 3,090.6 2,918.4 3,238.7 3,251.0 3,169.0 Net Asset Value Per Unit5 (S$) 1.64 1.71 1.79 1.86 1.86 Unitholders’ Funds 5,702.96 6,008.7 6,282.4 6,693.26 6,692.2
Market Capitalisation7 7,362.2 6,589.7 7,062.8 6,834.5 6,678.7 Portfolio Property Valuation 7,031.0 7,276.0 7,510.0 8,366.0 8,509.08
Key Financial IndicatorsEarnings Per Unit (cents) 16.05 16.61 17.88 16.65 13.25 Distribution Per Unit (cents) 9.46 10.27 10.84 11.25 11.13 Management Expense Ratio9 (%) 0.8 0.7 0.8 0.7 0.7 Unencumbered Assets as % of Total Assets (%) 92.210 100.010 100.0 100.0 100.0 Aggregate Leverage (%) 36.7 35.3 33.8 35.4 34.8 Net Debt / EBITDA11 (times) 5.4 4.9 5.1 6.0 6.3 Interest Coverage (times) 3.6 5.0 4.5 4.8 4.8 Average Term to Maturity12 (years) 4.013 3.8 4.713 5.313 5.3
Average Cost of Debt (%) 3.4 3.5 3.5 3.3 3.2

2016 Highlights
04
Annual Shopper Traffic
347.4 million
Credit Rating
A2issuer rating by Moody’s Investors Service
Market Capitalisation
S$6.7 billion
Distribution Per Unit
11.13 cents
Aggregate Leverage
34.8%
Distributable Income
S$394.3 million
Portfolio Occupancy Rate
98.5%
Extensive Network of Tenants
>2,900 leases
Number of Properties
16
CapitaLand Mall Trust
Annual Report 2016
Message to Unitholders
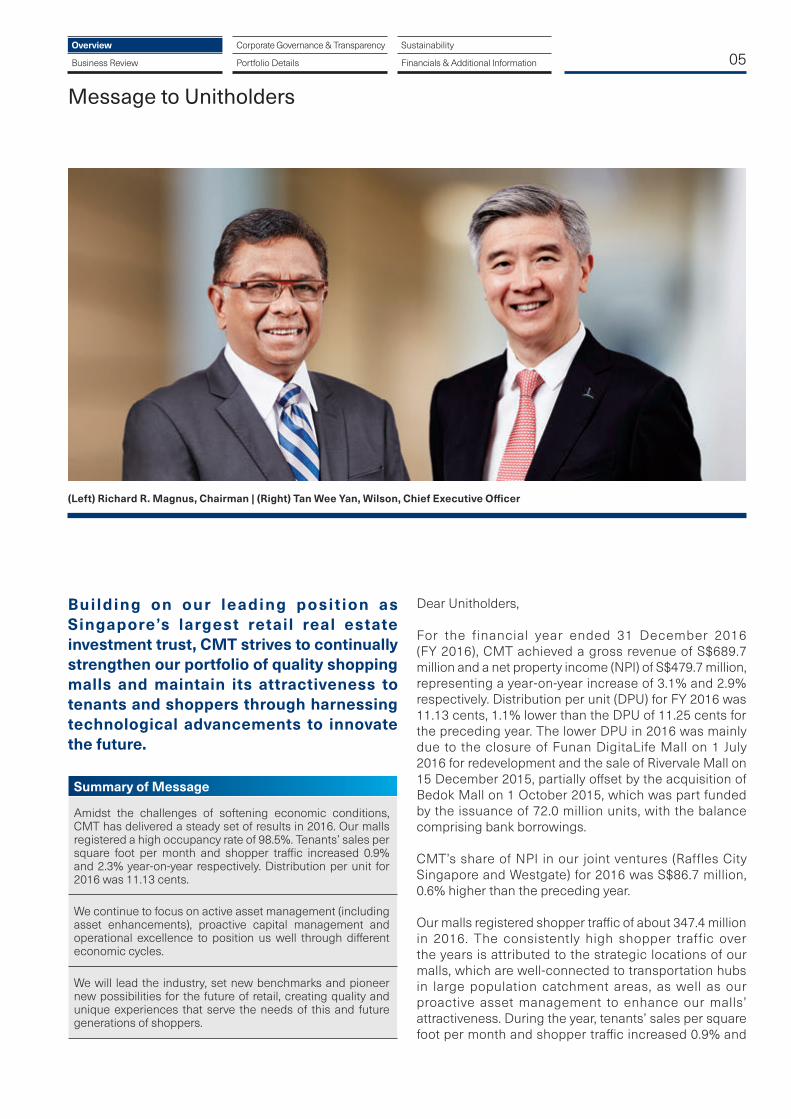
Building on our leading posit ion as Singapore’s largest retail real estate investment trust, CMT strives to continually strengthen our portfolio of quality shopping malls and maintain its attractiveness to tenants and shoppers through harnessing technological advancements to innovate the future.
Dear Unitholders,
For the financial year ended 31 December 2016 (FY 2016), CMT achieved a gross revenue of S$689.7 million and a net property income (NPI) of S$479.7 million, representing a year-on-year increase of 3.1% and 2.9% respectively. Distribution per unit (DPU) for FY 2016 was 11.13 cents, 1.1% lower than the DPU of 11.25 cents for the preceding year. The lower DPU in 2016 was mainly due to the closure of Funan DigitaLife Mall on 1 July 2016 for redevelopment and the sale of Rivervale Mall on 15 December 2015, partially offset by the acquisition of Bedok Mall on 1 October 2015, which was part funded by the issuance of 72.0 million units, with the balance comprising bank borrowings.
CMT’s share of NPI in our joint ventures (Raffles City Singapore and Westgate) for 2016 was S$86.7 million, 0.6% higher than the preceding year.
Our malls registered shopper traffic of about 347.4 million in 2016. The consistently high shopper traffic over the years is attributed to the strategic locations of our malls, which are well-connected to transportation hubs in large population catchment areas, as well as our proactive asset management to enhance our malls’ attractiveness. During the year, tenants’ sales per square foot per month and shopper traffic increased 0.9% and
(Left) Richard R. Magnus, Chairman | (Right) Tan Wee Yan, Wilson, Chief Executive Officer
05
Summary of Message
Amidst the challenges of softening economic conditions, CMT has delivered a steady set of results in 2016. Our malls registered a high occupancy rate of 98.5%. Tenants’ sales per square foot per month and shopper traffic increased 0.9% and 2.3% year-on-year respectively. Distribution per unit for 2016 was 11.13 cents.
We continue to focus on active asset management (including asset enhancements), proactive capital management and operational excellence to position us well through different economic cycles.
We will lead the industry, set new benchmarks and pioneer new possibilities for the future of retail, creating quality and unique experiences that serve the needs of this and future generations of shoppers.
Overview
Business Review
Corporate Governance & Transparency
Portfolio Details
Sustainability
Financials & Additional Information

Message to Unitholders
06CapitaLand Mall Trust
Annual Report 2016
2.3% year-on-year respectively. Portfolio occupancy as at 31 December 2016 remained high at 98.5%, up from the 97.6% a year ago.
Our portfolio of quality shopping malls, strong partnership with an extensive network of retailers and innovative shopper engagement methods have put us in a good position to continue performing amidst a challenging environment. To stay ahead of the curve, we are always pushing the boundaries and exploring new ways to future-enable our malls and retail services. As new technologies transform consumer tastes and habits, we will respond to shoppers’ growing desire to engage in more enriching and interactive experiences, beyond just consuming goods and services.
Embracing Innovative Solutions and PartnersIn 2016, we further strengthened our shopper engagement efforts by enhancing our loyalty programmes – CapitaStar, CapitaVoucher and CapitaCard. To augment the integration of our offline-and-online (O&O) offerings sought after by today’s consumers, the CapitaStar app was enhanced with new features to better connect shoppers to retailers’ offerings. One of the highlights was the introduction of Sparkle, a fully automated artificial intelligence chatbot that was the first to be launched by a real estate developer in Asia. Simply by chatting with Sparkle on the CapitaStar app, shoppers enjoy a slew of virtual concierge services, including ride hailing and restaurant booking.
We further enhanced the attractiveness of CapitaStar with the launch of the American Express CapitaCard, which incentivises card spending with STAR$® - the reward points of CapitaStar. CapitaCard members exchange the STAR$® for CapitaVouchers, thus creating a virtuous circle that drives tenants’ sales and encourages repeat spending in our malls. The closer integration of CapitaStar, CapitaVoucher and CapitaCard is part of our ongoing efforts to strengthen shopper engagement and bring more business to our retailers.
In line with the national productivity drive, we leveraged technology and forged strategic partnerships to enhance operational efficiency through technology for our malls and tenants. Our collaboration with the Info-communications Media Development Authority of Singapore and SPRING Singapore to streamline the goods delivery process through the In-Mall Distribution pilot at Tampines Mall and Bedok Mall have borne encouraging results – the queuing times for delivery trucks at both malls now average seven minutes, compared to 24 minutes in the past. The easing of road congestion around these malls had also resulted in a better experience for all visitors who drive to our malls, including shoppers.
Another initiative is the smart use of security technology that enabled us to deploy security officers to cover our mall spaces more effectively. We have set up a central monitoring and response centre that uses smart technology to provide round-the-clock real-time visibility and improved situation awareness for the surveillance, intercom and car park systems across participating malls. This has helped to reduce the outsourced security manpower at participating malls without compromising the level of security.
In keeping with the digital theme, Biz+ Series, our key tenant engagement programme, focused on helping retailers to bridge the online-to-offline (O2O) gap in 2016. Events included a CEO Breakfast Roundtable that brought leading retailers together to discuss ways to better connect with millennial consumers. We also held a series of seminars led by industry experts on topics such as new mobile payment modes and digital marketing strategies. We will continue to work closely with our tenants to embrace the latest retail trends and identify innovative opportunities.
Innovating the Retail ExperienceTo ensure the continual success of our malls, it is important that we rejuvenate and reimagine our malls through asset enhancement initiatives (AEI) so that they are well-positioned to cater to evolving consumer tastes.
07Overview
Business Review
Corporate Governance & Transparency
Portfolio Details
Sustainability
Financials & Additional Information
After observing the revitalisation of Singapore’s Civic District in recent years, we saw the possibilities of incorporating more social and community elements into Funan DigitaLife Mall that will maximise the potential of its prime location in a vibrant lifestyle district. Funan DigitaLife Mall was closed on 1 July 2016, after making a mark in Singapore’s retail history as the definitive information technology mall. In its place, we are creating Funan, an integrated development comprising six-storey retail mall, two office towers and one block of serviced residences.
Building on the legacy of its predecessor, the reimagined Funan will incorporate the tech experience throughout the entire integrated development, such as multi-dimensional cinema screens, the Central Business District’s first drive-through click-and-collect service and a smart car parking system. By catering to new lifestyle needs, Funan is geared to serve this and future generations, just like how the old Funan has served the generations before. The proposed development and related costs including financing, technology and professional fees amounted to approximately S$560.0 million and will span over three years. It is targeted for completion in the fourth quarter of 2019.
Raffles City Singapore (RCS) is an excellent example of how AEI over the years have helped to bolster the integrated development’s position as a bustling city landmark. To further enhance the shopping experience, RCS embarked on interior rejuvenation works costing about S$54.0 million in the third quarter of 2016. The improvements will cover the main entrance and mall interiors, including the central atrium at Level 3, and are expected to be completed in the first quarter of 2018.
By end-2016, we completed the rejuvenation works at Plaza Singapura and Tampines Mall. Plaza Singapura now boasts a refurbished mall interior with brighter corridor lighting, new nursing rooms, refreshed lift lobbies and escalator landings, as well as a new shoppers’ lounge on Level 1. Similarly, the interior of Tampines Mall and its Level 4 Garden Plaza have been upgraded.
Through the years, we have demonstrated our strength in executing a clear vision and differentiating our malls through many successful AEI. We will continue to leverage on this competitive advantage and reinforce our relevance to the communities that we serve.
Maintaining Healthy Balance Sheet and Financial FlexibilityIn 2016, we raised about S$349.0 million through three notes issuances. In addition, as at 31 December 2016, RCS Trust has drawn down S$1,100.0 million (CMT’s 40.00% share was S$440.0 million) unsecured bank loans, mainly to refinance its outstanding borrowings. Following the repayment of the outstanding borrowings, RCS has been unencumbered.
For the notes issuances, we have tapped on the debt markets in Singapore and Hong Kong and issued notes with debt tenures ranging from 10 to 15 years. The principal and interest components of the foreign currency denominated notes were swapped into Singapore dollars at fixed rates to eliminate currency and interest rate risks.
As at 31 December 2016, CMT’s debt profile remained healthy with an aggregate leverage of 34.8% and an average borrowing cost of 3.2% per annum. All of CMT’s borrowings were unsecured, giving us financial flexibility.
Achieving ExcellenceIn doing our best to achieve the maximum value for Unitholders, we are heartened to receive industry recognition in the areas of corporate governance, transparency and sustainability.
At the FinanceAsia – Asia’s Best Companies 2016 listings, CMT was ranked third for ‘Most Committed to Corporate Governance’ and sixth for ‘Best Managed Company’. In addition, CMT was named the runner-up for the Most Transparent Company Award in the REITs & Business Trusts category at the Securities Investors Association

08
Message to Unitholders
CapitaLand Mall Trust
Annual Report 2016
Singapore (SIAS) 17th Investors’ Choice Awards. We also reiterated our commitment to uphold high standards of corporate governance by becoming a signatory of the Statement of Support towards Excellence in Corporate Governance initiated by SIAS.
In recognition of our commitment towards the environment , social and governance standards, CMT was distinguished as the Regional Sector Leader of Asia (Retail – Listed) in the internationally recognised 2016 Global Real Estate Sustainability Benchmark (GRESB) Real Estate Assessment. Further, CMT had the honour of being included in the inaugural listing of the Singapore Exchange (SGX) Sustainability Leaders Enhanced Index, SGX Sustainability Leaders Index, SGX Sustainability Enhanced Index and SGX Sustainability Index. CMT has been a constituent of FTSE4Good Global Index since September 2007, and we were added to the newly created FTSE4Good ASEAN 5 Index in 2016. These indices are designed to facilitate investment in companies that meet globally recognised corporate responsibility standards.
Looking ForwardThe global economy had another lacklustre year in 2016, with full year growth weaker than in 2015. The Singapore Government announced that the domestic economy grew by 2.0% year-on-year in 2016, similar to the 1.9% growth in 2015. The uncertainties and downside risks in the global economy, may affect consumer sentiment and this could, in turn, affect retail sales in Singapore.
Nonetheless, CMT’s resilience is underpinned by our portfolio of predominantly necessity shopping malls, scale, strong retailer network and operational excellence. These will position us well through different economic cycles.
We will lead the industry, set new benchmarks and pioneer new possibilities for the future of retail, creating quality and unique experiences that serve the needs of this and future generations of shoppers.
AcknowledgementsMr Danny Teoh Leong Kay stepped down from the Board on 1 May 2016 and relinquished his roles as Chairman of the Board, Chairman of the Corporate Disclosure Committee and a member of the Investment Committee. He is succeeded by Mr Richard R. Magnus, who has been appointed Chairman of the Board and Chairman of the Corporate Disclosure Committee with effect from 1 May 2016.
We would like to thank Mr Danny Teoh Leong Kay for his strong leadership during his three-year tenure with the Board, including ensuring that our corporate governance is of the highest standards. We would also like to thank Mr Lang Tao Yih, Arthur, who stepped down from the Board on 31 December 2016, for his invaluable contributions.
We would like to express our deepest appreciation to the past and present Directors and our dedicated employees for their dedication and commitment towards the mission of maximising the value of CMT. Last but not least, we would also like to express our sincere gratitude to our supportive Unitholders, business partners, retailers and shoppers for their continued confidence and support.
Richard R. MagnusChairman
Tan Wee Yan, Wilson Chief Executive Officer
17 February 2017

09
致信托单位持有人之信函
Overview
Business Review
Corporate Governance & Transparency
Portfolio Details
Sustainability
Financials & Additional Information
尊敬的单位持有人,
截至2016年12月31日的财政年度(2016财年),凯德商用
新加坡信托的总收入为6.897亿新元,房地产净收入4.797
亿新元,与去年同比分别增长3.1%和2.9%。2016财年的
每单位派息为11.13新分,比去年11.25分的每单位派息减少
1.1%。2016财年每单位派息减少主要是由于2016年7月1日
关闭福南数码生活广场进行重建以及2015年12月15日脱售
滨河坊广场。2015年10月1日收购勿洛广场对上述下滑有部
分抵销作用,收购该商场的部分资金来自发行7,200万新单
位,余额则由银行贷款资助。
2016财年,凯德商用新加坡信托在合资企业新加坡来福士
城与西城的房地产净收入份额为8,670万新元,比去年增加
了0.6%。
2016年,我们商场的客流量约为3.474亿人次。这些年来高
居不下的客流量可归功于商场连通位于人口密集地区的交通
枢纽的战略位置,以及为提高商场吸引力而实行积极的资产
管理。本年度商场租户每平方英尺的销售额及客流量同比分
别增长0.9%及2.3%。截至2016年12月31日的投资组合出租
率高达98.5%,高于去年的97.6%。
优质购物中心的投资组合、与庞大零售商网络的强劲伙伴关
系,以及创新的购物者契合管理方式,让我们在充满挑战的
环境中巩固优势,创造佳绩。为保持领先地位,我们一直追
求突破,探索商场和零售服务面向未来的创新方式。随着消
费者的品味和习惯因新科技而改变,购物者不再只满足于消
费商品和服务,我们将致力于迎合其对丰富的互动体验日益
增长的需求。
开发创新方案与合作伙伴关系
2016年,通过增强客户忠诚计划 — 凯德星、凯德购物券
和凯德卡,我们进一步提高了购物者的契合度。为加强线上
线下(O&O)商品的融合,满足当今消费者在这方面的需
求,凯德星应用程序增加了新功能,加强购物者与零售商品
之间的联系。其中一个亮点是推出了Sparkle功能,这是首
个由亚洲地产开发商推出的全自动人工智能聊天机器人。
购物者通过凯德星应用程序,即可与Sparkle线上聊天,
享受一系列虚拟礼宾服务,包括召车服务及预订餐厅。
为进一步提升凯德星的吸引力,我们推出了美国运通凯德
卡,通过星级分 — 凯德星的奖励积分,鼓励信用卡消费。
凯德卡会员可将星级分兑换成凯德购物券,从而创造良性循
环,刺激租户销售业绩,制造更多商场回头客。进一步整合
凯德星、凯德购物券及凯德卡是我们为增强购物者契合度,
提高零售商业绩所做的努力之一。
为配合国家生产力发展计划,我们利用科技,建立战略合
作伙伴关系,进而提高运营效率,让旗下商场和租户受益。
我们与新加坡资讯通信媒体发展局和新加坡标新局合作,
在淡滨尼广场和勿洛广场推行旨在简化送货及交货流程
的“商场内物流管理”试验,取得了令人鼓舞的成果。相较过
去所需的24分钟,两家商场目前平均等待卸货时间缩短至七
分钟。购物中心周围道路拥挤情况得到缓解,这也为所有驾
车前往购物中心的访客(包括购物者)提供了更好的体验。
另一项举措是应用智能保安技术,优化保安人力部署,进而
更有效地监督商场。我们建立了中央指挥中心,采用智能技
术,通过高端闭路电视系统、内部通话系统和停车场系统,
对商场各处进行全天候实时影像监督,加强情景觉察能力。
在不降低安全级别的情况下,这有助于商场缩减外包的保安
人力。
为贯穿运用科技提升业绩的数码主题,我们主要的租户参与
计划“商+”系列(Biz+ Series),在2016所举办的活动着重
于帮助零售商实行线上至线下(O2O)经营模式。活动包括
了CEO早餐圆桌会议,旨在集合领先业界的零售商,共同讨
论如何更好地与千禧一代消费者沟通。我们还举办了一系列
专业研讨会,主题涵盖移动支付新模式、数码营销策略等。
我们将继续与租户紧密合作,紧随最新的零售趋势,发掘创
新商机。
打造新型零售体验
确保商场不断取得成功的关键在于通过资产提升计划翻新
和重塑我们的商场;及时调整定位,满足消费者日新月异的
需求。
从新加坡市政区近年的翻新过程中,我们看到把更多社交
元素融入福南数码生活广场的可能性,这将最大限度地发挥
其位于活力时尚区内黄金地段的潜力。在新加坡零售业历史
上留下辉煌篇章后,具代表性的福南数码生活广场于2016
年7月1日结业。在其原址上,我们正在打造名为福南的综合
项目。该项目包括六层楼的商场、两座办公楼及一栋服务
公寓。
重新建构的福南将引进多项新科技体验,如多维电影屏幕、
中央商业区的首个点击取货车道,以及智能停车系统等。
如同福南数码生活广场曾服务上几代人一样,新的福南将继
续致力于满足新生活方式的需求,为现在及未来的购物者服
务。重建工程包括融资,科技和专业费用等相关成本共预算
约5.6亿新元。为期三年的工程预计于2019年第四季竣工。
新加坡来福士城通过历年来多项资产提升计划,成功加强了
该综合项目都市繁华地标的地位。为进一步提升购物体验,
新加坡来福士城于2016年第三季展开耗资约5,400万新元的
室内翻新工程。翻新项目包括商场主入口、商场内部以及三
楼中庭,预计将于2018年第一季竣工。
截至2016年底,我们已完成狮城大厦和淡滨尼广场的翻新
工程。翻新后的狮城大厦内部现已焕然一新,拥有更明亮的
走廊,新增的哺乳室,翻新过的电梯大厅与自动扶梯通道以
及位于一楼全新的购物者休息区。淡滨尼广场内部及其四楼
的花园露天广场同样的也在装修后面目一新。
10
致信托单位持有人之信函
CapitaLand Mall Trust
Annual Report 2016
多年来,我们通过许多成功的资产提升计划展示我们在实现
愿景及打造商场独特性方面的实力。我们将继续充分发挥竞
争优势,加强商场与所服务社区之间的相关性。
维持财务的稳健性和灵活性
2 016年,我们通 过发行三次票据,筹得约3.49亿新元。
此外,截至2016年12月31日,来福士城新加坡信托借取11亿
新元(凯德商用新加坡信托的40.00%份额约4.4亿新元)的
无担保银行贷款,主要用于未偿还借款的再融资。在清偿剩
余借款后,新加坡来福士城已无任何产权负担。
于票据发行方面,我们透过新加坡和香港的债务市场发行年
期10至15年不等的票据。我们已将外币票据的本金和利息
转换为新元并固定其利率,以抵消货币和利率波动风险。
截至2 016年12月31日,凯德商用新加坡信托的债务状况
维持稳健,资产负债比率为34.8%,平均贷款成本为每年
3.2%。凯德商用新加坡信托所有贷款为无担保贷款,从而
赋予我们财务灵活性。
实现卓越
在竭尽全力为信托单位持有人实现最大价值的同时,我们在
企业管治、透明度和可持续发展等领域获得业界认可,这令
我们备受鼓舞。
FinanceAsia 2016年亚洲最佳公司排名中,凯德商用新加坡
信托在“最注重企业治理”评比中排名第三,在“最佳企业
治理”评比中排名第六。此外,我们在新加坡证券投资者协
会第17届“投资者的选择奖”的房地产投资信托及商业信托
类别中获得“最透明企业奖”亚军。我们也再一次签署了新
加坡证券投资者协会发起的“公司卓越管治之支持声明”,
重申并承诺维持高标准的公司管治。
为了表彰我们对环境、社会和公司治理高标准的承诺和贡
献,凯德商用新加坡信托于2016年在国际公认的全球房地
产永续标准(GRESB)评比中,被誉为亚洲区领导者(零售地
产 — 上市企业)。此外,凯德商用新加坡信托荣幸获新加坡
交易所(新交所)纳入新推出的四个指数,即新交所可持续
发展领袖增强型指数、新交所可持续发展领袖指数、新交所
可持续发展增强型指数和新交所可持续发展指数。凯德商
用新加坡信托自2007年9月起便被纳入FTSE4Good Global
Index,并于2016年获纳入新设立的FTSE4Good ASEAN 5
Index。这些指数旨在促进对符合全球公认的企业负责标准
的公司进行投资。
展望未来
2016年全球经济依然疲软,全年增长逊于2015年。新加坡
政府公布2016年国内经济同比增长率为2.0%,近似2015年
的1.9%。全球经济的不确定性以及下行的风险,可能会左右
消费者情绪,进而影响新加坡的零售业表现。
尽管如此,凯德商用新加坡信托的韧性源自其以日常购物中
心为主的资产组合、规模效益、强大的零售商网络以及卓越
运营方式。这些将有助于我们应对不同的经济周期。
我们将继续引领行业,为零售的未来设定新的标准,开拓新
的可能性,并打造独特优质的体验,满足现在与未来购物者
的需求。
致谢
趙 亮 溪 先 生于2 016 年 5月1日卸 任 董 事 会主 席、公司 信
息披露委员会主席及投资委员会成员。于2 016年5月1日
起,Richard R. Magnus先生接任董事会主席及公司信息披
露委员会主席。
我们要感谢趙亮溪先生在董事会任职三年期间强有力的领
导,包括确保我们的企业管治达到最高标准。我们还要感谢
于2016年12月31日卸任的蓝道义先生,在任期间于董事会
所作出的宝贵贡献。
我们谨借此机会向前任与现任董事以及我们敬业的员工致
以最诚挚的谢意,感谢他们为凯德商用新加坡信托创造了更
大的价值,感谢他们一如既往的奉献与忠诚。最后,我们也
要向支持我们的单位持有人、业务伙伴、零售商和购物者表
示衷心感谢,感谢他们一路来给予的信任和支持。
Richard R. Magnus主席
陈伟渊
首席执行官
2017年2月17日

Trust Structure
Organisation Structure
11
Investment in CapitaLand Mall Trust
Management Services
Management Fees
Distributions
Represents Interests of Unitholders
Trustee’s Fees
Ownership of Assets
Net Property IncomeProperty
Management Services
Property Management Fees
1. Bedok Mall2. Bugis+3. Bugis Junction 4. Bukit Panjang Plaza (90 out of 91 strata lots)5. Clarke Quay6. Funan7. IMM Building8. JCube9. Junction 810. Lot One Shoppers’ Mall11. Plaza Singapura12. Raffles City Singapore (40.00% interest)13. Sembawang Shopping Centre14. Tampines Mall15. The Atrium@Orchard16. Westgate (30.00% interest)
ManagerCapitaLand Mall Trust Management Limited
(CMTML)
TrusteeHSBC Institutional
Trust Services (Singapore) Limited
Property ManagersCapitaLand Retail
Management Pte Ltd(CRMPL)
CapitaLand (RCS) Property Management
Pte. Ltd.1
Unitholders
CMT Portfolio
1 CapitaLand (RCS) Property Management Pte. Ltd. only manages Raffles City Singapore.
CapitaLand Mall Trust Management Limited
Investment & Asset ManagementFinance Investor Relations
Board of Directors
Chief Executive Officer
Audit Committee
Overview
Business Review
Corporate Governance & Transparency
Portfolio Details
Sustainability
Financials & Additional Information

Year in Brief 2016
12
January
• CMT’s distribution per unit (DPU) of 11.25 cents for the period 1 January 2015 to 31 December 2015 was 3.8% higher than that for the period 1 January 2014 to 31 December 2014.
• JCube clinched the Building and Construction Authority (BCA) Green Mark Platinum award, the highest accolade for green building certification in Singapore. Sembawang Shopping Centre, Plaza Singapura and Lot One Shoppers’ Mall received the BCA Green Mark Gold awards.
February
• CMT MTN Pte. Ltd. (CMT MTN), a wholly owned subsidiary of CMT, issued S$100.0 million 10-year fixed rate notes under its S$2.5 billion unsecured Multicurrency Medium Term Note Programme (MTN Programme) at 3.50% per annum.
March
• The Info-communications Media Development Authority of Singapore, SPRING Singapore and CMTML signed a Memorandum of Intent to launch an In-Mall Distribution trial at Tampines Mall and Bedok Mall.
• CMT was placed third and sixth respectively in FinanceAsia magazine’s Asia’s Best Companies 2016 rankings of ‘Most Committed to Corporate Governance’ and ‘Best Managed Company’.
April
• CMT’s DPU of 2.73 cents for the period 1 January 2016 to 31 March 2016 was 1.9% higher than that for the period 1 January 2015 to 31 March 2015.
• CMTML announced the retirement of Mr Danny Teoh Leong Kay from the Board of CMTML as a Non-Executive Independent Director and as Chairman of the Board. Following his retirement, he ceased to serve as Chairman of the Corporate Disclosure Committee and as a Member of the Investment Committee. He was succeeded by Mr Richard R. Magnus as Chairman of the Board and Chairman of the Corporate Disclosure Committee with effect from 1 May 2016.
• CMT was included in the FTSE4Good Global Index for the 10th consecutive year and it was included in the newly created FTSE4Good ASEAN 5 Index.
May
• Mr Lang Tao Yih, Arthur joined as a Non-Executive Non-Independent Director, and serves as a Member of the Audit Committee and the Executive Committee.
• CMT was included in the inaugural listing of the Singapore Exchange (SGX) Sustainability Leaders Enhanced Index, SGX Sustainability Leaders Index, SGX Sustainability Enhanced Index and SGX Sustainability Index.
June
• RCS Trust’s borrowings were refinanced with unsecured bank loans. Following the repayment, Raffles City Singapore (RCS) was unencumbered.
CapitaLand Mall Trust
Annual Report 2016

13
July
• Funan DigitaLife Mall closed on 1 July 2016 for three years of redevelopment works to enhance its attractiveness as a lifestyle destination.
• RCS commenced rejuvenation works costing S$54.0 million to further enhance the shopping experience and reinforce its position as one of Singapore’s top shopping destinations.
• CMT MTN issued 15-year fixed rate notes of S$150.0 million at 3.35% per annum and 10-year fixed rate notes of HK$560.0 million at 2.71% per annum under its MTN Programme. The proceeds from the HK$ denominated notes have been swapped to S$99.0 million at 2.928% per annum.
• CMT’s DPU of 5.47 cents for the period 1 January 2016 to 30 June 2016 was 1.5% higher than that for the period 1 January 2015 to 30 June 2015.
September
• CMT broke ground for Funan, an integrated development comprising six-storey retail mall, two office towers and one block of serviced residences on the site of the former Funan DigitaLife Mall.
• CMT was recognised as a Regional Sector Leader of Asia (Retail-Listed) in the 2016 Global Real Estate Sustainability Benchmark (GRESB) Real Estate Assessment.
• Westgate and Plaza Singapura were recognised and included in the Top 10 Commercial Buildings (Retail) in the BCA Building Energy Benchmarking Report 2016.
• CMT was named the runner-up for the Most Transparent Company Award (REITs & Business Trusts category) at the Securities Investors Association Singapore 17th Investors’ Choice Awards.
October
• CMT’s DPU of 8.25 cents for the period 1 January 2016 to 30 September 2016 (YTD Sep 2016) was 1.4% lower than that for the period 1 January 2015 to 30 September 2015 (YTD Sep 2015).
Distributable income for YTD Sep 2016 was S$292.3 million, 0.7% higher than YTD Sep 2015. The distributable income in the third quarter of 2015 included the release of S$8.0 million taxable income retained in the first quarter of 2015. Excluding this release, the distributable income for YTD Sep 2016 would have been 3.6% higher than YTD Sep 2015.
November
• Tampines Mall completed its rejuvenation works with new interior finishes, refreshed main atrium fascia and balustrade as well as an upgraded Garden Plaza on Level 4.
• Plaza Singapura completed its rejuvenation works, including a refurbished mall interior with brighter corridor lighting, new nursing rooms, refreshed lift lobbies and escalator landings, as well as a new shoppers’ lounge on Level 1.
December
• IMM Building clinched the BCA Green Mark GoldPLUS award.
• CMTML announced the resignation of Mr Lang Tao Yih, Arthur from the Board of CMTML as a Non-Executive Non-Independent Director and a Member of the Audit Committee and the Executive Committee.
Overview
Business Review
Corporate Governance & Transparency
Portfolio Details
Sustainability
Financials & Additional Information

Integrated Retail Real Estate Platform We are able to tap on CapitaLand’s unique integrated retail real estate platform, combining the best of retail real estate management and capital management capabilities.
Through this platform, we can call upon a professional and experienced team of operations, project and asset managers who work closely and seamlessly with each other to:
• Formulate medium and long-term strategies and initiatives to deliver sustainable returns
• Enhance shopping experiences to attract shoppers and increase shopper traffic
• Review space usage to optimise space productivity and income
• Manage lease renewals and new leases diligently to minimise rental voids
• Manage and monitor rental arrears to minimise bad debts
• Manage projects to ensure timely completion within budgets
• Manage and monitor property expenses to maximise net property income
• Address all key operational issues to ensure alignment with the strategies of the Manager
Growth Strategies
14
Integrated Retail Real Estate Business Platform
Intrinsic Growth Active asset management is important for us to capture opportunities for intrinsic growth. CMT’s intrinsic growth has been achieved through:
• Step-up rent • Gross turnover rent, which is typically about 5.0% of
CMT’s gross revenue. This is a useful management tool which aligns CMT’s interests with those of our tenants. Most of the leases at CMT’s properties follow a rental structure which encompasses step-up rent plus a small component of gross turnover rent or a larger component of gross turnover rent only, whichever is higher
• Non-rental income from car parks, atrium space, advertisement panel space, casual leasing, vending machines and customer service counters
• Improved rental rates for lease renewals and new leases
Net Property Income
Ownership
Distributions
Investment
Corporate Governance
Retail Real Estate Management Retail Real Estate Capital Management
Retail Real Estate Unitholders
PropertyManagement
RetailManagement& OperationalLeasing
StrategicMarketing
Design &DevelopmentManagement
AssetManagement
StrategicPlanning &Investment
FundStructuring &Management
CapitaLand Mall Trust
Annual Report 2016

15
Innovative Asset Enhancement Initiatives Creative asset planning unlocks the potential value of CMT’s malls to further propel growth by enhancing the retail environment and improving the attractiveness of our malls to shoppers and retailers. Diverse ways of increasing the yield and productivity of CMT’s retail space include: • Decantation whereby lower-yield space is converted
to higher-yield space • Reconfiguring retail units to optimise space efficiency • Maximising the use of common areas, such as bridge
space, and converting mechanical and electrical areas into leasable space
• Upgrading amenities, enhancing the facade, adding play and rest areas, providing advice on shopfront design and creating better shopper circulation
Inviting Experience To stay ahead of consumer trends, we constantly reinvent the retail experience with innovative shopping, dining and entertainment combinations, which help to maximise the sales of the tenants and generate growth through improved rental income. The increase in shopper traffic is generated through:
• Alignment of tenant mix with current market trends, which ensures a consistently good combination of attractive and popular retail outlets in CMT’s malls
• New retail concepts which generate fresh excitement and positive sales
• Enhancing shoppers’ experiences with a more pleasant, comfortable and exciting environment by improving connectivity to public amenities, upgrading restroom facil it ies, nursing rooms, children’s playgrounds, designated water play areas with interactive features for children, alfresco dining areas and harnessing technological innovations
• Innovative marketing and promotional events to draw in the crowds as well as attractive loyalty programmes for shoppers to encourage repeat spending
• Attractive shopfronts and visual merchandising design ideas
• Building strategic partnerships to strengthen retail experiences
Instrumental Investments The ability to identify value-adding acquisitions, investments and greenfield development projects to add to the portfolio and further enhance its value is central to CMT’s long-term sustainable growth.
Our investments must satisfy the investment criteria of:
• Potential for growth in yield • Rental sustainability • Potential for value creation
CMT’s 14.11% interest in CapitaLand Retail China Trust provides some exposure to the growth in the China retail real estate market without significantly changing the asset profile of CMT.
Intensive Capital and Risk Management We seek to optimise returns to Unitholders while maintaining a strong capital base and credit rating to support CMT’s growth.
Regular assessments of capital management policies are undertaken to ensure that they are adaptable to changes in economic conditions and the risk characteristics of CMT. We also monitor our exposures to various risk elements by closely adhering to well-established management policies and procedures.
As part of our proactive capital management, we diversify our sources of funding and will continue to review our debt profile to reduce refinancing risk.
Overview
Business Review
Corporate Governance & Transparency
Portfolio Details
Sustainability
Financials & Additional Information

CMT’s portfolio of 16 quality properties is well diversified in the suburban areas and downtown core of Singapore. The portfolio comprises Tampines Mall, Junction 8, Funan, IMM Building, Plaza Singapura, Bugis Junction, Sembawang Shopping Centre, JCube, Raffles City Singapore (40.00% interest), Lot One Shoppers’ Mall, 90 out of 91 strata lots in Bukit Panjang Plaza, The Atrium@Orchard, Clarke Quay, Bugis+, Westgate (30.00% interest) and Bedok Mall.
Our shopping malls are well connected to public transportation hubs such as mass rapid transit (MRT) / light rail transit (LRT) stations and bus interchanges.
Property Portfolio
16
They are strategically located either in areas with large population catchments or within Singapore’s popular shopping and tourist destinations.
The Manager continues to strive to ensure that each shopping mall in CMT’s portfolio optimises its financial performance, strengthens its market position as the leading mall serving its community, as well as provides the ideal shopping experience for its shoppers. This is achieved through a combination of active asset management, including asset enhancements, as well as innovative marketing and promotional activities.
Picture 6: An artist’s impression of the new building facadePicture 13: Kenny Teo Seng Chye, CapitaLand ‘Building People’ Photography Competition 2012
3. Bugis Junction
4. Bukit Panjang Plaza 5. Clarke Quay 6. Funan
12. Raffles City Singapore11. Plaza Singapura 13. Sembawang Shopping Centre
1. Bedok Mall 2. Bugis+
CapitaLand Mall Trust
Annual Report 2016

17
Locations of CMT’s Properties in Singapore
10. Lot One Shoppers’ Mall8. JCube 9. Junction 87. IMM Building
14. Tampines Mall 15. The Atrium@Orchard 16. Westgate
Overview
Business Review
Corporate Governance & Transparency
Portfolio Details
Sustainability
Financials & Additional Information

Board of Directors
Richard R. MagnusChairman & Non-Executive Independent Director
Lim Ming Yan Deputy Chairman & Non-Executive Non-Independent Director
Fong Kwok JenNon-Executive Independent Director
Gay Chee CheongNon-Executive Independent Director
Lee Khai Fatt, KyleNon-Executive Independent Director
Jason Leow Juan ThongNon-Executive Non-Independent Director
Ng Chee KhernNon-Executive Independent Director
Tan Kian ChewNon-Executive Non-Independent Director
Tan Wee Yan, WilsonChief Executive Officer &Executive Non-Independent Director
18CapitaLand Mall Trust
Annual Report 2016
19Overview
Business Review
Corporate Governance & Transparency
Portfolio Details
Sustainability
Financials & Additional Information
1 Delisted on 22 July 2014.
Richard R. Magnus, 72ChairmanNon-Executive Independent DirectorBachelor of Laws (Honours), University of SingaporeMaster of Laws, University of SingaporeAlumni, Harvard Business School and John F Kennedy School of Government
Date of first appointment as a director:3 May 2010Date of appointment as Chairman:1 May 2016Length of service as a director (as at 31 December 2016):6 years 8 months
Board committees served on• Corporate Disclosure Committee (Chairman) • Investment Committee (Member)
Present principal commitments• Bioethics Advisory Committee (Chairman)• Changi Airport Group (Singapore) Pte. Ltd. (Director)• Changi Airport Group (Singapore) Pte. Ltd.’s
Operational Risk & Safety Committee (Member)• Political Films Consultative Committee (Chairman)• Public Service Commission (Member)• Public Transport Council (Chairman)• Singapore Consortium Investment Management
Limited (Director) • Temasek Cares CLG Limited (Chairman)• UNESCO’s International Bioethics Committee
(Vice-Chairman)
Background and working experience• Senior District Judge of Singapore Legal Service
Commission (From 1998 to 2008)
Awards• Public Service Star (2015)• MSF Outstanding Volunteer Award (2014)• Meritorious Service Medal (2009)• Public Administration Medal (Gold) (Bar) (2003)• Public Administration Medal (Gold) (1994)• Public Administration Medal (Silver) (1983)
Lim Ming Yan, 54Deputy ChairmanNon-Executive Non-Independent DirectorBachelor of Engineering (Mechanical) and Economics (First Class Honours), University of Birmingham, UK
Date of first appointment as a director: 1 January 2013Date of appointment as Deputy Chairman: 1 January 2013Length of service as a director (as at 31 December 2016): 4 years
Lim Ming Yan, 54Deputy ChairmanNon-Executive Non-Independent Director(continued)
Board committees served on• Corporate Disclosure Committee (Member)• Executive Committee (Chairman)• Investment Committee (Chairman)
Present directorships in other listed companies• Ascott Residence Trust Management Limited
(manager of Ascott Residence Trust) (Deputy Chairman)
• CapitaLand Commercial Trust Management Limited (manager of CapitaLand Commercial Trust) (Deputy Chairman)
• CapitaLand Limited • CapitaLand Retail China Trust Management Limited
(manager of CapitaLand Retail China Trust) (Deputy Chairman)
Present principal commitments (other than directorships in other listed companies)• Business China (Director)• CapitaLand China Holdings Pte Ltd (Chairman)• CapitaLand Hope Foundation (Director)• CapitaLand Limited (President & Group CEO)• CapitaLand Mall Asia Limited1 (Chairman)• CapitaLand Regional Investments Limited (Chairman)• CapitaLand Singapore Limited (Chairman)• CTM Property Trust, Steering Committee (Chairman)• LFIE Holding Limited (Co-Chairman)• Shanghai YiDian Holding (Group) Company (Director)• Singapore Tourism Board (Member of the Board)• The Ascott Limited (Chairman)• Workforce Singapore Agency (Chairman)
Past directorship in other listed company held over the preceding three years• Central China Real Estate Limited
Background and working experience• Chief Operating Officer of CapitaLand Limited
(From May 2011 to December 2012)• CEO of The Ascott Limited
(From July 2009 to February 2012) • CEO of CapitaLand China Holdings Pte Ltd
(From July 2000 to June 2009)
Awards• Outstanding Chief Executive (Overseas) at the
Singapore Business Awards 2006• Magnolia Award by the Shanghai Municipal
Government in 2003 and 2005

Board of Directors
20CapitaLand Mall Trust
Annual Report 2016
Tan Wee Yan, Wilson, 59Chief Executive OfficerExecutive Non-Independent DirectorBachelor of Arts (Economics), National University of Singapore
Date of first appointment as a director: 1 July 2012Length of service as a director (as at 31 December 2016):4 years 6 months
Board committee served on• Executive Committee (Member)
Present principal commitments• EZ-Link Pte Ltd (Chairman)• National Arts Council (Member)• Republic Polytechnic (Member, Board of Governors
and Chairman, Administration Committee)• School of Digital Media and Infocomm Technology
(DMIT), Singapore Polytechnic (Member, Advisory Committee)
• Singapore River One Limited (Chairman)
Background and working experience• Deputy CEO of CapitaLand Mall Trust Management
Limited (From February 2012 to June 2012)• Group CEO of Singapore Post Limited
(From October 2007 to April 2010)• Managing Director of NEC Asia Pte. Ltd.
(From January 2007 to September 2007)• President of Japan & APAC, Mercury Interactive
(From March 2002 to March 2006)
Tan Kian Chew, 63Non-Executive Non-Independent DirectorBachelor of Science (Mechanical Engineering) (First Class Honours), University of AstonAdvanced Management Program, Harvard University
Date of first appointment as a director:3 May 2010Length of service as a director (as at 31 December 2016): 6 years 8 months
Present principal commitment • Singapore Labour Foundation (CEO)
Past directorship in other listed company held over the preceding three years• ARA Trust Management (Suntec) Limited
(manager of Suntec Real Estate Investment Trust)
Background and working experience• CEO of NTUC Fairprice Co-operative Ltd
(From October 1997 to December 2015)• Principal Private Secretary to Deputy Prime Minister
Ong Teng Cheong, Prime Minister’s Office (From 1988 to 1992)• Deputy Director of Ministry of Trade and Industry
(From 1983 to 1988)• Head of Naval Operations of Singapore Navy
(From 1980 to 1983)
Awards• NTUC May Day Award – Medal of Commendation
(Gold) (2014)• Singapore Public Administration Medal (Silver) (1991)
21Overview
Business Review
Corporate Governance & Transparency
Portfolio Details
Sustainability
Financials & Additional Information
Ng Chee Khern, 51Non-Executive Independent DirectorBachelor of Arts (Honours) in Philosophy, Politics & Economics, University of OxfordMaster of Arts, University of OxfordMaster in Public Administration, Harvard University
Date of first appointment as a director: 8 June 2012Length of service as a director (as at 31 December 2016): 4 years 7 months
Present directorship in other listed company• Singapore Technologies Engineering Ltd
Present principal commitments (other than directorship in other listed company)• Defence Science and Technology Agency (Chairman)• DSO National Laboratories (Chairman)• Eastern Health Alliance Pte Ltd (Director)• Government Technology Agency (GovTech)
(Chairman)• Ministry of Defence (Permanent Secretary)
(Defence Development)• National Research Foundation (Board Member)• Singapore Technologies Holdings Pte Ltd (Director)
Background and working experience• 2nd Permanent Secretary, Ministry of Health,
Singapore (from August 2014 to March 2016)• Director of Security and Intelligence Division,
Ministry of Defence, Singapore (From September 2010 to April 2014)• Senior Deputy Director of Security and Intelligence
Division, Ministry of Defence, Singapore (From January 2010 to August 2010)• Chief of Air Force of Republic of Singapore Air Force,
Ministry of Defence, Singapore (From March 2006 to December 2009)
• Chief of Staff of Republic of Singapore Air Force, Ministry of Defence, Singapore (From September 2005 to March 2006)
• Director of Joint Operations and Plans Directorate and Joint Staff–MINDEF of Republic of Singapore Air Force, Ministry of Defence, Singapore (From March 2004 to September 2005)
• Head of Joint Operations and Joint Staff–MINDEF of Republic of Singapore Air Force, Ministry
of Defence, Singapore (From June 2003 to March 2004)• Head of Air Operations of Republic of Singapore
Air Force, Ministry of Defence, Singapore (From March 2001 to June 2003)
Lee Khai Fatt, Kyle, 65Non-Executive Independent DirectorBachelor of Arts in Business Studies (Honours), Council for National Academic Awards Polytechnic of the South BankMaster of Science in International Management (Distinction), University of London, The School of Oriental and African StudiesMaster of Business Administration and Diploma in Management, University of London, Imperial College of Science, Technology and MedicineFellow of the Institute of Chartered Accountants in England and Wales and Institute of Singapore Chartered Accountants Fellow of the Singapore Institute of Directors
Date of first appointment as a director: 1 November 2012Length of service as a director (as at 31 December 2016): 4 years 2 months
Board committees served on• Audit Committee (Chairman)• Investment Committee (Member)
Present directorships in other listed companies• FEO Hospitality Asset Management Pte. Ltd.
(manager of Far East Hospitality Real Estate Investment Trust)
• FEO Hospitality Trust Management Pte. Ltd. (trustee-manager of Far East Hospitality Business Trust)
• Great Eastern Holdings Limited
Present principal commitment (other than directorships in other listed companies)• The Great Eastern Life Assurance Company Limited
(Director)
Past directorships in other listed companies held over the preceding three years• WBL Corporation Limited• MFS Technology Ltd
Background and working experience• Partner of PricewaterhouseCoopers LLP and
Price Waterhouse (From June 1990 to June 2010)
Ng Chee Khern, 51Non-Executive Independent Director(continued)
Awards• Public Administration Medal (Gold) (Military) (2005)• The Legion of Merit (Degree of Commander) by the
United States• The Bintang Swa Bhuwana Paksa Utama by Indonesia• The Knight Grand Cross (First Class) of the Most
Noble Order of the Crown of Thailand • Ordre National de la Légion d’honneur by the French
Government
Board of Directors
22CapitaLand Mall Trust
Annual Report 2016
Gay Chee Cheong, 60Non-Executive Independent DirectorBachelor of Science in Engineering (Honours), Royal Military College of ScienceBachelor of Science in Economics (Honours), University of LondonMasters of Business Administration, National University of Singapore
Date of first appointment as a director:1 November 2012Length of service as a director (as at 31 December 2016): 4 years 2 months
Board committee served on• Audit Committee (Member)
Present directorship in other listed company• Hyflux Ltd
Present principal commitments (other than directorship in other listed company)• Heliconia Capital Management Pte. Ltd. (Director)• Koosng Private Limited (Director)• Temasek Polytechnic (Member, Board of Governors,
Chairman, Investment Committee, Deputy Chairman, Administration Committee)
• United World College South East Asia Foundation (Trustee)
Background and working experience• Deputy Chairman & CEO of 2G Capital Pte Ltd
(From 2001 to 2006)• Group Executive Director of JIT Electronics Pte Ltd
(From 1997 to 2000)
Fong Kwok Jen, 67Non-Executive Independent DirectorBachelor of Laws (Honours), University of SingaporeAdvocate and Solicitor
Date of first appointment as a director: 1 November 2012Length of service as a director (as at 31 December 2016): 4 years 2 months
Board committee served on• Audit Committee (Member)
Present principal commitment• Equity Law LLC (Executive Director)
Past directorship in other listed company held over the preceding three years• Xpress Group Limited
Background and working experience• Partner of Fong Partners (From 1995 to June 2004)• Chairman, Disciplinary Committee of Singapore
Exchange Securities Trading Limited (From 1994 to 2007)
• Member of Securities Industry Council (From 1992 to 2003)
• Council Member of The Law Society of Singapore (From 1990 to 1992)
• Deputy Senior State Counsel/Senior State Counsel of Attorney-General’s Chambers (From 1982 to 1989)
• Deputy Public Prosecutor of Attorney-General’s Chambers (From 1972 to 1982)
Others• NITA (National Institute of Trial Advocates) Advocacy
Programme at Harvard Law School (1986)• Government Legal Officer’s Course under Colombo
Plan Award, United Kingdom (1976/77)

23Overview
Business Review
Corporate Governance & Transparency
Portfolio Details
Sustainability
Financials & Additional Information
Jason Leow Juan Thong, 50Non-Executive Non-Independent DirectorExecutive Master in Business Administration, Fudan UniversityChartered Accountant of Singapore and a member of the Institute of Singapore Chartered AccountantsAdvanced Management Program, Harvard Business School
Date of first appointment as a director:22 December 2014Length of service as a director (as at 31 December 2016): 2 year 1 month
Board committees served on• Corporate Disclosure Committee (Member)• Executive Committee (Member)• Investment Committee (Member)
Present directorship in other listed company• CapitaLand Malaysia Mall REIT Management
Sdn. Bhd. (manager of CapitaLand Malaysia Mall Trust)
Present principal commitment (other than directorship in other listed company)• CapitaLand Mall Asia Limited (CEO)
Past directorships in other listed companies held over the preceding three years• Lai Fung Holdings Limited • Central China Real Estate Limited
Background and working experience• CEO of CapitaLand China Holdings Pte. Ltd.
(From July 2009 to September 2014)• Deputy CEO of CapitaLand China Holdings Pte. Ltd.
(From July 2005 to June 2009)• General Manager, Business Development of
CapitaLand Residential Limited (From July 2002 to June 2005)

Trust Management Team (CMTML)
Tan Wee Yan, WilsonChief Executive Officer and Executive Non-Independent Director
Please refer to description under the section on ‘Board of Directors’.
Tan Lei KengHead, Finance
Lei Keng heads the finance team and is responsible for CMT’s financial management functions and the sourcing and management of funds for CMT. She overseas matters involving treasury, accounting and capital management, ensuring alignment with CMT’s investment strategy and its mall portfolio management, with a focus on driving revenue and delivering investment returns for CMT.
The finance team works with Investment & Asset Management to review, evaluate and execute appropriate acquisitions, divestments and annual business plans to optimise the value of the portfolio and ensure these are implemented in accordance with CMT’s investment and asset management strategies to create value for Unitholders. The team is responsible for the accounting, taxation, treasury, capital management and financial reporting functions of CMT.
Prior to joining CMTML, Lei Keng had extensive regional experience in finance with locally-listed as well as American listed companies. She holds a Master of Business Administration from the University of South Florida and a Bachelor of Accountancy from the University of Singapore.
Jacqueline LeeHead, Investment & Asset Management
Jacqueline heads the Investment & Asset Management function at CMTML and is responsible for creating value for Unitholders through acquisitions and divestments, asset enhancement, active asset management and portfolio management. She is also concurrently the Head of Investment & Asset Management for CapitaLand Mall Asia, Singapore.
The Investment & Asset Management team proposes and executes appropriate acquisitions, divestments and asset enhancement initiatives to optimise the value of the portfolio; monitors, analyses and reports on valuation, performance metrics and trends; devises appropriate strategies to optimise operating performance and prepares the annual business plan. The team works with the Property Manager to execute the business plan and other initiatives to drive organic growth. It also puts in place the risk management system for the CMT Group. Jacqueline has extensive experience in real estate including investment, corporate finance and engineering. Prior to joining CMTML, she worked in a public listed company handling mergers, acquisitions, divestments and business valuation. Jacqueline started her career as an electrical engineer, and was involved in the planning, design and construction of major building and infrastructure projects. She holds a Master of Business Administration from the University of Sydney, Australia; as well as a Master of Arts and a Bachelor of Arts (Honours) in Engineering Science from the University of Oxford, United Kingdom.
Audrey TanVice President, Investor Relations
Audrey heads the investor relations function at CMTML, and is responsible for building relations and facilitating strategic communications with CMT’s Unitholders, potential and existing investors and analysts through various communication platforms, as well as collating feedback from the investment community.
The investor relation team ensures clear and timely communications with Unitholders and stakeholders through various communication channels. The team engages investor and analysts through regular meetings, conferences and events, and produces collaterals such as annual reports and presentation.
Prior to joining CMTML, Audrey has more than 16 years’ regional experience in finance, accounting and treasury with locally-listed and multinational companies. She holds a Bachelor of Business in Accountancy and is a Certified Practising Accountant with CPA Australia.
24CapitaLand Mall Trust
Annual Report 2016

Property Management Team (CRMPL)
Teresa TeowDirector / Head, Retail Management, Singapore
Teresa has more than 20 years of experience in real estate management and currently oversees the operations of 18 retail properties in Singapore. She is responsible for the smooth execution of operational plans and the operational efficiency of the malls in order to achieve operational targets. As part of her portfolio, Teresa also oversees the Singapore Group Leasing, Group Marketing Communications and Group Operations departments, to achieve better synergies for both leasing and marketing communications activities and to leverage on the scale of the portfolio. Teresa also assists in planning for staff development so as to ensure continuity of operations in the portfolio. Teresa holds a Bachelor of Business (Business Administration) degree from the Royal Melbourne Institute of Technology, Australia.
Cindy PehHead, Leasing, Singapore
Cindy oversees the Singapore Group Leasing function which supports CMT’s malls in all aspects of leasing activities and asset enhancement initiatives. She works closely with the malls’ leasing teams to ensure greater synergies and unlock greater value for CMT’s malls.
Cindy is also involved in the conceptualisation of and supporting CMT’s development projects in all leasing aspects. She formulates initiatives to achieve greater efficiency and improve business processes for the leasing function in the malls.
Cindy has 18 years of experience in retail leasing, which includes six years of retail consultancy for key malls. She holds a Bachelor of Science (Economics) from the National University of Singapore.
Steve NgHead, Marketing Communications, Singapore
Steve has more than 20 years of consumer and corporate marketing experience. He heads the Singapore Group Marketing Communications function and formulates the strategic direction and initiatives to actively engage shoppers, tenants and the communities of CMT’s malls. With a suite of loyalty products such as CapitaStar, CapitaVoucher and CapitaCard, he builds greater loyalty amongst shoppers and generates business opportunities for tenants within CMT’s malls. He works closely with the malls’ marketing communication teams to ensure greater synergies and unlock value for CMT’s malls. Steve holds a Bachelor of Science (Economics) in Management Studies from the University of London and a Postgraduate Diploma in eCommerce and Marketing from The Chartered Institute of Marketing.
Jason LoyHead, Operations, Singapore
Jason formulates the strategic direction of the engineering and operational aspects of CMT’s malls. He is responsible for developing operational guidelines as well as implementing facility management policies, which include the establishment of standard operating procedures for the malls to run efficiently. He also devises new initiatives and implements innovative ways to improve business work processes for productivity. Jason is a registered Professional Engineer with 21 years of experience in planning, design, supervision of mechanical and electrical services, technical due diligence, project administration, operations, sustainability and green building technologies. He holds a Bachelor of Engineering in Mechanical and Production Engineering from Nanyang Technological University, Singapore.
25Overview
Business Review
Corporate Governance & Transparency
Portfolio Details
Sustainability
Financials & Additional Information

Corporate Governance
26CapitaLand Mall Trust
Annual Report 2016
OUR ROLEOur primary role as the manager of CMT (Manager) is to set the strategic direction of CMT and make recommendations to HSBC Institutional Trust Services (Singapore) Limited, in its capacity as trustee of CMT (Trustee), on any investment opportunities for CMT and the enhancement of the assets of CMT in accordance with the stated investment strategy for CMT. The research, evaluation and analysis required for this purpose are coordinated and carried out by us as the Manager.
As the Manager, we have general powers of management over the assets of CMT. Our primary responsibility is to manage the assets and liabilities of CMT for the benefit of the unitholders of CMT (Unitholders). We do this with a focus on generating rental income and enhancing asset value over time so as to maximise returns from the investments, and ultimately the distributions and total returns to Unitholders.
Our other functions and responsibilities as the Manager include:
(a) using our best endeavours to conduct CMT’s business in a proper and efficient manner;(b) preparing annual business plans for review by the directors of the Manager (Directors), including forecasts on
revenue, net income and capital expenditure, explanations on major variances to previous years’ financial results, written commentaries on key issues and underlying assumptions on rental rates, operating expenses and any other relevant assumptions;
(c) ensuring compliance with relevant laws and regulations, including the Listing Manual of Singapore Exchange Securities Trading Limited (SGX-ST) (Listing Manual), the Code on Collective Investment Schemes (CIS Code) issued by the Monetary Authority of Singapore (MAS) (including Appendix 6 of CIS Code (Property Funds Appendix)), the Securities and Futures Act (Chapter 289 of Singapore), written directions, notices, codes and other guidelines that MAS may issue from time to time, and the tax rulings issued by the Inland Revenue Authority of Singapore on the taxation of CMT and Unitholders;
(d) attending to all regular communications with Unitholders; and(e) supervising CapitaLand Retail Management Pte Ltd (Property Manager), the property manager which performs the
day-to-day property management functions (including leasing, marketing, promotion, coordination and property management) for CMT’s malls; with regard to Raffles City Singapore (RCS), which is held by CMT and CapitaLand Commercial Trust (CCT) in the proportions of 40.00% and 60.00% respectively, the Property Manager holds 40.00% interest in CapitaLand (RCS) Property Management Pte. Ltd. which provides property management services to RCS with CapitaLand Commercial Management Pte. Ltd., the property manager of the properties owned by CCT, holding the other 60.00%. As a result of its interest in CapitaLand (RCS) Property Management Pte. Ltd., the Property Manager is able to play a key role in directing the property management function for RCS.
The Manager also considers sustainability issues (including environmental and social factors) as part of its responsibilities. CMT’s environmental sustainability and community outreach programmes are set out on pages 58 to 77 of this Annual Report.
CMT, constituted as a trust, is externally managed by the Manager. The Manager appoints experienced and well qualified personnel to run its day-to-day operations.
The Manager was appointed in accordance with the terms of the trust deed constituting CMT and dated 29 October 2001 (as amended, varied or supplemented from time to time) (Trust Deed). The Trust Deed outlines certain circumstances under which the Manager can be removed, including by notice in writing given by the Trustee upon the occurrence of certain events, or by resolution passed by a simple majority of Unitholders present and voting at a meeting of Unitholders duly convened and held in accordance with the provisions of the Trust Deed.
The Manager is a wholly owned subsidiary of CapitaLand Limited (CL) which holds a significant unitholding interest in CMT. CL is a long-term real estate developer and investor, and has strong inherent interests in the performance of CMT. CL’s significant unitholding in CMT ensures its commitment to CMT and as a result, CL’s interest is aligned with that of other Unitholders. The Manager’s association with CL provides the following benefits, amongst other things, to CMT:
(a) stable pipeline of property assets through CL’s development activities;(b) wider and better access to banking and capital markets on favourable terms;(c) fund raising and treasury support; and(d) access to a bench of experienced management talent.

27Overview
Business Review
Corporate Governance & Transparency
Portfolio Details
Sustainability
Financials & Additional Information
OUR CORPORATE GOVERNANCE CULTUREThe Manager aspires to the highest standards of corporate governance. The Manager is committed to ongoing improvement in corporate governance. It has developed and, on an ongoing basis, maintains sound and transparent policies and practices to meet the specific business needs of CMT and to provide a firm foundation for a trusted and respected business enterprise. The Manager remains focused on complying with the substance and spirit of the principles of the Code of Corporate Governance 2012 (Code) while achieving operational excellence and delivering CMT’s long-term strategic objectives. The Board of Directors (Board) is responsible for the Manager’s corporate governance standards and policies, underscoring their importance to the Manager.
The Manager has received accolades from the investment community for excellence in corporate governance. More details can be found in the Investor & Media Relations section on pages 51 to 53 of this Annual Report.
This report sets out the corporate governance practices for financial year (FY) 2016 with reference to the Code. Where there are deviations from the principles and guidelines of the Code, an explanation has been provided within this Annual Report.
(A) BOARD MATTERSThe Board’s Conduct of AffairsPrinciple 1:Every company should be headed by an effective Board to lead and control the company. The Board is collectively responsible for the long-term success of the company. The Board works with Management to achieve this objective and Management remains accountable to the Board.
The Manager is led by the Board which presently comprises a majority of non-executive independent directors. This exceeds the requirements in the Code. The Board has a diversity of skills and knowledge, experience, educational background and ethnicity. Each Director brings to the Board skills, experience, insights and sound judgement which, together with his strategic networking relationships, serve to further the interests of CMT.
The Board oversees the affairs of the Manager in furtherance of the Manager’s primary responsibility to manage the assets and liabilities of CMT for the benefit of Unitholders. The Board provides leadership to the Chief Executive Officer (CEO) and the management team (Management) and sets the strategic vision, direction and long-term objectives for CMT. The CEO, assisted by Management, is responsible for the execution of the strategy for CMT and the day-to-day operation of CMT’s business.
The Board provides leadership to Management, sets strategic directions and oversees the management of CMT. The Board establishes goals for Management and monitors the achievement of these goals. It ensures that proper and effective controls are in place to assess and manage business risks and compliance with requirements under the Listing Manual, the Property Funds Appendix, as well as any other applicable guidelines prescribed by the SGX-ST, MAS or other relevant authorities, and applicable laws. It also sets the disclosure and transparency standards for CMT and ensures that obligations to Unitholders and other stakeholders are understood and met.
The Board has reserved authority to approve certain matters and these include:
(a) material acquisitions, investments and divestments;(b) issue of new units in CMT (Units);(c) income distributions and other returns to Unitholders; and(d) matters which involve a conflict of interest for a controlling Unitholder or a Director.
The Board has established various Board Committees to assist it in the discharge of its functions. These Board Committees are the Audit Committee (AC), the Corporate Disclosure Committee (CDC), the Executive Committee (EC) and the Investment Committee (IC). The composition of the various Board Committees is set out on page 47 of this Annual Report.
Each of these Board Committees operates under delegated authority from the Board, with the Board retaining overall oversight. The Board may form other Board Committees as dictated by business imperatives. Membership of the

28
Corporate Governance
CapitaLand Mall Trust
Annual Report 2016
various Board Committees is managed to ensure an equitable distribution of responsibilities among Board members, to maximise the effectiveness of the Board and to foster active participation and contribution from Board members. Diversity of experience and appropriate skills are considered in the composition of the respective Board Committees.
The Board has adopted a set of internal controls which establishes approval limits for capital expenditure, investments, divestments, bank borrowings and issuance of debt instruments. Apart from matters that specifically require the Board’s approval, the Board delegates authority for transactions below those limits to Board Committees and Management. Approval sub-limits are also provided at Management level to optimise operational efficiency.
The Board meets at least once every quarter, and as required by business imperatives. Board and Board Committee meetings are scheduled prior to the start of each financial year. Where exigencies prevent a Director from attending a Board meeting in person, the Constitution of the Manager permits the Director to participate via audio conferencing or video conferencing. The Board and Board Committees may also make decisions by way of resolutions in writing. In each meeting which discusses matters requiring the Board’s approval, all members of the Board participated in the discussions and deliberations; resolutions in writing are circulated to all Directors and are usually approved by all Directors. This principle of collective decisions adopted by the Board ensures that no individual unduly influences or dominates the decision making process.
A total of five Board meetings were held in FY 2016. A table showing the attendance record of the Directors at meetings of the Board and Board Committees in FY 2016 is set out on page 47 of this Annual Report. The Manager believes in the manifest contribution of its Directors beyond attendance at formal Board and Board Committee meetings. To judge a Director’s contributions based on his attendance at formal meetings alone would not do justice to his overall contributions, which include being accessible to Management for guidance or exchange of views outside the formal environment of Board and Board Committee meetings.
In view of the increasingly demanding, complex and multi-dimensional role of a director, the Board recognises the importance of continual training and development for its Directors to maintain their professional standards. The Manager has in place a training framework to guide and support the Manager towards meeting the objective of having a Board which comprises individuals who are competent and up-to-date with their professional knowledge and skills necessary to discharge their responsibilities. The Manager also maintains a training record to track the Directors’ professional development. The costs of training are borne by the Manager. Upon appointment, each Director is provided with a formal letter of appointment and a copy of the Directors’ Manual (which includes information on a broad range of matters relating to the role and responsibilities of a director). All Directors, upon appointment, also undergo an induction programme which focuses on orientating the Director to CMT’s business, operations, strategy, organisational structure, responsibilities of key management personnel, and financial and governance practices.
Following their appointment, Directors are provided with opportunities for continuing education in areas such as directors’ duties and responsibilities, changes to regulations and accounting standards and industry-related matters, so as to be updated on matters that affect or may enhance their performance as Directors or Board Committee members. Directors also receive on-the-job training through being engaged in actual Board work. Directors are also encouraged to undertake self-learning by reading relevant reports and journals.
Board Composition and GuidancePrinciple 2:There should be a strong and independent element on the Board, which is able to exercise objective judgement on corporate affairs independently, in particular, from Management and 10% shareholders. No individual or small group of individuals should be allowed to dominate the Board’s decision making.
The Board reviews from time to time the size and composition of the Board with a view to ensuring that the size of the Board is appropriate in facilitating effective decision making, taking into account the scope and nature of the operations of CMT and its subsidiaries (CMT Group), and that the Board has a strong independent element.
The Board presently comprises nine Directors, of whom five are independent directors. The Chairman of the Board is an independent director. Profiles of the Directors are provided on pages 18 to 23 of this Annual Report.

29Overview
Business Review
Corporate Governance & Transparency
Portfolio Details
Sustainability
Financials & Additional Information
The Board assesses the independence of each Director in accordance with the guidance in the Code. An independent director is one who has no relationship with the Manager, its related corporations, its shareholders who hold 10% or more of the voting shares of the Manager, or Unitholders who hold 10% or more of the Units in issue of CMT or its officers that could interfere, or be reasonably perceived to interfere, with the exercise of his independent business judgement. The relevant non-executive Directors, namely Mr Richard R. Magnus, Mr Ng Chee Khern, Mr Lee Khai Fatt, Kyle, Mr Fong Kwok Jen and Mr Gay Chee Cheong, had provided declarations of their independence which have been deliberated upon by the Board. The Board has also examined the different relationships identified by the Code that might impair the Director’s independence and objectivity. The Board has considered whether each of Mr Richard R. Magnus, Mr Ng Chee Khern, Mr Lee Khai Fatt, Kyle, Mr Fong Kwok Jen and Mr Gay Chee Cheong had demonstrated independence of character and judgement in the discharge of his responsibilities as a Director of the Manager in FY 2016, and is satisfied that each of Mr Magnus, Mr Ng, Mr Lee, Mr Fong and Mr Gay acted with independent judgement.
On the bases of the declarations of independence provided by the Directors and the guidance in the Code, the Board has determined that Mr Richard R. Magnus, Mr Ng Chee Khern, Mr Lee Khai Fatt, Kyle, Mr Fong Kwok Jen and Mr Gay Chee Cheong are independent directors, as defined under the Code. Each member of the Board had recused himself from deliberations on his own independence.
The Manager has established a policy that its Directors recuse themselves from voting on or participating in any discussions concerning a transaction in which they may be in a conflict of interest situation. Each of the Directors has complied with this policy and recused himself from voting on or participating in any Board deliberations on any transaction which might potentially give rise to a conflict of interest.
Chairman and Chief Executive OfficerPrinciple 3:There should be a clear division of responsibilities between the leadership of the Board and the executives responsible for managing the company’s business. No one individual should represent a considerable concentration of power.
To maintain an appropriate balance of power, increased accountability and greater capacity of the Board for independent decision making, the roles and responsibilities of the Chairman and the CEO are held by separate individuals.
The non-executive independent Chairman, Mr Richard R. Magnus, is responsible for leading the Board and ensuring that the Board is effective in all aspects of its role. The CEO, Mr Tan Wee Yan, Wilson, has full executive responsibilities over the business directions and operational decisions of CMT and is responsible for implementing CMT’s strategies and policies and conducting CMT’s business.
The Chairman is responsible for leadership of the Board and for promoting the conditions for overall effectiveness of the Board, Board Committees and individual Directors. This includes setting the agenda of the Board in consultation with the CEO and promoting constructive engagement among the Directors as well as between the Board and the CEO on strategic issues. The Chairman plays a significant leadership role by providing clear oversight, advice and guidance to the CEO and Management on strategies and business directions.
The Chairman and the CEO are not immediate family members. The separation of the roles of the Chairman and the CEO and the resulting clarity of roles provide a healthy professional relationship between the Board and Management, and facilitate robust deliberations on the business activities of CMT and the exchange of ideas and views to help shape CMT’s strategic process.
Board MembershipPrinciple 4:There should be a formal and transparent process for the appointment and re-appointment of directors to the Board.
The Board undertakes the function of a nominating committee and therefore, the Manager does not have a nominating committee. The Board performs the functions that such a committee would otherwise perform, namely, it administers nominations to the Board, reviews the structure, size and composition of the Board, and reviews the performance
30
Corporate Governance
CapitaLand Mall Trust
Annual Report 2016
and independence of Board members. The Board seeks to ensure that the composition of the Board provides an appropriate balance and diversity of skills, experience and knowledge of the industry and that the Directors, as a group, have the necessary core competencies relevant to CMT’s business. The current Board comprises individuals who are business leaders and professionals with financial, real estate, legal, investment and accounting backgrounds. The Board recognises the benefits of having a diverse Board. Diversity in the Board’s composition not only contributes to the quality of its decision making through diversity of perspectives in its boardroom deliberations, the varied backgrounds of the Directors also enable Management to benefit from their respective expertise and diverse backgrounds. The Board also considers gender an important aspect of diversity alongside factors such as the age, ethnicity and educational background of its members. The Board is committed to diversity and will continue to consider the differences in the skillsets, gender, age, ethnicity and educational background in determining the optimal composition of the Board in its Board renewal process.
In the year under review, no alternate directors were appointed. In keeping with the principle that a Director must be able to commit time to the affairs of the Manager, the Board will, generally, not approve the appointment of alternate directors.
The Board is able to undertake the functions of a nominating committee because:
(a) the Manager is a dedicated manager to CMT and in general, REITs (including CMT) generally have a more focused scope and scale of business compared to those of listed companies. For this reason, the Board’s capacity would not be unduly stretched if the responsibilities of a nominating committee were also undertaken by the Board as the Board would be able to give adequate attention to such issues;
(b) the focused scope of the business of CMT also means a manageable competency requirement for the Board such that the Board is able to manage the duties of a nominating committee; and
(c) independent directors form at least half of the Board and the Chairman is an independent director, which demonstrates that the independent directors play a substantive role, and assures the objectivity and independence of the decision making process concerning nomination. This also mitigates any concerns of conflict which can be managed by having the conflicted Directors abstain from the decision making process. Further, conflict situations are less likely to arise in matters of nomination.
The Board has adopted the following criteria and process for selecting, appointing and reappointing Directors and for reviewing the performance of Directors:
(a) The Board will at least annually carry out a review of the Board composition as well as on each occasion when an existing independent director gives notice of his intention to retire or resign. This is to assess the collective skills, knowledge and experience of Directors represented on the Board to determine whether the Board, as a whole, has the skills, knowledge and experience required to achieve the Manager’s objectives for CMT.
(b) The Board will review the suitability of any candidates put forward by any Director for appointment, having regard to the skills required and the skills represented on the Board and whether a candidate’s skills, knowledge and experience will complement the existing Board and whether he has sufficient time available to commit to his responsibilities as a Director, and whether he is a fit and proper person for the office in accordance with the Guidelines on Fit and Proper Criteria issued by MAS (which require the candidate to be, among other things, competent, honest, to have integrity and be financially sound).
(c) External consultants may be engaged from time to time to access a wide base of potential directors.(d) No member of the Board will be involved in any decision of the Board relating to his own appointment, reappointment
or assessment of independence.(e) A newly appointed Director will receive a formal appointment letter and a copy of the Directors’ Manual
(which includes information on a broad range of matters relating to the role and responsibilities of a director).(f) All Directors on appointment will undergo an induction programme to help familiarise them with matters relating
to CMT’s business and the Manager’s strategy for CMT.(g) The performance of the Board, Board Committees and Directors will be reviewed annually. (h) The Board will proactively address any issues identified in the board performance evaluation.
The adopted process takes into account the requirements in the Code that the composition of the Board, including the selection of candidates for new appointments to the Board as part of the Board’s renewal process, be determined using the following principles:

31Overview
Business Review
Corporate Governance & Transparency
Portfolio Details
Sustainability
Financials & Additional Information
(a) the Board should comprise Directors with a broad range of commercial experience, including expertise in funds management, the property industry, finance and legal fields; and
(b) at least one-third of the Board should comprise independent directors. Where, among other things, the Chairman of the Board is not an independent director, at least half of the Board should comprise independent directors.
As at least half of the Board comprises independent directors, the Manager will not be voluntarily subjecting any appointment or reappointment of directors to voting by Unitholders. The Chairman of the Board is presently an independent director. The Board intends to continue to keep to the principle that at least half of the Board shall comprise independent directors.
The Manager believes that Board renewal is a necessary and continual process, for good governance and ensuring that the Board has the skills, expertise and experience which are relevant to the evolving needs of CMT’s business; renewal or replacement of a Director therefore does not necessarily reflect his performance or contributions to date. The Board has established the guideline that an independent director will serve for a maximum of two terms for a total of about six years and any extension of term up to a period of nine years (inclusive of the initial two terms served) will be individually considered by the Board.
Guideline 4.4 of the Code recommends that the Board determine the maximum number of listed company board appointments which any director may hold and disclose this in the annual report. In view of the responsibilities of a director, the Board recognises the need for Directors to be able to devote sufficient time and attention to adequately perform their role. However, the Board has not imposed any limit as it has taken the view that, the limit on the number of listed company directorships that an individual may hold should be considered on a case-by-case basis, as a person’s available time and attention may be affected by many different factors such as whether he is in full-time employment and the nature of his other responsibilities. A director with multiple directorships is expected to ensure that sufficient attention can be and is given to the affairs of the Manager in managing the assets and liabilities of CMT for the benefit of Unitholders. The Board believes that each Director is best placed to determine and ensure that he is able to devote sufficient time and attention to discharge his duties and responsibilities as a director of the Manager, bearing in mind his other commitments. In considering the nomination of an individual for appointment, and in its annual review of each Director’s ability to commit time to the affairs of the Manager, the Board takes into account, among other things, the competing time commitments faced by any such individual with multiple board memberships as well as his other principal commitments. All Directors had confirmed that notwithstanding the number of their individual listed company board appointments and other principal commitments which each of them held, they were able to devote sufficient time and attention to the affairs of the Manager in managing the assets and liabilities of CMT for the benefit of Unitholders. The CEO who is also a Director is fully committed to the day-to-day operations of the Manager. The Board also notes that, as at the date of this Annual Report, none of the independent directors serves on more than five listed company boards. Taking into account also the attendance record of the Directors at meetings of the Board and Board Committees in FY 2016 (set out on page 47 of this Annual Report) and contributions at the Board’s deliberations and availability outside formal Board and Board Committee meetings, the Board is of the view that the current commitments of each of its Directors are reasonable and each of the Directors is able to and has been adequately carrying out his duties.
Board PerformancePrinciple 5:There should be a formal annual assessment of the effectiveness of the Board as a whole and its board committees and the contribution by each director to the effectiveness of the Board.
The Manager believes that oversight from a strong and effective board goes a long way in guiding a business enterprise to achieving success.
The Board strives to ensure that there is an optimal blend in the Board of background, experience and knowledge in business, finance and management skills critical to CMT’s business, and that each Director can bring to the Board an independent and objective perspective to enable balanced and well-considered decisions to be made in the interests of CMT.
Whilst board performance is ultimately reflected in the long-term performance of CMT, the Board believes that engaging in a regular process of self-assessment and evaluation of board performance in order to identify key strengths and areas for improvement is essential to effective stewardship and attaining success for CMT.

32
Corporate Governance
CapitaLand Mall Trust
Annual Report 2016
As part of the Manager’s commitment towards improving corporate governance, the Board has implemented a process to evaluate the effectiveness of the Board as a whole and the Board committees on an annual basis. As part of the process, questionnaires were sent to the Directors, and the results were aggregated and reported to the Chairman of the Board. The areas of evaluation covered in the survey questionnaire included Board composition, Board processes, strategy, performance and governance, access to information and Board committee effectiveness. The results of the survey were deliberated upon by the Board and the necessary follow up action taken with a view to enhancing the effectiveness of the Board in the discharge of its duties and responsibilities. Based on the survey findings, almost all the attributes in the survey areas received positive ratings.
The Board was also able to assess the Board Committees through their regular reports to the Board on their activities. In respect of individual Directors, their contributions can take different forms including providing objective perspectives on issues, facilitating business opportunities and strategic relationships, and accessibility to Management outside of the formal environment of Board and/or Board Committees meetings.
The Manager also believes that the collective Board performance and the contributions of individual Board members are also reflected in, and evidenced by, the collective and synergistic performance of the Board in discharging its responsibilities as a whole by providing proper guidance, diligent oversight and able leadership, and lending support to Management in steering CMT in the appropriate direction, as well as the long-term performance of CMT whether under favourable or challenging market conditions.
Access to InformationPrinciple 6:In order to fulfil their responsibilities, directors should be provided with complete, adequate and timely information prior to board meetings and on an on-going basis so as to enable them to make informed decisions to discharge their duties and responsibilities.
The Manager recognises the importance of providing the Board with complete, adequate and timely information prior to Board meetings and on an ongoing basis, to enable the Directors to make informed decisions to discharge their duties and responsibilities.
The Board meets regularly and Board meetings, in general, last up to half a day. At each Board meeting, the CEO provides updates on CMT’s business and operations as well as financial performance. Presentations in relation to specific business areas are also made by key executives and external consultants or experts; this allows the Board to develop a good understanding of CMT’s business and also promotes active engagement between the Board and the key executives of the Manager.
As a general rule, Board papers are sent to Board members at least five working days prior to each Board meeting, to allow members of the Board to prepare for the Board meetings and to enable discussions to focus on any questions that they may have.
In line with the Manager’s commitment to limit paper wastage and reduce its carbon footprint, the Manager no longer provides printed copies of Board papers and Directors are instead provided with tablet devices to enable them to access and read Board and Board Committee papers prior to and at meetings. This initiative also enhances data security as the papers are downloaded to the tablet devices through an encrypted channel.
In addition to providing complete, adequate and timely information to the Board on Board affairs and issues requiring the Board’s decision, Management also provides ongoing reports relating to the operational and financial performance of CMT, such as monthly management reports.
Where appropriate, informal meetings are also held for Management to brief Directors on prospective deals and potential developments in the early stages before formal Board approval is sought.
The Board has separate and independent access to Management, including the company secretary of the Manager (Company Secretary) at all times. The Company Secretary attends all Board meetings; she is the corporate governance advisor on corporate matters to the Board and Management and also attends to corporate secretarial administration matters. The Board, whether as individual Directors or as a group, is also entitled to have access to independent professional advice where required, at the Manager’s expense.
33Overview
Business Review
Corporate Governance & Transparency
Portfolio Details
Sustainability
Financials & Additional Information
The AC also meets the internal and external auditors separately at least once a year, without the presence of the CEO and Management and has unfettered access to Management for any information that it may require.
Through the training framework adopted for the professional development of the Directors, Directors also receive on a regular basis reading materials on topical matters or subjects and regulatory updates and implications; also, where appropriate, Management will also arrange briefings from industry players or consultants.
(B) REMUNERATION MATTERSProcedures for Developing Remuneration PoliciesPrinciple 7:There should be a formal and transparent procedure for developing policy on executive remuneration and for fixing the remuneration packages of individual directors. No director should be involved in deciding his own remuneration.
Level and Mix of RemunerationPrinciple 8:The level and structure of remuneration should be aligned with the long-term interest and risk policies of the company, and should be appropriate to attract, retain and motivate (a) the directors to provide good stewardship of the company, and (b) key management personnel to successfully manage the company. However, companies should avoid paying more than is necessary for this purpose.
Disclosure on RemunerationPrinciple 9:Every company should provide clear disclosure of its remuneration policies, level and mix of remuneration, and the procedure for setting remuneration, in the company’s Annual Report. It should provide disclosure in relation to its remuneration policies to enable investors to understand the link between remuneration paid to directors and key management personnel, and performance.
The Board undertakes the functions of a remuneration committee. It is able to do so because:
(a) the Manager is a dedicated manager to only CMT and in general, REITs (including CMT) have a more focused scope and scale of business compared to those of listed companies. For this reason, the Board’s capacity would not be unduly stretched by reason of it undertaking the responsibilities of a remuneration committee and the Board would be able to give adequate attention to such issues relating to remuneration matters; and
(b) the independent directors form at least half of the Board and the Chairman is an independent director, which demonstrates that the independent directors play a substantive role and assures the objectivity and independence of the decision making process concerning remuneration. This also mitigates any concerns of conflict which can be managed by having the conflicted Directors abstain from the decision making process. Further, conflict situations are less likely to arise in matters of remuneration.
In undertaking this function, the Board oversees the design and implementation of the remuneration policy and the specific remuneration packages for each Director and senior executives including the CEO. No member of the Board, however, will be involved in any decision of the Board relating to his own remuneration.
In terms of the process adopted by the Manager for developing policies on remuneration and determining the remuneration packages for Directors and executive officers, the Manager, through an independent remuneration consultant, takes into account benchmarking within the industry, as appropriate. It also considers the compensation framework of CL as a point of reference. The Manager is a subsidiary of CL which also holds a significant stake in CMT. The association with the CL group puts the Manager in a better position to attract and retain better qualified management talent; it provides an intangible benefit to the Manager such that it allows its employees to associate themselves with an established corporate group which can offer them the depth and breadth of experience and a career horizon. In FY 2016, an independent remuneration consultant, Mercer (Singapore) Pte Ltd (Mercer), was appointed to provide professional advice on Board and executive remuneration. Mercer is a global consulting leader in talent, health, retirement and investments with operations in more than 140 countries and employs more than 20,000 people globally. The consultant is not related to the Manager, its related corporations or any of its Directors.

34
Corporate Governance
CapitaLand Mall Trust
Annual Report 2016
The fixed component comprises the base salary, fixed allowances and compulsory employer contribution to an employee’s Central Provident Fund. The variable cash component comprises an annual bonus plan which is linked to the achievement of annual performance targets for each key executive. Annual performance targets are in the form of both quantitative and qualitative measures that are aligned to the business strategy for CMT Group and linked both to individual performance and the performance of CMT. The market-related benefits provided are comparable with local market practices.
For FY 2016, remuneration for key management personnel comprises a fixed component, a performance-based variable cash component, a performance-based variable equity-based component and market-related benefits. For the equity-based component, Units in CMT were awarded with effect from FY 2016, so as to better align the interest of key management personnel with the long term interest of Unitholders. In determining the actual quantum for the variable components, the Manager would take into account the achievement of performance targets such as the distribution per Unit and net property income achieved by the CMT group.
The remuneration for the CEO in bands of S$250,000, and a breakdown of the remuneration of the CEO and all of the key management personnel of the Manager in percentage terms, are provided in the Key Management Personnel’s Remuneration Table on page 47 of this Annual Report.
At present, there are only three key management personnel of the Manager (including the CEO). The Manager outsources various other services to CapitaLand Mall Asia Limited (CMA) which provides the services through its employees (Outsourced Personnel), in order to provide flexibility and maximise efficiency in resource management to match the needs of CMT from time to time, as well as to leverage on economies of scale and tap on the management talent of an established corporate group which can offer enhanced depth and breadth of experience. However, notwithstanding the outsourcing arrangement, the responsibility for due diligence, oversight and accountability continues to reside with the Board and Management. In this regard, the remuneration of such Outsourced Personnel, being employees of CMA, is not included as part of the disclosure of remuneration of key management personnel of the Manager in this Annual Report.
Business Alignment
• Focus on generating rental income and enhancing asset value over time so as to maximise returns from investments and ultimately the distributions and total returns to Unitholders
• Provide sound, structured funding to ensure affordability and cost-effectiveness in line with performance goals
• Enhance retention of key talents to build strong organisational capabilities
Fair & Appropriate
• Ensure competitive remuneration relative to the appropriate external talent markets
• Manage internal equity such that remuneration systems are viewed as fair
• Significant and appropriate portion of pay-at-risk, taking into account risk policies for CMT Group, symmetrical with risk outcomes and sensitive to the risk time horizon
Effective Implementation
• Maintain rigorous corporate governance standards
• Exercise appropriate flexibility to meet strategic business needs and practical implementation considerations
• Facilitate employee understanding to maximise the value of the remuneration programmes
Motivate Right Behaviour• Pay for performance – align, differentiate and balance rewards according to multiple dimensions of performance
• Strengthen line-of-sight linking rewards and performance goals
The principles governing the Manager’s key management personnel remuneration policy are as follows:

35Overview
Business Review
Corporate Governance & Transparency
Portfolio Details
Sustainability
Financials & Additional Information
N.A.: Not Applicable.
1 Inclusive of attendance fees of (a) S$2,000 per meeting attendance in person, (b) S$1,700 per meeting attendance via audio conferencing or video conferencing, and (c) S$1,000 per meeting attendance at project and verification meetings subject to a maximum of S$10,000 per Director per annum.
2 Each non-executive Director (save for non-executive Directors who are employees of CL) shall receive up to 20% of his Directors’ fees in the form of Units (subject to truncation adjustments). The remainder of the Directors’ fees shall be paid in cash. No new Units will be issued for this purpose as these Units will be paid by the Manager from the Units it holds.
3 Mr Danny Teoh Leong Kay resigned as Director, Chairman of the Board, Chairman of the Corporate Disclosure Committee and a Member of the Investment Committee with effect from 1 May 2016.
4 Mr Richard R. Magnus was appointed as Chairman of the Board and Chairman of the Corporate Disclosure Committee with effect from 1 May 2016.
5 Non-executive Directors who are employees of CL do not receive Directors’ fees. 6 All Director’s fees payable to Ng Chee Khern, a public officer, will be paid in cash to a government agency, The Directorship & Consultancy
Appointments Council.7 Mr Lang Tao Yih, Arthur was appointed as Director and a Member of the Audit Committee and the Executive Committee with effect from 1 May 2016.
Mr Lang resigned as Director and ceased to be a Member of the Audit Committee and the Executive Committee with effect from 31 December 2016.
Board Members FY 2016 FY 2015
Danny Teoh Leong Kay3 S$48,666 S$145,000
Richard R. Magnus4 S$111,667 S$65,000
Lim Ming Yan N.A.5 N.A.5
Tan Wee Yan, Wilson N.A. N.A.
Tan Kian Chew S$54,000 S$59,000
Ng Chee Khern6 S$53,000 S$57,000
Lee Khai Fatt, Kyle S$102,000 S$110,000
Fong Kwok Jen S$77,000 S$84,000
Gay Chee Cheong S$76,000 S$84,000
Jason Leow Juan Thong N.A.5 N.A.5
Lang Tao Yih, Arthur7 N.A.5 N.A.5
Directors’ Fees1,2
Non-executive Directors (save for Directors who are employees of CL) receive Directors’ fees which are payable by way of cash and Units. The Manager believes that the payment of a portion of the Directors’ fees in Units will serve to align the interests of such Directors with that of Unitholders and CMT’s long-term growth and value.
The Manager has decided (a) to disclose the CEO’s remuneration in bands of S$250,000 (instead of on a quantum basis), and (b) not to disclose the remuneration of the key management personnel of the Manager (whether in bands of S$250,000 or otherwise). In arriving at its decision, it took into account the commercial sensitivity and confidential nature of remuneration matters. The Manager is of the view that disclosure in such manner is not prejudicial to the interests of Unitholders as the indicative range for the CEO’s remuneration, as well as the total remuneration for the CEO and key management personnel of the Manager, is made known to Unitholders, and sufficient information is provided on the Manager’s remuneration framework to enable Unitholders to understand the link between CMT’s performance and the remuneration of the CEO and key management personnel. In addition, the remuneration of the CEO and key management personnel of the Manager is paid out of the fees that the Manager receives (of which the quantum and basis have been disclosed), rather than the assets of CMT.
There were no employees of the Manager who were immediate family members of a Director or the CEO in FY 2016. ‘Immediate family member’ refers to the spouse, child, adopted child, step-child, sibling or parent of the individual.
The Directors’ fees for FY 2016 are shown in the table below. The CEO as an executive director does not receive any fees for serving as a Director. Instead, he is remunerated as part of the key management personnel of the Manager. Directors’ fees are a fixed sum and generally comprise a basic retainer fee as a Director, an additional fee for serving on any of the Board Committees and an attendance fee for participation in meetings of the Board and any of the Board Committees, project meetings and verification meetings. The remuneration framework for the non-executive Directors remains unchanged from that for the previous financial year.

36
Corporate Governance
CapitaLand Mall Trust
Annual Report 2016
(C) ACCOUNTABILITY AND AUDITAccountabilityPrinciple 10:The Board should present a balanced and understandable assessment of the company’s performance, position and prospects.
The Manager provides Unitholders with quarterly and annual financial statements within the relevant periods prescribed by the Listing Manual after they are reviewed by the AC and approved by the Board. These financial statements are accompanied by news releases issued to the media and which are also posted on SGXNet. Through the annual and quarterly financial statements, the Board aims to provide Unitholders with a balanced, clear and understandable assessment of CMT’s performance, position and prospects. In order to achieve this, Management provides the Board with management accounts on a monthly basis and such explanation and information as any Director may require, to enable the Directors to keep abreast, and make a balanced and informed assessment, of CMT’s financial performance, position and prospects.
In addition, the Manager announces information relating to the performance and changes in CMT which are likely to materially affect the price or value of Units, on a timely and consistent basis, so as to assist investors in their investment decisions.
The Manager believes in conducting itself in ways that seek to deliver maximum sustainable value to Unitholders. Best practices are promoted as a means to build an excellent business for Unitholders and the Manager is accountable to Unitholders for CMT’s performance. Prompt fulfilment of statutory and regulatory reporting requirements is but one way to maintain Unitholders’ confidence and trust in the capability and integrity of the Manager.
Risk Management and Internal ControlsPrinciple 11:The Board is responsible for the governance of risk. The Board should ensure that Management maintains a sound system of risk management and internal controls to safeguard shareholders’ interests and the company’s assets, and should determine the nature and extent of the significant risks which the Board is willing to take in achieving its strategic objectives.
The Manager has in place an adequate and effective system of internal controls addressing material financial, operational, compliance and information technology risks to safeguard Unitholders’ interests and CMT’s assets. The Board has overall responsibility for the governance of risk and oversees the Manager in the design, implementation and monitoring of the risk management and internal controls systems. The AC assists the Board in carrying out the Board’s responsibility of overseeing the risk management framework and policies of CMT Group. The AC is guided by its terms of reference, in particular, the AC:
(a) makes recommendations to the Board on Risk Appetite Statement (RAS) for CMT Group; (b) assesses the adequacy and effectiveness of the risk management and internal controls systems established by the
Manager to manage risks;(c) oversees Management in the formulation, updating and maintenance of an adequate and effective risk management
framework, policies and strategies for managing risks that are consistent with CMT Group’s risk appetite and reports to the Board on its decisions on any material matters concerning the aforementioned;
(d) makes the necessary recommendations to the Board such that an opinion relating to the adequacy and effectiveness of the risk management and internal controls system can be made by the Board in the annual report of CMT in accordance with the Listing Manual and the Code; and
(e) considers and advises on risk matters referred to it by Management or the Board including reviewing and reporting to the Board on any material breaches of the RAS, any material non-compliance with the approved framework and policies and the adequacy of any proposed action.

37Overview
Business Review
Corporate Governance & Transparency
Portfolio Details
Sustainability
Financials & Additional Information
The Manager adopts an Enterprise Risk Management (ERM) Framework which sets out the required environmental and organisational components for managing risk in an integrated, systematic and consistent manner. The ERM Framework and related policies are reviewed annually. The Manager consistently seeks to improve and strengthen its ERM Framework. As part of the ERM Framework, the Manager, among other things, undertakes and performs a Risk and Control Self-Assessment (RCSA) process. As a result of the RCSA process, the Manager produces and maintains a risk register which identifies the material risks CMT Group faces and the corresponding internal controls it has in place to manage or mitigate those risks. The material risks are reviewed annually by the AC and the Board. The AC also reviews the approach of identifying and assessing risks and internal controls in the risk register. The system of risk management and internal controls is reviewed and, where appropriate, refined regularly by the Manager, the AC and the Board. Where relevant, reference is made to the best practices and guidance in the Risk Governance Guidance for Listed Boards issued by the Corporate Governance Council. The Manager has established an approach on how risk appetite is defined, monitored and reviewed for CMT Group. Approved by the Board, CMT Group’s RAS addresses the management of material risks faced by CMT Group. Alignment of CMT Group’s risk profile to the RAS is achieved through various communication and monitoring mechanisms put in place across the various functions within the Manager. More information on the Manager’s ERM Framework can be found in the Enterprise Risk Management section on pages 48 to 50 of this Annual Report.
Internal and external auditors conduct reviews that involve testing the effectiveness of the material internal controls for CMT Group addressing financial, operational, compliance and information technology risks. This includes testing, where practicable, material internal controls in areas managed by external service providers. Any material non-compliance or lapses in internal controls together with corrective measures recommended by the internal and external auditors are reported to and reviewed by the AC. The adequacy and effectiveness of the measures taken by the Manager in response to the recommendations made by the internal and external auditors are also reviewed by the AC. The Board has received assurance from the CEO and the Head, Finance of the Manager that: (a) the financial records of CMT Group have been properly maintained and the financial statements for the year ended
31 December 2016 give a true and fair view of CMT Group’s operations and finances; and (b) the system of risk management and internal controls in place for CMT Group is adequate and effective in addressing
the material risks faced by CMT Group in its current business environment including material financial, operational, compliance and information technology risks. The CEO and the Head, Finance of the Manager have obtained similar assurance from the respective risk and control owners.
In addition, in FY 2016, the Board has received quarterly certification by Management on the integrity of financial reporting and the Board has provided a negative assurance confirmation to Unitholders as required by the Listing Manual. Based on the ERM Framework established and the reviews conducted by Management and both the internal and external auditors, as well as the assurance from the CEO and the Head, Finance of the Manager, the Board concurs with the recommendation of the AC and is of the opinion, that the system of risk management and internal controls addressing material financial, operational, compliance and information technology risks established by the Manager is adequate and effective to meet the needs of CMT Group in its current business environment as at 31 December 2016.

38
Corporate Governance
CapitaLand Mall Trust
Annual Report 2016
The Board notes that the system of risk management and internal controls established by the Manager provides reasonable, but not absolute, assurance that CMT Group, as it strives to achieve its business objectives, will not be significantly affected by any event that can be reasonably foreseen or anticipated. The Board notes that no system of risk management and internal controls can provide absolute assurance in this regard, or absolute assurance against poor judgement in decision making, human error, losses, fraud or other irregularities.
Audit CommitteePrinciple 12:The Board should establish an Audit Committee with written terms of reference which clearly set out its authority and duties.
At present, all the members of the AC, including the Chairman of the AC, are independent directors. The members bring with them invaluable recent and relevant managerial and professional expertise in accounting and related financial management domains. None of the AC members was previously a partner of the incumbent external auditors, KPMG LLP (KPMG), within the previous 12 months, nor do any of the AC members hold any financial interest in KPMG.
The AC has explicit authority to investigate any matter within its terms of reference. Management is required to provide the fullest co-operation in providing information and resources, and in implementing or carrying out all requests made by the AC. The AC has direct access to the internal and external auditors and full discretion to invite any Director or executive officer to attend its meetings. Similarly, both the internal and external auditors are given unrestricted access to the AC.
The AC is guided by its terms of reference, in particular, the AC:
(a) reviews the significant financial reporting issues and judgements so as to ensure the integrity of the financial statements of CMT Group and any announcements relating to CMT Group’s financial performance;
(b) reviews and reports to the Board at least annually the adequacy and effectiveness of the Manager’s internal controls, including financial, operational, compliance and information technology controls, and risk management systems;
(c) reviews the effectiveness of the Manager’s internal audit and compliance functions;(d) reviews the scope and results of the external audit and independence and objectivity of the external auditors;(e) makes recommendations to the Board on the proposals to Unitholders on the appointment, re-appointment and
removal of the external auditors, and approving the remuneration of the external auditors; (f) reviews and approves processes to regulate transactions involving an Interested Person (as defined in Chapter 9
of the Listing Manual) and/or Interested Party (as defined in the Property Funds Appendix) (each, an Interested Person) and CMT and/or its subsidiaries (Interested Person Transactions) to ensure compliance with the applicable regulations. The regulations include the requirement that the transactions are on normal commercial terms and are not prejudicial to the interests of CMT and its minority Unitholders. In respect of any property management agreement which is an Interested Person Transaction, the AC also carries out reviews at appropriate intervals to satisfy itself that the Manager has reviewed the Property Manager’s compliance with the terms of the property management agreement and has taken remedial actions where necessary; and
(g) reviews the policy and arrangements by which employees of the Manager and any other persons may, in confidence, report suspected fraud or irregularity or suspected infringement of any laws or regulations or rules, or raise concerns about possible improprieties in matters of financial reporting or other matters with a view to ensuring that arrangements are in place for such concerns to be raised and independently investigated, and for appropriate follow-up action to be taken.
In the review of the financial statements, the AC has discussed with Management the accounting principles that were applied and their judgement of items that might affect the integrity of the financial statements and considered the clarity of key disclosures in the financial statements. The AC reviewed, amongst other matters, the following significant matter identified by external auditors for the financial year ended 31 December 2016.

39Overview
Business Review
Corporate Governance & Transparency
Portfolio Details
Sustainability
Financials & Additional Information
The AC has reviewed the nature and extent of non-audit services provided by the external auditors during FY 2016 and the fees paid for such services. The AC is satisfied that the independence of the external auditors has not been impaired by the provision of those services. The external auditors have also provided confirmation of their independence to the AC. The aggregate amount of fees paid and payable to the external auditors for FY 2016 was approximately S$381,000 of which audit fees and audit related fees amounted to approximately S$374,000 and non-audit fees amounted to approximately S$7,000.
In FY 2016, the AC also met with the internal and external auditors, without Management’s presence, to discuss the reasonableness of the financial reporting process, the system of internal controls, and the significant comments and recommendations by the auditors. Where relevant, the AC makes reference to the best practices and guidance in the Guidebook for Audit Committees in Singapore and the practice directions issued from time to time in relation to the Financial Reporting Surveillance Programme administered by the Accounting and Corporate Regulatory Authority of Singapore.
In FY 2016, changes to accounting standards and accounting issues which have a direct impact on the financial statements were reported to and discussed with the AC at its meetings.
The Manager confirms, on behalf of CMT, that CMT complies with Rule 712 and Rule 715 of the Listing Manual.
Internal AuditPrinciple 13:The company should establish an effective internal audit function that is adequately resourced and independent of the activities it audits.
The Manager has in place an internal audit function supported by CL’s Internal Audit Department (CL IA) which reports directly to the AC and administratively to the CEO. CL IA plans its internal audit schedules in consultation with, but independently of, Management and its plan is submitted to the AC for approval prior to the beginning of each year. The AC also meets with CL IA at least once a year without the presence of Management. CL IA has unfettered access to the Manager’s documents, records, properties and employees, including access to the AC.
CL IA is a corporate member of the Singapore branch of the Institute of Internal Auditors Inc. (IIA), which has its headquarters in the United States of America. CL IA subscribes to, and is guided by, the International Standards for the Professional Practice of Internal Auditing (Standards) developed by the IIA and has incorporated these Standards into its audit practices. With respect to FY 2016, the AC has reviewed and is satisfied as to the adequacy and effectiveness of the IA function.
To ensure that internal audits are performed by competent professionals, CL IA recruits and employs suitably qualified professional staff with the requisite skill sets and experience.
CL IA identifies and provides training and development opportunities for its staff to ensure that their technical knowledge and skill sets remain current and relevant.
Significant matter How the AC reviewed the matter and what decisions were made
Valuation of investment properties and investment properties under development
The AC considered the valuation methodologies applied by the valuers for investment properties and investment properties under development and also evaluated the valuers’ objectivity and competency.
The valuers are changed every two years to provide fresh perspectives to the valuation process. This practice has been consistently adhered to over time.
The AC held discussions with the Management and external auditors to review the valuation methodologies including the reasonableness of the capitalisation rates, discount rates and estimated development costs adopted by the valuers.
The valuation of investment properties and investment properties under development was also an area of focus for the external auditors.
No significant matter came to the attention of the AC in the course of the review.

40
Corporate Governance
CapitaLand Mall Trust
Annual Report 2016
(D) SHAREHOLDER RIGHTS AND RESPONSIBILITIESShareholder RightsPrinciple 14:Companies should treat all shareholders fairly and equitably, and should recognise, protect and facilitate the exercise of shareholders’ rights, and continually review and update such governance arrangements.
The Manager is committed to treating all Unitholders fairly and equitably.
All Unitholders enjoy specific rights under the Trust Deed and the relevant laws and regulations. These rights include, among other things, the right to participate in profit distributions. They are also entitled to attend general meetings and are accorded the opportunity to participate effectively and vote at general meetings (including through proxies, if they are unable to attend in person, or if their Units are held through corporations). More information on unitholder participation in general meetings can be found in the section on Principle 16: Conduct of Shareholder Meetings of this Corporate Governance Report. Communication with ShareholdersPrinciple 15:Companies should actively engage their shareholders and put in place an investor relations policy to promote regular, effective and fair communication with shareholders.
The Manager is committed to keeping all Unitholders and other stakeholders and analysts informed of the performance and changes in CMT or its business which would be likely to materially affect the price or value of the Units, on a timely and consistent basis, so as to facilitate the investment decisions of Unitholders and investors.
The Manager has in place an Investor Relations and Corporate Communications team which facilitates effective communication with Unitholders, analysts, fund managers and the media.
The Manager actively engages with Unitholders and has put in place a Unitholders’ Communication and Investor Relations Policy (Policy) to promote regular, effective and fair communications with Unitholders. The Policy is available on CMT’s website at www.cmt.com.sg.
The Board has established the CDC which assists the Board in the discharge of its function to meet the obligations arising under the laws and regulations of Singapore relating to and to conform to best practices in the corporate disclosure and compliance process. The views and approval of the CDC were sought throughout the year through emails on various announcements and news releases.
More information on the Manager’s investor and media relations with Unitholders can be found in the Investor & Media Relations section on pages 51 to 53 of this Annual Report and the Policy which is available on CMT’s website.
CMT is included in the Straits Times Index (STI), the primary Singapore equity market barometer. It is also included in other key indices which are widely tracked and referred to by international fund managers as performance benchmarks in the selection and monitoring of investments.
CMT’s distribution policy is to distribute at least 90.0% of its taxable income (other than gains from the sale of real estate properties by CMT which are determined to be trading gains), with the actual level of distribution to be determined at the Manager’s discretion.
41Overview
Business Review
Corporate Governance & Transparency
Portfolio Details
Sustainability
Financials & Additional Information
Conduct of Shareholder MeetingsPrinciple 16:Companies should encourage greater shareholder participation at general meetings of shareholders, and allow shareholders the opportunity to communicate their views on various matters affecting the company.
The Manager supports the principle of encouraging Unitholders’ participation and voting at general meetings. Unitholders receive a CD containing the CMT annual report (printed copies are available upon request) and notice of the annual general meeting. As and when an extraordinary general meeting is to be held, Unitholders will receive a copy of the circular which contains details of the matters to be proposed for Unitholders’ consideration and approval. Notices of the general meetings are also advertised in the press and issued via SGXNet. The requisite notice period for general meeting is adhered to. All Unitholders are given the opportunity to participate effectively in and vote at general meetings.
At general meetings, Unitholders are encouraged to communicate their views and discuss with the Board and Management matters affecting CMT. Representatives of the Trustee, Directors (including the chairpersons of the Board and the AC), the Manager’s senior management and the external auditors of CMT, would usually be present at general meetings to address any queries from Unitholders.
To safeguard Unitholders’ interests and rights, a separate resolution is proposed for each substantially separate issue at general meetings. To ensure transparency in the voting process and better reflect Unitholders’ interest, the Manager conducts electronic poll voting for Unitholders/ proxies present at the general meetings for all the resolutions proposed at the general meetings. Voting results and vote tabulation procedures are disclosed at the general meetings. An independent scrutineer is also appointed to validate the vote tabulation procedures. Votes cast for or against each resolution, and the respective percentages thereof, are tallied and displayed ‘live on-screen’ to Unitholders immediately at the general meetings. The total number of votes cast for or against the resolutions and the respective percentages are announced on SGXNet after the general meetings. Voting in absentia and by email which are currently not permitted may only be possible following careful study to ensure that the integrity of information and authentication of the identity of Unitholders through the web are not compromised, and legislative changes are effected to recognise remote voting.
Minutes of the general meetings recording the substantive and relevant comments made and questions raised by Unitholders are taken and are available to Unitholders for their inspection upon request. Minutes of annual general meetings are also available on CMT’s website at www.cmt.com.sg.
Unitholders also have the opportunity to communicate their views and discuss with the Board and Management matters affecting CMT after the general meetings.
(E) ADDITIONAL INFORMATIONAdditional Committees
Apart from the AC and CDC, the Board has also established an EC and IC.
The EC oversees the day-to-day activities of the Manager and that of CMT, on behalf of the Board. The EC is guided by its terms of reference, in particular, the EC:
(a) approves specific budgets for capital expenditure on development projects, acquisitions and enhancements/upgrading of properties within its approved financial limits;
(b) reviews management reports and operating budgets; and(c) awards contracts for development projects.
The members of the EC also meet informally during the course of the year.
The IC is guided by its terms of reference, in particular, the IC reviews proposals on and, where it considers appropriate, approve proposals on investments and divestments of CMT within the authorities or limits approved from time to time by the Board.

42
Corporate Governance
CapitaLand Mall Trust
Annual Report 2016
Interested Person Transactions1Approving Authority, Procedures and Disclosure
Below S$100,000 per transaction • Trustee
S$100,000 and above per transaction (which singly, or when aggregated with other transactions2 with the same Interested Person in the same financial year is less than 3.0% of CMT’s latest audited net tangible assets/net asset value)
• Trustee• Audit Committee
Transaction2 which:
(a) is equal to or exceeds 3.0% of CMT’s latest audited net tangible assets/net asset value; or
(b) when aggregated with other transactions2 with the same Interested Person in the same financial year is equal to or exceeds 3.0% of CMT’s latest audited net tangible assets/net asset value
• Trustee• Audit Committee• Immediate announcement
Transaction2 which:
(a) is equal to or exceeds 5.0% of CMT’s latest audited net tangible assets/net asset value; or
(b) when aggregated with other transactions2,3 with the same Interested Person in the same financial year is equal to or exceeds 5.0% of CMT’s latest audited net tangible assets/net asset value
• Trustee • Audit Committee• Unitholders3
• Immediate announcement
1 This table does not include the procedures applicable to interested person transactions falling under the exceptions set out in Rules 915 and 916 of the Listing Manual.
2 Any transaction of less than S$100,000 in value is disregarded. 3 In relation to approval by Unitholders for transactions that are equal to or exceed 5.0% of CMT’s latest audited net tangible assets/net asset value
(whether singly or aggregated), any transaction which has been approved by Unitholders, or is the subject of aggregation with another transaction that has been approved by Unitholders, need not be included in any subsequent aggregation.
Dealings with Interested PersonsReview Procedures for Interested Person Transactions
The Manager has established internal control procedures to ensure that all Interested Person Transactions are undertaken on an arm’s length basis and on normal commercial terms, which are generally no more favourable than those extended to unrelated third parties, and are not prejudicial to the interests of CMT and Unitholders. In respect of such transactions, the Manager would have to demonstrate to the AC that such transactions are undertaken on normal commercial terms and are not prejudicial to the interests of CMT and Unitholders which may include obtaining (where practicable) third party quotations or obtaining valuations from independent valuers (in accordance with applicable provisions of the Listing Manual and the Property Funds Appendix). The internal control procedures also ensure compliance with Chapter 9 of the Listing Manual and the Property Funds Appendix.
In particular, the procedures in place include the following:

43Overview
Business Review
Corporate Governance & Transparency
Portfolio Details
Sustainability
Financials & Additional Information
Role of the Audit Committee for Interested Person TransactionsThe Manager’s internal control procedures are intended to ensure that Interested Person Transactions are conducted at arm’s length and on normal commercial terms, and are not prejudicial to CMT and Unitholders’ interests.
The Manager maintains a register to record all Interested Person Transactions which are entered into by CMT (and the basis on which they are entered into, including the quotations obtained to support such basis). All Interested Person Transactions are subject to regular periodic reviews by the AC, which in turn obtains advice from CL IA, to ascertain that the guidelines and procedures established to monitor Interested Person Transactions, including the relevant provisions of the Listing Manual and the Property Funds Appendix, as well as any other guidelines which may from time to time be prescribed by the SGX-ST, MAS or other relevant authorities, have been complied with. The review includes an examination of the nature of the transaction and its supporting documents or such other information deemed necessary by the AC. If a member of the AC has an interest in a transaction, he is to abstain from participating in the review and approval process in relation to that transaction. In addition, the Trustee also reviews such audit reports to ascertain that the Listing Manual and the Property Funds Appendix have been complied with.
Details of all Interested Person Transactions (equal to or exceeding S$100,000 each in value) entered into by CMT in FY 2016 are disclosed on pages 215 to 216 of this Annual Report.
Dealing with Conflicts of InterestThe following principles and procedures have been established to deal with potential conflicts of interest which the Manager (including its Directors, executive officers and employees) may encounter in managing CMT:
(a) the Manager will not manage any other REIT or be involved in any other real property business;(b) all resolutions at meetings of the Board in relation to matters concerning CMT must be decided by a majority vote
of the Directors, including at least one independent director;(c) in respect of matters in which CL and/or its subsidiaries have an interest, whether direct or indirect, any nominees
appointed by CL and/or its subsidiaries to the Board will abstain from voting. In such matters, the quorum must comprise a majority of the independent directors and shall exclude such nominee Directors of CL and/or its subsidiaries;
(d) in respect of matters in which a Director or his associates have an interest, whether direct or indirect, such interested Director will abstain from voting. In such matters, the quorum must comprise a majority of the Directors and shall exclude such interested Director(s);
(e) if the Manager is required to decide whether or not to take any action against any person in relation to any breach of any agreement entered into by the Trustee for and on behalf of CMT with an affiliate of the Manager, the Manager is obliged to consult with a reputable law firm (acceptable to the Trustee) which shall provide legal advice on the matter. If the said law firm is of the opinion that the Trustee, on behalf of CMT, has a prima facie case against the party allegedly in breach under such agreement, the Manager is obliged to pursue the appropriate remedies under such agreement; and
(f) at least one-third of the Board shall comprise independent directors.
Additionally, CMT has been granted a right of first refusal by CapitaLand Mall Asia Limited (CMA) to purchase all retail income-producing properties located in Singapore with certain specified characteristics which may in the future be identified and targeted for acquisition by CMA or any of its subsidiaries.
In respect of voting rights where the Manager would face a conflict between its own interests and that of Unitholders, the Manager shall cause such voting rights to be exercised according to the discretion of the Trustee.
44
Corporate Governance
CapitaLand Mall Trust
Annual Report 2016
Dealings in SecuritiesThe Manager has devised and adopted a securities dealing policy for the Manager’s officers and employees which applies the best practice recommendations in the Listing Manual. To this end, the Manager has issued guidelines to its Directors and employees as well as certain relevant executives of the CL group which set out prohibitions against dealings in CMT Group’s securities (i) while in possession of material unpublished price sensitive information, (ii) during the two weeks immediately preceding, and up to the time of the announcement of, CMT’s financial statements for each of the first three quarters of CMT’s financial year, and (iii) during one month immediately preceding, and up to the time of the announcement of, CMT’s financial statements for the full financial year. Prior to the commencement of each relevant period, an email would be sent out to all Directors and employees of the Manager as well as certain relevant executives of the CL group to inform them of the duration of the period. The Manager will also not deal in CMT Group’s securities during the same period. In addition, employees and Capital Markets Services Licence Appointed Representatives of the Manager are required to give pre-trading notification to the CEO and Compliance department before any dealing in CMT Group’s securities.
Directors and employees of the Manager as well as certain relevant executives of the CL group are also prohibited from dealing in securities of CMT Group if they are in possession of unpublished price sensitive information of CMT Group. As and when appropriate, they would be issued an advisory to refrain from dealing in CMT Group’s securities.
Under the policy, Directors and employees of the Manager as well as certain relevant executives of the CL group are also discouraged to trade on short-term or speculative considerations. They are also prohibited from using any information with respect to other companies or entities obtained in the course of their employment in connection with securities transactions of such companies or entities.
Fees payable to the ManagerUnder the CIS Code issued by MAS, where fees are payable out of the deposited property of a property fund, the methodology and justifications for each type of fees payable should be disclosed. The methodology for computing the fees payable to the Manager is contained in Clause 23 of the Trust Deed, details of which are disclosed under the Notes to Financial Statements.
The management fees are fees earned by the Manager for the management of CMT’s portfolio. The management fees should be viewed holistically as a whole which comprise two components, namely the Base Fee and Performance Fee, which are elaborated further below:
Base FeeThe Base Fee, which is contained in Clause 23(A)(iii) of the Trust Deed, enables the Manager to cover operational and administrative overheads incurred in the management of the portfolio. The Base Fee is calculated at a percentage of asset value as the asset value provides an appropriate metric to determine the resources for managing the assets. The Base Fee is payable on a quarterly basis.
Performance Fee The Performance Fee, which is contained in Clause 23(A)(iv) of the Trust Deed, is based on objective benchmarks that are aligned with the interests of Unitholders as a whole - in this case, Net Property Income. This serves as motivation for and provides the Manager with the incentive to enhance Net Property Income on a long-term and sustainable basis through efficient portfolio management, astute cost management and effective use of debt and equity. This can be achieved by proactive organic and external growth strategies such as asset enhancement initiatives, acquisitions, developments and divestments to continually refresh the portfolio and sustain income accretions. Taking on short-term risks of deferring asset enhancement initiatives or repairs and maintenance is deterred as the Manager strives to achieve sustainability.
The pegging of the Performance Fee to Net Property Income also aligns the Manager with the interests of Unitholders as the Manager’s compensation is commensurate with the value the Manager delivers to Unitholders as a whole in the form of distributable income which is also derived from Net Property Income and as evidenced by the Manager achieving an optimal percentage of the overall fees to total assets of 0.4%. The Performance Fee is payable on an annual basis.

45Overview
Business Review
Corporate Governance & Transparency
Portfolio Details
Sustainability
Financials & Additional Information
In addition, the Manager is also paid an Acquisition Fee or a Divestment Fee upon the successful completion of an acquisition or divestment respectively. Further details on the Acquisition Fee and the Divestment Fee are provided below:
Acquisition FeeThe Acquisition Fee, which is contained in Clause 23(B)(i) of the Trust Deed, is earned by the Manager upon the successful completion of an acquisition. This fee seeks to motivate and compensate the Manager for its efforts expended to continually seek out and acquire assets to increase long term returns for Unitholders. In addition, the Acquisition Fee allows the Manager to recover the additional costs and resources incurred by the Manager in the course of seeking out new acquisition opportunities, including but not limited to, due diligence efforts and man hours spent in evaluating the transaction.
As required by the Property Funds Appendix, where the Acquisition Fee is to be paid to the Manager for the acquisition of assets from an interested party, the Acquisition Fee is to be paid in the form of Units at the prevailing market price, which should not be sold for a period of one year from their date of issuance. As the Manager’s interest is closely tied to the performance of CMT, in this regard, this helps to ensure that any acquisitions from interested parties perform and contribute to Unitholders’ returns.
Divestment FeeThe Divestment Fee, which is contained in Clause 23(B)(i) of the Trust Deed, is earned by the Manager upon the successful completion of a divestment. This fee seeks to motivate and compensate the Manager for its efforts expended to maximise value received by CMT in the event of a divestment. In addition, the Divestment Fee allows the Manager to recover the additional costs and resources incurred by the Manager for the divestment, including but not limited to due diligence efforts and man hours spent in marketing and maximising the divestment price.
As required by the Property Funds Appendix, where the Divestment Fee is to be paid to the Manager for the divestment of assets to an interested party, the Divestment Fee is to be paid in the form of Units at the prevailing market price, which should not be sold for a period of one year from their date of issuance.
(F) CODE OF BUSINESS CONDUCTThe Manager adheres to an ethics and code of business conduct policy which deals with issues such as confidentiality, conduct and work discipline, corporate gifts and concessionary offers. Clear policies and guidelines on how to handle workplace harassment and grievances are also in place.
The policies and guidelines are published on CL’s Intranet which is accessible by all employees of the Manager.
The policies that the Manager has implemented aim to help to detect and prevent occupational fraud in mainly three ways.
First, the Manager offers fair compensation packages, based on practices of pay-for-performance and promotion based on merit to its employees. The Manager also provides various healthcare subsidies and financial assistance schemes to alleviate the common financial pressures its employees face.
Second, clearly documented policies and work procedures incorporate internal controls which ensure that adequate checks and balances are in place. Periodic audits are also conducted to evaluate the efficacy of these internal controls.
Finally, the Manager seeks to build and maintain the right organisational culture through its core values, educating its employees on good business conduct and ethical values.
46
Corporate Governance
CapitaLand Mall Trust
Annual Report 2016
Bribery and Corruption Prevention PolicyThe Manager adopts a strong stance against bribery and corruption. In addition to clear guidelines and procedures for the giving and receipt of corporate gifts and concessionary offers, all employees of the Manager are required to make a declaration on an annual basis where they pledge to uphold the Manager’s core values and not to engage in any corrupt or unethical practices. This serves as a reminder to all employees to maintain the highest standards of integrity in their work and business dealings.
The Manager’s zero tolerance policy towards bribery and corruption extends to its business dealings with third parties. Pursuant to this policy, the Manager requires that certain agreements incorporate anti-bribery and anti-corruption provisions.
Whistle-Blowing PolicyA whistle-blowing policy and other procedures are put in place to provide employees of the Manager and parties who have dealings with the Manager with well defined, accessible and trusted channels to report suspected fraud, corruption, dishonest practices or other improprieties in the workplace, and for the independent investigation of any reported incidents and appropriate follow up action. The objective of the whistle-blowing policy is to encourage the reporting of such matters so that employees or external parties making any reports in good faith will be able to do so with the confidence that they will be treated fairly and, to the fullest extent possible, be protected from reprisal.
Anti-Money Laundering and Countering the Financing of Terrorism MeasuresAs a holder of a Capital Markets Services licence issued by MAS, the Manager abides by the MAS’ guidelines on the prevention of money laundering and countering the financing of terrorism. Under these guidelines, the main obligations of the Manager are:
(a) evaluation of risk;(b) customer due diligence;(c) suspicious transaction reporting;(d) record keeping;(e) employee screening and representative screening; and(f) training.
The Manager has developed and implemented a policy on the prevention of money laundering and terrorist financing and is alert at all times to suspicious transactions. Where there is a suspicion of money laundering or terrorist financing, the Manager performs due diligence checks on its counterparties in order to ensure that it does not enter into business transactions with terrorist suspects or other high risk persons or entities. Suspicious transactions are also reported to the Suspicious Transaction Reporting Office of the Commercial Affairs Department.
Under this policy, the Manager must retain all relevant records or documents relating to business relations with its customers or transactions entered into for a period of at least five years following the termination of such business relations or the completion of such transactions.
All prospective employees, officers and representatives of the Manager are also screened against various lists of terrorist suspects issued by MAS. Periodic training is provided by the Manager to its Directors, employees and representatives to ensure that they are updated and aware of applicable anti-money laundering and terrorist financing regulations, the prevailing techniques and trends in money laundering and terrorist financing and the measures adopted by the Manager to combat money laundering and terrorist financing.
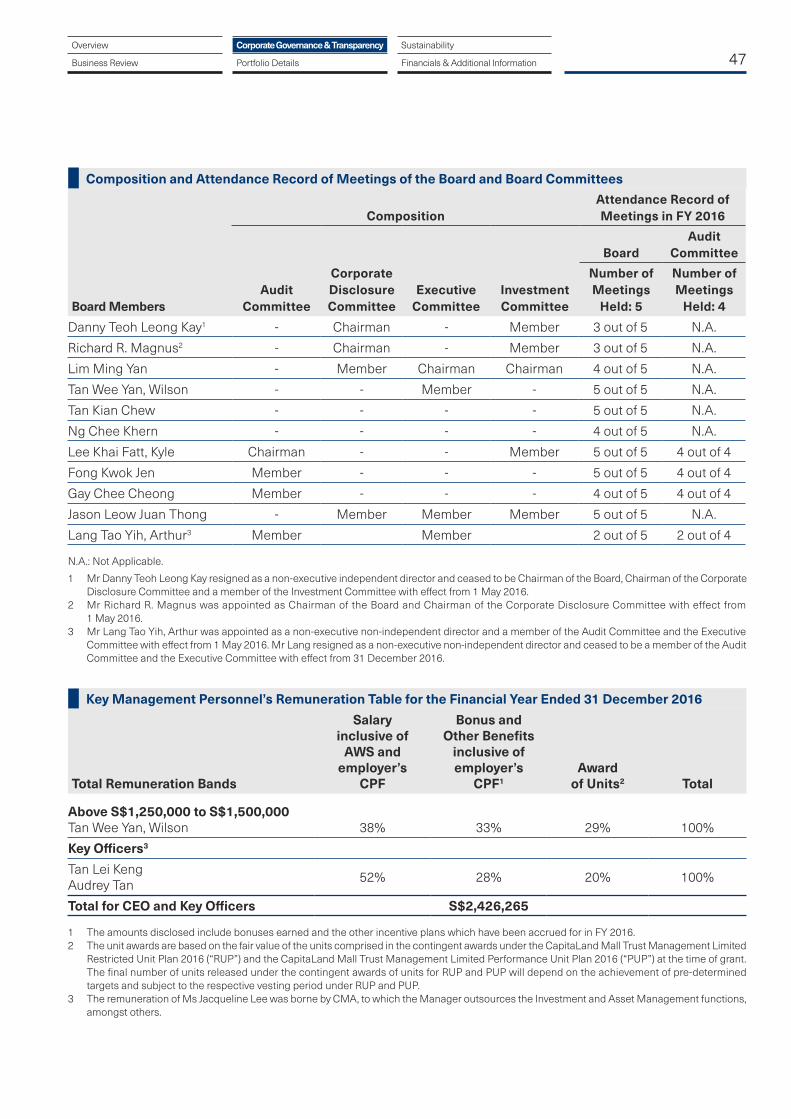
47Overview
Business Review
Corporate Governance & Transparency
Portfolio Details
Sustainability
Financials & Additional Information
N.A.: Not Applicable.
1 Mr Danny Teoh Leong Kay resigned as a non-executive independent director and ceased to be Chairman of the Board, Chairman of the Corporate Disclosure Committee and a member of the Investment Committee with effect from 1 May 2016.
2 Mr Richard R. Magnus was appointed as Chairman of the Board and Chairman of the Corporate Disclosure Committee with effect from 1 May 2016.
3 Mr Lang Tao Yih, Arthur was appointed as a non-executive non-independent director and a member of the Audit Committee and the Executive Committee with effect from 1 May 2016. Mr Lang resigned as a non-executive non-independent director and ceased to be a member of the Audit Committee and the Executive Committee with effect from 31 December 2016.
Danny Teoh Leong Kay1 - Chairman - Member 3 out of 5 N.A.
Richard R. Magnus2 - Chairman - Member 3 out of 5 N.A.
Lim Ming Yan - Member Chairman Chairman 4 out of 5 N.A.
Tan Wee Yan, Wilson - - Member - 5 out of 5 N.A.
Tan Kian Chew - - - - 5 out of 5 N.A.
Ng Chee Khern - - - - 4 out of 5 N.A.
Lee Khai Fatt, Kyle Chairman - - Member 5 out of 5 4 out of 4
Fong Kwok Jen Member - - - 5 out of 5 4 out of 4
Gay Chee Cheong Member - - - 4 out of 5 4 out of 4
Jason Leow Juan Thong - Member Member Member 5 out of 5 N.A.
Lang Tao Yih, Arthur3 Member Member 2 out of 5 2 out of 4
Composition and Attendance Record of Meetings of the Board and Board Committees
Board Members
CompositionAttendance Record of Meetings in FY 2016
Audit Committee
Corporate Disclosure Committee
Executive Committee
Investment Committee
BoardAudit
Committee
Number of Meetings
Held: 5
Number of Meetings
Held: 4
1 The amounts disclosed include bonuses earned and the other incentive plans which have been accrued for in FY 2016.2 The unit awards are based on the fair value of the units comprised in the contingent awards under the CapitaLand Mall Trust Management Limited
Restricted Unit Plan 2016 (“RUP”) and the CapitaLand Mall Trust Management Limited Performance Unit Plan 2016 (“PUP”) at the time of grant. The final number of units released under the contingent awards of units for RUP and PUP will depend on the achievement of pre-determined targets and subject to the respective vesting period under RUP and PUP.
3 The remuneration of Ms Jacqueline Lee was borne by CMA, to which the Manager outsources the Investment and Asset Management functions, amongst others.
Key Management Personnel’s Remuneration Table for the Financial Year Ended 31 December 2016
Total Remuneration Bands
Salary inclusive of
AWS and employer’s
CPF
Bonus and Other Benefits
inclusive of employer’s
CPF1Award
of Units2 Total
Above S$1,250,000 to S$1,500,000 Tan Wee Yan, Wilson 38% 33% 29% 100%
Key Officers3
Tan Lei KengAudrey Tan 52% 28% 20% 100%
Total for CEO and Key Officers S$2,426,265
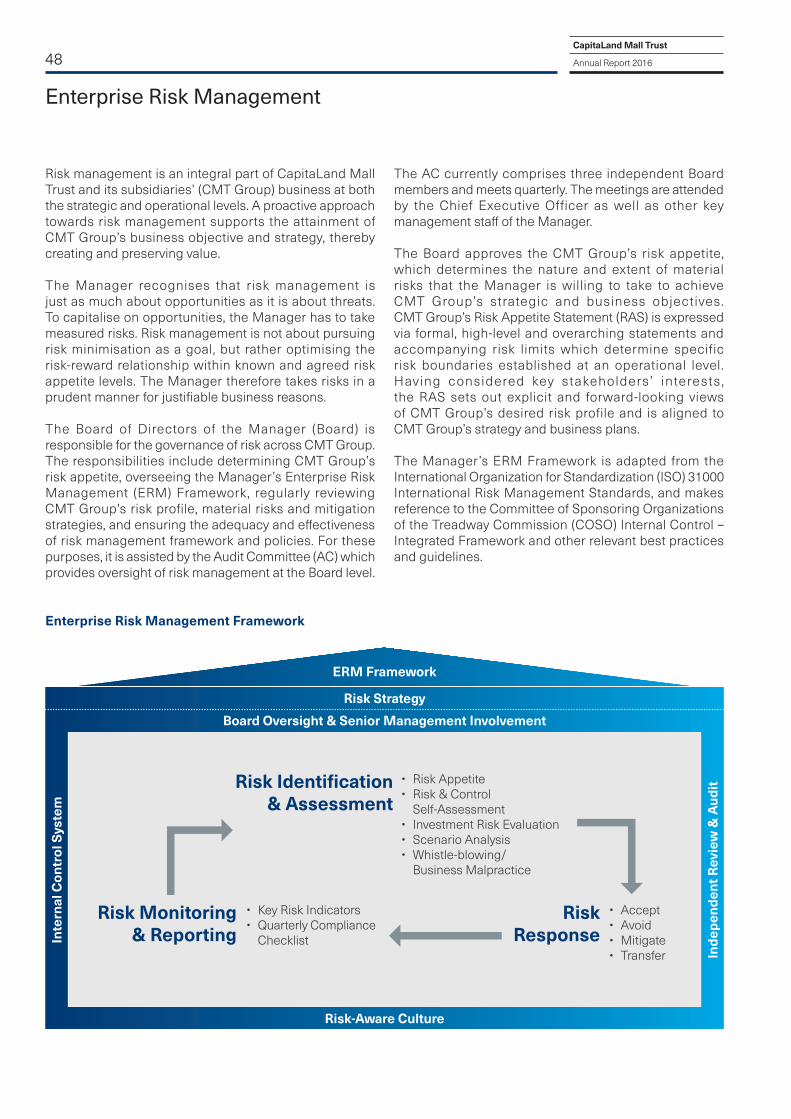
48
Enterprise Risk Management
Risk management is an integral part of CapitaLand Mall Trust and its subsidiaries’ (CMT Group) business at both the strategic and operational levels. A proactive approach towards risk management supports the attainment of CMT Group’s business objective and strategy, thereby creating and preserving value.
The Manager recognises that risk management is just as much about opportunities as it is about threats. To capitalise on opportunities, the Manager has to take measured risks. Risk management is not about pursuing risk minimisation as a goal, but rather optimising the risk-reward relationship within known and agreed risk appetite levels. The Manager therefore takes risks in a prudent manner for justifiable business reasons.
The Board of Directors of the Manager (Board) is responsible for the governance of risk across CMT Group. The responsibilities include determining CMT Group’s risk appetite, overseeing the Manager’s Enterprise Risk Management (ERM) Framework, regularly reviewing CMT Group’s risk profile, material risks and mitigation strategies, and ensuring the adequacy and effectiveness of risk management framework and policies. For these purposes, it is assisted by the Audit Committee (AC) which provides oversight of risk management at the Board level.
Enterprise Risk Management Framework
The AC currently comprises three independent Board members and meets quarterly. The meetings are attended by the Chief Executive Officer as well as other key management staff of the Manager.
The Board approves the CMT Group’s risk appetite, which determines the nature and extent of material risks that the Manager is willing to take to achieve CMT Group’s strategic and business objectives. CMT Group’s Risk Appetite Statement (RAS) is expressed via formal, high-level and overarching statements and accompanying risk limits which determine specific risk boundaries established at an operational level. Having considered key stakeholders’ interests, the RAS sets out explicit and forward-looking views of CMT Group’s desired risk profile and is aligned to CMT Group’s strategy and business plans.
The Manager’s ERM Framework is adapted from the International Organization for Standardization (ISO) 31000 International Risk Management Standards, and makes reference to the Committee of Sponsoring Organizations of the Treadway Commission (COSO) Internal Control – Integrated Framework and other relevant best practices and guidelines.
• Accept• Avoid• Mitigate• Transfer
• Key Risk Indicators• Quarterly Compliance
Checklist
ERM Framework
Risk Strategy
Board Oversight & Senior Management Involvement
Risk-Aware Culture
• Risk Appetite• Risk & Control Self-Assessment• Investment Risk Evaluation• Scenario Analysis• Whistle-blowing/ Business Malpractice
Risk Identification & Assessment
Risk Response
Risk Monitoring & Reporting
Inde
pend
ent R
evie
w &
Aud
it
Inte
rnal
Con
trol
Sys
tem
CapitaLand Mall Trust
Annual Report 2016
49
It sets out the required environmental and organisational components which enable the Manager to manage risks in an integrated, systematic and consistent manner. The ERM Framework and related risk management policies are reviewed annually and have been validated by external ERM consultants.
A robust internal control system and an effective, independent review and audit process are the twin pillars that underpin the Manager’s ERM Framework. While the Manager is responsible for the design and implementation of effective internal controls using a risk-based approach, the outsourced Internal Audit function from CapitaLand reviews such design and implementation to provide reasonable assurance to the AC on the adequacy and effectiveness of the internal control system.
The Manager believes that having the right risk culture and people with the right attitude, values and knowledge are fundamental to CMT Group’s success of ERM. Therefore, the Manager works closely with CapitaLand’s Risk Assessment Group to proactively enhance risk management knowledge by conducting regular workshops for all levels and functions, and to promote a culture of risk awareness and embed risk management principles in decision making and business processes.
Annually, the Manager facilitates and coordinates CMT Group’s Risk and Control Self-Assessment (RCSA) exercise that requires the corporate functions to proactively identify, assess and document material risks as well as the corresponding key controls and mitigating measures to address them. Material risks and their associated controls are consolidated and reviewed by the Manager before they are presented to the AC and the Board.
Managing Material Risks The Manager undertakes an iterative and comprehensive approach to identify, manage, monitor and report material risks across CMT Group. Such material risks include:
Business Interruption Risk CMT Group is exposed to business interruption risk arising from sudden and major disaster event such as fire, prolonged power outages or other major infrastructure or equipment failures which may significantly disrupt operations at our malls or data centres. The Manager manages such risks through proactive facil it ies management (for example, routine inspection and scheduled maintenance) and having crisis management procedures at each property. In addition, the outsourced Information Technology (IT) team from CapitaLand has a defined disaster recovery plan which is reviewed and tested annually.
Competition Risk CMT Group faces keen competition from established players, online businesses and new market entrants which are likely to affect shopper traffic and tenants’ sales. The Manager adopts a relentless approach to strengthen CMT Group’s competitiveness through optimising tenant mix, differentiating its product and service offerings, refreshing mall concepts and asset enhancement initiatives (AEI). The Manager also promotes tenant and customer loyalty through customer-centric initiatives and shopper loyalty programmes to generate sustainable demand for our retail space.
Credit Risk Credit risk is the potential volatility in earnings caused by tenants’ failure to fulfil their contractual lease payment obligations, as and when they fall due. The Manager has in place a stringent collection policy to ensure that credit risk is minimised. In addition to the requirement for upfront payment of security deposit of an amount typically equivalent to three months’ rent, the Manager also establishes vigilant debt monitoring and collection procedures.
Economic Risk CMT Group is exposed to developments in the economy and key financial and property markets. These developments may reduce revenue, increase costs and result in downward revaluation of CMT Group’s assets. Market illiquidity during a financial crisis makes asset investment and divestment challenging and this can affect CMT Group’s investment and strategic objectives. The Manager manages this by adopting a disciplined approach towards financial management and having a well-balanced portfolio across Singapore with majority of its malls being established as necessity shopping.
Information Technology Risk With increased reliance on IT as business enabler, the outsourced IT team from CapitaLand has put in place policies and procedures to manage IT risks, including cyber risks. The policies and procedures set out the governance and controls on IT security, access controls and data security (for example, shopper/tenant details and financial information) to ensure the confidentiality, integrity and availability of CMT Group’s information assets. CMT Group also conducts an IT disaster recovery plan annually to ensure business recovery objectives are met.
Overview
Business Review
Corporate Governance & Transparency
Portfolio Details
Sustainability
Financials & Additional Information

50
Enterprise Risk Management
Interest Rate Risk Some of CMT Group’s existing debts carry floating interest rates, and consequently, the interest cost for such loans will be subject to fluctuations in interest rates. Interest rate risk is managed on an ongoing basis through regular reviews on the optimal mix of fixed and floating rate borrowings, and with the primary objective of minimising the impact on net interest expenses that is caused by adverse movements in interest rates. The Manager also proactively seeks to minimise the level of interest rate risk by locking in most of the borrowings of CMT Group at fixed interest rates.
Investment Risk The main sources of growth for CMT Group are AEI, acquisition of properties as well as investment in greenfield developments. The risks involved in such investment activities are managed through a rigorous set of investment criteria which includes potential for growth in yield, rental sustainability and potential for value creation. Also, key financial assumptions are reviewed and sensitivity analysis performed on key variables. The potential risks associated with proposed projects and the issues that may prevent their smooth implementation or attainment of projected outcomes are identified at the evaluation stage. This is to enable the Manager to devise action plans to mitigate such risks as early as possible.
Leasing Risk Strong competition, poor economic and market conditions are some of the key factors that could result in key tenants not renewing their leases, adversely affecting the leasing performance of CMT Group’s properties. The Manager establishes a diversified tenant base and sustainable trade mix and has in place proactive tenant management strategies which are in line with the malls’ positioning. It is also the Manager’s priority to closely monitor tenants’ sales performance and maintain positive relationships and rapport with retailers to build loyalty with CMT Group’s malls.
Liquidity Risk The Manager actively monitors the cash flow position of CMT Group to ensure that there are sufficient liquid reserves, in the form of cash and banking facilities, to finance CMT Group’s operations and AEI. Given CMT Group’s reliance on external sources of funding, the health of the capital markets directly affects CMT Group. Other than the Multicurrency Medium Term Note Programme and Euro-Medium Term Note Programme, CMT is also one of the first real estate investment trusts to set up a retail bond programme and has tapped into the convertible bonds and commercial mortgage backed securit ies markets for funds. In addition, CMT Group has banking facilities as a source of back-up. CMT Group’s ability to raise funds from both
banks and capital markets has enabled it to minimise over-reliance on a single source of funds for any funding or refinancing requirements. The Manager will continue to proactively manage the capital structure of CMT Group by ensuring its debt maturity profile is spread out without major concentration of debts maturing in a single year, and maintaining an optimal aggregate leverage. The Manager also monitors covenants closely to ensure compliance.
Physical Security RiskTo manage physical security risk of CMT Group, the Manager ensures that there are standard operating procedures in place at each of our malls. In the event of terrorists attacks and sabotages, our Property Managers are prepared to manage the situations during the ‘first few minutes’ before the arrival of the police and civil defence force. Yearly evacuation drills are conducted in the malls to familiarise the tenants and staff with the emergency response plan. Together with security agencies, our malls took part in the anti-terror exercise led by the Singapore Police Force. Our malls are equipped with automated external defibrillators (AED) and our Property Managers undergo mandatory accredited trainings in AED, cardiopulmonary resuscitation and first aid every two years. In addition, our Emergency Respond Teams undergo certified refresher trainings annually to prepare themselves adequately in times of emergency.
Project Management Risk The outsourced Project Management team from CapitaLand which comprises experienced technical staff with various expertise in architectural design, mechanical and engineering detailing and safety, adopts a rigorous project management process to ensure that project cost, quality and time objectives are met. There are stringent pre-qualification procedures to appoint well-qualified vendors for projects, where key criteria such as vendors’ track records and financial performance are assessed. The Manager also conducts regular site visits to closely monitor the progress of projects and manage potential risks of delays, poor workmanship and cost overruns.
Regulatory and Compliance Risk CMT Group is required to comply with the applicable and relevant legislation and regulations that include the Listing Manual of the Singapore Exchange Securities Trading Limited, the Code on Collective Investment Schemes issued by the Monetary Authority of Singapore and the tax rulings issued by the Inland Revenue Authority of Singapore. The Manager has in place a framework that proactively identifies applicable laws and regulatory obligations, legal updates and embeds compliance into the day-to-day operations.
CapitaLand Mall Trust
Annual Report 2016

Investor & Media Relations
51
We are committed to providing the investment and media communities with timely, objective and transparent information on CMT’s business and performance.
The Manager proactively engages and meets existing and potential investors as well as analysts. In 2016, we met or held conference calls with over 270 institutional investors locally and globally through participation in one-on-one meetings, post-results investor briefings as well as investor conferences and roadshows in Singapore, Hong Kong, Thailand, Europe and the United Kingdom.
We made conscious efforts to engage more retail investors as well, through large group seminar and event. CMT is a member of the Investor Relations Professionals Association Singapore (IRPAS) and is also a member of the REIT Association of Singapore (REITAS). During the year, CMT participated in an investment event jointly organised by Shareinvestor and REITAS to reach out to the retail investors. There were booth display of companies, series of education talks and opportunities for the retail investors to mingle with representatives of the companies, including CMT. We have also participated in the Bank of Singapore Investor Forum titled ‘Asia in Transition’, to provide an outlook for Singapore real estate investment trust (S-REIT) industry and Chief Executive Officer (CEO) of the Manager shared on CMT and the retail industry during a lunch panel discussion. The audience had the opportunity to ask questions and interact with the CEO at the event.
Approximately 17,400 registered Unitholders owned CMT units as at 31 December 2016. CapitaLand held, through its subsidiaries, 29.33% of the units in CMT, 55.79% of the units were held by other institutional investors, while retail investors constitute the remaining 14.88%. Investors from Singapore (excluding CapitaLand’s stake), the United States of America and the United Kingdom held the largest portions of unitholdings in CMT at 13.97%, 13.68% and 9.94% respectively, while the remaining unitholdings were held by investors from Hong Kong, Europe (excluding the United Kingdom), Australia and other regions.
Joint analyst and media results briefings are held every six months to provide updates on CMT’s half-year and full-year financial and operational performance. The briefings are webcast ‘live’ and viewers of the webcasts can send in questions online to be addressed by the management.
In addition, annual general meeting (AGM) provides an important channel for communication between the management and Unitholders. CMT convened its AGM in April 2016 with Unitholders approving all resolutions
tabled at the event. The Manager adopted the use of electronic voting by poll for the resolutions put forth and has resulted in greater efficiency in the polling process. Minutes of the AGM are also made available in CMT’s website for greater transparency.
General information on CMT including annual reports, property portfolio details and investor presentations is updated regularly on the corporate website (www.cmt.com.sg) for investors and the general public. All news releases and announcements are also made available on the Singapore Exchange Securities Trading Limited’s (SGX-ST) and CMT’s websites. Investors may also sign up for email alerts to receive the latest updates on CMT. Tours of our properties are regularly conducted for analysts, investors and journalists to better understand the performance of the various properties and the asset enhancement initiatives. Currently, 22 local and foreign brokerage firms have research coverage on CMT.
As part of our proactive corporate governance efforts and in line with the Monetary Authority of Singapore’s Code of Corporate Governance 2012, we have put in place a Unitholders’ communication and investor relations policy to promote regular, effective and fair communication with Unitholders. The policy is located on CMT’s corporate website under the ‘Investor Relations’ section.
In recognition of our good practices during the year, CMT has won the following awards in 2016:
• FinanceAsia – Asia’s Best Companies 2016 - Third, Most Committed to Corporate Governance - Sixth, Best Managed Company
• Securities Investors Association Singapore 17th Investors’ Choice Awards - Runner-up, Most Transparent Company Award
(REITs & Business Trusts category)
CMT was ranked among the Singapore large-cap companies in two categories: Most Committed to Corporate Governance and Best Managed Company. This recognition was from FinanceAsia 16th Annual Asia’s Best Companies poll by 129 portfolio managers and buy-side analysts.
CMT has received recognition for the Most Transparent Company Award in the REITs & Business Trusts category for 13 consecutive years, including this year – eight times as winner and five times as runner-up. The award takes into consideration the company’s performance as well as its degree of disclosure and transparency based on publicly available information.
Overview
Business Review
Corporate Governance & Transparency
Portfolio Details
Sustainability
Financials & Additional Information

52
Investor & Media Relations
Venue
1st Quarter
Media & Analysts’ Results Briefing cum ‘live’ Webcast for Full Year 2015 Results
Singapore
Post-Full Year 2015 Results Investors’ Lunch hosted by UBS Singapore
BNP Paribas Non-deal Roadshow Hong Kong
DBS Non-deal Roadshow Singapore
Daiwa ASEAN REIT Day Singapore
2nd Quarter
Annual General Meeting Singapore
Post-1Q 2016 Results Investors’ Lunch hosted by Citi Singapore
Bank of Singapore Investor Forum – Asia in Transition Singapore
7th Annual dbAccess Asia Conference Singapore
Citi ASEAN C-Suite Forum 2016 Singapore
REITs Symposium 2016 Singapore
3rd Quarter
Media & Analysts’ Results Briefing cum ‘live’ Webcast for Half Year 2016 Results
Singapore
Post-Half Year 2016 Results Investors’ Lunch hosted by Bank of America Merrill Lynch
Singapore
DBS Non-deal Roadshow Thailand
Macquarie ASEAN Conference 2016 Singapore
Deutsche Bank Non-deal Roadshow Europe andUnited Kingdom
SGX-Morgan Stanley Singapore Connect: C-Suite Corporate Days United Kingdom
SGX-Credit Suisse Real Estate Corporate Day Singapore
4th Quarter Post-3Q 2016 Results Investors’ Lunch hosted by Macquarie Securities Singapore
Investor & Media Relations Calendar 2016
CapitaLand Mall Trust
Annual Report 2016

53
Financial Calendar
20162017
(Tentative)
First Quarter Results Announcement 15 Apr 2016 Apr 2017
First Quarter Distribution to Unitholders 27 May 2016 May 2017
Second Quarter Results Announcement 22 Jul 2016 Jul 2017
Second Quarter Distribution to Unitholders 29 Aug 2016 Aug 2017
Third Quarter Results Announcement 21 Oct 2016 Oct 2017
Third Quarter Distribution to Unitholders 29 Nov 2016 Nov 2017
Full Year Results Announcement 20 Jan 2017 Jan 2018
Final Distribution to Unitholders 28 Feb 2017 Feb 2018
Overview
Business Review
Corporate Governance & Transparency
Portfolio Details
Sustainability
Financials & Additional Information
Unitholders’ EnquiresIf you have any enquiries or would like to find out more about CMT, please contact:
The ManagerMs Audrey TanInvestor Relations
Ms Chia Pei SiangGroup Communications
Tel: +65 6713 2888Fax: +65 6713 2999Email: [email protected]: www.cmt.com.sg
Unit RegistrarBoardroom Corporate & Advisory Services Pte. Ltd.50 Raffles Place#32-01 Singapore Land TowerSingapore 048623Tel: +65 6536 5355Fax: +65 6536 1360Email: [email protected]: www.boardroomlimited.com
For depository-related matters such as change of details pertaining to Unitholders’ investment records, please contact:
The Central Depository (Pte) Limited9 North Buona Vista Drive#01-19/20 The MetropolisSingapore 138588Tel: +65 6535 7511Fax: +65 6535 0775Email: [email protected]: www.sgx.com/cdp

54
Unit Price Performance
Global economic conditions have remained weak in 2016. The unexpected Brexit in June 2016 shocked global stock markets. Formal exit negotiations are projected to begin in 2017, and uncertainty remains on the final agreement between the United Kingdom and Europe. In addition, the President of the United States of America’s expansionary fiscal policy plans may result in interest rates rising faster than previously anticipated; and the trade protectionism may impact Singapore’s trade-driven economy, and ultimately affect foreign direct investment, with spillover effects on the labour market.
During the year, CMT’s unit price decreased 2.3% to close at S$1.885, compared to S$1.930 as at end-2015, and the Straits Times Index (STI) and FTSE ST Real Estate (RE) Index declined 0.1% and 0.4% respectively at the end of 2016. The FTSE ST Real Estate Investment Trusts (REIT) Index ended the year 1.9% higher. As at 31 December 2016, CMT’s market capitalisation was approximately S$6.7 billion. The stock’s trading volume in 2016 reached approximately 2.4 billion units, translating to an average daily trading volume of approximately 9.6 million units.
Trading Data by Year
2007 2008 2009 2010 2011 2012 2013 2014 2015 2016
Unit Price (S$)
Highest 4.32 3.75 1.87 2.15 2.00 2.20 2.38 2.09 2.28 2.25
Lowest 2.76 1.38 0.98 1.67 1.64 1.71 1.82 1.80 1.85 1.87
Opening 2.42 2.80 1.30 1.80 1.96 1.72 2.15 1.91 2.04 1.94
Average Closing 3.64 2.78 1.50 1.91 1.85 1.91 2.05 1.95 2.06 2.07
Last Done at Year-end
3.46 1.59 1.80 1.95 1.70 2.13 1.905 2.04 1.93 1.885
Trading Volume (million units)
1,111.6 1,380.6 2,554.8 1,435.3 1,672.9 1,877.2 2,137.5 1,994.9 2,256.0 2,427.4
Average Daily Trading Volume (million units)
4.5 5.5 10.2 5.7 6.7 7.5 8.5 7.9 9.1 9.6
Net Asset Value Per Unit1 (S$)
2.21 2.41 1.54 1.53 1.56 1.64 1.71 1.79 1.86 1.86
1 Excluding the distribution to be paid for the last quarter of the respective financial year.
CapitaLand Mall Trust
Annual Report 2016
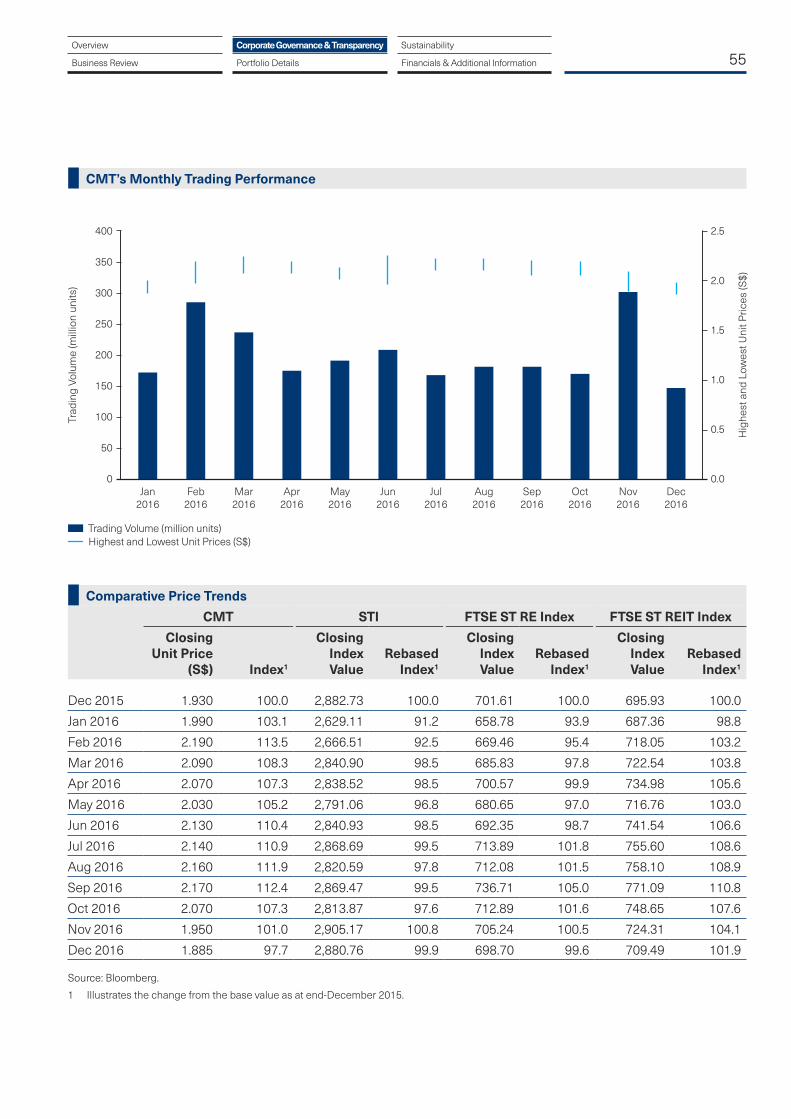
55
CMT’s Monthly Trading Performance
Comparative Price Trends
CMT STI FTSE ST RE Index FTSE ST REIT Index
Closing Unit Price
(S$) Index1
Closing Index Value
Rebased Index1
Closing Index Value
Rebased Index1
Closing Index Value
Rebased Index1
Dec 2015 1.930 100.0 2,882.73 100.0 701.61 100.0 695.93 100.0
Jan 2016 1.990 103.1 2,629.11 91.2 658.78 93.9 687.36 98.8
Feb 2016 2.190 113.5 2,666.51 92.5 669.46 95.4 718.05 103.2
Mar 2016 2.090 108.3 2,840.90 98.5 685.83 97.8 722.54 103.8
Apr 2016 2.070 107.3 2,838.52 98.5 700.57 99.9 734.98 105.6
May 2016 2.030 105.2 2,791.06 96.8 680.65 97.0 716.76 103.0
Jun 2016 2.130 110.4 2,840.93 98.5 692.35 98.7 741.54 106.6
Jul 2016 2.140 110.9 2,868.69 99.5 713.89 101.8 755.60 108.6
Aug 2016 2.160 111.9 2,820.59 97.8 712.08 101.5 758.10 108.9
Sep 2016 2.170 112.4 2,869.47 99.5 736.71 105.0 771.09 110.8
Oct 2016 2.070 107.3 2,813.87 97.6 712.89 101.6 748.65 107.6
Nov 2016 1.950 101.0 2,905.17 100.8 705.24 100.5 724.31 104.1
Dec 2016 1.885 97.7 2,880.76 99.9 698.70 99.6 709.49 101.9
Source: Bloomberg.
1 Illustrates the change from the base value as at end-December 2015.
Jan2016
Feb2016
Mar2016
Apr2016
May2016
Jun2016
Jul2016
Aug2016
Sep2016
Oct2016
Nov2016
Dec2016
Trad
ing
Volu
me
(mill
ion
units
)
Hig
hest
and
Low
est U
nit P
rices
(S$)
400
350
300
250
200
50
100
0
150
0.0
0.5
1.0
1.5
2.0
2.5
Trading Volume (million units) Highest and Lowest Unit Prices (S$)
Overview
Business Review
Corporate Governance & Transparency
Portfolio Details
Sustainability
Financials & Additional Information
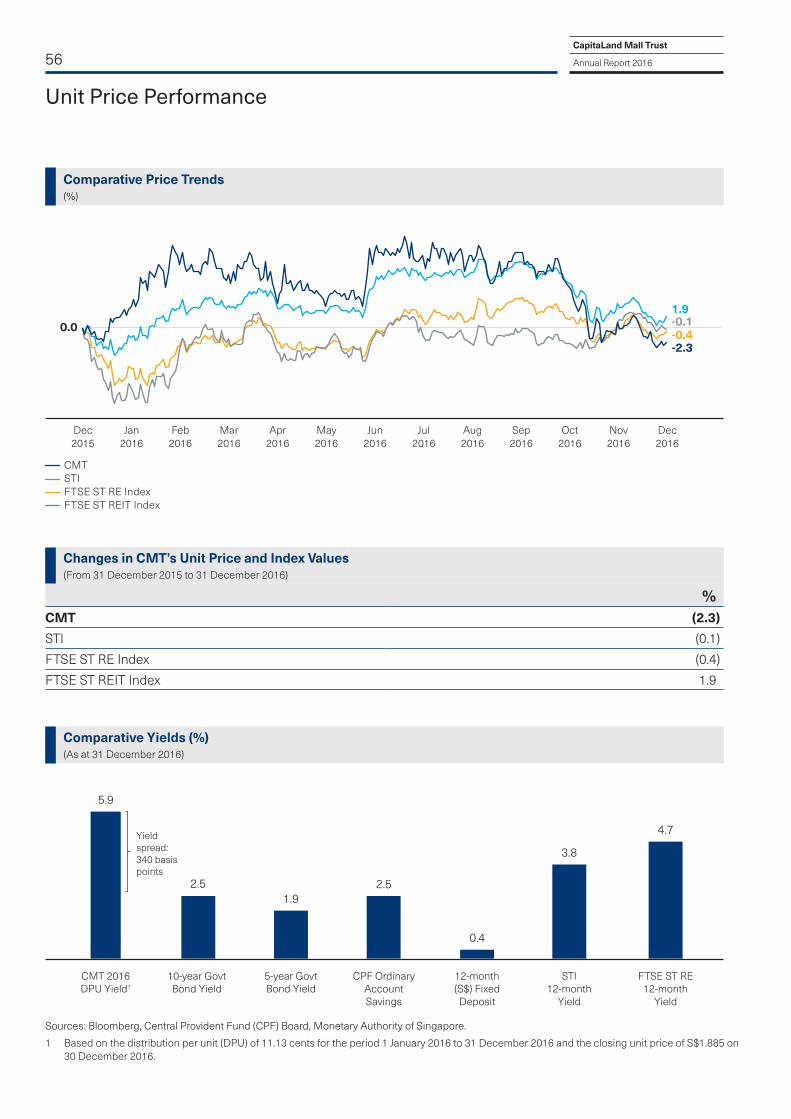
56
Unit Price Performance
Sources: Bloomberg, Central Provident Fund (CPF) Board, Monetary Authority of Singapore.
1 Based on the distribution per unit (DPU) of 11.13 cents for the period 1 January 2016 to 31 December 2016 and the closing unit price of S$1.885 on 30 December 2016.
Yield spread:340 basis points
Comparative Yields (%)(As at 31 December 2016)
5.9
2.51.9
2.5
0.4
3.8
4.7
CMT 2016 DPU Yield1
10-year Govt Bond Yield
5-year Govt Bond Yield
CPF Ordinary Account Savings
12-month (S$) Fixed Deposit
STI 12-month
Yield
FTSE ST RE 12-month
Yield
%CMT (2.3)
STI (0.1)
FTSE ST RE Index (0.4)
FTSE ST REIT Index 1.9
Changes in CMT’s Unit Price and Index Values (From 31 December 2015 to 31 December 2016)
Comparative Price Trends (%)
Apr2016
Jun2016
Aug2016
Jan2016
Feb2016
Dec2015
Mar2016
May2016
Jul2016
Sep2016
Oct2016
Nov2016
Dec2016
CMT STI FTSE ST RE Index FTSE ST REIT Index
0.0-0.4-2.3
-0.11.9
CapitaLand Mall Trust
Annual Report 2016

57
Constituent of Key Indices
FTSE4Good Global IndexFTSE4Good ASEAN 5 IndexFTSE Global Equity Index FTSE EPRA1/NAREIT2 Global Real Estate IndexFTSE RAFI Index FTSE ASEAN Index FTSE Straits Times (ST) Index FTSE All-World IndexFTSE ST All Share IndexFTSE ST Financials IndexFTSE ST Real Estate IndexFTSE ST Real Estate Investment Trusts Index
GPR3 General (World) IndexGPR3 General ex-US IndexGPR3 General Far East IndexGPR3 General Far East ex-Japan IndexGPR3 General Singapore IndexGPR3 General Quoted (World) IndexGPR3 General Quoted ex-US IndexGPR3 General Quoted Far East IndexGPR3 General Quoted Far East ex-Japan IndexGPR3 General Quoted Singapore IndexGPR3 250 IndexGPR3 250 ex-US IndexGPR3 250 Asia IndexGPR3 250 Asia ex-Japan IndexGPR3 250 Asia Pacific IndexGPR3 250 Asia Pacific ex-Japan Index
GPR3 250 South-Eastern Asia IndexGPR3 250 Singapore IndexGPR3 250 REIT IndexGPR3 250 REIT ex-US IndexGPR3 250 REIT Asia IndexGPR3 250 REIT Asia ex-Japan IndexGPR3 250 REIT Asia Pacific IndexGPR3 250 REIT Asia Pacific ex-Japan IndexGPR3 250 REIT South-Eastern Asia IndexGPR3 250 REIT Singapore Index
MSCI4 Singapore IndexMSCI4 World Index
SGX5 Sustainability Leaders Enhanced IndexSGX5 Sustainability Leaders IndexSGX5 Sustainability Enhanced IndexSGX5 Sustainability IndexSGX5 S-REIT IndexSGX5 S-REIT 20 IndexSGX5 Real Estate IndexSGX5 Real Estate 20 IndexSGX5 APAC ex Japan Dividend Leaders REIT Index
The list of key indices above is not exhaustive.
1 European Public Real Estate Association.2 National Association of Real Estate Investment Trusts.3 Global Property Research.4 Morgan Stanley Capital International.5 Singapore Exchange.
Overview
Business Review
Corporate Governance & Transparency
Portfolio Details
Sustainability
Financials & Additional Information

58CapitaLand Mall Trust
Annual Report 2016
Sustainability Management
Dear Stakeholders,
CMT is committed to sustainable policies and practices, and we have consistently tracked our energy, water consumption and carbon emissions over the years. Environmental, social and governance (ESG) issues are critical to creating a sustainable future for CMT, our stakeholders and the society. Our sustainability achievements have been locally and globally recognised in areas of corporate responsibility, environmental performance and ESG standards. We aim to proactively improve our sustainable performance.
To shape our understanding of the ESG issues that we must address in our everyday business, we continually keep abreast of developments in our industry and engage our stakeholders. We cultivate our stakeholder relationships through regular and systematically planned forms of dialogue such as conferences, workshops, roadshows and surveys.
To date, over 90.0% of CMT’s operating malls have achieved the Green Mark awards from the Building and Construction Authority (BCA). In 2016, CMT was given further recognition and became a part of the SGX Sustainability Leaders Enhanced Index, SGX Sustainability Leaders Index, SGX Sustainability Enhanced Index and SGX Sustainability Index. Since September 2007, CMT has been a constituent of FTSE4Good Global Index and was added in the newly created FTSE4Good ASEAN 5 Index in 2016. These indices were designed to facilitate investment in companies that meet globally recognised corporate responsibility standards. CMT was recognised as the Regional Sector Leader of Asia (Retail – Listed) in the 2016 Global Real Estate Sustainability Benchmark (GRESB) Real Estate Assessment. This is a testament to our continuous effort to strengthen our ESG standards.
We continue our commitment to uphold high standards of corporate governance by being a signatory to the Statement of Support Towards Excellence in Corporate Governance initiated by the Securities Investors Association Singapore (SIAS). In 2016, CMT came in as runner-up for the Most Transparent Company Award (REITs & Business Trusts Category) at the SIAS 17th Investors’ Choice Awards.
This section will look at CMT’s entire portfolio of 16 properties with a total asset size of S$10.3 billion, and is aimed at reporting on the way we strengthen our engagement with key stakeholders, as well as our sustainability efforts, performances, measures and activities.
As wholly owned subsidiaries of CapitaLand, we, the Manager and our Property Managers are aligned with CapitaLand’s commitment to sustainability and core values.
We recognise that investors are taking greater interest in the value of sustainability and we aim for our business and operations to be conducted in a responsible and sustainable basis. As we continue on our sustainability journey, we will progressively add metrics and targets that are material to our business to improve our overall sustainability performance across our property portfolio, and better communicate the actions we are taking to all our stakeholders with the ultimate goal of building a sustainable business for the future.
Tan Wee Yan, WilsonChief Executive Officer

59Overview
Business Review
Corporate Governance & Transparency
Portfolio Details
Sustainability
Financials & Additional Information
INTRODUCTION
About CMTListed on Singapore Exchange Securities Trading Limited since July 2002, CMT is the first and largest retail real estate investment trust (REIT) with a market capitalisation of S$6.7 billion as at 31 December 2016. CMT owns and invests in quality income-producing assets. Its current portfolio comprises 16 quality shopping malls which are strategically located in the suburban areas and downtown core of Singapore.
Sustainability CommitmentCMT is a CapitaLand-sponsored REIT externally managed by the Manager while daily property operations are managed by the Property Managers. Both the Manager and Property Managers are wholly owned subsidiaries of CapitaLand. In their respective areas of responsibilities, the Manager and the Property Managers have aligned and adopted CapitaLand’s established sustainability structure and framework of policies and guidelines, as well as ethics and code of business conduct for CMT where relevant and appropriate.
CMT’s sustainability focus is aligned with CapitaLand’s, which is based on its credo, ‘Building People. Building Communities.’ and is integrated with CMT’s asset and portfolio strategies, daily operations management and stakeholder engagements. There is a process of regular review, assessment and feedback in the areas of ESG in line with CapitaLand’s practices.
Top Management Support and Staff InvolvementMembers of CapitaLand’s top management constitute a Sustainability Council which oversees sustainability management and receives support from its Sustainability Steering Committee (SSC). Representatives from all
CapitaLand’s business units (BUs) formed the SSC and two working teams. SSC manages the working teams with the aim of furthering CapitaLand’s progress in terms of ESG performance. The Chief Executive Officers of the BUs are responsible for their respective BU Environmental, Health and Safety (EHS) performance in their role as BU EHS Champions.
The Manager and Property Managers identify and review material issues which could have significant impact to CMT’s business and operations as well as others derived through regular stakeholder engagements.
FINANCIAL PERFORMANCEFor detailed financial results and performance, please refer to the following sections of this Annual Report - Financial Highlights (pages 2 to 3), 2016 Highlights (page 4), Financial Review (pages 88 to 91) and Financial Statements (pages 134 to 214).
GOVERNANCEThe Manager is committed to the highest level of corporate governance and transparency in its policies and processes. We see governance as essential for the sustainable value and success of CMT and to be in the best interests of our Unitholders. For details on CMT’s Corporate Governance, please refer to pages 26 to 47 of this Annual Report.
CMT is a member of the Investor Relations Professionals Association Singapore (IRPAS) and REIT Association of Singapore (REITAS). CMT participates and supports the activities organised by IRPAS, REITAS and SIAS.
Enterprise Risk Management (ERM)An integral part of good corporate governance, a comprehensive ERM framework enables CMT to proactively identify, communicate and manage risks and exposures in an integrated, systematic and consistent manner. In driving risk awareness, decision-making and business processes are put through prudent risk assessment. Fraud and corruption risks and property management risk have been identified as material to ensure sustainability. Details on ERM can be found on pages 48 to 50 of this Annual Report.

60
STAKEHOLDER ENGAGEMENTS
ShoppersTo understand our shoppers’ needs and improve the appeal of our malls
Issues/Interests• Experiential shopping• New retail concepts• Family-friendly facilities• Easy access to public transport
How We Engage• Marketing and promotional events• Loyalty programmes• Online and mobile platforms• Social media• Shopper satisfaction focus groups
and surveys
InvestorsTo create an informed perception of CMT, manage investors’ expectations and promote a positive investment environment
Issues/Interests• Business performance• Business expectations and strategy• Economic, social and
environmental concerns
How We Engage• Annual general meetings• SGXNet announcements• Annual reports, results briefings
to analysts and media, webcasts• Website updates• Roadshows, conferences and
meetings• Tours of CMT’s properties
TenantsTo understand our tenants’ needs and concerns as well as help drive shopper traffic to our malls
Issues/Interests• Opening of new shops or malls• Learn from successful companies• Knowledge sharing and keep
abreast of market trends• Enhance operational efficiency
How We Engage• Informal tenant gatherings• Biz+ Series events• Joint promotions and strategic
partnerships• Green leases• Value added initiatives by
centralisation and leveraging on technology
• Tenant satisfaction survey
EmployeesTo develop employees to achieve their optimal levels, align their personal goals with company performance and create a positive work environment for them
Issues/Interests• Communicating business strategy
and developments• Reward and recognition• Training and development• Employee wellness
How We Engage• Informal and formal staff
communications• Recreational and team building
activities• Employee engagement surveys• Performance appraisals• Training courses
SuppliersTo be a fair and reasonable buyer of goods and services and sharing industry best practices
Issues/Interests• Fair and reasonable treatment• Ensure alignment with ESG
objectives
How We Engage• Term contractor/vendor
evaluation system• Standard operating procedures,
guidelines and house rules for compliance
• Share CapitaLand’s EHS policy with suppliers
• Collaborate with suppliers to handle EHS challenges
CommunityTo contribute to the communities in which we operate
Issues/Interests• Philanthropy• Environment
How We Engage• Employee volunteerism• Donations to non-profit
organisations• Management of ESG issues• Corporate social responsibility
programmes
Sustainability Management
CapitaLand Mall Trust
Annual Report 2016

61
CapitaLand’s Core Values
Respect: We believe in mutual trust and respect at all levels. This is fundamental to a high-performance culture that embraces diversity and teamwork as One CapitaLand.
Integrity: We embrace the highest standards of integrity. We have the courage to do what is right, and earn the trust of all our stakeholders.
Creativity: We constantly innovate to enhance value and stay ahead.
Excellence: We pursue excellence and persevere in everything we do.
OUR ENVIRONMENTCMT is committed to environmental sustainability and the enhancement of value as a real estate owner. By leveraging on technologies and analytics in optimising the usage of energy, water as well as waste management across our properties, we believe that we can manage our business better and create long-term value for all stakeholders.
To align the understanding of our commitments in our everyday business, we continually keep abreast of developments in our industry and engage our stakeholders.
We cultivate our stakeholder relationships through regular and systematically planned forms of dialogue such as conferences, workshops, roadshows and surveys.
Adopting CapitaLand’s Environmental, Health and Safety Management System (EHSMS) framework, CMT’s material environmental aspects of business functions including property management and property development are as follows:
Water
Water scarcity, accessibility and
security
Biodiversity
Interdependence between ecosystems and the well-being of the community
Climate Change and Energy
Global Greenhouse Gas (GHG) emissions at unsustainable level
Rising demands for energy, compounded by finite resources
Policies and Objectives
Identify opportunities in managing the property portfolio to deliver long-term benefits
Identify and respond to climate change risks
Reduce energy consumption and encourage renewable energy sources
Reduce water consumption, encourage use of treated/recycled water and rain water harvesting
Manage waste through construction efficiency and encourage recycling
Manage biodiversity to contribute positively to the natural environment
Engage stakeholders to play their part
Waste
Waste generation at unsustainable rates
Land scarcity for waste disposal
Cost pressure from resource scarcity
Overview
Business Review
Corporate Governance & Transparency
Portfolio Details
Sustainability
Financials & Additional Information

62
Tracking Our PerformanceTo measure its performance, CMT has incorporated the following key performance indicators.
2016 Key Performance IndicatorsKey Environmental Issues Targets Performance for 2016
Operational Efficiency Reduce carbon emissions intensity by 23.0% by 2020
Reduce energy intensity by 20.0% by 2020
Reduce water intensity by 20.0% by 2020
(Using 2008 as base year)
Achieved 32.4% carbon emissions intensity reduction, 18.8% energy intensity reduction and 5.1% water intensity reduction
(Using 2008 as base year)
Resource Consumption Management
To achieve green building ratings for all properties by 2020
More than 90.0% of our operating properties achieved at least a Green Mark Gold certification
Environment Management System (EMS)
ISO 14001 certification
Risk management of environmental aspects and impacts
Retained ISO 14001 certification
No environmental non-compliance
Supply Chain Management Appoint contractors and service providers who comply with local government and other legal requirements
Majority of our contractors and service providers are minimum bizSAFE Level 3 certified
Appoint main contractors for projects with gross floor area (GFA) of at least 2,000 square metres, with ISO 14001 and Occupational Health & Safety Assessment Series (OHSAS) 18001 certification
All main contractors for projects with GFA of at least 2,000 square metres were ISO 14001 and OHSAS 18001 certified
Stakeholder Engagements Organise environmental outreach activities to cultivate an environmental mindset among stakeholders
All CMT’s properties participated in Earth Hour organised by CapitaLand
To promote recycling of e-waste, recycling bins are installed in 10 of our properties
Implemented In-Mall Distribution in two properties which reduced queuing time for deliveries in the malls
Sustainability Management
CapitaLand Mall Trust
Annual Report 2016

63
Managing our Environmental FootprintCapitaLand’s EMS is a key tool in managing CMT’s environmental footprint across its entire portfolio. This EMS, together with CapitaLand’s Occupational, Health and Safety Management System (OHSMS) are integrated as CapitaLand’s EHSMS. CapitaLand’s EHSMS is audited by a third-party accredited certification body to ISO 14001 and OHSAS 18001 standards. ISO 14001 and OHSAS 18001 are internationally recognised standards for the environmental management of businesses and occupational health and safety management of businesses respectively.
Environmental, Health and Safety PolicyCMT is committed to protecting the environment and upholding the occupational health and safety (OHS) of everyone in the workplace, and will:
• Carry out exemplary EHS practices to minimise pollution as well as health and safety risks
• Seek continual improvement on its EHS performance• Comply with relevant legislations and other
requirements• Implement CapitaLand’s Sustainable Building
Guidelines (SBG) and OHS programmes
This policy is readily available to all employees, tenants, suppliers and service providers.
Since 2012, all business functions such as property management, property development as well as corporate management and operations for CMT’s properties are ISO 14001 certified.
Risk Management of Environmental Aspects and ImpactsAs part of the certified EMS, new or updated legal requirements are reviewed quarterly and compliance is evaluated annually. In 2016, CMT complied with the environmental laws and regulations and there was no environmental non-compliance.
CapitaLand’s EMS provides a systematic process to manage the environmental impacts and to continuously improve its environmental performance. A key element is to identify and manage significant environmental aspects of its business operations that can potentially have a negative impact on the environment. The significance
level of each environmental aspect and impact is assessed using a risk assessment technique based on factors comprising the likelihood of the occurrence, severity of the impact and control measures implemented.
CMT strives to minimise impacts such as resource depletion, carbon emissions and waste generation. This is done by setting environmental targets such as green building rating targets, carbon emissions, energy and water usage reduction targets, participating in stakeholder engagement activities, as well as implementing various measures to achieve them. For more details, please refer to the table ‘2016 Key Performance Indicators’ on page 62 of this Annual Report.
TrainingTo facilitate effective implementation of CapitaLand’s EHSMS, training and awareness programmes are planned and conducted for all staff. New staff are introduced to the EHSMS and EHS policy as well as briefed on their roles.
Internal and External AuditsCapitaLand has in place an internal audit system to ensure the conformance and effective implementation of its EMS to ISO 14001 international standards. External audits are conducted annually by a third-party accredited certification body.
Sustainable Developments and AssetsGreen building ratings and certifications help assure and demonstrate the quality of CMT’s portfolio. These ratings serve as an external validation that key environmental aspects have been considered in CMT’s project design, development and operations.
Green Building Rating Green building rating targets are set from the early stage of design and development. Green rated buildings have a lower lifecycle carbon footprint through the adoption of sustainable design and materials, and have lower resource consumption like energy, water and reduce waste in their operations.
The target for our new developments is Green Mark GoldPLUS, two levels above the legal requirement of the BCA Green Mark Certification.
Overview
Business Review
Corporate Governance & Transparency
Portfolio Details
Sustainability
Financials & Additional Information

64
CMT is committed to achieving Green Mark certification for all of its portfolio by 2020, in support of the Singapore government’s Green Building Master Plan. As at 31 December 2016, 14 of our properties have achieved green certification.
Life Cycle ManagementCapitaLand’s SBG is an in-house guide developed since 2007 to ensure environmental considerations are factored in at all stages of a project, from feasibility, design, procurement, construction, operations to redevelopment. Originally titled Green Buildings Guidelines, it was renamed in 2014 to reinforce the company’s holistic approach towards sustainability.
Mitigating Climate Change Challenges and Identifying Opportunities through Design As countries rally for action to mitigate climate change, more stringent regulations may be expected and companies will face increased expectations from stakeholders. By adopting the SBG, CMT aims to future-proof its developments by addressing the risks of climate change right from the design stage. Every project is studied in detail, and appropriate measures taken in consideration of climate change. SBG also sets guidelines for buildings to be less energy reliant, for examples, setting green building rating targets above legal requirements, and also encourage the use of renewable energy whenever possible.
The SBG is regularly reviewed to ensure continuous improvement, with a focus on four key objectives of minimising carbon footprint and energy consumption, water management, waste management and promoting biodiversity in the life cycles of its developments. Changes since inception include higher green building rating requirements, increased focus on biodiversity, use of certified wood and design for accessibility.
During the dry spell period, a majority of our properties will shut off external water features and postpone non-essential cleaning such as facade and car park cleaning to conserve water.
Air filters in our properties have been upgraded in view of the haze conditions in Singapore. During the haze period, N95 masks and bottles of water were distributed to staff working in outdoor conditions and to shoppers when needed.
Environmental Impact Assessment A key component of the SBG is the mandatory Environmental Impact Assessment (EIA). An EIA is carried out during the feasibility stage of any development project. The significant findings of the EIA and their cost implications, if any, are incorporated in the investment paper submitted to the Board of Directors for approval.
Property Award Category Year of Award
JCube Platinum 2016
Bugis Junction Platinum 2014
Westgate Platinum 2013
Bugis+ Platinum 2012
Bedok Mall Platinum 2012
Junction 8 Platinum 2012
IMM Building GoldPLUS 2016
Lot One Shoppers’ Mall Gold 2016
Plaza Singapura Gold 2016
Sembawang Shopping Centre Gold 2016
The Atrium@Orchard (Retail) Gold 2015
Raffles City Singapore Gold 2014
Tampines Mall Gold 2013
Bukit Panjang Plaza Gold 2012
Sustainability Management
CapitaLand Mall Trust
Annual Report 2016

65
The EIA focuses on identifying any environmental threats or opportunities related to the project site and its surroundings, covering areas such as floods, biodiversity, air quality, noise, connectivity, heritage and resources.
BiodiversityCMT is committed to preserving the biodiversity of its sites as well as the wider area wherever possible. This is done by addressing any distinctive ecological features of the site, taking into consideration nature reserves on or near the site, protecting plant and animal species on the site and removing invasive plant species on or near the site. External experts will be engaged to provide advice when appropriate.
There is currently no site located within protected areas and no material biodiversity risk identified. Instead, CMT encourages greenery within its projects as it enhances the liveability of the project for its end-users and vitality of the surrounding communities over the long term.
Funan is being redeveloped as an ‘experiential creative hub’. Drawing inspiration from the development’s strategic location at the crossroad of heritage, business, politics and culture in the Civic and Cultural District, Funan aspires to be ‘a creative intersection’. As a new paradigm for live, work and play in Singapore’s city centre, Funan seeks to offer a synergistic combination of retail, office and serviced apartment components that is designed to appeal to tech- and socially-savvy consumers pursuing quality of life in a socially conscious and creative environment. Funan will serve as a lifestyle hub where consumers can engage in their passions, connect with like-minded people and use the space as a platform to inspire and express themselves.
In support of the country’s move towards a car-lite society and to promote healthy living, Funan will offer full amenities and end-of-trip facilities for cycling enthusiasts. Funan’s proposed streetscape on its ground floor features multiple access points and gentle slopes, which will make it easy for cyclists and pedestrians alike to enter the building.
Funan will feature a multi-level landscape strategy designed by the creation of a series of gardens. The landscape design concept centres on the theme of ‘Nature: City’. The landscape scheme relates to the surroundings by incorporating a water garden with views of Fort Canning and a roof-top communal garden with sweeping views of the Marina area and Central Business District. The roof garden will serve as a communal space giving back extensive spaces to the community to gather and enjoy.
The development will feature urban farms and edible gardens. The urban farm aims to showcase sustainable food production with a range of technologies, demonstrating the diversity and cyclical relationships of crop production.
Applying the ‘Nature: City’ approach to the design of Funan’s landscape will result in a rich and diverse public realm that flows through, up and over the development creating a strong identity and unified landscape, whilst providing unique and distinct spaces and experiences.
Our Environmental Results
Environmental Tracking SystemLeveraging on CapitaLand’s Environmental Tracking System (ETS), we track energy and water usage, waste generation and carbon emissions for our operational properties.
The management team of each property submits monthly data and uploads supporting documentation into ETS. The data is analysed to facilitate a better understanding of consumption patterns and identify areas for eco-efficiency improvements.
Our CommitmentsIn line with CapitaLand’s long-term targets for the reduction of carbon emissions, energy and water intensities, our long-term targets (using 2008 as base year) are as follows:
• Reduce carbon emissions intensity by 23.0% by 2020 • Reduce energy intensity by 20.0% by 2020• Reduce water intensity by 20.0% by 2020
Overview
Business Review
Corporate Governance & Transparency
Portfolio Details
Sustainability
Financials & Additional Information

66
Most CMT’s properties are located close to or integrated with mass rapid transit (MRT) stations and bus interchanges. This allows easy access to the surrounding communities and facilities via mostly covered/sheltered walkways. In addition to reduce the carbon emissions, CMT’s properties are provided with bicycle lots to encourage shoppers and tenants to use greener modes of transport. There are about 360 bicycle lots across the CMT’s properties. We collaborated with external partner BMW Group Asia to create awareness of lower carbon emission transport. We have installed the Plug-In Electric Vehicles (EV) charging stations at Raffles City Singapore, The Atrium@Orchard and Bukit Panjang Plaza. We have plans to install more EV charging stations in new locations. The increase in the use of such transport will reduce carbon emissions on the road.
CMT has installed a total of more than 1,400 square metres of solar panels at Bugis Junction, Sembawang Shopping Centre, JCube and Bedok Mall. The solar panels have helped our malls to tap on renewable energy source.
Carbon EmissionsCMT is committed to address climate change risks through the reduction of its energy consumption as well as its other carbon emissions in its business operations. Improving energy efficiency represents the largest and most cost-effective way to mitigate those emissions.
CMT’s total carbon emissions in 2016 was estimated at 62,7561 tonnes.
Carbon Emissions and Carbon Emissions Intensity
2008 2009 2010 2011 2012 2013 2014 2015 2016
59,71263,898
70,77566,009 67,165
71,66863,401 65,427 62,7561
Total Carbon Emissions (tonnes CO2e) Carbon Emissions Intensity (kgCO2e/m2)
80,000 12
70,000
60,000
50,000
10
40,000
8
30,000
6
20,0004
10,000 2
0 0
In collaboration with the Info-communications Media Development Authority of Singapore and SPRING Singapore, CMT has embarked on an In-Mall Distribution trial at Tampines Mall and Bedok Mall. The trial includes a dock scheduler and queue management system which enables logistic service providers and tenants with their own delivery fleet to book specific delivery timings at the malls. This reduces traffic congestion and trucks queuing outside the malls by ensuring that delivery timings do not clash.
CMT’s estimated carbon emissions intensity fell to 7.4 kgCO2e/m2, 32.4% reduction compared to 2008.
32.4%REDUCTION IN CARBON EMISSIONS INTENSITY
Sustainability Management
CapitaLand Mall Trust
Annual Report 2016
1 For the month of December 2016, the carbon emissions at Bugis Junction, Plaza Singapura and The Atrium@Orchard was estimated based on their respective average carbon emissions in the months of September, October and November in 2016.
Carbon Emissions (tonnes CO2e)
Carbon Emissions Intensity (kgCO2e/m2)

67
In 2016, CMT’s energy usage was estimated at 141,078 MWh.
CMT reduced its energy intensity by 18.8% as compared to 2008.
18.8%REDUCTION IN ENERGY INTENSITY
Energy
Despite an increase in total energy usage due to expansion in its operational portfolio, CMT decreased its energy intensity measured in kilowatts-hour per square metre (kWh/m2) by 18.8% from base year 2008. CMT is on track to achieving its 2020 energy intensity reduction target.
In support of the World Wildlife Fund’s annual Earth Hour campaign on 19 March 2016, all non-essential lights were turned off at CMT’s properties.
CMT continues to implement various energy conservation measures, some of which are listed below. It also focuses on innovation to reduce energy consumption.
Focus Initiatives and Measures
Central Air Conditioning System Installed with Measurement & Verification (M&V) System to monitor daily system performance
Perform preventive and periodic servicing and maintenance
Auto tube-cleaning system
Conduct energy audit periodically
Lighting Replacing existing non-LED type with LED type
Lighting power budget of not more than 22 Watts per m2 as recommended in the fit-out guide given to tenants
Control, Metering and Monitoring Building Management System
Sub-metering
Renewable Energy Photovoltaic (PV) system
Energy Usage and Energy Intensity
2008 2009 2010 2011 2012 2013 2014 2015 2016
112,665120,563
133,537124,546
134,018143,207
134,052141,854 141,0781
Energy Usage (MWh) Energy Intensity (kWh/m2)
160,000 25
140,000
120,000
100,00020
80,000
1560,000
40,000
20,000
0 0
Overview
Business Review
Corporate Governance & Transparency
Portfolio Details
Sustainability
Financials & Additional Information
1 For the month of December 2016, the energy usage of Bugis Junction, Plaza Singapura and The Atrium@Orchard was estimated based on their respective average energy usage in the months of September, October and November in 2016.
Energy Usage (MWh)
Energy Intensity (kWh/m2)

68
Water CMT is committed to reducing water usage and preventing water pollution. Water usage and discharge for each property is monitored and checked regularly.
CMT has a long-term target of 20.0% reduction in water intensity by 2020. This can be achieved through initiatives to ensure efficient operations and minimise water wastage.
In 2016, CMT’s water usage was estimated at 1.7 million m3. This included an estimated usage of 0.6 million m3 of NEWater.
CMT reduced its water intensity by 5.1% as compared to 2008.
5.1%REDUCTION IN WATER INTENSITY
395347
410
226
106
383 407
5756241
2014 201520122008 2009 2010 2011 2013 2016
NEWater Usage
Sustainability Management
CapitaLand Mall Trust
Annual Report 2016
1 For the month of December 2016, the water usage of Bugis Junction, Plaza Singapura and The Atrium@Orchard was estimated based on their respective average water usage in the months of September, October and November in 2016.
1 For the month of December 2016, the NEWater usage of Plaza Singapura was estimated based on its average NEWater usage in the months of September, October and November in 2016.
Water Usage and Water Intensity
2008 2009 2010 2011 2012 2013 2014 2015 2016
1,185 1,2921,432 1,408
1,553 1,6171,471
1,6301,74812,000
800
0.25
1,500
600
1,000
400
500
200
0.20
0
0
0.15
Water Usage (,000 m3)
NEWater Usage (,000 m3)
Water Intensity (m3/m2)
Total Water Usage (,000 m3) Water Intensity (m3/m2)
Total NEWater Usage (,000 m3)

69
Waste ManagementCMT aims to manage waste at its properties responsibly. As waste generated at its operational properties is mostly from its tenants, CMT engages its stakeholders through various means to minimise and recycle waste. Recycling bins are made available at all CMT’s properties.
CapitaLand partnered with StarHub to roll out e-waste recycling bins at 10 of our malls to encourage shoppers and tenants to adopt e-waste recycling and address the increasing environmental and health concerns posed by improper handling of e-waste. The malls involved in this initiative are: Bugis+, Bedok Mall, IMM Building, JCube, Junction 8, Lot One Shoppers’ Mall, Sembawang Shopping Centre, Plaza Singapura, Raffles City Singapore and Tampines Mall. This initiative built on the success of our first e-waste recycling programme at Funan DigitaLife Mall. It is also a natural progression of our waste recycling journey which started in 2008 with recycling bins for paper, metal and plastic in all of our malls.
CMT requires its main contractors to implement proper waste management procedures to minimise, properly manage and dispose the construction waste.
CMT continues to leverage Building Information Modelling (BIM) technology to improve the design and construction process through more integrated project coordination. BIM can perform clash detection before construction, identifying situations where mechanical and electrical services will clash with structural members. This detection saves time and cost of remedial work and minimises material wastage.
The collection and disposal of waste at all CMT’s properties is carried out by National Environment Agency (NEA) licensed contractors. In 2016, we collected 25,892 tonnes of waste, which was 3.7% lower than 2015.
3.7%REDUCTION IN TOTAL WASTE
Focus Initiatives and Measures
Recycling Rain water harvesting, condensate water and sprinkler water discharge
Usage Reduction Dual flush toilets, motion-activated water taps, flow regulators, rain sensor/timer irrigation system and perform toilet cleaning through auto alert once it reaches the traffic count limit
Control, Metering and Monitoring Remote monitoring on water usage in toilets, wet playgrounds, cooling towers and hose reel tank
Overview
Business Review
Corporate Governance & Transparency
Portfolio Details
Sustainability
Financials & Additional Information

70
OUR PEOPLEAs an externally managed REIT, CMT has no employees and is managed by the Manager and Property Managers, which are indirect wholly owned subsidiaries of CapitaLand.
The teams behind the Manager and Property Managers responsible for property and portfolio operations in Singapore are identified as people or employees that are integral to CMT’s success.
Fairness and DiversityAs wholly owned subsidiaries of CapitaLand, the Manager and Property Managers have a common goal of developing a high performance culture that embraces diversity and teamwork.
We are committed to be a workplace of choice for employees. CapitaLand has in place an integrated human capital strategy designed to recruit, develop and motivate employees. It adopts stringent principles of fair employment and equal remuneration. We define our human resource policy on equal opportunities and fair employment practices and all job applicants are treated fairly regardless of ethnicity, age or gender. We adhere to CapitaLand’s policies on non-discriminatory employment practices. CapitaLand has signed the Employers’ Pledge for Fair Employment Practices with The Tripartite Alliance for Fair and Progressive Employment Practices. CapitaLand adheres to five key principles of fair employment:
• Recruit and select employees on the basis of merit, such as skill, experience and ability, regardless of age, race, gender, religion or family status
• Treat employees fairly and with respect and implement progressive human resource management systems
• Provide employees with equal opportunities for training and development based on their strengths and needs, to help them achieve their full potential
• Reward employees fairly based on their ability, performance, contribution and experience
• Abide by labour laws and adopt Tripartite Guidelines which promote fair employment practices
We have a team of vibrant, motivated and qualified workforce. New hires represented 11.5% of the total headcount in 2016.
Our workforce comprises an almost equal proportion of male and female employees. The female employees are well represented at the middle and senior management levels. For the past three years, more than half of the managerial employees were female. In 2016, about 57.1% of senior management, comprising those at Vice President level and above, were female.
Innovating through Technology
We constantly innovate and improve our operations and shopping experience by leveraging on technology and collaborating with strategic partners. In 2016, we partnered with Certis CISCO to set up a dedicated central monitoring and response centre. This centre manages the surveillance, intercom and car park systems as well as monitors the fire alarm across a cluster of malls round-the-clock.
The smart use of technology enhances the real-time visibility and overall situation awareness and aids crisis management. It enables CMT to deploy security officers more effectively on the ground. This results in overall cost savings without compromising the level of security. By aggregating our needs, we are able to enhance productivity, leverage on economies of scale and optimise the investment in technological infrastructure.
The initiative was rolled out to eight of our malls. This move is in line with our support of the national productivity drive which has seen us adopting innovative solutions to increase productivity not just for our mall operations, but also for our tenants.
Sustainability Management
CapitaLand Mall Trust
Annual Report 2016

71
2014
2014
2014
2015
2015
2015
2016
2016
2016
Workforce by Age
Workforce by Gender
Workforce by Educational Qualifications
<30 Years
Male
Master's Degree/Post Graduate Diploma/GCE A-Level GCE O-Level/Industrial Others
100%
100%
100%
75%
75%
50%
50%
75%
50%
20%
25%
25%
0%
0%
0%
30-50 Years
Female
Bachelor's Degree
>50 Years
Overview
Business Review
Corporate Governance & Transparency
Portfolio Details
Sustainability
Financials & Additional Information
As per CapitaLand’s non-discriminatory employment practices, to attract top talent, all job opportunities in the Manager and Property Managers are advertised publicly via online job portals and newspapers, with selections based entirely on merit. Skill and ability are the key criteria in the selection process.
Human RightsAs part of CapitaLand, one of the common goals is to uphold the spirit of international human rights conventions, such as the Universal Declaration of Human Rights and the International Labour Organisation (ILO) Conventions, against coerced labour and discrimination in any form. Singapore has to date ratified 20 ILO Conventions covering four key areas of employment standards: child labour, forced labour, collective bargaining and equal remuneration.
We have no acts of discrimination or human rights violation reported in 2016.
Positive Work EnvironmentWe are committed to provide our staff with a positive and vibrant workplace that promotes personal development, good health and well-being as well as a rewarding career, which in turn results in a high performance culture and work-life harmony. Initiatives include flexible hours, a flexible medical and benefits plan, flexible work arrangements and employee engagement initiatives. Part-time employees are entitled to the same benefits on a pro-rata basis.
We advocate a pay-for performance philosophy to drive ownership of collective goals, leading to a high performance culture which creates long-term unitholder value. The robust performance management system ensures that all employees receive regular performance and career development reviews.
In 2016, 19 eligible female employees went on maternity leave and all returned to work. CapitaLand also provides paid paternity leave to all male employees in Singapore. In Singapore, the Central Provident Fund (CPF) is a comprehensive social security savings plan introduced by the Singapore Government to enforce savings by salaried workers to help CPF members work towards a secure retirement. Under the CPF scheme, employees make monthly contributions to the employees’ CPF accounts in accordance with the prevailing regulations.

72
Learning and DevelopmentWe believe in talent cross-fertilisation and leverage on CapitaLand’s Human Resource function to build people. As part of career development and to nurture employees’ capability and personal traits, CapitaLand has formal classroom trainings, on-the-job exposure, mentoring/coaching and opportunities for job rotation.
In line with our belief that continual learning is a fundamental building block of growth, we offer comprehensive training and development programmes for employees to acquire relevant knowledge and skills to achieve business excellence.
In 2016, about 3.0% of our annual payroll was allocated for programmes relating to employee learning and growth. We have in place training roadmaps and a wide variety of courses, ranging from project financing and real estate to soft skill subjects such as communications and presentation skills. Staff have direct access to a year-long training calendar, which comprises a series of pre-evaluated training courses. CapitaLand has an in-house training hub, CapitaLand Inst i tute of Management and Business (CLIMB) which serves the training and development needs of staff. In addition, we have established an online learning platform which offers more than 400 programmes, to encourage staff to learn continually and offer them wider choices in terms of courses.
Approximately 98.3% of staff attended at least one training event, and the average number of training hours completed by each employee for the year was more than 43 hours, above the recommended guide of 40 hours per annum. We encourage employees to upgrade themselves by attending courses or obtaining professional qualifications relevant to their work. Employees are granted paid examination leave for their studies. For full-time staff, examination leave is up to 10 days per calendar year.
During the year, our employees also participated in study visits.
Job SecurityCapitaLand is committed to providing meaningful jobs for its employees. This is in line with the Tripartite Guidelines on Managing Excess Manpower issued by the Singapore Ministry of Manpower together with its tripartite partners, Singapore National Employers Federation and the National Trades Union Congress.
Talent ManagementWe actively seek innovative, dynamic and talented employees both internally and externally to strengthen our bench strength and to support our growth. As part of our talent management strategy, talents are recruited at different points in their careers, from entry-level graduates to young, mid-career professionals and industry veterans. We have a systematic programme for all new hires to learn more about our business operations, strategy, core values and management philosophy. We continually build our management bench strength through identification of high potential talents as part of the regular succession planning process.
Our talent management programme comprises a set of organisational core competencies as well as position specific competencies. As part of the annual performance and career development review, all employees can openly discuss their performance and future aspirations with their supervisors. They broach topics such as possible career moves and recommended training plans.
Fair RemunerationWe offer all employees comprehensive and competitive remuneration packages. These include short-term cash bonus and long-term equity-based reward plans such as restricted share and performance share programmes. Such equity-based reward plans help to strengthen the link between reward and performance, as well as to retain talent.
All employees receive staff benefits including a flexible benefits plan and leave entitlements for maternity/paternity and volunteer reasons. We recognise that employees have diverse needs, and a flexible benefits plan enables them to complement their personal medical and insurance needs with those provided by the company. Employees can thus customise their benefits to suit their needs.
To ensure that we can continue to attract and retain talent, we regularly engage external human resource consultants to benchmark our compensation and benefits packages against other peers and industries in Singapore.
Almost 52.7% of employees have been with us for five years or longer. We also interview resigning employees as part of its continuing efforts to improve its retention policies and initiatives.
Sustainability Management
CapitaLand Mall Trust
Annual Report 2016

73
These guidelines also suggest various arrangements such as providing company retraining programmes for workers, redeployment of workers to alternative areas of work, implementing flexible work arrangements and managing wage costs through a flexible wage system.
In the event of termination or employee resignation, there is a minimum notice period of one month that needs to be fulfilled, depending on the employee’s job grade.
Freedom of AssociationCapitaLand maintains a harmonious relationship with the Singapore Industrial & Services Employees’ Union. In Singapore, CapitaLand is guided by the Industrial Relations Act that allows representation of staff by trade unions for collective bargaining, thus providing them with an avenue to seek redress for any industrial disputes. CapitaLand and the union enjoy a cordial working relationship, promoting positive working conditions and improving productivity for the mutual benefit of employees and the company. Currently, 40.8% of our workforce are union members.
CMA Green Day 2016 – ‘Building a Greener Future’
In the true spirit of sustainability and green living, some 280 staff and their family members braced the rain and gathered at Marina Barrage on 7 October 2016 for the fifth CapitaLand Mall Asia (CMA) Green Day. CMA Green Day was held to recognise and reinforce employees’ efforts in raising our standards in EHS.
Overview
Business Review
Corporate Governance & Transparency
Portfolio Details
Sustainability
Financials & Additional Information
Re-employment OpportunitiesCapitaLand has a re-employment policy in place for employees who have reached the mandatory retirement age of 62 but are still able and willing to continue working for the company. In 2016, we have eight employees who were above retirement age.
Ethics and IntegrityCapitaLand adopts a strong stance against bribery and corruption. In addition to clear guidelines and procedures for the giving and receipt of corporate gifts and concessionary offers, where all employees are required to make a declaration on an annual basis where they pledge to uphold CapitaLand’s core values and not to engage in any corrupt or unethical practices. This serves as a reminder to all employees to maintain the highest standards of integrity in their work and business dealings.
CapitaLand’s zero tolerance policy towards bribery and corruption extends to its business dealings with third parties. Pursuant to this policy, CapitaLand requires that certain agreements incorporate anti-bribery and anti- corruption provisions.
A whistle-blowing policy and other procedures are put in place to provide employees and parties who have dealings with CapitaLand with well defined, accessible and trusted channels to report suspected fraud, corruption, dishonest practices or other improprieties in the workplace, and for the independent investigation of any reported incidents and appropriate follow up action. The objective of the whistle-blowing policy is to encourage the reporting of such matters so that employees or external parties making any reports in good faith will be able to do so with the confidence that they will be treated fairly and, to the fullest extent possible, be protected from reprisal.
CapitaLand adheres to an ethics and code of business conduct policy which deals with issues such as confidentiality, conduct and work discipline, corporate gifts and concessionary offers. Clear policies and guidelines on how to handle workplace harassment and grievances are also in place. The policies implemented aim to help to detect and prevent occupational fraud in mainly three ways. First, we offer fair compensation packages, based on practices of pay-for performance and promotion based on merit, to our employees. We also provide various healthcare subsidies and financial assistance schemes to alleviate the common financial pressures our employees face. Second, clearly documented policies and work procedures incorporate internal controls which ensure that adequate checks and balances are in place.

74
Sustainability Management
CapitaLand Mall Trust
Annual Report 2016
We also supported annual national campaign ‘Eat with Your Family Day’ in May 2016 by giving employees time off to leave offices earlier to dine with their families. To provide our employees with a better work-life balance, we have a flexible work arrangement policy which permits flexible working hours, working from home or part-time work arrangements.
Staff EngagementWe believe it is important to integrate and engage staff across Singapore through regular communication. Staff communication sessions by senior management are conducted at least twice a year. During these staff communication sessions, information on financial results and key business focus is shared with employees. These sessions include a question and answer session, where employees can ask questions and management seeks to gather feedback from them.
CapitaLand’s intranet is a valuable platform to keep employees informed about the recent developments, including details on employment terms, benefits and practices as well as ethics and code of business conduct policies.
CapitaLand engages an independent consultancy firm to conduct a biennial Employee Engagement Survey (EES). The last survey was done in 2015 in which more than 97.0% of employees participated. An independent consultancy firm was appointed to administer the survey and to ensure confidentiality in soliciting honest responses from the staff. The results of EES 2015 have been shared with staff in the first quarter of 2016 and follow up action was planned subsequently.
HEALTH AND SAFETYAll employees are expected to take ownership of OHS issues, and are encouraged to be proactive in reporting all OHS-related incidences alongside non-compliance and non-conformities.
Periodic audits are also conducted to evaluate the efficacy of these internal controls. Finally, we seek to build and maintain the right organisational culture through CapitaLand’s core values, educating our employees on good business conduct and ethical values.
This is reinforced by CapitaLand’s policy and procedure on Business Malpractice Incidents (BMIs) that facilitates functional managers to swiftly report any BMI discovered in their workplace or in the course of their work directly to their respective Chief Executive Officers. Substantiated BMI cases are reported quarterly to the Audit Committee and shared with the risk champions regularly. Actions taken could include the termination of staff contract, and/or reporting to the appropriate external authorities.
To instill CapitaLand’s core values and principles, new hires undergo the CapitaLand Immersion Program (CIP) which includes a mandatory module on anti-corruption policies and procedures. Employees were retrained to see how these values can apply to their daily work.
Staff WellnessCapitaLand aims to provide a work environment that is safe and contributes to the general well-being of its employees.
In Singapore, CapitaLand implemented a Total Well-Being Programme to promote health and well-being of its staff. We regularly organise recreational, team building events and brainstorming workshops to reinforce organisational cohesiveness as part of our concerted efforts to engage our workforce. In 2016, activities such as complimentary health screenings, free flu vaccinations and health-related activities were organised to encourage a well-balanced and healthy lifestyle among employees. Recreational activities also included CapitaLand Family Day at Gardens by the Bay, a movie day, a durian feast, a bowling challenge and an annual dinner party. CapitaLand combined its annual CapitaLand Volunteer Day and My Schoolbag programme at Raffles City Singapore in which our employees attended. Regular exercise sessions such as yoga and Zumba classes, continued to be organised to promote an active lifestyle. Tips on healthy living and exercise were updated on the CapitaLand’s intranet.

75Overview
Business Review
Corporate Governance & Transparency
Portfolio Details
Sustainability
Financials & Additional Information
2016 2015 2014
Number of work-related injuries 1.0 3.0 3.0
Work-related fatalities/permanent disabilities 0 0 0
Absentee rate
(days per employee per year)7.0 6.9 6.8
In 2016, we recorded an absentee rate of seven days. In terms of work-related injuries, there was one reported incident in 2016 versus three cases in 2015. The affected staff has since returned to work. We have also tightened safety measures and improved our standard operating procedures accordingly.
We have a duty of care to ensure occupational health and safety of all employees and monitor our operations to ensure safety risks are controlled.
We have adopted an OHSMS which was certified to OHSAS 18001 international standards in 2009. The OHSMS is audited by a third-party accredited certification body.
Our OHS targets are:
• Zero incident resulting in staff permanent disability or fatality
• All main contractors for major projects have to be OHSAS 18001 certified (or equivalent)
We complied fully with OHS laws and regulations in Singapore. During the year, we reported zero staff work-related permanent disability or fatality. All main contractors appointed in 2016, for projects with GFA of at least 2,000 square metres, were ISO 14001 and OHSAS 18001 certified.
We ensure our vendors are in compliance with local regulations and adequately trained and we briefed them on our EHS measures. We share our house rules to keep everyone abreast of the requirements when working in our properties. All our vendors are encouraged to achieve certification of bizSAFE Level 3 and above. A majority of our contractors and service providers are minimum bizSAFE Level 3 certified.
Our tenants’ and shoppers’ health and safety are of utmost importance and we have in place standard operating procedures to address potential OHS risks. We conduct evacuation drills to familiarise our tenants and staff on the emergency response plan.
Tampines Mall participated in Singapore’s largest anti-terror exercise. Led by the Singapore Police Force, the multi-agency exercise stimulated a situation in which simultaneous terror attacks took place across multiple locations in Singapore. This is meant to test Singapore‘s readiness to deal with a major terrorist incident.
Our Operation Managers are appointed officially as Fire Safety Managers and they are certified by Singapore Civil Defence Force. Our Emergency Respond Teams also undergo certified trainings to ensure competency and all our properties are equipped with Automated External Defibrillators (AED). Our Property Managers undergo accredited trainings in AED, cardiopulmonary resuscitation and first aid every two years.
OHS is important to CMT, its employees, tenants, contractors, suppliers and the communities who use its properties.

76
OUR COMMUNITYAs satellite hubs, CMT’s malls are strategic channels for engaging the local community through activities held in partnership with government and community organisations that support community causes, promote an inclusive society and educate shoppers on healthy living and environmental sustainability.
We are committed to building safe, accessible, vibrant and quality developments to enhance the lives of members of the community. Our social integration criteria include:
• Ensuring accessibility in the built environment to people of different age groups and varying mobility
• Enhancing connectivity to public transport, roads, amenities and between buildings
• Providing community spaces as public gathering points
These criteria are integrated into the CapitaLand’s SBG to ensure that they are considered from the start of the project development process. Universal Design considerations ensure that public spaces in our projects are accessible to users of different age groups and varying abilities. These include:
• Seamless connectivity to the external surroundings, such as bus-stops, adjacent buildings, streets and sidewalks
• Barrier-free access from accessible parking lots/family parking lots to lift lobbies
• Sheltered and barrier-free drop-off areas• Accessible (handicap) parking lots, family parking lots• Designated pedestrian lanes in car parks• Amenities such as accessible toilets, lifts and nursing
rooms• Duress alarms in accessible toilets• Atrium spaces, libraries and children play areas
CMT has been awarded with BCA Universal Design Mark Awards for three of our developments:
JCube – GoldPLUS (2013)Westgate – Platinum (2015)Bedok Mall – GoldPLUS (2016)
All our properties have at least one disability access enabled facility. These facilities include accessible alighting and boarding bays, lifts, parking lots and public toilets. Our shopping malls are guide-dog friendly.
Most of our properties are conveniently located close to transport hubs such as MRT stations and bus interchanges. This allows easy access to the surrounding communities and facilities. Free shuttle bus services are also available at some of our properties. Bicycle parking facilities are also provided at many of our properties.
Westgate hosted the ‘BCA Green Office’ exhibition organised by BCA to educate the importance of environmental sustainability. Westgate was chosen as one of the few exhibition venues for its strategic location in the heart of Jurong East, with many offices and commercial buildings around the vicinity, and Westgate’s Courtyard showcasing the property’s green features.
During the year, we have collaborated with various non-profit organisations to bring various activities and events into our malls to promote heritage, community causes, healthy living and corporate social responsibility.
Heritage Junction 8 partnered with the National Museum of Singapore in conjunction with Singapore Heritage Fest to bring in the ‘Kampong Spirit, Kampong Fun’ exhibition. Shoppers were reacquainted with kampung life in Singapore through traditional games such as five stones, congkak, hopscotch and capteh.
Sembawang Shopping Centre collaborated with the National Heritage Board to bring in ‘Tales from our Shores’. With a storyboard-like set up, ‘Tales from our Shores’ brought shoppers back to the time of Singapore’s very own folklore, and how they relate to the many familiar places around the island such as the Sembawang Hot Spring.
Community Causes For the second year running, Bedok Mall partnered Kampong Chai Chee Community Centre Youth Executive Committee, FairPrice Finest and Bethesda Cathedral to organise the ‘Canstruction’ event. Bedok Mall successfully entered the Singapore Book of Records with the ‘Largest Sculpture made of Canned Food’. All the canned food collected were then distributed to the less privileged families in Bedok.
Bugis+ supported the Yellow Ribbon Project roadshow where products made by inmates such as cookies, paintings and pottery items were sold. Proceeds from the sale of these items at the mall went to the Yellow Ribbon Fund, which supports programmes for ex-offenders and their families.
Lot One Shoppers’ Mall (Lot One) hosted the Signature Love Project by National University of Singapore (NUS) where funds were raised to aid single mothers and their young children to improve their social mobility capabilities. The mall also hosted the Touch of the Hearts Charity Carnival by NUS students to raise funds for Rainbow Centre.
Sustainability Management
CapitaLand Mall Trust
Annual Report 2016

77Overview
Business Review
Corporate Governance & Transparency
Portfolio Details
Sustainability
Financials & Additional Information
Tampines Mall was the venue sponsor for ‘Stay Prepared’, a Temasek Cares’ community outreach event, held with the aim of preparing the community to be ready for the unexpected. Shoppers acquired useful first aid skills and knowledge during the three-day event to prepare them for unforeseen incidents.
JCube hosted the Neighbourhood Police Centre Anti-Scam roadshow to engage the public and promote scam awareness through informative exhibition panels, games and videos. The event was graced by Ms Grace Fu, Minister for Culture, Community and Youth.
Westgate hosted the Skills Future Marketplace event organised by the Workforce Development Authority to educate the community on how to equip themselves for a better future and stay relevant in the workplace. The event was graced by Deputy Prime Minister, Tharman Shanmugaratnam.
EnvironmentBedok Mall supported the World Wildlife Fund roadshow to enhance the awareness among the public of the impact of deforestation and haze pollution on wildlife and educate the importance of forests in the ecosystem.
To raise the importance of recycling during the Christmas festive season, Raffles City Singapore and Lot One partnered Coca-Cola® to give recycled bottles a new lease of life in the form of life-size snowy Christmas displays. Coca-Cola® Recycle Happiness machine was also stationed beside the displays. Surprise gifts were dispensed from the machine with each bottle recycled by shoppers. CapitaLand Hope Foundation donated S$2 to Community Chest-supported Rainbow Centre (Margaret Drive) for every bottle recycled.
Healthy Living In collaboration with the local community clubs, community development councils, Sport Singapore and Health Promotion Board, Bukit Panjang Plaza, Clarke Quay, IMM Building, JCube, Junction 8, Lot One and Westgate hosted regular weekday after 6 pm fitness sessions at the community plazas. These include workouts such as kickboxing, aerobics, Zumba and qi gong.
Bukit Panjang Plaza hosted Health Promotion Board’s ‘Eat, Drink, Shop Healthy And Win Big!’ event in October 2016. Shoppers were entitled to one lucky dip chance to win shopping vouchers with any purchase of a healthier dish, lower-sugar drink or groceries with the Healthier Choice Symbol.
JCube, IMM Building and Westgate partnered with Health Promotion Board to host the National Steps Challenge Season 2 launch roadshow to promote healthy living in Singapore. A walk and win contest was held as part of this event at the J-Walk link bridge between IMM Building and Westgate to encourage the use of the link bridge as part of an exercise routine.
In support of ‘Get Active! Singapore’ week-long sporting bash during National Day organised by Sport Singapore, Bedok Mall, Junction 8 and Lot One held an After 6 Reboot SG51 Sprint Relay Challenge. The challenge was held on weekdays after 6 pm for a week to promote regular exercise. It was a race where participants paired up and strived to complete a running distance of 51 metres together in the shortest time to win attractive prizes.
My SchoolbagCapitaLand’s key annual corporate social responsibility programme ‘My Schoolbag’, held for the eighth consecutive year reached out to 1,000 underprivileged children from low-income families. The guest-of-honour of the event was Mr Tan Chuan-Jin, Minister for Social and Family Development. Each child was given a new school bag, new stationeries and daily necessities. More than 400 child beneficiaries were brought to Raffles City Singapore for a half day edutainment programme where they were treated to a Little Architect Skit, kids workout as well as art and craft workshops. The CapitaLand-People’s Association Community Development Fund was launched at the event. The fund was set up to support 1,000 children aged six to 13 in the form of daily necessities and educational activities. The fund will also support the children with one meal for each school day for a year. More than 200 staff volunteers took part in the event.
Programme for TenantsBiz+ Series 2016, a tenant engagement programme comprising seminars, workshops and networking sessions, was themed on ‘Bridging the Online-to-Offline (O2O) Gap in Retail’. Three seminars were held centred on this theme to help retailers be aware of and identify growth opportunities in the evolving consumer retail landscape. Industry experts in new mobile payment modes and digital marketing tactics were invited to share insights on how retailers can engage customers from the online to the offline space.
A CEO breakfast roundtable session titled ‘Upsize: Millennial Customers’ was also organised in September 2016 where leaders of various retail brands came together for a lively discussion on ways to adapt to the millennials to secure their business and loyalty as they become the upcoming influential group of consumers in the next 15 years.

78
Operations Review
CapitaLand Mall Trust
Annual Report 2016
1 Based on retail leases only.2 Includes Sembawang Shopping Centre and JCube.3 Excludes Funan which was closed on 1 July 2016 for redevelopment.
Summary of Renewals / New Leases (From 1 January to 31 December 2016) (excluding newly created and reconfigured units)
Tampines Mall 49 83.7 102,527 28.9 3.4
Junction 8 61 82.0 68,796 27.2 3.7
IMM Building1 56 91.1 103,671 24.5 4.5
Plaza Singapura 68 76.5 109,890 22.7 3.2
Bugis Junction 90 82.2 82,341 20.8 3.4
Raffles City Singapore1 74 77.0 78,677 18.5 2.0
Lot One Shoppers’ Mall 34 88.2 22,337 10.2 2.1
Bukit Panjang Plaza 39 76.9 25,280 15.5 3.1
The Atrium@Orchard1 22 59.1 31,208 23.0 (2.5)
Clarke Quay 19 84.2 63,998 21.9 0.1
Bugis+ 18 55.6 24,294 11.3 (8.0)
Westgate 52 76.9 49,353 12.0 (7.2)
Bedok Mall 53 92.5 34,239 15.4 (1.3)
Other assets2 69 73.9 93,195 26.7 (4.9)
CMT Portfolio3 704 80.1 889,806 20.5 1.0
Property
Number of Renewals / New Leases
Retention Rate
%
Increase in Current Rental
Rates vs Preceding Rental Rates
(Typically committed three years ago)
%Areasq ft
Percentage of Property
%
Net Lettable Area (NLA)
Lease Renewals and New LeasesThe retention rate of our tenants in 2016 was 80.1%, reflecting our strong relationship with our tenants as well as our proactive lease management to constantly refresh the tenant mix in each mall to remain relevant and attractive to our shoppers. On a portfolio basis, rental rates for lease renewals and new leases in 2016 saw an average increase of 1.0% against preceding rental rates at the end of typical three-year leases.

79Overview
Business Review
Corporate Governance & Transparency
Portfolio Details
Sustainability
Financials & Additional Information
Portfolio Lease Expiry ProfileOur tenants typically have three-year lease terms. The portfolio lease expiry profile remained evenly spread out as at 31 December 2016, with 25.6% and 29.0% of the leases by gross rental income due for renewal in 2017 and 2018 respectively. The portfolio weighted average lease expiry by gross rental income was 2.0 years. For new leases in 2016, the weighted average lease expiry based on the date of commencement of the leases was 2.9 years and accounted for 29.3% of the leases by gross rental income.
Portfolio Lease Expiry Profile1 (As at 31 December 2016)
Portfolio Lease Expiry Profile for 20171 (As at 31 December 2016)
1 Based on committed leases. Includes CMT’s 40.00% interest in Raffles City Singapore (excluding hotel lease), CMT’s 30.00% interest in Westgate and excludes Funan which was closed on 1 July 2016 for redevelopment.
2 Based on the month in which the lease expires and excludes gross turnover rent.3 Of which 799 leases are retail leases.
1 Based on committed leases. Includes CMT’s 40.00% interest in Raffles City Singapore (excluding hotel lease), CMT’s 30.00% interest in Westgate and excludes Funan which was closed on 1 July 2016 for redevelopment.
2 As a percentage of NLA for each respective property as at 31 December 2016.3 As a percentage of gross rental income for each respective property and excludes gross turnover rent.4 Includes non-retail leases for IMM Building, Raffles City Singapore and The Atrium@Orchard. 5 Includes Sembawang Shopping Centre and JCube.6 Of which 799 leases are retail leases.
Number of Leases % of Gross Rental Income2
2017 9223 25.6
2018 919 29.0
2019 838 29.2
2020 174 8.1
2021 34 2.8
2022 and beyond 26 5.3
Total 2,913 100.0
Property Number of Leases % of Property NLA2 % of Property Income3
Tampines Mall 34 26.0 22.2
Junction 8 46 26.4 27.0
IMM Building4 168 28.6 23.2
Plaza Singapura 76 28.7 30.1
Bugis Junction 60 19.7 24.3
Raffles City Singapore4 60 14.1 16.5
Lot One Shoppers’ Mall 70 30.6 40.1
Bukit Panjang Plaza 36 15.8 21.5
The Atrium@Orchard4 14 6.4 8.8
Clarke Quay 9 8.6 10.9
Bugis+ 15 15.5 17.7
Westgate 133 35.8 43.5
Bedok Mall 97 51.4 50.7
Other assets5 104 15.1 21.8
CMT Portfolio 9226 22.9 25.6

80
Operations Review
CapitaLand Mall Trust
Annual Report 2016
10 Largest Tenants of CMT1 (As at 31 December 2016)
Tenant Trade Sector% of Gross
Rental Income2
RC Hotels (Pte) Ltd Hotel 3.2
Temasek Holdings (Private) Limited Office 2.6
Cold Storage Singapore (1983) Pte Ltd Supermarket / Beauty & Health / Services / Warehouse
2.5
Robinson & Co. (Singapore) Pte Ltd Department Store / Beauty & Health 2.5
NTUC Enterprise Supermarket / Beauty & Health / Food & Beverage / Services
2.0
Wing Tai Clothing Pte Ltd Fashion / Sporting Goods 1.6
BHG (Singapore) Pte. Ltd. Department Store 1.6
Auric Pacific Group Limited Food & Beverage 1.3
Isetan (Singapore) Limited Department Store / Supermarket 1.2
BreadTalk Pte Ltd Food & Beverage 1.2
Total 19.7
Top 10 TenantsCMT’s gross rental income is well distributed within its portfolio of more than 2,900 leases. As at 31 December 2016, no single tenant contributed more than 4.0% of the total gross rental income. Collectively, the 10 largest tenants accounted for about 19.7% of the total gross rental income.
1 Includes CMT’s 40.00% interest in Raffles City Singapore, CMT’s 30.00% interest in Westgate and excludes Funan which was closed on 1 July 2016 for redevelopment.
2 Based on gross rental income for the month of December 2016 and excludes gross turnover rent.

81Overview
Business Review
Corporate Governance & Transparency
Portfolio Details
Sustainability
Financials & Additional Information
Trade Sector AnalysisCMT’s portfolio is well diversified and leverages on many different trade sectors for rental income. As at 31 December 2016, Food & Beverage (F&B) remained the largest contributor to gross rental income at 30.0% of the total portfolio. Fashion remained the second largest contributor to gross rental income at 13.4%.
Approximately 80.0% of CMT’s properties in the portfolio caters to the necessity shopping segment, in terms of gross revenue and asset valuation.
1 Includes CMT’s 40.00% interest in Raffles City Singapore (excluding hotel lease), CMT’s 30.00% interest in Westgate and excludes Funan which was closed on 1 July 2016 for redevelopment.
2 Excludes gross turnover rent.3 Includes tenants approved as thematic dining, entertainment and a performance centre in Bugis+.4 Others include Art Gallery and Luxury.
Breakdown of CMT Portfolio1 by Trade Sector (For the month of December 2016)
% of Gross Rental Income2
Food & Beverage 30.0
Fashion 13.4
Beauty & Health 10.8
Services 6.4
Department Store 6.1
Gifts & Souvenirs / Toys & Hobbies / Books & Stationery / Sporting Goods 5.4
Leisure & Entertainment / Music & Video3 4.6
Shoes & Bags 4.3
Supermarket 4.1
Office 3.1
Jewellery & Watches 2.7
Home Furnishing 2.6
Electrical & Electronics 1.8
Education 1.4
Warehouse 1.4
Information Technology 1.2
Others4 0.7
Total 100.0

82
Operations Review
CapitaLand Mall Trust
Annual Report 2016
1 Excludes Funan which was closed on 1 July 2016 for redevelopment.2 Includes Tampines Mall, Junction 8, IMM Building, Plaza Singapura, Bugis Junction, Sembawang Shopping Centre, JCube, Lot One Shoppers’
Mall, Bukit Panjang Plaza, The Atrium@Orchard, Bedok Mall and CMT’s 30.00% interest in Westgate. 3 Includes Clarke Quay, Bugis+ and CMT’s 40.00% interest in Raffles City Singapore.
% Necessity Shopping2 79.5 Discretionary Shopping3 20.5
% Necessity Shopping2 79.3 Discretionary Shopping3 20.7
By Gross Revenue(For full year 2016)
By Asset Valuation(As at 31 December 2016)
CMT Portfolio1 (Necessity Shopping vs Discretionary Shopping)

83Overview
Business Review
Corporate Governance & Transparency
Portfolio Details
Sustainability
Financials & Additional Information
N.A.: Not Applicable.
1 Funan was closed on 1 July 2016 for redevelopment.2 Based on retail leases only.3 Lower occupancy rates were mainly due to asset enhancement initiatives (AEI).4 Other assets include: a) Sembawang Shopping Centre, except for 2007 and 2008 when it underwent an AEI; b) Rivervale Mall, until it was sold in 2015; c) Hougang Plaza, until it was sold in 2012; d) JCube, except from 2008 to 2011 when it underwent an AEI; and e) Bugis+, which was acquired in 2011 and subsequently underwent an AEI from November 2011 to July 2012. The asset was classified separately from 2012 onwards.5 Includes retail and office leases.
Occupancy RateCombined with our extensive network of international and local retailers, our active asset management and proactive leasing strategy have helped us to maintain high occupancy rates over past years. The portfolio occupancy rate was 98.5% as at 31 December 2016.
As at 31 December 2007 2008 2009 2010 2011 2012 2013 2014 2015 2016
Tampines Mall 100.0 100.0 100.0 100.0 100.0 100.0 100.0 99.5 100.0 99.2
Junction 8 100.0 100.0 100.0 100.0 100.0 99.6 99.4 100.0 100.0 99.9
Funan 99.7 99.8 99.3 100.0 100.0 100.0 98.2 97.9 95.3 N.A.1
IMM Building2 99.9 100.0 99.7 100.0 100.0 98.1 99.0 96.03 96.0 97.9
Plaza Singapura 100.0 99.8 100.0 100.0 100.0 91.3 100.0 100.0 99.7 100.0
Bugis Junction 100.0 100.0 100.0 100.0 100.0 100.0 100.0 100.0 99.7 99.9
Other assets4 100.0 100.0 99.8 99.8 80.93 99.8 100.0 98.1 92.6 95.3
Raffles City Singapore2 100.0 100.0 100.0 99.6 100.0 100.0 100.0 100.0 99.6 99.7
Lot One Shoppers’ Mall 92.73 99.3 99.9 99.6 99.7 99.8 100.0 100.0 99.8 99.9
Bukit Panjang Plaza 99.9 100.0 99.8 100.0 100.0 100.0 99.8 100.0 97.8 99.9
The Atrium@Orchard5 98.0 99.1 93.5 65.53 95.3 99.5 99.9 98.2 97.6
Clarke Quay 100.0 100.0 97.9 100.0 95.9 88.2 90.7
Bugis+ 99.5 100.0 100.0 99.2 100.0
Westgate 85.8 97.7 97.6 99.6
Bedok Mall 99.9 100.0
CMT Portfolio 99.6 99.7 99.8 99.3 94.8 98.2 98.5 98.8 97.6 98.5
Occupancy Rate (%)

84
Operations Review
CapitaLand Mall Trust
Annual Report 2016
1 For comparable basis, CMT portfolio includes Bedok Mall which was acquired on 1 October 2015; and excludes Funan which was closed on 1 July 2016 for redevelopment as well as Rivervale Mall which was sold on 15 December 2015.
Portfolio Tenants’ SalesCMT’s tenants’ sales on a S$ per square foot (psf) per month basis, increased by 0.9% in 2016 compared to the preceding year. Although part of CMT’s rental structure comprises gross turnover rent which is pegged to tenants’ sales, gross turnover rent made up only a small percentage of CMT’s gross revenue. It is typically about 5.0%, thus ensuring the stability of CMT’s gross revenue.
20162015
Tenants’ Sales of CMT Portfolio1 (S$ psf per month)
100
75
50
25
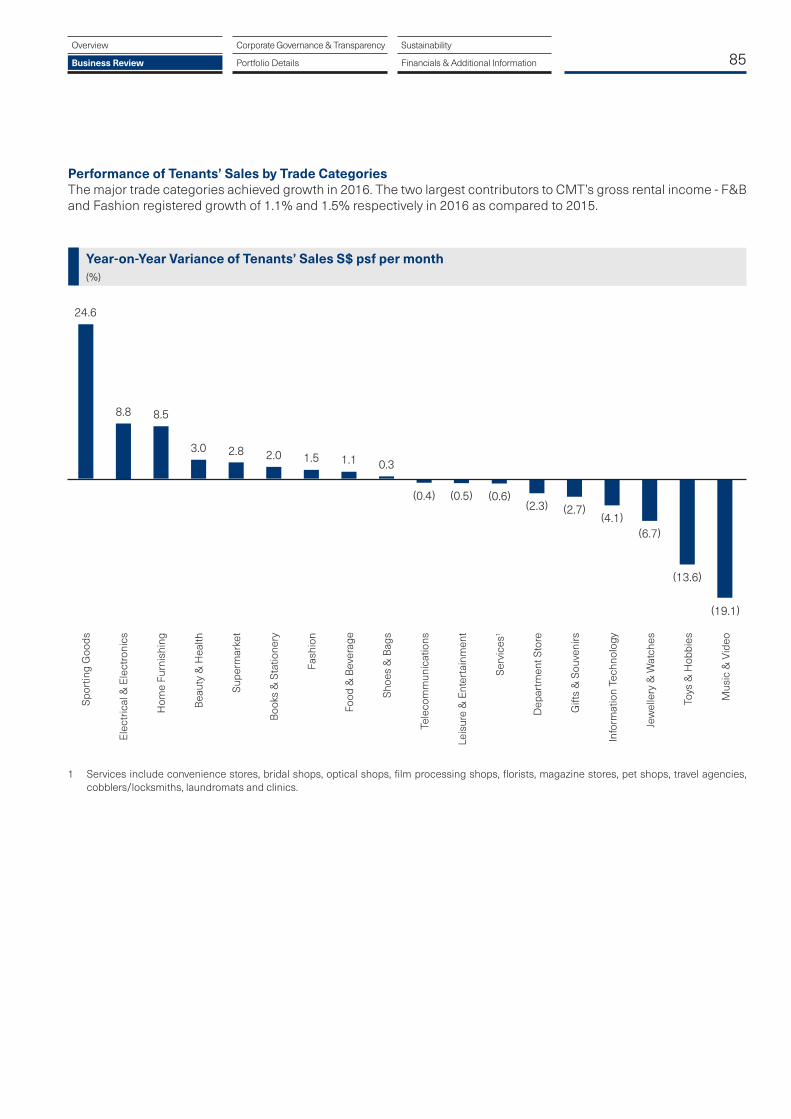
85Overview
Business Review
Corporate Governance & Transparency
Portfolio Details
Sustainability
Financials & Additional Information
1 Services include convenience stores, bridal shops, optical shops, film processing shops, florists, magazine stores, pet shops, travel agencies, cobblers/locksmiths, laundromats and clinics.
Performance of Tenants’ Sales by Trade CategoriesThe major trade categories achieved growth in 2016. The two largest contributors to CMT’s gross rental income - F&B and Fashion registered growth of 1.1% and 1.5% respectively in 2016 as compared to 2015.
24.6
8.8 8.5
3.0 2.8 2.0 1.5 1.1 0.3
(0.4) (0.5) (0.6)(2.3) (2.7)
(4.1)(6.7)
(13.6)
(19.1)
Year-on-Year Variance of Tenants’ Sales S$ psf per month (%)
Spor
ting
Goo
ds
Elec
tric
al &
Ele
ctro
nics
Hom
e Fu
rnis
hing
Bea
uty
& H
ealth
Supe
rmar
ket
Boo
ks &
Sta
tione
ry
Fash
ion
Food
& B
ever
age
Shoe
s &
Bag
s
Tele
com
mun
icat
ions
Leis
ure
& E
nter
tain
men
t
Serv
ices
1
Dep
artm
ent S
tore
Gift
s &
Sou
veni
rs
Info
rmat
ion
Tech
nolo
gy
Jew
elle
ry &
Wat
ches
Toys
& H
obbi
es
Mus
ic &
Vid
eo

86
Operations Review
CapitaLand Mall Trust
Annual Report 2016
1 Occupancy cost is defined as a ratio of gross rental (inclusive of service charge, advertising and promotional charge and gross turnover rent) to tenants’ sales.
2 Includes Bedok Mall; and excludes Bugis Junction as well as Rivervale Mall. On a comparable mall basis (includes Bugis Junction and excludes Funan), the occupancy cost was 19.2% in 2015.
3 Excludes Funan which was closed on 1 July 2016 for redevelopment.
1 For comparable basis, CMT portfolio includes Bedok Mall which was acquired on 1 October 2015; and excludes Funan which was closed on 1 July 2016 for redevelopment as well as Rivervale Mall which was sold on 15 December 2015.
Shopper TrafficShopper traffic increased by 2.3% year-on-year in 2016. We continually refresh and enhance the retail offerings of our malls and shopping experiences of our shoppers through AEI, active management of the tenant mix in each mall and marketing efforts.
Occupancy CostCMT’s portfolio occupancy cost remained healthy and registered at 19.0% in 2016. Occupancy cost is dependent on various factors including trade mix and type of tenants in the portfolio.
Occupancy Cost1 of CMT Portfolio (%)
Shopper Traffic1
(million)
19.018.5
2016
20163
2015
20152
320
360
280
240
200
87Overview
Business Review
Corporate Governance & Transparency
Portfolio Details
Sustainability
Financials & Additional Information
Asset Enhancement InitiativesSituated as a bustling city landmark, Raffles City Singapore has embarked on interior rejuvenation works in the third quarter of 2016 to reinforce its position as one of Singapore’s top shopping destinations. The improvements will cover the main entrance and mall interiors, including the Central Atrium at Level 3. The rejuvenation works are expected to be completed in the first quarter of 2018.
Plaza Singapura and Tampines Mall completed their rejuvenation works in the fourth quarter of 2016. Plaza Singapura now boasts a refurbished mall interior with brighter corridor lighting, new nursing rooms, refreshed lift lobbies and escalator landings as well as a new shoppers’ lounge on Level 1. Similarly, visitors to Tampines Mall can now shop in an even more comfortable environment with new interior finishes as well as a refreshed main atrium fascia and balustrade, and enjoy an upgraded Garden Plaza on Level 4. The improved overall aesthetics of the malls enhances the shoppers’ retail experience.
Redevelopment of Funan Funan DigitaLife Mall was closed on 1 July 2016 to embark on three years of redevelopment works. The proposed development and related costs including financing, technology and professional fees amounted to approximately S$560.0 million.
The new Funan held its groundbreaking ceremony on 7 September 2016. The integrated development has a total gross floor area of approximately 887,000 square feet, comprising six-storey retail mall, two office towers and one block of serviced residences. Funan will allow communities to live, work and play in a collaborative and interactive space. Building on the legacy of its predecessor as Singapore’s definitive information technology mall, the reimagined Funan will incorporate technology throughout the entire integrated development.
The demolition works were completed and the site was handed over to the main contractor in January 2017. Funan is targeted for completion in the fourth quarter of 2019.
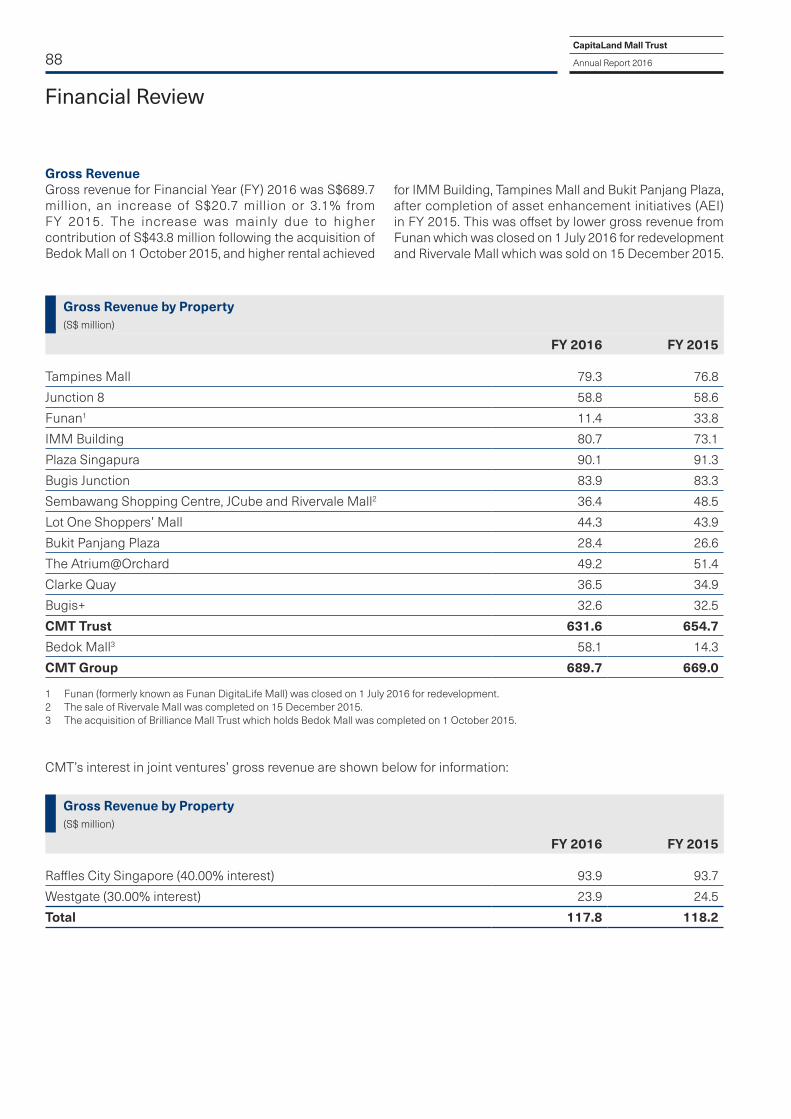
88
Financial Review
CapitaLand Mall Trust
Annual Report 2016
Gross Revenue Gross revenue for Financial Year (FY) 2016 was S$689.7 million, an increase of S$20.7 million or 3.1% from FY 2015. The increase was mainly due to higher contribution of S$43.8 million following the acquisition of Bedok Mall on 1 October 2015, and higher rental achieved
1 Funan (formerly known as Funan DigitaLife Mall) was closed on 1 July 2016 for redevelopment.2 The sale of Rivervale Mall was completed on 15 December 2015. 3 The acquisition of Brilliance Mall Trust which holds Bedok Mall was completed on 1 October 2015.
for IMM Building, Tampines Mall and Bukit Panjang Plaza, after completion of asset enhancement initiatives (AEI) in FY 2015. This was offset by lower gross revenue from Funan which was closed on 1 July 2016 for redevelopment and Rivervale Mall which was sold on 15 December 2015.
Gross Revenue by Property (S$ million)
Gross Revenue by Property (S$ million)
FY 2016 FY 2015
Tampines Mall 79.3 76.8
Junction 8 58.8 58.6
Funan1 11.4 33.8
IMM Building 80.7 73.1
Plaza Singapura 90.1 91.3
Bugis Junction 83.9 83.3
Sembawang Shopping Centre, JCube and Rivervale Mall2 36.4 48.5
Lot One Shoppers’ Mall 44.3 43.9
Bukit Panjang Plaza 28.4 26.6
The Atrium@Orchard 49.2 51.4
Clarke Quay 36.5 34.9
Bugis+ 32.6 32.5
CMT Trust 631.6 654.7
Bedok Mall3 58.1 14.3
CMT Group 689.7 669.0
FY 2016 FY 2015
Raffles City Singapore (40.00% interest) 93.9 93.7
Westgate (30.00% interest) 23.9 24.5
Total 117.8 118.2
CMT’s interest in joint ventures’ gross revenue are shown below for information:

89Overview
Business Review
Corporate Governance & Transparency
Portfolio Details
Sustainability
Financials & Additional Information
Net Property IncomeAs a result of the higher gross revenue, net property income (NPI) of S$479.7 million was S$13.5 million or 2.9% higher than the S$466.2 million for FY 2015. This was mainly due to Bedok Mall which was acquired on 1 October 2015 and higher rental achieved from
1 Funan (formerly known as Funan DigitaLife Mall) was closed on 1 July 2016 for redevelopment.2 The sale of Rivervale Mall was completed on 15 December 2015. 3 The acquisition of Brilliance Mall Trust which holds Bedok Mall was completed on 1 October 2015.
Net Property Income by Property (S$ million)
Net Property Income by Property (S$ million)
FY 2016 FY 2015
Tampines Mall 58.8 56.8
Junction 8 41.8 41.9
Funan1 3.8 22.8
IMM Building 54.1 46.8
Plaza Singapura 67.5 67.8
Bugis Junction 60.8 62.0
Sembawang Shopping Centre, JCube and Rivervale Mall2 19.7 28.0
Lot One Shoppers’ Mall 30.8 30.7
Bukit Panjang Plaza 18.3 17.2
The Atrium@Orchard 37.8 39.0
Clarke Quay 21.3 20.9
Bugis+ 22.3 22.0
CMT Trust 437.0 455.9
Bedok Mall3 42.7 10.3
CMT Group 479.7 466.2
FY 2016 FY 2015
Raffles City Singapore (40.00% interest) 70.1 69.2
Westgate (30.00% interest) 16.6 16.9
Total 86.7 86.1
IMM Building. The above was partially offset by lower NPI from Funan which was closed on 1 July 2016 for redevelopment and sale of Rivervale Mall on 15 December 2015.
CMT’s interest in joint ventures’ NPI are shown below for information:

90
Financial Review
CapitaLand Mall Trust
Annual Report 2016
DistributionsDistribution for FY 2016 was S$394.3 million, an increase of S$2.3 million or 0.6% compared to FY 2015. The increase was mainly attributable to the acquisition of Bedok Mall on 1 October 2015 which was part funded by the issuance of 72.0 million units with balance comprising bank borrowings, partially offset by Funan which was closed on 1 July 2016 for redevelopment and Rivervale Mall which was sold on 15 December 2015.
CMT had retained capital distribution and tax-exempt income of S$12.9 million received from CapitaLand Retail China Trust and capital distribution of S$17.1 million received from Infinity Office Trust for general corporate and working capital purposes.
Breakdown of the Unitholders’ distribution per unit in cents for FY 2016 as compared to FY 2015 are as follows:
AssetsAs at 31 December 2016, the total assets for CMT and its subsidiaries (CMT Group) were S$10,326.7 million, compared with S$10,355.7 million as at 31 December 2015. The decrease of S$29.0 million was mainly due to decrease in cash and cash equivalents of S$120.8 million, financial derivatives of S$12.6 million and investment in associate and joint ventures of S$42.9 million, partially offset by valuation gain of S$68.5 million, capital expenditure of S$74.5 million (including development costs for Funan of S$24.0 million).
The lower cash and cash equivalents were mainly due the partial repayment of bank borrowings of S$431.0 million, which was partially offset by the issuance of two series of Singapore dollar denominated fixed rate notes totalling S$250.0 million and one series of HK$560.0 million fixed rate notes which was swapped into S$99.0 million, under the S$2.5 billion unsecured Multicurrency Medium Term Note Programme.
Year1 January to
31 March1 April to
30 June1 July to
30 September1 October to
31 December1 January to
31 December
2016 2.73 2.74 2.78 2.88 11.13
2015 2.68 2.71 2.981 2.88 11.25
1 Distribution for 1 July to 30 September 2015 included the release of S$8.0 million of taxable income retained in 1 January to 31 March 2015.

91Overview
Business Review
Corporate Governance & Transparency
Portfolio Details
Sustainability
Financials & Additional Information
N.M.: Not Meaningful.1 Reflects valuation of the property in its entirety.2 All ancillary office units were converted to warehouse units.3 Funan, which is undergoing redevelopment into an integrated development, has been reclassified from Investment Properties to Investment
Properties Under Development in 2016.4 As the property is undergoing redevelopment into an integrated development, the value reflected is the total residual land value of the integrated
development.5 Valuation of Funan prior to the redevelopment.6 SR – serviced residences.7 Not meaningful because Raffles City Singapore comprises retail, office, hotels and convention centre.
Property Valuation Valuationper Net
Lettable Area2016
S$ per sq ft
Valuation Capitalisation Rate
2016 S$ million
2015S$ million
Variance S$ million
2016%
2015 %
Tampines Mall 994.0 983.0 11.0 2,802 5.35 5.35
Junction 8 703.0 696.0 7.0 2,775 5.35 5.35
IMM Building 624.0 622.0 2.0 6491 Retail: 6.50Warehouse: 7.502
Retail: 6.50 Office: 6.25
Warehouse: 7.50
Plaza Singapura 1,257.0 1,244.0 13.0 2,601 5.00 5.00
Bugis Junction 1,014.0 995.0 19.0 2,557 5.35 5.35
Sembawang Shopping Centre 118.0 114.0 4.0 826 5.55 5.55
JCube 288.0 288.0 – 1,392 5.50 5.50
Lot One Shoppers’ Mall 512.0 510.0 2.0 2,329 5.35 5.35
Bukit Panjang Plaza 310.0 303.0 7.0 1,896 5.45 5.45
The Atrium@Orchard 735.0 735.0 – 1,8961 Retail: 5.25 Office: 4.00
Retail: 5.25Office: 4.00
Clarke Quay 389.0 389.0 – 1,330 5.50 5.50
Bugis+ 340.0 340.0 – 1,585 5.70 5.70
Bedok Mall 780.0 780.0 – 3,506 5.20 5.20
CMT Group excluding Funan 8,064.0 7,999.0 65.0
Funan3 421.04 367.05 54.0 N.M.Retail: 5.15Office: 4.15
SR6: 5.00Retail: 5.50
CMT Group 8,485.0 8,366.0 119.0
Less additions during the year (50.5)
Net increase in valuations 68.5
For information only
Raffles City Singapore (40.00% interest) 1,267.6 1,254.4 13.2 N.M.7
Retail: 5.25Office: 4.25Hotel: 5.11
Retail: 5.25Office: 4.25Hotel: 5.13
Westgate (30.00% interest) 319.2 319.2 – 2,585 5.20 5.20
Share of joint ventures' investment properties 1,586.8 1,573.6 13.2
Less additions during the year (20.8)
Net decrease in valuations (7.6)
Valuations and Valuation Capitalisation Rates (As at 31 December)

92
Capital Management
CapitaLand Mall Trust
Annual Report 2016
1 In accordance to Property Funds Appendix, CMT’s proportionate share of its joint ventures’ borrowings and total deposited property are included when computing the aggregate leverage.
2 Funds raised ahead of the maturity of the existing borrowings of CMT are excluded from both borrowings and total deposited property for the purpose of computing the aggregate leverage as the funds are set aside solely for the purpose of repaying the existing borrowings of CMT.
3 Net Debt comprises gross debt less temporary cash intended for refinancing and capital expenditure. EBITDA refers to earnings before interest, tax, depreciation and amortisation.
4 Ratio of net investment income at CMT Group before interest and tax over interest expense from 1 January 2016 to 31 December 2016 and 1 January 2015 to 31 December 2015 respectively.
5 Ratio of interest expense over weighted average borrowings. 6 Moody’s Investors Service has affirmed an ‘A2’ issuer rating of CMT on 16 July 2015.
Key Financial Indicators
As at 31 December 2016
As at 31 December 2015
Unencumbered Assets as % of Total Assets (%) 100.0 100.0
Aggregate Leverage (%)1,2 34.8 35.4
Net Debt / EBITDA (times)3 6.3 6.0
Interest Coverage (times)4 4.8 4.8
Average Term to Maturity (years) 5.3 5.3
Average Cost of Debt (%)5 3.2 3.3
CMT’s Issuer Rating6 ‘A2’ ‘A2’
CAPITAL MANAGEMENTIn 2016, CMT MTN Pte. Ltd. (CMT MTN) issued two series of Singapore dollar denominated and one foreign currency denominated notes under the S$2.5 billion unsecured Multicurrency Medium Term Note Programme (MTN Programme) as follows:
1. S$100.0 million 10-year fixed rate notes at 3.50% per annum on 25 February 2016;
2. HK$560.0 million 10-year fixed rate notes at 2.71% per annum on 7 July 2016, which was swapped into S$99.0 million at 2.928% per annum; and
3. S$150.0 million 15-year fixed rate notes at 3.35% per annum on 7 July 2016.
The above fixed rate notes were used to partially repay the bank loans in 2016.
CMT and its subsidiaries (CMT Group) hold derivative financial instruments to hedge its currency and interest rate risk exposures. The fair value derivative for Financial Year (FY) 2016, which was included in the financial statement as financial derivatives assets and financial derivatives liabilities, was S$162.7 million and S$30.9 million respectively. This represented 2.0% of the net assets of CMT Group as at 31 December 2016.

93Overview
Business Review
Corporate Governance & Transparency
Portfolio Details
Sustainability
Financials & Additional Information
The total borrowings of CMT Group as at 31 December 2016 are as follows:
1 Includes foreign currency denominated notes which have been swapped into Singapore dollars at their respective swapped rates.
For information only
CMT’s 40.00% interest in RCS Trust and 30.00% interest in Infinity Mall Trust
Loans at RCS Trust 440.0
Loans at Infinity Mall Trust 162.0
602.0
% Retail bonds 11.0 Bank loans 2.8 Medium term notes and Euro-Medium term 86.2
notes issued by CMT MTN
% Within a year 7.9 After 1 year but within 5 years 43.8 After 5 years 48.3
CMT Group - Debt Mix by Type(as at 31 December 2016)
CMT Group - Loan Maturity Profile(as at 31 December 2016)
100%Unsecured
Total borrowings of CMT Group S$ million
Retail bonds 350.0
Bank loans 88.0
Unsecured Medium term notes and Euro-Medium term notes issued by CMT MTN1 2,731.0
Total borrowings of CMT Group 3,169.0

94
Capital Management
CapitaLand Mall Trust
Annual Report 2016
CMT Group – Loan Maturity Profile1
S$ million %
Within a year 250.0 7.9
After 1 year but within 5 years 1,388.8 43.8
After 5 years 1,530.2 48.3
3,169.0 100.0
1 Includes foreign currency denominated notes which have been swapped into Singapore dollars at their respective swapped rates.
In summary, the total borrowings of CMT Group as at 31 December 2016 were S$3,169.0 million with aggregate leverage at 34.8%. Average cost of debt was lower at 3.2% as at 31 December 2016 compared to 3.3% as at 31 December 2015.
As at 31 December 2016, 7.9% or S$250.0 million of CMT Group’s borrowings will mature in 2017. CMT has sufficient internal resources and bank facilities to cover the repayments due in 2017. The Manager will continue to adopt a rigorous and focused approach to capital management.
The Manager is also committed to diversifying funding sources and will continue to review its debt profile to reduce refinancing risk.
CMT’s 40.00% interest in RCS Trust and 30.00% interest of Infinity Mall TrustCMT has a 40.00% interest in RCS Trust. On 15 April 2016, RCS Trust Trustee-Manager entered into unsecured loan facility agreements with various banks to provide loan facilities of various maturities to refinance RCS Trust’s borrowings and for RCS Trust’s future general corporate and working capital purposes.
On 21 June 2016, RCS Trust has drawn down S$1,069.5 million to repay the secured term loan and revolving credit facility granted by a special purpose company, Silver Oak Ltd. Following the repayment of the outstanding borrowings, the security granted by RCS Trust over its rights in relation to Raffles City Singapore has been discharged and released. As at 31 December 2016, the total loans drawn down by RCS Trust are S$1,100.0 million. CMT’s 40.00% share thereof is S$440.0 million.
CMT has a 30.00% interest in Infinity Mall Trust (IMT). As at 31 December 2016, IMT has drawn down secured loans of S$540.0 million. CMT’s 30.00% share thereof is S$162.0 million.

95Overview
Business Review
Corporate Governance & Transparency
Portfolio Details
Sustainability
Financials & Additional Information
Cash Flows and LiquidityCMT Group takes a proactive role in monitoring its cash flow position and requirements to ensure sufficient liquidity and adequate funding is available for distribution to the Unitholders as well as to meet any short-term obligations.
Cash and Cash EquivalentsAs at 31 December 2016, the value of cash and cash equivalents of CMT Group stood at S$483.5 million, compared with S$604.3 million as at 31 December 2015. The lower quantum was mainly due to the repayment of bank loans during the year.
1 S$1,100.0 million unsecured bank loans by RCS Trust. CMT’s 40.00% share thereof is S$440.0 million.2 US$400.0 million 3.731% fixed rate notes were swapped to S$505.2 million at a fixed rate of 3.29% p.a. in March 2012.3 S$540.0 million secured bank loans by Infinity Mall Trust due in October 2019. CMT’s 30.00% share thereof is S$162.0 million. 4 ¥10.0 billion 1.309% fixed rate notes were swapped to approximately S$157.6 million at a fixed rate of 2.79% p.a. in October 2012.5 ¥10.0 billion 1.039% fixed rate notes were swapped to S$126.0 million at a fixed rate of 3.119% p.a. in November 2013.6 ¥5.0 billion floating rate (at 3 months JPY LIBOR + 0.48% p.a.) notes were swapped to S$62.0 million at a fixed rate of 3.148% p.a. in February 2014.7 HK$1.15 billion 3.76% fixed rate notes were swapped to S$190.1 million at a fixed rate of 3.45% p.a. in June 2012. 8 ¥8.6 billion floating rate (at 3 months JPY LIBOR + 0.25% p.a.) notes were swapped to S$100.0 million at a fixed rate of 2.85% p.a. in February 2015.9 HK$885.0 million 3.28% fixed rate notes were swapped to S$140.0 million at a fixed rate of 3.32% p.a. in November 2012. 10 HK$650.0 million 3.25% fixed rate notes were swapped to S$108.3 million at a fixed rate of 3.25% p.a. in November 2014.11 HK$560.0 million 2.71% fixed rate notes were swapped to S$99.0 million at a fixed rate of 2.928% p.a. in July 2016.12 HK$1.104 billion 2.77% fixed rate notes were swapped to S$192.8 million at a fixed rate of 3.25% p.a. in February 2015.
Debt Maturity Profile as at 31 December 2016 (including CMT’s 40.00% interest in RCS Trust and CMT’s 30.00% interest in Infinity Mall Trust)
(S$ million)
2017
250.0
605.2
446.7
240.0
450.0
199.0
406.9
532.0
100.0
100.01
100.01
120.01
100.0
126.05
60.9
157.64
27.1
505.22120.01
350.0300.0
150.0190.17
100.08
140.09
108.310
99.011
100.0
150.0
192.812
62.06
150.0
2018 2019 2020 2021 2022 2023 2024 2025 2026 2027 2031
Unsecured bank loans Secured bank loans - 30.00% interest in Infinity Mall Trust Retail Bonds due 2021 at fixed rate of 3.08% per annum (p.a.) Notes issued under Euro-Medium Term Note Programme Notes issued under MTN Programme Unsecured bank loans - 40.00% interest in RCS Trust
162.03
ACCOUNTING POLICIESThe financial statements have been prepared in accordance with the Statement of Recommended Accounting Practice 7 ‘Reporting Framework for Unit Trusts’ (RAP 7) issued by the Institute of Singapore Chartered Accountants, the applicable requirements of the Code on Collective Investment Schemes issued by the Monetary Authority of Singapore and the provisions of the Trust Deed. RAP 7 requires that accounting policies adopted generally comply with the principles relating to recognition and measurement of the Singapore Financial Reporting Standards.

96
Independent Retail Market Overview
CapitaLand Mall Trust
Annual Report 2016
Economic GrowthGiven the outcomes of some major global geo-political events during 2016, the overarching feeling for the global economy is one of great uncertainties. With votes in favour of Brexit, the election of Rodrigo Duterte, President of the Philippines, and the election of Donald Trump, President of the United States of America, 2016 has turned out to be a year where global politics have taken centre stage and a new breed of nationalism has arisen. This uncertainty has been compounded by a complicated global economic environment – while the United States of America (USA) economy continues to grow strongly, Europe lurches from one crisis to the next, and no one is truly certain what the future holds for China.
One thing is certain though; these global events have and will continue to influence Singapore. In particular, changes in trade policies with and within Southeast Asia will arise and Singapore will continue to calibrate its diplomatic and trade relations with respect to the changes in dynamics of global affairs.
A very good example of this is the executive action signed by Donald Trump to withdraw from the Trans-Pacific Partnership (TPP) in January 2017. With this, Singapore, for which global trade is so important, could miss out on the benefits that the TPP would bring, particularly an increase in trade driven by the lowering of tariffs and greater coherence and transparency of trade-related regulations. With the TPP all-but-dead, the China-led Regional Comprehensive Economic Partnership becomes all the more important for Singapore.
Domestically, Singapore is facing a number of challenges in key markets. The Government’s property market cooling measures, particularly on the residential market, have had a material impact on financial markets and demand for housing. Housing prices and the volume of transactions have both fallen since peaking in 2013. This has, in turn, had a negative impact on the construction sector and sentiment more broadly.
Banking and finance is also a crucial driver of the Singapore economy. With banks in Singapore having a large exposure to both real estate as well as oil and gas, the banking sector continues to face headwinds that are exacerbated by broader economic and trade weakness.
Despite the current global and domestic climate, Singapore has shown some short-term resiliency and we continue to have an optimistic long-term outlook. Advanced estimates suggest Singapore’s economy grew quarter-on-quarter by 9.1% in the fourth quarter of 2016 (seasonally adjusted), after a contraction of 1.9% in the
preceding quarter. While the construction sector remains weak, the latest quarter has seen a sharp rebound in the manufacturing and service sectors.
Singapore’s long-term prospects remain fundamentally strong and it is still outperforming many other developed economies. Reflecting this situation, Moody’s has maintained Singapore’s ‘AAA’ rat ing based on Singapore’s strong institutions, financial reserves and the Government’s ability to formulate long-term policies.
Again on a positive note, Singapore’s ties with Malaysia are currently at their warmest and the recently inked bilateral agreement on the High-Speed Rail project is testimony to ever improving bilateral ties. Once the project is completed in 2026, it is expected to bring closer integration between Singapore’s and Malaysia’s economies and provide more opportunities for businesses on either side of the causeway.
Singapore’s Government is also making investments to encourage start ups, the fintech industry and biotechnology, seeing them as future pillars in the Singapore’s economy.
While the short-term outlook looks clouded, we remain optimistic about Singapore’s long-term outlook. Singapore has always exhibited a stable and responsive political environment, a well-educated workforce, stable population growth and it continues to grow as a tourist destination. History has shown it has the capacity to rebound strongly from economic slumps and we see no reason why this downturn will be any different.
Based on Economist Intelligence Unit’s latest forecasts, Singapore’s real gross domestic product growth is expected to remain modest over the next 2-3 years before picking up thereafter in 2020, averaging at 2.0% per year over the next five years as compared to the average growth of 4.6% in the past decade.
InflationSingapore had seen 24 months of consecutive deflation before tapering to a flat November 2016. The deflation was largely attributed to the low global oil prices, the impact of cooling measures on house prices and pricing of cars which is correlated to the fall of COE prices1, as well as budgetary and other one-off cooling measures. As the disinflationary effects of oil and budgetary and one-off measures ease off, we expect inflation will increase to about 0.8% for 2017 before increasing slightly over the forecast period.
1 Certificate of Entitlement – the licence purchased to buy a car in Singapore.

97Overview
Business Review
Corporate Governance & Transparency
Portfolio Details
Sustainability
Financials & Additional Information
Of particular relevance to the retail sector is the lack of inflation in the clothing and footwear category. Over the past five years, Retail Price Inflation (RPI) for clothing and footwear has been almost zero, compared to food and groceries RPI at 2.1% per annum. Globally, deflationary pressures in clothing and footwear have been profound, meaning that fashion retailers continually have to sell more stock to maintain the same dollar value of sales. This lack of inflation has put an additional burden on retailers within Singapore, a burden that we expect to ease over the next few years.
PopulationThe Singapore Department of Statistics estimated the total population of Singapore to be approximately 5.6 million as of June 2016. This total population figure, comprises 3.9 million residents (i.e. Singapore citizens and permanent residents) and 1.7 million non-residents. These non-residents primarily comprise expatriate workers on long-term working visas, including skilled professionals and unskilled workers, most of which are employed in the manufacturing and construction sectors.
The Singapore’s Government has always faced two key issues with respect to the country’s population - low population growth and an aging population. Based on the current population growth rate, a low fertility rate and longer life expectancy, the population projection for 2050 depicts an inverted population pyramid. To achieve population stability without immigration, a replacement rate of 2.1 is required; however, the total fertility rate for 2015 was 1.2.
Singapore’s immigration policies have tightened in recent years to balance the infrastructural and carrying capacity of the country as well as the need to grow the economy and addressing the issues of low birth rates and an ageing population. The growth of the non-resident population has slowed down from 6.2% per annum between 2001 to 2011 to 3.7% per annum in the last five years. This compares to the growth rate of the resident population of 1.4% per annum from 2001 to 2011 and 0.8% per annum in the last five years.
Going forward, we expect the total population growth rate to be relatively slow, with an average rate of 1.3% per annum (or 72,000 people per annum) over the next five years. This is reflective of the situation in recent years in Singapore, as immigration policy remains relatively tight.
TourismDespite a period of global economic uncertainty, Singapore’s tourism figures remained healthy. Singapore has seen an average growth of 5.3% per annum in visitors in the past 10 years. Tourist numbers have risen by 7.7% year-on-year in 2016.
A major contributor to this growth in 2016 has been a large surge in Chinese visitors, with an increase of 36.0% in 2016 as compared to the same period in 2015. Indonesian and Indian tourists have also contributed to the increase in tourist arrivals.
Additionally, tourism expenditure in the first half of 2016 in shopping has overtaken gambling for the first time since 2012, with spending in shopping and accommodation offsetting a decrease in spending in sightseeing, entertainment and gambling. This is a good news for mall owners, particularly those in central areas that have been weathering the impact of a weak tourist market.
While Singapore’s tourism figures have been impressive, there are still uncertainties surrounding the future of the global economic and political climate. For the next five years, Cistri expects to see an average growth of 4.0% per annum, or an increase in approximately 700,000 visitors per year.
Retail SalesSingapore’s retail market is experiencing one of its most difficult periods in recent history. Over the past three years, retail sales growth has been close to zero, compared to 4.8% over the seven previous years which included the global financial crisis (GFC). Real and nominal retail sales growth rates in 2016 were at their lowest since 2009.
As an example of the struggling retail market, after the closure of its stores in Marina Square and Tiong Bahru Plaza in 2015, John Little has recently shut down its final department store in Singapore, following the closure of its store in Jurong Point earlier in 2016.
However, amidst the weak market in Orchard Road, brands such as Uniqlo and Victoria’s Secret have opened their flagship stores in the famous shopping precinct this year. Apple is also in the process of developing a new flagship store in Orchard Road, set to be open very soon.

98
Independent Retail Market Overview
CapitaLand Mall Trust
Annual Report 2016
Singapore Retail Floor Space Supply(million sq ft)
Forecast
Others2
Shopping Centre
Source: Cistri.
1 As at end of each year.2 Others refer to other forms of retail space such as Housing Development Board’s shop space.
2005 2006 2008 2010 20122007 2009 2011 2013 2014 2016 2018 20202015 2017 2019 2021
45.249.3 49.9
52.3 54.9 57.4 58.9 60.2 61.8 63.5 64.7 65.9 67.3 68.5 69.5 70.4 71.2
While tourists’ shopping spending has increased approximately 64.8% for the period from January to June 2016 relative to the same period in 2015, largely spurred by first-time Chinese tourists, local consumption has remained weak. At the same time, supply has continued to expand with the opening of new malls such as Waterway Point in Punggol and the retail space at Tanjong Pagar Centre in the Central Business District as well as the opening of redeveloped malls such as Compass One in Sengkang.
Despite the subdued market conditions, the fundamentals for long-term ongoing sales growth in Singapore remain in place. Singapore’s population, incomes, tourist numbers and therefore retail sales are likely to continue to experience longer term growth. Demand for retail space will continue to increase as new retailers enter the market and new supply of floor space is absorbed. Singapore always has been and will continue to be a favoured location for international retailers entering the Asian market. Longer term, post 2018 as the market improves, we expect stronger growth in retail sales to support improved growth in rents as well as improved occupancy. We expect retail sales to grow by 3.2% per annum over the next five years in nominal terms.
Retail SupplyOur forecast supply of retail space for Singapore takes into account forecast annual completions of shopping centres as well as allowance for other new retail floor space and some obsolescence of space.
For retail floor space additions, the forecasts take into consideration current projects in supply pipeline according to Urban Redevelopment Authority (URA) as well as other future projects. Some examples of new malls include the Tampines Town Hub, Jewel Changi Airport, Paya Lebar Quarter, Northpoint and Hillion Mall.
We have also taken into account potential additional retail floor space that is not yet announced. Overall, we expect to see an additional shopping centre floor space of approximately 4.3 million square feet (sq ft) over the next five years, averaging 0.9 million sq ft of new retail space per annum. This is broadly in line with historic growth.
We estimate that total retail floor space provision for Singapore at the end of 2016 was 65.9 million sq ft. This figure is expected to increase to 71.2 million sq ft by the end of 2021. This represents an average annual growth of around 1.4% per annum. Over this period, the proportion of total retail floor space provided in a shopping centre format is expected to increase from its current level of 49.1% to 51.5% by 2021.
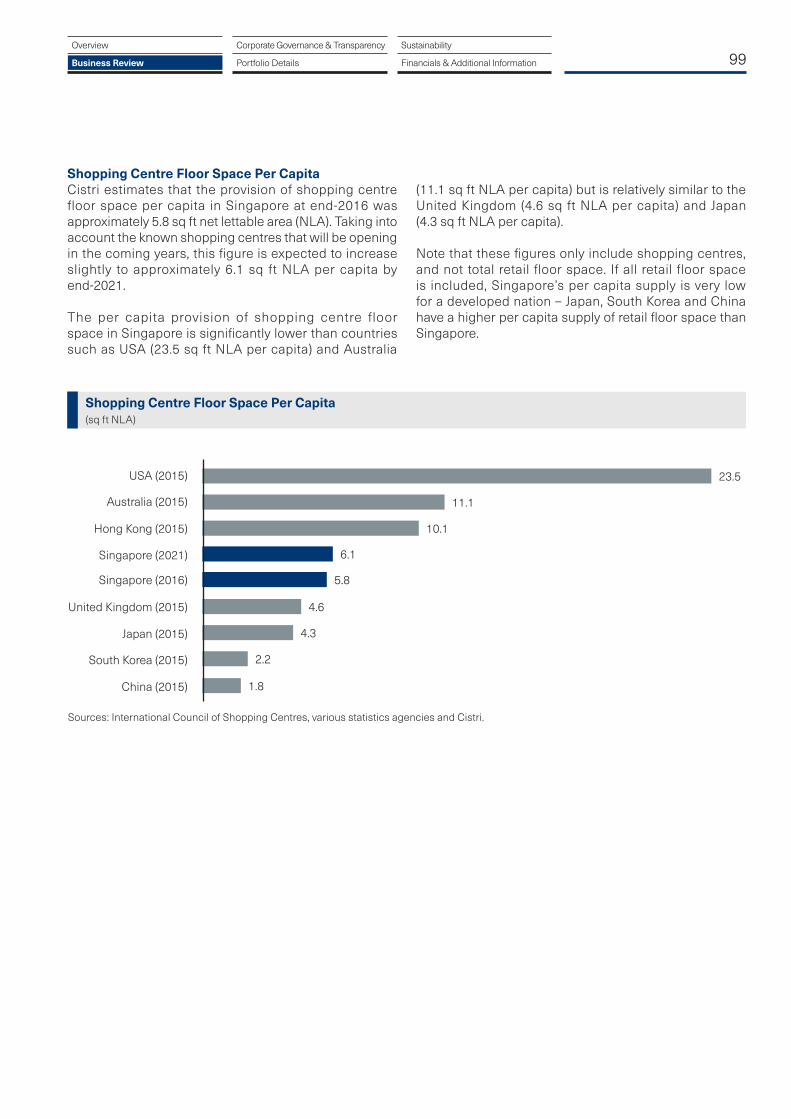
99Overview
Business Review
Corporate Governance & Transparency
Portfolio Details
Sustainability
Financials & Additional Information
Shopping Centre Floor Space Per CapitaCistri estimates that the provision of shopping centre floor space per capita in Singapore at end-2016 was approximately 5.8 sq ft net lettable area (NLA). Taking into account the known shopping centres that will be opening in the coming years, this figure is expected to increase slightly to approximately 6.1 sq ft NLA per capita by end-2021.
The per capita provision of shopping centre floor space in Singapore is significantly lower than countries such as USA (23.5 sq ft NLA per capita) and Australia
(11.1 sq ft NLA per capita) but is relatively similar to the United Kingdom (4.6 sq ft NLA per capita) and Japan (4.3 sq ft NLA per capita).
Note that these figures only include shopping centres, and not total retail floor space. If all retail floor space is included, Singapore’s per capita supply is very low for a developed nation – Japan, South Korea and China have a higher per capita supply of retail floor space than Singapore.
10.1
Japan (2015)
11.1Australia (2015)
23.5
6.1
South Korea (2015)
4.6
Singapore (2021)
Singapore (2016)
United Kingdom (2015)
4.3
2.2
1.8
Hong Kong (2015)
USA (2015)
5.8
China (2015)
Shopping Centre Floor Space Per Capita(sq ft NLA)
Sources: International Council of Shopping Centres, various statistics agencies and Cistri.

100
Independent Retail Market Overview
CapitaLand Mall Trust
Annual Report 2016
Mall OwnershipCapitaLand Mall Trust (CMT) is currently the largest shopping mall owner in Singapore, owning 14.0% of malls greater than 100,000 sq ft NLA. The next largest owners include Pramerica (5.7%), Lendlease (5.2%) and Far East Organization (4.0%). CapitaLand separately owns 2.8% of floor space.
Based on known forthcoming developments, by 2021 we expect CMT’s share be approximately 14.6% once Funan DigitaLife Mall is redeveloped, while CapitaLand’s share to rise to 3.5% due to its stake in Jewel Changi Airport.
Share of Major Shopping Malls Floor Space by Owner1, 2016
% CapitaLand Mall Trust 14.0 CapitaLand 2.82 Pramerica 5.7 Lendlease 5.23 Far East Organization 4.0 Mapletree Commercial Trust 3.7 United Industrial Corporation Limited 3.2 Frasers Centrepoint Trust 3.2 NTUC 2.9 Frasers Centrepoint 2.9 Others 52.4
Source: Cistri.
1 Malls greater than 100,000 sq ft NLA as at end-2016. Share of floor space takes into account ownership stake.
2 CapitaLand’s share only accounts for malls directly owned by CapitaLand and does not include those owned through CMT.
3 Fund manager treated as a single owner.
Retail Rents and OccupancyPrior to the start of 2016, we expected further modest decline in rents, while we expected vacancy to remain relatively flat. However, the scale of the downturn has taken many in the market by surprise; rents on new leases have fallen by 5.6% in the suburban sub-market and 6.6% in the Orchard Road sub-market.
Notwithstanding an increase in the Orchard Road sub-market occupancy in the fourth quarter of 2016, it is our view that the rental market has not quite hit the bottom, particularly in the Orchard Road sub-market. There are still many retailers within the Orchard Road sub-market that are struggling and that some negative rent reviews are likely to continue. We expect that over the next 12 to 18 months, reported rents in the Orchard Road sub-market will continue to decline. We are encouraged to see the Orchard Road sub-market’s vacancy drop in the fourth quarter 2016, as it suggests owners are willing to support occupancy by accepting lower rents. We expect occupancy in this sub-market to remain flat at current levels for the next 12 months. One positive factor for the sub-market is the rebound in Chinese tourists, which should act to put a floor underneath the decline in rents.
Suburban malls are likely to fare better. They do not face the structural issues which are faced by the malls located in the town area. Suburban malls are increasingly better placed to take advantage of growing retail expenditure, and they continue to take a growing share of the total market. Thus we expect the decline in rents to moderate over the next twelve months, and possibly return to modest growth as soon as 2018.

101Overview
Business Review
Corporate Governance & Transparency
Portfolio Details
Sustainability
Financials & Additional Information
Occupancy Rates Outlook(%)
Rental Growth Outlook(%)
Forecast
Forecast
Forecast
Forecast
Suburban
Suburban
Orchard Road
Orchard Road
2013
2013
2013
2013
2014
2014
2014
2014
2016
2016
2016
2016
2018
2018
2018
2018
2015
2015
2015
2015
2017
2017
2017
2017
2019
2019
2019
2019
95.9
0.4
95.5
0.1
94.7
2.0
94.4
2.2
93.9
-1.0
-5.6
-1.5-1.0
-6.6
-3.0
92.492.8 93.294.0 93.095.0
1.0
94.0
0.0
96.0
2.0
94.5
1.0
Sources: URA, Cistri.
Sources: URA, Cistri.
102
Independent Retail Market Overview
CapitaLand Mall Trust
Annual Report 2016
About Cistri Pte. Ltd.Cistri Pte. Ltd. is a wholly owned part of the Urbis Australia Group. Cistri represents Urbis Australia’s international business. For more details, visit www.cistri.com.
DisclaimerThis report is dated 16 February 2017 and incorporates information and events up to that date only and excludes any information arising, or event occurring, after that date which may affect the validity of Cistri Pte. Ltd.’s opinion in this report. Cistri Pte. Ltd. prepared this report on the instructions, and for the benefit only, of CapitaLand Mall Trust Management Limited (Instructing Party) for the purpose of providing a high level overview of the retail market in Singapore (Purpose) and not for any other purpose or use. To the extent permitted by applicable law, Cistri Pte. Ltd. expressly disclaims all liability, whether direct or indirect, to the Instructing Party which relies or purports to rely on this report for any purpose other than the Purpose, and to any other person which relies or purports to rely on this report for any purpose whatsoever (including the Purpose).
In preparing this report, Cistri Pte. Ltd. was required to make judgements which may be affected by unforeseen future events, the likelihood and effects of which are not capable of precise assessment.
All surveys, forecasts, projections and recommendations contained in or associated with this report are made in good faith and on the basis of information supplied to Cistri Pte. Ltd. at the date of this report, and upon which Cistri Pte. Ltd. relied. Achievement of the projections and budgets set out in this report will depend, among other things, on the actions of others over which Cistri Pte. Ltd. has no control.
In preparing this report, Cistri Pte. Ltd. may rely on or refer to documents in a language other than English, which Cistri Pte. Ltd. may arrange to be translated. Cistri Pte. Ltd.is not responsible for the accuracy or completeness of such translations and disclaims any liability for any statement or opinion made in this report being inaccurate or incomplete arising from such translations.
Whilst Cistri Pte. Ltd. has made all reasonable inquiries it believes necessary in preparing this report, it is not responsible for determining the completeness or accuracy of information provided to it. Cistri Pte. Ltd. (including its officers and personnel) is not liable for any errors or omissions, including in information provided by the Instructing Party or another person or upon which Cistri Pte. Ltd. relies, provided that such errors or omissions are not made by Cistri Pte. Ltd. recklessly or in bad faith.
This report has been prepared with due care and diligence by Cistri Pte. Ltd. and the statements and opinions given by Cistri Pte. Ltd. in this report are given in good faith and in the reasonable belief that they are correct and not misleading, subject to the limitations above.
ConclusionsSingapore has had to navigate through a very difficult global economic and political environment in the past decade. The GFC in 2008, the economic resurgence post GFC, the Euro crisis, the slowdown in China’s economic boom as well as the shift in global political dynamics in 2016, have all created an economic climate that Singapore is particularly sensitive to.
Domestically, Singapore has been feeling the effects of weak property markets and the slowdown in the finance as well as oil and gas sectors. These factors have had broad impacts on domestic demand and thus retail sales, which in turn have affected occupancy and rents. This has put pressure on retailers and owners alike. But many operators are rightly using it as an opportunity to establish themselves for the future.
Mall owners and managers are actively seeking new ways to bring unique shopping experiences to consumers. CMT is redeveloping Funan DigitaLife Mall into an integrated development with an ‘aspirational lifestyle experience’ while the Singapore Post Centre at Paya Lebar is being redeveloped to provide a retail experience which melds online and offline shopping experiences together.
Despite the recent and short-term challenges which the Singapore market has been facing, its mid to long-term prospects remain sound in our view. The economic and political fundamentals that support long-term income and retail expenditure growth remain in place. This includes a competent and educated workforce, strong financial reserves and regulation, sound governance and Government’s investment in infrastructure.
While we do expect to see the rental and occupancy levels to weaken over the next six to 12 months, we do however expect a pick up towards end-2017 or through to 2018 and a rise in rents and occupancy back towards historic levels.
Jack BackenDirector
Cistri Pte.Ltd.
16 February 2017
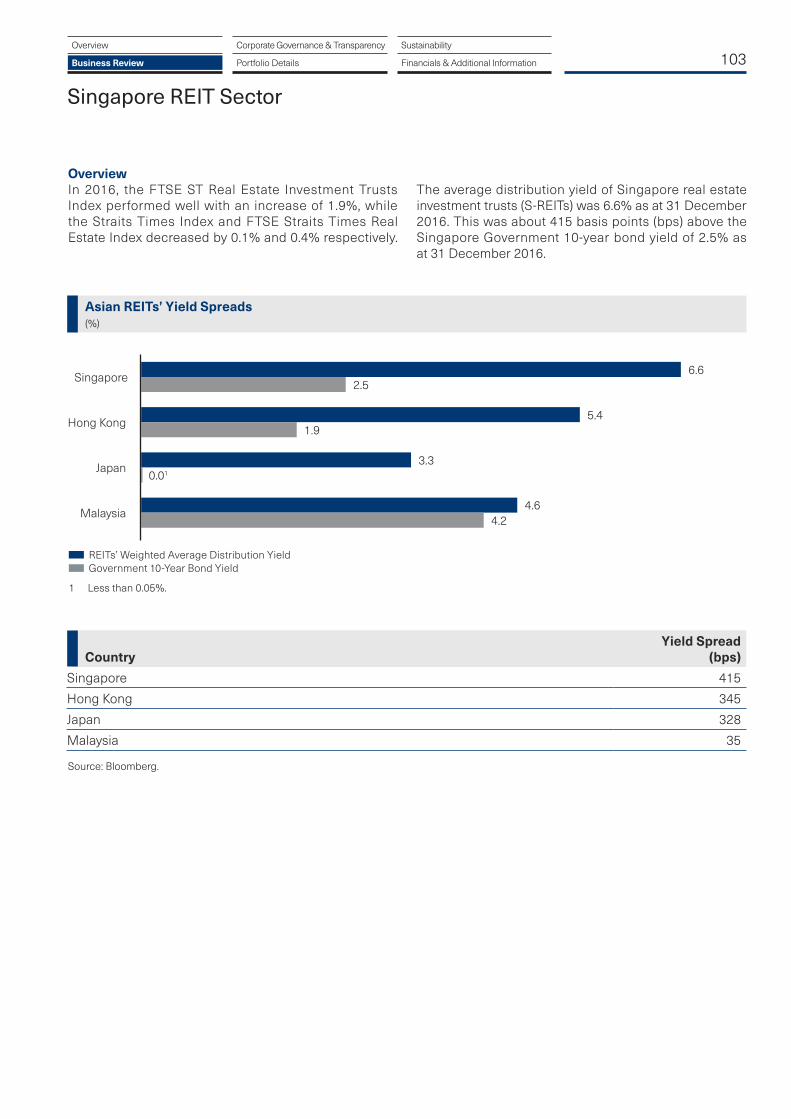
103Overview
Business Review
Corporate Governance & Transparency
Portfolio Details
Sustainability
Financials & Additional Information
Singapore REIT Sector
OverviewIn 2016, the FTSE ST Real Estate Investment Trusts Index performed well with an increase of 1.9%, while the Straits Times Index and FTSE Straits Times Real Estate Index decreased by 0.1% and 0.4% respectively.
The average distribution yield of Singapore real estate investment trusts (S-REITs) was 6.6% as at 31 December 2016. This was about 415 basis points (bps) above the Singapore Government 10-year bond yield of 2.5% as at 31 December 2016.
Source: Bloomberg.
Singapore 415
Hong Kong 345
Japan 328
Malaysia 35
CountryYield Spread
(bps)
Asian REITs’ Yield Spreads (%)
Malaysia
Japan
Singapore
4.6
6.6
4.2
2.5
3.30.01
Hong Kong5.4
1.9
REITs’ Weighted Average Distribution Yield Government 10-Year Bond Yield
1 Less than 0.05%.

104
Singapore REIT Sector
On 10 November 2016, the Monetary Authority of Singapore (MAS) issued a ‘Consultation Paper on Proposed Amendments to the Code on Collective Investment Schemes’ (Consultation Paper), which closed on 12 December 2016.
The Consultation Paper contains numerous proposals affecting collective investment schemes. Some of these proposals relate to real estate investment trusts (REITs) and they can be categorised broadly into the following areas:
• additional requirements on advertisements on REITs. In order to better protect retail investors, MAS proposes to require managers of recognised and authorised funds (which include REITs) to ensure that (i) the advertisements are prepared in accordance with the Code of Best Practices in Advertising Collective Investment Schemes and Investment-Linked Life Insurance Policies issued jointly by Investment Management Association of Singapore (IMAS) and the Life Insurance Association; and (ii) illustrations of income statistics in the advertisements are prepared in accordance with Recommended Disclosures to Support the Presentation of Income Statistics in Advertisements issued by IMAS
• clarification on certain amendments to the Property Funds Appendix for passing rent and review of the computation of the weighted average lease expiry of both the REIT’s portfolio and new leases entered into during the past financial year (and the proportion of revenue attributed to these leases)
• improving on operational flexibility for REITs such as issuance of summary financial statement to unitholders in place of the full financial statements and report, similar to listed companies on the Singapore Exchange. MAS proposes to clarify that a REIT may send its accounts and reports to unitholders by electronic means
• REIT is only operational after receiving MAS’ authorisation to make offers to the public, MAS proposes to require a REIT to hold its first annual general meeting within 18 months of its authorisation instead of its constitution
In December 2016, the Federal Reserve announced the second interest rate rise since its first interest rate hike in December 2015 after holding its benchmark federal funds rate near zero for seven years. On 15 December 2016, the Federal Reserve increased the federal funds rate by 25 bps. A further increase in the federal funds rate may result in corresponding increase in borrowing costs when financing new acquisitions or expansion and/or refinancing existing debts. To compensate for the higher borrowing costs and achieve better yields, S-REITs will have to look at how best to achieve growth through the development of new assets, active lease management and proactive asset management (including asset enhancements) to achieve higher income. In addition, S-REITs need to reexamine and explore various alternatives for capital management.
Looking ForwardThe framework for S-REITs has been continually refined since the public listing of the first S-REIT in 2002. We believe that S-REITs will proactively adapt to the changes introduced to the regulatory regime.
CapitaLand Mall Trust
Annual Report 2016

PORTFOLIO-WIDE ACTIVITIES
In 2016, our strategic group-level marketing activities continued to focus on building the loyalty of shoppers through customer-centric experiences and rewards that can be enjoyed across all malls. We leveraged on technology to bring greater convenience and delight to the shopping experience. Our three loyalty programmes, CapitaStar, CapitaVoucher and CapitaCard, enjoy strong competitive advantage in the market as Singapore’s largest multi-store, multi-mall integrated rewards platform and remains a popular choice for shoppers who desire scale of rewards in loyalty programmes.
CapitaStar has over 770,000 members as at 31 December 2016. Members’ loyalty at our malls continue to be retained through this card-less loyalty programme as it rewards members with additional benefits over and above existing credit card and store rewards.
To deliver further value to members, the CapitaStar mobile app was further enhanced with new features to link up members and retailers with an online-to-offline convenience. The refreshed app offers virtual concierge services that allow members to hail rides, make restaurant reservations and browse retailers’ offerings by chatting with Sparkle – a fully automated artificial intelligence chatbot. This is the first chatbot launched by a real estate developer in Asia. CapitaStar partnered with new economy players – Grab and Chope to bring ride sharing and restaurant booking services respectively through Sparkle to members. Selected retailers will also have their latest products and services showcased on a chatbot for the first time.
The refreshed app also comes with a STAR$® redemption mechanism that brings unrivalled convenience to members with simpler and faster processes. Members can get their STAR$® credited faster over the mobile app with an enhanced machine learning receipt scanning system. Members can also redeem great deals with their STAR$®.
CapitaVoucher performed well in 2016, with sales growing by approximately 4.6% year-on-year to a record of over S$69.0 million worth of committed spending. With its wide acceptance in over 2,000 retail outlets in CapitaLand malls, it remains the most popular shopping voucher in Singapore.
105
Marketing & Promotions
CapitaCard, CapitaLand Mall Asia’s co-brand card programme, and American Express joined forces to launch the only multi-mall loyalty credit card in Singapore in July 2016. Backed by CapitaLand’s rewards programme CapitaStar, CapitaCard members enjoy the highest earn rate for STAR$® and additional perks such as complimentary parking with minimum spend each month at our malls. Under this strategic partnership to drive customer loyalty, tenants will stand to benefit through increased shopper traffic, sales and repeat spending.
We have also organised portfolio-wide campaigns such as:
Be The Hero At CapitaLand MallsIn March 2016, we rolled out a campaign across CMT and CapitaLand malls themed on the highly anticipated action-adventure film from Warner Bros. Pictures, DC Comics Batman v Superman: Dawn of Justice. The highlights of the campaign included the life-size statues display of Armoured Batman, Superman and Wonder Woman at Bugis+ and the latest Batmobile replica display at Clarke Quay and Westgate. Shoppers could also take part in Batman and Superman role-play kinect game stations. Food and beverage (F&B) retailers at Clarke Quay participated in the campaign with movie-inspired dishes, cocktails and costume parties.
#PokemonSTARWith the official launch of the Pokemon Go app in Singapore in August, we tapped on this global cultural phenomenon by rewarding Pokemon trainers with STAR$® on their digital hunt at our malls for various Pokemon characters. CapitaStar members who uploaded screenshots of Pokemon found at our malls on Instagram were rewarded. This #PokemonSTAR social media campaign increased visitorship to our malls and CapitaStar membership signups.
Overview
Business Review
Corporate Governance & Transparency
Portfolio Details
Sustainability
Financials & Additional Information
Unveiling of Life-Size Armoured Batman, Superman and Wonder Woman Statues at Bugis+

106
Marketing & Promotions
50% Fashion Cashback CapitaStar and CapitaCard members who spent a minimum of S$60 at any of over 500 participating fashion outlets from 12 to 14 October 2016 enjoyed a 50% cashback in the form of S$30 CapitaVoucher. This three-day campaign drove an increase in the volume of transactions and average spend in the fashion stores.
MALL-CENTRIC ACTIVITIES
Each mall created a series of memorable experiences that further strengthened shoppers’ loyalty to our malls.
BEDOK MALL
Go Nuts This GSSBedok Mall brought in an ‘Ice Age Collision Course’ movie-themed obstacle playground during the Great Singapore Sale. A special challenge was held over a weekend where children who completed each of the obstacle course challenges in the fastest time won CapitaVoucher. There were meet-and-greet photo opportunities with Scrat, one of the movie character mascots.
A Beary Merry ChristmasFor Christmas, Bedok Mall brought in the Care Bears live musical show featuring Funshine Bear, Cheer Bear and Grumpy Bear. Shoppers could redeem one of four exclusively designed Care Bear cushion blankets. There were a range of workshops for children to make Care Bear-themed Christmas ornaments, bookmarks and glitter tattoos. To spread the joy of giving, shoppers could adopt a limited edition Lotsa Heart Elephant plush toy from the beary Christmas tree with a donation of S$25. All proceeds were donated to Children’s Cancer Foundation.
BUGIS JUNCTION
Floral AllureIn celebration of spring summer season, Bugis Junction held five runway shows to showcase hottest styles. The runway shows were set to the theme of Floral Allure and choreographed by renowned show producer, Daniel Boey. The highlight of the fashion show was Shigga Shay, a Singaporean hip hop artist and songwriter, who was invited to perform at one of the runway shows to feature fashion from Style Alley.
Angela Zhang Meet-and-Greet Session Bugis Junction hosted Angela Zhang, the Mandopop superstar’s meet-and-greet session with her fans in October 2016 ahead of her world tour concert in Singapore.
BUGIS+
Floral AllureBugis+ held four runway shows to the party themes such as #OOTD and Bohemian Rhapsody x Rock during the spring summer season. There was a guest appearance by Benjamin Kheng, a Singaporean musician and actor. Held in conjunction with the fashion show was the Campus Model Search Finals.
Nathan Hartono Meet-and-Greet SessionBugis+ hosted the home-grown singer Nathan Hartono’s meet-and-greet session, in collaboration with Nestle in October 2016. This was held in celebration of Nathan’s achievements as the first Singaporean to make it to the finals and emerge as runner-up in the Sing! China competition. A van was parked at Bugis+ to serve free MILO® from noon to 8 pm, attracting hundreds of shoppers.
BUKIT PANJANG PLAZA
Building Harmony TogetherIn conjunction with Singapore’s 51st birthday, shoppers celebrated community togetherness during Bukit Panjang Plaza’s Colourful Beats Carnival. Hosted as part of the mall’s Building Harmony Together campaign, the event included cultural performances by students and interest groups, interactive games, talks on social volunteering and steps to green living at home.
Late Night Out and AboutBukit Panjang Plaza held their inaugural late night dining promotion in partnership with F&B tenants. Held on every Friday, Saturday and eve of Public Holidays from 10 pm to 1 am, beginning 1 October 2016 for about four Care Bears Live Musical Show at Bedok Mall
CapitaLand Mall Trust
Annual Report 2016

107
months, shoppers could indulge in retail therapy at the night flea market and were treated to an outdoor cinema experience.
CLARKE QUAY
Music After Sevens Clarke Quay was the official after party zone for the first HSBC World Rugby Singapore Sevens. Music After Sevens was a three-day music festival to welcome international and local rugby fans. Party revelers enjoyed music from prominent local and international acts such as ShiLi and Adi, Slingshot, 10.seconds and Zyncxation. Rugby fans enjoyed special perks with their Singapore Sevens tickets at participating outlets.
Zouk Bloc PartyAs a prelude to Zouk’s opening, Clarke Quay and Zouk organised the inaugural Clarke Quay Zouk Bloc Party during the Formula One (F1) Race weekend. This day to night event included the iconic ZouKIDisco (kids-centric party), their popular flea market, music by Zouk resident DJs and F&B from Red Tail. This event was promoted by Singapore Tourism Board as one of the F1 fringe events. The event garnered local and international media coverage by editors, journalists, influencers, bloggers and YouTubers from Russia, Italy, Switzerland, Germany, Belgium, The Netherlands, Luxembourg and China.
Singapore River Festival and Silent DiscoClarke Quay organised the first free admission Silent Disco event as part of the Singapore River Festival 2016. Silent Disco is a new concept in Asia whereby music is broadcast through glowing headsets and party-goers can switch between the different music channels to dance to. Three international DJs from Southeast Asia, Portugal and Germany, played three different genres – Electronic Dance Music, R&B Hip Hop and Top 40’s Mambo.
IMM BUILDING IMM and Her World/Simply Her Shopping Day OutIMM Building (IMM) partnered with Her World and Simply Her to offer styling workshops by celebrity stylist Keith Png during Christmas season where participants obtained tips on looking chic for the festive with fashion pieces from the outlet stores. Keith demonstrated how past seasons collections can be transformed to trendy new looks. Participants enjoyed exclusive discounts at participating outlet stores.
Channel 8 News Live BroadcastIMM hosted the live telecast of Channel 8’s 6.30 pm news bulletin on 2 July 2016. Prior to the news broadcast, shoppers had the opportunity to interact with the newscasters, and role play as a newscaster. Shoppers who downloaded the Channel 8 News and CapitaStar apps could redeem CapitaVoucher and thumb drives.
JCUBE
So Spicy ChallengeJCube held its So Spicy Challenge in May 2016. Participants spinned the ‘Spice of Life Wheel’ for surprise spice elements like wasabi or chilli padi to be added to their noodles, which they had to finish in the shortest time. To up the challenge, participants could also land up with an option of eating without their hands.
JCube Bingo JCube organised a Bingo game during the Great Singapore Sale with up to S$28,000 worth of prizes, including air tickets to Seoul and CapitaVoucher. Shoppers redeemed Bingo slips with minimum spend to participate in the game.
Bingo at JCube
Overview
Business Review
Corporate Governance & Transparency
Portfolio Details
Sustainability
Financials & Additional Information
Silent Disco at Clarke Quay
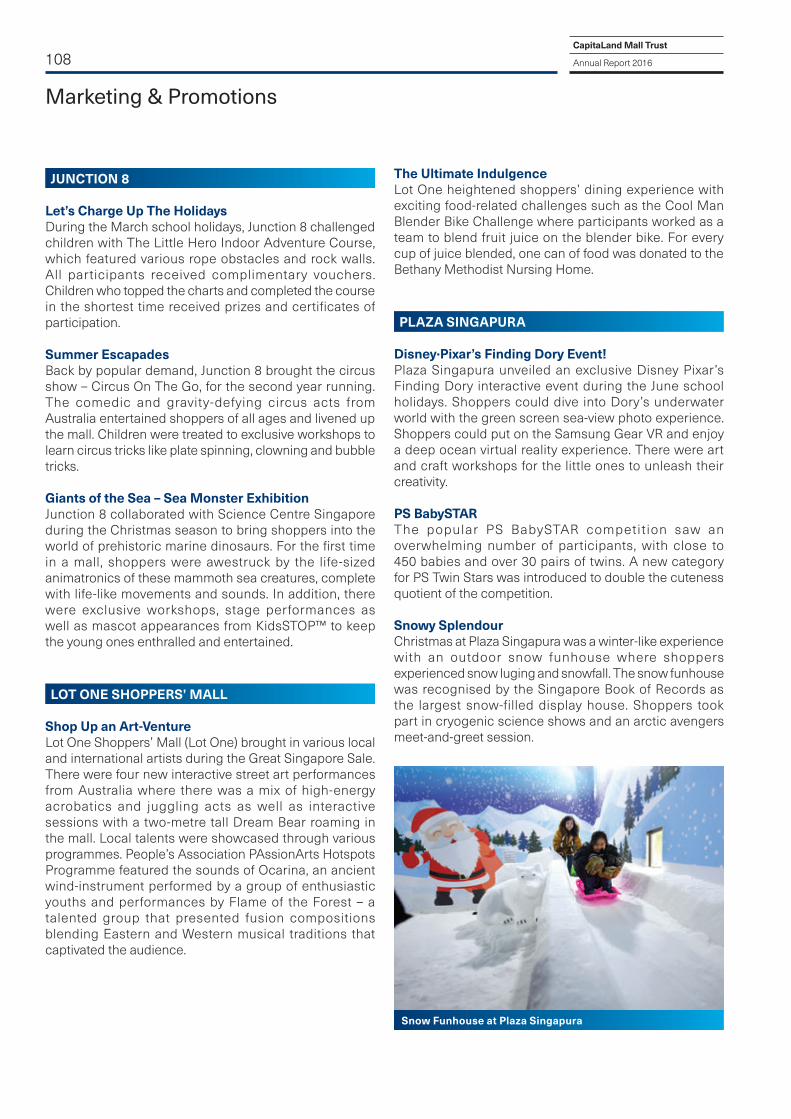
108
Marketing & Promotions
The Ultimate IndulgenceLot One heightened shoppers’ dining experience with exciting food-related challenges such as the Cool Man Blender Bike Challenge where participants worked as a team to blend fruit juice on the blender bike. For every cup of juice blended, one can of food was donated to the Bethany Methodist Nursing Home.
PLAZA SINGAPURA
Disney·Pixar’s Finding Dory Event!Plaza Singapura unveiled an exclusive Disney Pixar’s Finding Dory interactive event during the June school holidays. Shoppers could dive into Dory’s underwater world with the green screen sea-view photo experience. Shoppers could put on the Samsung Gear VR and enjoy a deep ocean virtual reality experience. There were art and craft workshops for the little ones to unleash their creativity.
PS BabySTARThe popular PS BabySTAR competit ion saw an overwhelming number of participants, with close to 450 babies and over 30 pairs of twins. A new category for PS Twin Stars was introduced to double the cuteness quotient of the competition.
Snowy SplendourChristmas at Plaza Singapura was a winter-like experience with an outdoor snow funhouse where shoppers experienced snow luging and snowfall. The snow funhouse was recognised by the Singapore Book of Records as the largest snow-filled display house. Shoppers took part in cryogenic science shows and an arctic avengers meet-and-greet session.
JUNCTION 8
Let’s Charge Up The HolidaysDuring the March school holidays, Junction 8 challenged children with The Little Hero Indoor Adventure Course, which featured various rope obstacles and rock walls. All participants received complimentary vouchers. Children who topped the charts and completed the course in the shortest time received prizes and certificates of participation.
Summer EscapadesBack by popular demand, Junction 8 brought the circus show – Circus On The Go, for the second year running. The comedic and gravity-defying circus acts from Australia entertained shoppers of all ages and livened up the mall. Children were treated to exclusive workshops to learn circus tricks like plate spinning, clowning and bubble tricks.
Giants of the Sea – Sea Monster ExhibitionJunction 8 collaborated with Science Centre Singapore during the Christmas season to bring shoppers into the world of prehistoric marine dinosaurs. For the first time in a mall, shoppers were awestruck by the life-sized animatronics of these mammoth sea creatures, complete with life-like movements and sounds. In addition, there were exclusive workshops, stage performances as well as mascot appearances from KidsSTOP™ to keep the young ones enthralled and entertained.
LOT ONE SHOPPERS’ MALL
Shop Up an Art-VentureLot One Shoppers’ Mall (Lot One) brought in various local and international artists during the Great Singapore Sale. There were four new interactive street art performances from Australia where there was a mix of high-energy acrobatics and juggling acts as well as interactive sessions with a two-metre tall Dream Bear roaming in the mall. Local talents were showcased through various programmes. People’s Association PAssionArts Hotspots Programme featured the sounds of Ocarina, an ancient wind-instrument performed by a group of enthusiastic youths and performances by Flame of the Forest – a talented group that presented fusion compositions blending Eastern and Western musical traditions that captivated the audience.
Snow Funhouse at Plaza Singapura
CapitaLand Mall Trust
Annual Report 2016

109
RAFFLES CITY SINGAPORE
Joseph Schooling Victory Parade Raffles City Singapore (RCS) was the final pit stop for Singapore’s first Olympic champion Joseph Schooling’s victory parade. Hundreds of people from children, students, working adults to retirees came to the event for an opportunity to take a picture with him and have his autograph. Fans and Schooling watched a repeat telecast of his historic race and sang the national anthem at the victory ceremony.
Of Whims and WondersChristmas at RCS gave fans of Craftholic a chance to meet its creator Ikuko Yamamoto. Shoppers enjoyed a first-ever complete Craftholic experience with a pop-up store, gift card and hair accessories workshops as well as mascot meet-and-greet sessions. A series of American Express card members exclusives were rolled out including Craftholic hugging cushion with minimum spend.
SEMBAWANG SHOPPING CENTRE
Let’s Charge Up The HolidaysFor the March school holidays, Sembawang Shopping Centre made learning fun with the ‘My Incredible Body Adventure’ where children learnt fun facts about different organs in their bodies and played within three inflatables resembling the body parts. Upon completing the adventure, children were rewarded with goodie bags. An enrichment fair was held in conjunction with the adventure event, where parents enjoyed exclusive offers from the enrichment tenants.
Summer EscapadesSembawang Shopping Centre brought farm life into the mall during the Great Singapore Sale. Children were given an opportunity to farm at the mall’s very own herb garden. In addition, they could bring home their herb plants and experience riding on ponies at the mall. To further enhance the experience, Sembawang Shopping Centre brought in a farmers market where local farmers peddled their wares from fresh farm produce to fresh seafood from the local kelongs.
TAMPINES MALL
Learning CarnivalTampines Mall organised a Learning Carnival during the March school holidays. The carnival comprised launch activities by LEGO® Nexo Knights, performances by Captain London and Julia Gabriel Centre as well as story-telling sessions by MindChamps. There were fun-filled workshops for the children to decorate their own cupcakes and build their own terrariums.
Wickedly Fun Halloween!!!Shoppers were treated to a wickedly fun Halloween at Tampines Mall. The first 300 shoppers received a Spooky Pass to the Halloween Night event for great fun and treats. The event included exciting game booths, green screen photo booth and mascot appearances such as witch, werewolf and Hotel Transylvania’s Count Dracula and Frankenstein.
WESTGATE
Westgate Summer CampTo promote healthy lifestyle amongst shoppers, Westgate held a summer camp during the Great Singapore Sale. The Courtyard was filled with fun outdoor events for children, including an automated bowling alley, a human-sized pool ball arena and an inflatable rock climbing wall. Mini competitions and exercise workshops were held for shoppers.
Once Upon a Christmas Westgate brought in exclusively from France a Jules Verne carousel for Christmas. Shoppers could redeem tickets to enjoy this unique carousel experience with minimum spend.
Overview
Business Review
Corporate Governance & Transparency
Portfolio Details
Sustainability
Financials & Additional Information
Craftholic Creator Ikuko Yamamoto at RCS

110
Our Tenants
“As one of the market leaders in the casual dining segment, it makes perfect sense for Swensen’s outlets to be located in well-established and popular malls, which is why we have chosen to work with CapitaLand malls. We find CapitaLand a forward-looking business partner and we share its vision of focusing on the customer experience and responding to customer needs. The current retail environment requires us to be proactive, and we’re happy that CapitaLand has created a holistic support ecosystem for retailers like us to better engage with our customers.”
Mr Andrew KhooChief Operating Officer, Swensen’s
“CapitaLand is a landlord that doesn’t rest on its laurels; it is a business partner that plans for the future. We are glad to work with a forward-looking landlord like CapitaLand, so that we can sustain our competitive position and evolve with our customers’ needs. Our integrated business model covers wholesale, retail and e-commerce, which positions us well to compete in the marketplace. We also operate outlet stores, which cater to different consumers. Our outlet stores in IMM Building are performing well and we look forward to expand our business in CapitaLand malls.”
Mr Andy ChawChief Executive Officer
“CapitaLand knows exactly what customers want, and it has always been ahead of its game in making sure that its malls remain vibrant. It is for these reasons that we decided to open our first Riverside Grilled Fish restaurant in Singapore in Raffles City Singapore, which also houses our largest and only Buffet Town restaurant in Singapore. Our other brands, including Thai Express, Thai Express Bistro, Xin Wang Hong Kong Café and Poulet, also have outlets in CapitaLand malls. All these go to show the confidence we have in CapitaLand. We attribute a part of our success to CapitaLand, who has been a proactive landlord, always willing to listen and help.”
Mr Dellen SohChairman
ABR HOLDINGSMINOR FOOD GROUP SINGAPORE
“Continuing to develop prestige retail stores around the world is a key priority for The Estée Lauder Companies in order to serve our discerning customers with the best products and services. We strive to cultivate strong relationships with our partners and thanks to our ongoing strategic collaboration with CapitaLand, we continue to build a fast-growing freestanding store presence in Singapore as well as world class shopping experiences for our consumers. The continued expertise of CapitaLand’s professional and efficient leasing and marketing teams supports our vision to remain at the very forefront of the market.”
Ms Lisa ChowManaging Director – Singapore Affiliate
THE ESTÉE LAUDER COMPANIESSTAR 360 HOLDINGS
CapitaLand Mall Trust
Annual Report 2016

111
“It has been 13 years since we established Muji Singapore in 2003, and we will be opening our flagship store in Plaza Singapura in 2017. This will be our largest store in Southeast Asia. CapitaLand is the largest retail landlord in Singapore and it is an important part of our strategy to have our stores located in CapitaLand malls. The popularity of CapitaLand malls makes it more apparent for us to introduce new concepts to the market. We recently opened Singapore’s largest Café&Meal MUJI at our store in Raffles City Singapore and we will launch a new concept for our upcoming store in Plaza Singapura.”
Mr Takuo NagaharaManaging Director
“Fast fashion is growing, which is the reason why we expanded outside China as part of our plans to make Urban Revivo an international brand and simultaneously enhance our capacity to take on future challenges. CapitaLand is reputed for its proficient mall management, not only in China but throughout Asia, so when looking for a business partner for our expansion, we chose CapitaLand. We decided upon Singapore for Urban Revivo’s first overseas store because it is an affluent country and our fashion collections suit the demographics. Raffles City Singapore is a good choice for our first store here because of its central location and its popularity with working professionals, who are a part of our brand’s target consumers.”
Mr Raymond NgohInternational Development VP
“Zouk has been around for 25 years, and we are always doing our research to be at the top of our game. We decided on Clarke Quay for the new Zouk and Red Tail Bar as it is near to the city and centrally located. It also has character, and meets our physical requirements such as high ceilings and queuing space at the entrance. CapitaLand is known as one of the ‘big boys’, so we have the assurance of the support we can get from a credible landlord.”
Mr Benny HengManaging Director
MUJI SINGAPORE
UR FASHION GROUP SINGAPORE
ZOUK
“BAKE originated from Kinotoya, Japan, where our founder Mr Shintaro Naganuma started out making delectable blueberry cheese tarts in a very typical bakery owned by his father. Through his ingenious creativity, Mr Shintaro Naganuma transformed the typical bakery into what BAKE is today. To stay ahead, we continue to focus on the quality of our product and the level of service. Opening our first stores in Singapore in CapitaLand malls gave us excellent exposure and provided us with strong support. CapitaLand malls have a good tenant mix, which speaks highly of their mall management expertise.”
Mr Jason KooChief Executive Officer
BAKE CONFECTIONARY
Overview
Business Review
Corporate Governance & Transparency
Portfolio Details
Sustainability
Financials & Additional Information

“I come to Bukit Panjang Plaza twice a month. The mall is very convenient and accessible. Also, it gives us a homely experience since it is a neighbourhood mall.”
Joash and Natalie
112
Our Shoppers
“We like Clarke Quay for its lively ambience and alfresco dining and drinking. The views and covered walkways make it convenient. There are also many nationalities in Clarke Quay in an international environment.”
Hau-Tek and May May
“We like to come to Bugis Junction because it offers a wide variety of shops and dining options to choose from. The CapitaStar programme also gives us reward points to change for vouchers to shop more!”
Angeline and Krystle
“Bedok Mall is our favourite hangout as it’s near our place. There’s a wide selection of eateries and shopping outlets that are good for families to visit.”
Jayce and family
BUGIS JUNCTION
BUKIT PANJANG PLAZA
BEDOK MALL
CLARKE QUAY
CapitaLand Mall Trust
Annual Report 2016

113
“I’ve been visiting IMM since I was very young, way before Giant opened. IMM has always been very close to my family and we’re blessed to witness the changes that had happened at IMM. We come here as often as three times a week because it is so convenient and baby-friendly too.”
Siti and family
“We enjoy coming to JCube once a month for ice-skating, shopping and dining. We also like to come here to watch movies because the cinema is new and spacious.”
Lay Ling, Serene and Serene’s family
“Plaza Singapura is one of the most complete shopping malls in Singapore. It’s conveniently located in the centre of many attractions and it’s very near my house, just two MRT stops away!”
Ilham and daughters
“Tampines Mall is a one-stop mall for the family! There’s something for everyone! We like to shop at Toys R”Us and H&M.”
Leo, Joy and Joash
IMM BUILDING
PLAZA SINGAPURA TAMPINES MALL
JCUBE
Overview
Business Review
Corporate Governance & Transparency
Portfolio Details
Sustainability
Financials & Additional Information
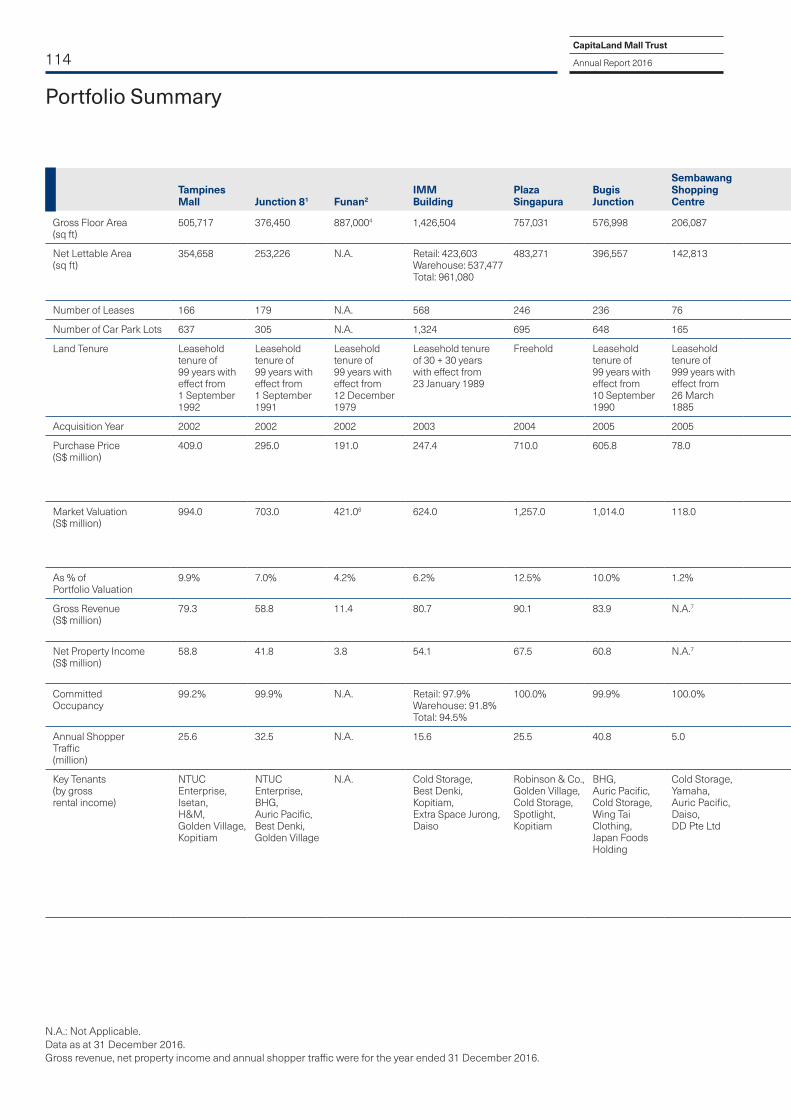
114
Portfolio Summary
CapitaLand Mall Trust
Annual Report 2016
N.A.: Not Applicable.Data as at 31 December 2016.Gross revenue, net property income and annual shopper traffic were for the year ended 31 December 2016.
Tampines Mall Junction 81 Funan2
IMM Building
Plaza Singapura
Bugis Junction
Sembawang Shopping Centre JCube
Raffles City Singapore
Lot One Shoppers' Mall
Bukit Panjang Plaza
The Atrium@Orchard Clarke Quay Bugis+ Westgate3
Bedok Mall
Gross Floor Area (sq ft)
505,717 376,450 887,0004 1,426,504 757,031 576,998 206,087 316,741 3,449,727 326,152 247,545 576,755 366,073 319,652 593,928 335,877
Net Lettable Area(sq ft)
354,658 253,226 N.A. Retail: 423,603 Warehouse: 537,477Total: 961,080
483,271 396,557 142,813 206,877 Retail: 425,303 Office: 381,404 Total: 806,707
219,841 163,407 Retail: 135,607 Office: 252,308 Total: 387,915
292,390 214,492 411,603 222,464
Number of Leases 166 179 N.A. 568 246 236 76 166 281 154 126 91 73 95 255 202
Number of Car Park Lots 637 305 N.A. 1,324 695 648 165 341 1,045 324 332 127 424 325 600 265
Land Tenure Leasehold tenure of 99 years with effect from 1 September 1992
Leasehold tenure of 99 years with effect from 1 September 1991
Leasehold tenure of 99 years with effect from 12 December 1979
Leasehold tenure of 30 + 30 years with effect from 23 January 1989
Freehold Leasehold tenure of 99 years with effect from 10 September 1990
Leasehold tenure of 999 years with effect from 26 March 1885
Leasehold tenure of 99 years with effect from 1 March 1991
Leasehold tenure of 99 years with effect from 16 July 1979
Leasehold tenure of 99 years with effect from 1 December 1993
Leasehold tenure of 99 years with effect from 1 December 1994
Leasehold tenure of 99 years with effect from 15 August 2008
Leasehold tenure of 99 years with effect from 13 January 1990
Leasehold tenure of 60 years with effect from 30 September 2005
Leasehold tenure of 99 years with effect from 29 August 2011
Leasehold tenure of 99 years with effect from 21 November 2011
Acquisition Year 2002 2002 2002 2003 2004 2005 2005 2005 2006 2007 2007 2008 2010 2011 20115 2015
Purchase Price (S$ million)
409.0 295.0 191.0 247.4 710.0 605.8 78.0 68.0 2,166.0 (100.00%)866.4(40.00% interest)
243.8 161.3 839.8 268.0 295.0 969.0(100.00%)290.7(30.00% interest)
780.0
Market Valuation (S$ million)
994.0 703.0 421.06 624.0 1,257.0 1,014.0 118.0 288.0 3,169.0(100.00%)1,267.6(40.00% interest)
512.0 310.0 735.0 389.0 340.0 1,064.0(100.00%)319.2(30.00% interest)
780.0
As % of Portfolio Valuation
9.9% 7.0% 4.2% 6.2% 12.5% 10.0% 1.2% 2.8% 12.6% 5.1% 3.1% 7.3% 3.8% 3.4% 3.2% 7.7%
Gross Revenue (S$ million)
79.3 58.8 11.4 80.7 90.1 83.9 N.A.7 N.A.7 93.9(40.00% interest)
44.3 28.4 49.2 36.5 32.6 23.9(30.00% interest)
58.1
Net Property Income (S$ million)
58.8 41.8 3.8 54.1 67.5 60.8 N.A.7 N.A.7 70.1(40.00% interest)
30.8 18.3 37.8 21.3 22.3 16.6(30.00% interest)
42.7
Committed Occupancy
99.2% 99.9% N.A. Retail: 97.9%Warehouse: 91.8%Total: 94.5%
100.0% 99.9% 100.0% 92.0% Retail: 99.7%Office: 95.8%Total: 97.8%
99.9% 99.9% Retail: 93.3%Office: 100.0%Total: 97.6%
90.7% 100.0% 99.6% 100.0%
Annual Shopper Traffic (million)
25.6 32.5 N.A. 15.6 25.5 40.8 5.0 13.4 32.3 17.6 13.6 25.9 10.8 22.3 47.6 18.9
Key Tenants (by gross rental income)
NTUC Enterprise, Isetan, H&M, Golden Village, Kopitiam
NTUC Enterprise, BHG, Auric Pacific, Best Denki, Golden Village
N.A. Cold Storage, Best Denki, Kopitiam, Extra Space Jurong, Daiso
Robinson & Co., Golden Village, Cold Storage, Spotlight, Kopitiam
BHG, Auric Pacific, Cold Storage, Wing Tai Clothing, Japan Foods Holding
Cold Storage, Yamaha, Auric Pacific, Daiso, DD Pte Ltd
Shaw Theatre, Kopitiam, NTUC Enterprise, Singapore Sports Council, McDonald’s
Robinson & Co., Minor Food Group, Auric Pacific, Cold Storage, Cortina Watch Pte Ltd
NTUC Enterprise, Auric Pacific, Courts, BHG, Euro Group
NTUC Enterprise, Kopitiam, KFC/Pizza Hut, McDonald’s, Cold Storage
Temasek Holdings, Wing Tai Clothing, Fullerton Fund Mgt, Standard Chartered Bank, Euro Group
The Quayside Group, Shanghai Dolly, Katrina Holdings, Attica, VLV Pte Ltd
Hansfort Investments, Wing Tai Clothing, RSH Singapore, Fast Future Brands Singapore, Diamond Dining Singapore
Isetan, BreadTalk, Courts, Samsung, Fitness First
NTUC Enterprise, Wing Tai Clothing, BreadTalk, McDonald’s, Best Denki

Overview
115Business Review
Corporate Governance & Transparency
Portfolio Details
Sustainability
Financials & Additional Information
1 Excludes Community and Sports Facilities Scheme (CSFS) space for gross floor area, net lettable area and committed occupancy.2 Funan was closed on 1 July 2016 for redevelopment.3 All information (except the purchase price) reflect only the retail component of the integrated development. The purchase price reflects the total
land price of the integrated retail and office development.4 The gross floor area is an approximate figure and includes CSFS space.5 Refers to the year in which the development site was acquired.6 As the property is undergoing redevelopment into an integrated development, the value reflected is the total residual land value of the integrated
development.7 For Sembawang Shopping Centre, JCube and Rivervale Mall (which was sold on 15 December 2015), the gross revenue and net property income for
the year ended 31 December 2016 were S$36.4 million and S$19.7 million respectively.
Tampines Mall Junction 81 Funan2
IMM Building
Plaza Singapura
Bugis Junction
Sembawang Shopping Centre JCube
Raffles City Singapore
Lot One Shoppers' Mall
Bukit Panjang Plaza
The Atrium@Orchard Clarke Quay Bugis+ Westgate3
Bedok Mall
Gross Floor Area (sq ft)
505,717 376,450 887,0004 1,426,504 757,031 576,998 206,087 316,741 3,449,727 326,152 247,545 576,755 366,073 319,652 593,928 335,877
Net Lettable Area(sq ft)
354,658 253,226 N.A. Retail: 423,603 Warehouse: 537,477Total: 961,080
483,271 396,557 142,813 206,877 Retail: 425,303 Office: 381,404 Total: 806,707
219,841 163,407 Retail: 135,607 Office: 252,308 Total: 387,915
292,390 214,492 411,603 222,464
Number of Leases 166 179 N.A. 568 246 236 76 166 281 154 126 91 73 95 255 202
Number of Car Park Lots 637 305 N.A. 1,324 695 648 165 341 1,045 324 332 127 424 325 600 265
Land Tenure Leasehold tenure of 99 years with effect from 1 September 1992
Leasehold tenure of 99 years with effect from 1 September 1991
Leasehold tenure of 99 years with effect from 12 December 1979
Leasehold tenure of 30 + 30 years with effect from 23 January 1989
Freehold Leasehold tenure of 99 years with effect from 10 September 1990
Leasehold tenure of 999 years with effect from 26 March 1885
Leasehold tenure of 99 years with effect from 1 March 1991
Leasehold tenure of 99 years with effect from 16 July 1979
Leasehold tenure of 99 years with effect from 1 December 1993
Leasehold tenure of 99 years with effect from 1 December 1994
Leasehold tenure of 99 years with effect from 15 August 2008
Leasehold tenure of 99 years with effect from 13 January 1990
Leasehold tenure of 60 years with effect from 30 September 2005
Leasehold tenure of 99 years with effect from 29 August 2011
Leasehold tenure of 99 years with effect from 21 November 2011
Acquisition Year 2002 2002 2002 2003 2004 2005 2005 2005 2006 2007 2007 2008 2010 2011 20115 2015
Purchase Price (S$ million)
409.0 295.0 191.0 247.4 710.0 605.8 78.0 68.0 2,166.0 (100.00%)866.4(40.00% interest)
243.8 161.3 839.8 268.0 295.0 969.0(100.00%)290.7(30.00% interest)
780.0
Market Valuation (S$ million)
994.0 703.0 421.06 624.0 1,257.0 1,014.0 118.0 288.0 3,169.0(100.00%)1,267.6(40.00% interest)
512.0 310.0 735.0 389.0 340.0 1,064.0(100.00%)319.2(30.00% interest)
780.0
As % of Portfolio Valuation
9.9% 7.0% 4.2% 6.2% 12.5% 10.0% 1.2% 2.8% 12.6% 5.1% 3.1% 7.3% 3.8% 3.4% 3.2% 7.7%
Gross Revenue (S$ million)
79.3 58.8 11.4 80.7 90.1 83.9 N.A.7 N.A.7 93.9(40.00% interest)
44.3 28.4 49.2 36.5 32.6 23.9(30.00% interest)
58.1
Net Property Income (S$ million)
58.8 41.8 3.8 54.1 67.5 60.8 N.A.7 N.A.7 70.1(40.00% interest)
30.8 18.3 37.8 21.3 22.3 16.6(30.00% interest)
42.7
Committed Occupancy
99.2% 99.9% N.A. Retail: 97.9%Warehouse: 91.8%Total: 94.5%
100.0% 99.9% 100.0% 92.0% Retail: 99.7%Office: 95.8%Total: 97.8%
99.9% 99.9% Retail: 93.3%Office: 100.0%Total: 97.6%
90.7% 100.0% 99.6% 100.0%
Annual Shopper Traffic (million)
25.6 32.5 N.A. 15.6 25.5 40.8 5.0 13.4 32.3 17.6 13.6 25.9 10.8 22.3 47.6 18.9
Key Tenants (by gross rental income)
NTUC Enterprise, Isetan, H&M, Golden Village, Kopitiam
NTUC Enterprise, BHG, Auric Pacific, Best Denki, Golden Village
N.A. Cold Storage, Best Denki, Kopitiam, Extra Space Jurong, Daiso
Robinson & Co., Golden Village, Cold Storage, Spotlight, Kopitiam
BHG, Auric Pacific, Cold Storage, Wing Tai Clothing, Japan Foods Holding
Cold Storage, Yamaha, Auric Pacific, Daiso, DD Pte Ltd
Shaw Theatre, Kopitiam, NTUC Enterprise, Singapore Sports Council, McDonald’s
Robinson & Co., Minor Food Group, Auric Pacific, Cold Storage, Cortina Watch Pte Ltd
NTUC Enterprise, Auric Pacific, Courts, BHG, Euro Group
NTUC Enterprise, Kopitiam, KFC/Pizza Hut, McDonald’s, Cold Storage
Temasek Holdings, Wing Tai Clothing, Fullerton Fund Mgt, Standard Chartered Bank, Euro Group
The Quayside Group, Shanghai Dolly, Katrina Holdings, Attica, VLV Pte Ltd
Hansfort Investments, Wing Tai Clothing, RSH Singapore, Fast Future Brands Singapore, Diamond Dining Singapore
Isetan, BreadTalk, Courts, Samsung, Fitness First
NTUC Enterprise, Wing Tai Clothing, BreadTalk, McDonald’s, Best Denki

Portfolio Details
116
Located in the densely populated residential area of Tampines, Tampines Mall is one of Singapore’s leading suburban malls. It is conveniently situated within the Tampines Regional Centre, the first and most developed regional centre in Singapore, and accessible via the Tampines Mass Rapid Transit (MRT) Station and bus interchange. To meet the needs of consumers living and working around the bustling Tampines Regional Centre, Tampines Mall provides a wide variety of shopping, dining and entertainment options for families, professionals and young adults.
In 2016, Tampines Mall completed rejuvenation works which include refreshing its interior finishes, replacing the main atrium fascia and balustrade as well as upgrading the Garden Plaza on Level 4.
Tampines Mall
1 Based on committed gross rental income for the expiry month of the lease.2 Excludes gross turnover rent.
By Gross Rental Income2 %
Food & Beverage 30.3
Fashion 12.3
Beauty & Health 10.6
Gifts & Souvenirs / Toys & Hobbies / Books & Stationery / Sporting Goods 7.6
Jewellery & Watches 6.5
Supermarket 5.9
Services 5.6
Department Store 5.1
Shoes & Bags 4.0
Leisure & Entertainment / Music & Video 3.8
Education 3.6
Information Technology 2.4
Electrical & Electronics 2.3
Total 100.0
Trade Sector Analysis (For the month of December 2016)
2018 2019 20212020 2022 and beyond
2017
22.2
30.926.9
10.4
3.95.7
CapitaLand Mall Trust
Annual Report 2016
Lease Expiry Profile1 (As at 31 December 2016)
(% of Gross Rental Income2)

117
Junction 8 is located in the densely populated residential area of Bishan and is well served by the Bishan MRT interchange station and bus interchange. It extends its reach well beyond its immediate vicinity. As the only shopping mall in Bishan, Junction 8 is positioned as a one-stop shopping, dining and entertainment destination catering to the needs of residents from the surrounding estates, office workers in the area and students from nearby schools.
Junction 8
By Gross Rental Income2 %
Food & Beverage 34.4
Beauty & Health 12.7
Fashion 10.5
Services 6.0
Department Store 5.9
Gifts & Souvenirs / Toys & Hobbies / Books & Stationery / Sporting Goods 5.5
Supermarket 5.3
Shoes & Bags 5.0
Electrical & Electronics 4.6
Leisure & Entertainment / Music & Video 3.5
Jewellery & Watches 2.7
Office 1.5
Home Furnishing 1.1
Information Technology 0.7
Education 0.6
Total 100.0
1 Based on committed gross rental income for the expiry month of the lease.2 Excludes gross turnover rent.
Trade Sector Analysis (For the month of December 2016)
2018 2019 20212020 2022 and beyond
2017
27.023.7
41.7
4.71.4 1.5
Overview
Business Review
Corporate Governance & Transparency
Portfolio Details
Sustainability
Financials & Additional Information
Lease Expiry Profile1 (As at 31 December 2016)
(% of Gross Rental Income2)
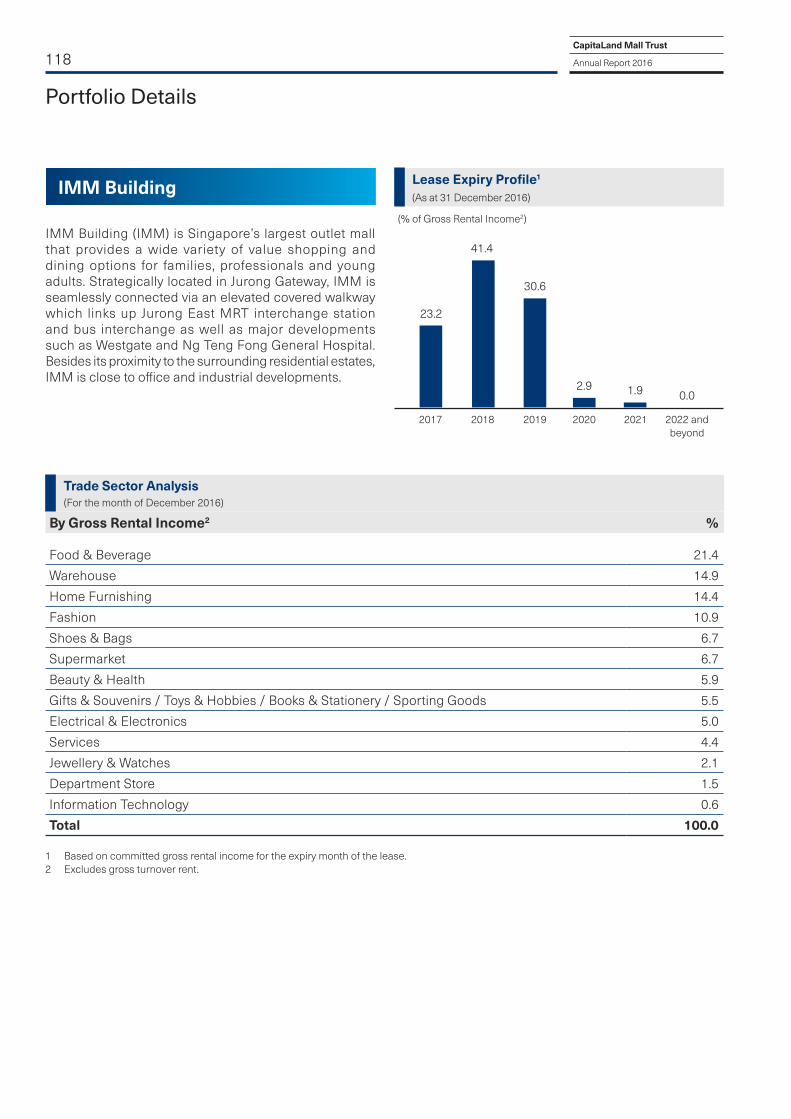
118
IMM Building (IMM) is Singapore’s largest outlet mall that provides a wide variety of value shopping and dining options for families, professionals and young adults. Strategically located in Jurong Gateway, IMM is seamlessly connected via an elevated covered walkway which links up Jurong East MRT interchange station and bus interchange as well as major developments such as Westgate and Ng Teng Fong General Hospital. Besides its proximity to the surrounding residential estates, IMM is close to office and industrial developments.
IMM Building
By Gross Rental Income2 %
Food & Beverage 21.4
Warehouse 14.9
Home Furnishing 14.4
Fashion 10.9
Shoes & Bags 6.7
Supermarket 6.7
Beauty & Health 5.9
Gifts & Souvenirs / Toys & Hobbies / Books & Stationery / Sporting Goods 5.5
Electrical & Electronics 5.0
Services 4.4
Jewellery & Watches 2.1
Department Store 1.5
Information Technology 0.6
Total 100.0
1 Based on committed gross rental income for the expiry month of the lease.2 Excludes gross turnover rent.
Trade Sector Analysis (For the month of December 2016)
Portfolio Details
CapitaLand Mall Trust
Annual Report 2016
2018 2019 20212020 2022 and beyond
2017
23.2
41.4
30.6
2.9 1.9 0.0
Lease Expiry Profile1 (As at 31 December 2016)
(% of Gross Rental Income2)
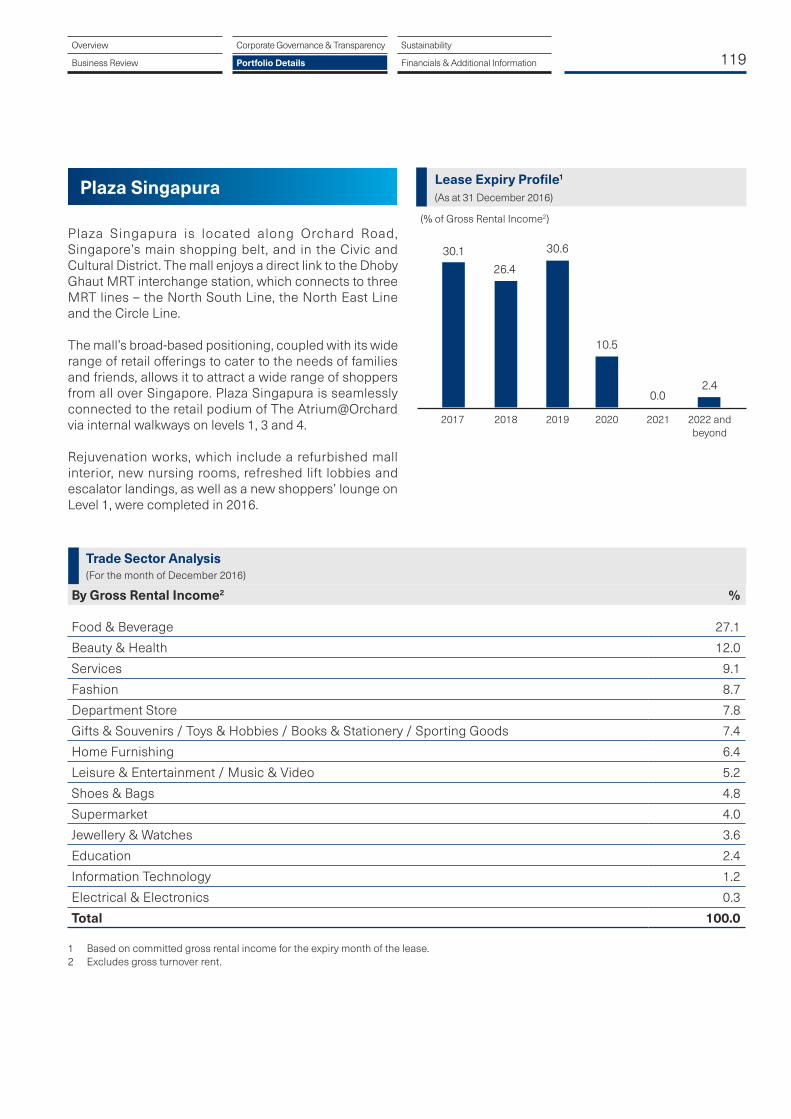
119
Plaza Singapura is located along Orchard Road, Singapore’s main shopping belt, and in the Civic and Cultural District. The mall enjoys a direct link to the Dhoby Ghaut MRT interchange station, which connects to three MRT lines – the North South Line, the North East Line and the Circle Line.
The mall’s broad-based positioning, coupled with its wide range of retail offerings to cater to the needs of families and friends, allows it to attract a wide range of shoppers from all over Singapore. Plaza Singapura is seamlessly connected to the retail podium of The Atrium@Orchard via internal walkways on levels 1, 3 and 4.
Rejuvenation works, which include a refurbished mall interior, new nursing rooms, refreshed lift lobbies and escalator landings, as well as a new shoppers’ lounge on Level 1, were completed in 2016.
Plaza Singapura
Trade Sector Analysis (For the month of December 2016)
By Gross Rental Income2 %
Food & Beverage 27.1
Beauty & Health 12.0
Services 9.1
Fashion 8.7
Department Store 7.8
Gifts & Souvenirs / Toys & Hobbies / Books & Stationery / Sporting Goods 7.4
Home Furnishing 6.4
Leisure & Entertainment / Music & Video 5.2
Shoes & Bags 4.8
Supermarket 4.0
Jewellery & Watches 3.6
Education 2.4
Information Technology 1.2
Electrical & Electronics 0.3
Total 100.0
1 Based on committed gross rental income for the expiry month of the lease.2 Excludes gross turnover rent.
Overview
Business Review
Corporate Governance & Transparency
Portfolio Details
Sustainability
Financials & Additional Information
2018 2019 20212020 2022 and beyond
2017
30.126.4
30.6
10.5
0.02.4
Lease Expiry Profile1 (As at 31 December 2016)
(% of Gross Rental Income2)

120
Located in the heart of Singapore’s Civic and Cultural District, Bugis Junction enjoys direct connectivity to the Bugis MRT Station and is well served by major public bus routes. In line with its close proximity to the Singapore Management University, LASALLE College of the Arts and School of the Arts, Bugis Junction is positioned as a modern fashion destination mall with exciting dining choices for young adults and professionals. Bugis Junction also has Singapore’s first and only air-conditioned sky-lit shopping streets flanked by charming historic shophouses, representing a showcase of new and old-world integration.
Bugis Junction is directly connected by an overhead link bridge to Bugis+, providing a wider range of retail, food and beverage (F&B) and entertainment offerings to the shoppers.
Bugis Junction
Trade Sector Analysis (For the month of December 2016)
By Gross Rental Income2 %
Food & Beverage 30.4
Fashion 17.7
Department Store 11.5
Beauty & Health 10.3
Gifts & Souvenirs / Toys & Hobbies / Books & Stationery / Sporting Goods 8.6
Jewellery & Watches 5.2
Shoes & Bags 5.1
Services 3.8
Supermarket 2.8
Information Technology 2.5
Leisure & Entertainment / Music & Video 1.7
Electrical & Electronics 0.4
Total 100.0
1 Based on committed gross rental income for the expiry month of the lease.2 Excludes gross turnover rent.
Portfolio Details
CapitaLand Mall Trust
Annual Report 2016
2018 2019 20212020 2022 and beyond
2017
24.3 23.7
45.2
4.60.7 1.5
Lease Expiry Profile1 (As at 31 December 2016)
(% of Gross Rental Income2)

121
Sembawang Shopping Centre (SSC) is situated in close proximity to Sembawang MRT Station and Yishun MRT Station. The mall provides shuttle bus services which ply between SSC and the neighbouring towns including Sembawang, Yishun and Woodlands. On weekdays, SSC also operates lunch-time shuttle bus services to the nearby Yishun and Woodlands industrial estates.
SSC brings to its shoppers a good mix of F&B tenants, established retailers and a hypermarket, which appeals to the residents from the surrounding estates, uniformed personnel from nearby military camps, as well as workers from the neighbouring industrial parks. The mall also holds a strong cluster of enrichment and educational tenants that offers a wide variety of developmental classes for children and students. All these offerings strengthen SSC’s focus as a purposeful shopping destination for the entire family.
Sembawang Shopping Centre
By Gross Rental Income2 %
Food & Beverage 25.4
Supermarket 16.5
Beauty & Health 14.1
Education 10.9
Department Store 8.9
Fashion 7.3
Services 4.5
Home Furnishing 3.8
Gifts & Souvenirs / Toys & Hobbies / Books & Stationery / Sporting Goods 2.9
Leisure & Entertainment / Music & Video 2.9
Shoes & Bags 1.2
Information Technology 1.0
Jewellery & Watches 0.6
Total 100.0
Trade Sector Analysis (For the month of December 2016)
1 Based on committed gross rental income for the expiry month of the lease.2 Excludes gross turnover rent.
Overview
Business Review
Corporate Governance & Transparency
Portfolio Details
Sustainability
Financials & Additional Information
2018 2019 20212020 2022 and beyond
2017
13.6
37.6
22.9 23.5
0.02.4
Lease Expiry Profile1 (As at 31 December 2016)
(% of Gross Rental Income2)

122
Located across the road from the Jurong East MRT interchange station and bus interchange, JCube is a leisure and edutainment mall with Singapore’s only Olympic-size ice rink and the first IMAX theatre in the suburbs. In addition, the mall offers a good variety of F&B options for its shoppers.
In JCube, a retail zone - J.Avenue offers chic and affordable merchandise and features a street shopping ambience. The retail concepts at J.Avenue will be refreshed throughout the year so that shoppers will continue to discover something new every season.
JCube
By Gross Rental Income2 %
Food & Beverage 43.0
Fashion 13.1
Leisure & Entertainment / Music & Video 12.0
Beauty & Health 10.1
Services 5.5
Gifts & Souvenirs / Toys & Hobbies / Books & Stationery / Sporting Goods 5.0
Supermarket 3.4
Education 2.9
Shoes & Bags 2.3
Department Store 2.3
Home Furnishing 0.2
Jewellery & Watches 0.2
Total 100.0
Trade Sector Analysis (For the month of December 2016)
1 Based on committed gross rental income for the expiry month of the lease.2 Excludes gross turnover rent.
Portfolio Details
CapitaLand Mall Trust
Annual Report 2016
2018 2019 20212020 2022 and beyond
2017
26.6
38.0
30.0
2.50.0
2.9
Lease Expiry Profile1 (As at 31 December 2016)
(% of Gross Rental Income2)

123
Raffles City Singapore (RCS) is a large integrated development in Singapore. A prime landmark located in the downtown core, at the fringe of Singapore’s Central Business District, and within the Civic and Cultural District. RCS is served by three main MRT lines, directly connected to the City Hall MRT interchange station and the Esplanade MRT Station. The integrated development comprises Raffles City Shopping Centre, Raffles City Tower, Raffles City Convention Centre, Swissôtel The Stamford and Fairmont Singapore.
CapitaLand Commercial Trust (CCT) and CMT jointly own the integrated development through RCS Trust, the special purpose trust that holds RCS. RCS Trust is 60.00% owned by CCT and 40.00% owned by CMT.
Raffles City Singapore
By Gross Rental Income2 %
Food & Beverage 29.9
Fashion 18.6
Department Store 16.4
Beauty & Health 8.9
Shoes & Bags 7.3
Others3 5.4
Services 5.0
Gifts & Souvenirs / Toys & Hobbies / Books & Stationery / Sporting Goods 3.6
Supermarket 2.5
Jewellery & Watches 1.2
Information Technology 0.9
Electrical & Electronics 0.2
Home Furnishing 0.1
Total 100.0
Trade Sector Analysis - Retail Only (For the month of December 2016)
1 Based on committed gross rental income 2 Excludes gross turnover rent.3 Others include Art Gallery and Luxury.
9.512.2
18.2
8.1
0.8 0.51.7 1.8
6.54.0 4.8
31.9
Retail Office Hotel
Overview
Business Review
Corporate Governance & Transparency
Portfolio Details
Sustainability
Financials & Additional Information
2018 2019 20212020 2022 and beyond
2017
Lease Expiry Profile1 (As at 31 December 2016)
(% of Gross Rental Income2)
0.0

124
Lot One Shoppers’ Mall is situated in the heart of the Choa Chu Kang housing estate, in the north-western region of Singapore. The mall is well connected by major arterial roads and is located next to the Choa Chu Kang MRT and light rail transit (LRT) stations as well as bus interchange.
The mall enjoys a large catchment, comprising residents from the Choa Chu Kang, Bukit Panjang, Bukit Batok and Upper Bukit Timah precincts, uniformed personnel from military camps in the vicinity, as well as students from nearby schools.
Lot One Shoppers’ Mall
By Gross Rental Income2 %
Food & Beverage 31.2
Beauty & Health 16.3
Fashion 14.1
Services 8.3
Gifts & Souvenirs / Toys & Hobbies / Books & Stationery / Sporting Goods 4.9
Department Store 4.6
Supermarket 4.0
Leisure & Entertainment / Music & Video 3.9
Electrical & Electronics 3.5
Shoes & Bags 3.0
Jewellery & Watches 2.1
Education 1.8
Information Technology 1.5
Home Furnishing 0.8
Total 100.0
Trade Sector Analysis (For the month of December 2016)
1 Based on committed gross rental income for the expiry month of the lease.2 Excludes gross turnover rent.
Portfolio Details
CapitaLand Mall Trust
Annual Report 2016
2018 2019 20212020 2022 and beyond
2017
40.1 41.1
15.4
3.40.0 0.0
Lease Expiry Profile1 (As at 31 December 2016)
(% of Gross Rental Income2)

125
Bukit Panjang Plaza is located in the high-density residential area of Bukit Panjang in the north-western region of Singapore. Besides the surrounding estates of Bukit Panjang, Cashew Park, Chestnut Drive and Hillview, the mall also caters to residents from Teck Whye, Choa Chu Kang and Upper Bukit Timah precincts.
The mall is conveniently located between the Bukit Panjang and Senja LRT stations. It will be adjacent to the new Bukit Panjang Integrated Transport Hub.
Bukit Panjang Plaza
By Gross Rental Income2 %
Food & Beverage 39.8
Beauty & Health 15.4
Services 11.4
Supermarket 10.5
Education 4.6
Gifts & Souvenirs / Toys & Hobbies / Books & Stationery / Sporting Goods 4.1
Fashion 3.5
Jewellery & Watches 3.1
Electrical & Electronics 2.1
Shoes & Bags 1.8
Department Store 1.7
Home Furnishing 1.1
Information Technology 0.9
Total 100.0
Trade Sector Analysis (For the month of December 2016)
1 Based on committed gross rental income for the expiry month of the lease.2 Excludes gross turnover rent.
Overview
Business Review
Corporate Governance & Transparency
Portfolio Details
Sustainability
Financials & Additional Information
2018 2019 20212020 2022 and beyond
2017
21.5
43.7
27.6
3.0 0.63.6
Lease Expiry Profile1 (As at 31 December 2016)
(% of Gross Rental Income2)

126
The Atrium@Orchard comprises 135,000 square feet (sq ft) of retail space and two office towers. The retail podium is seamlessly connected with Plaza Singapura by internal walkways on levels 1, 3 and 4. The integration of the two malls increases its attractiveness to shoppers with a combined retail space of more than 600,000 sq ft. The development also enjoys direct connectivity to the Dhoby Ghaut MRT interchange station, which connects three MRT lines – the North South Line, the North East Line and the Circle Line.
The Atrium@Orchard
By Gross Rental Income2 %
Office 47.0
Food & Beverage 17.7
Beauty & Health 13.8
Fashion 9.3
Services 7.1
Gifts & Souvenirs / Toys & Hobbies / Books & Stationery / Sporting Goods 2.0
Electrical & Electronics 1.5
Shoes & Bags 1.3
Information Technology 0.3
Total 100.0
Trade Sector Analysis (For the month of December 2016)
1 Based on committed gross rental income for the expiry month of the lease.2 Excludes gross turnover rent.
Portfolio Details
CapitaLand Mall Trust
Annual Report 2016
2018 2019 20212020 2022 and beyond
2017
8.8
20.418.1
1.3 1.7
49.7
Lease Expiry Profile1 (As at 31 December 2016)
(% of Gross Rental Income2)

127
Clarke Quay is a unique conserved historical landmark located along the Singapore River and at the fringe of Singapore’s Central Business District. It is within walking distance of the Clarke Quay MRT Station, making it accessible by public transportation.
Comprising five blocks of restored shophouses and warehouses infused with funky art-deco structures, Clarke Quay plays host to a wide range of dining and entertainment options, and has become an attraction for both locals and tourists over the years.
Clarke Quay
By Gross Rental Income2 %
Food & Beverage 61.2
Leisure & Entertainment / Music & Video 33.7
Office 3.8
Beauty & Health 0.9
Services 0.4
Total 100.0
Trade Sector Analysis (For the month of December 2016)
1 Based on committed gross rental income for the expiry month of the lease.2 Excludes gross turnover rent.
Overview
Business Review
Corporate Governance & Transparency
Portfolio Details
Sustainability
Financials & Additional Information
2018 2019 20212020 2022 and beyond
2017
10.9
30.228.8
11.614.9
3.6
Lease Expiry Profile1 (As at 31 December 2016)
(% of Gross Rental Income2)
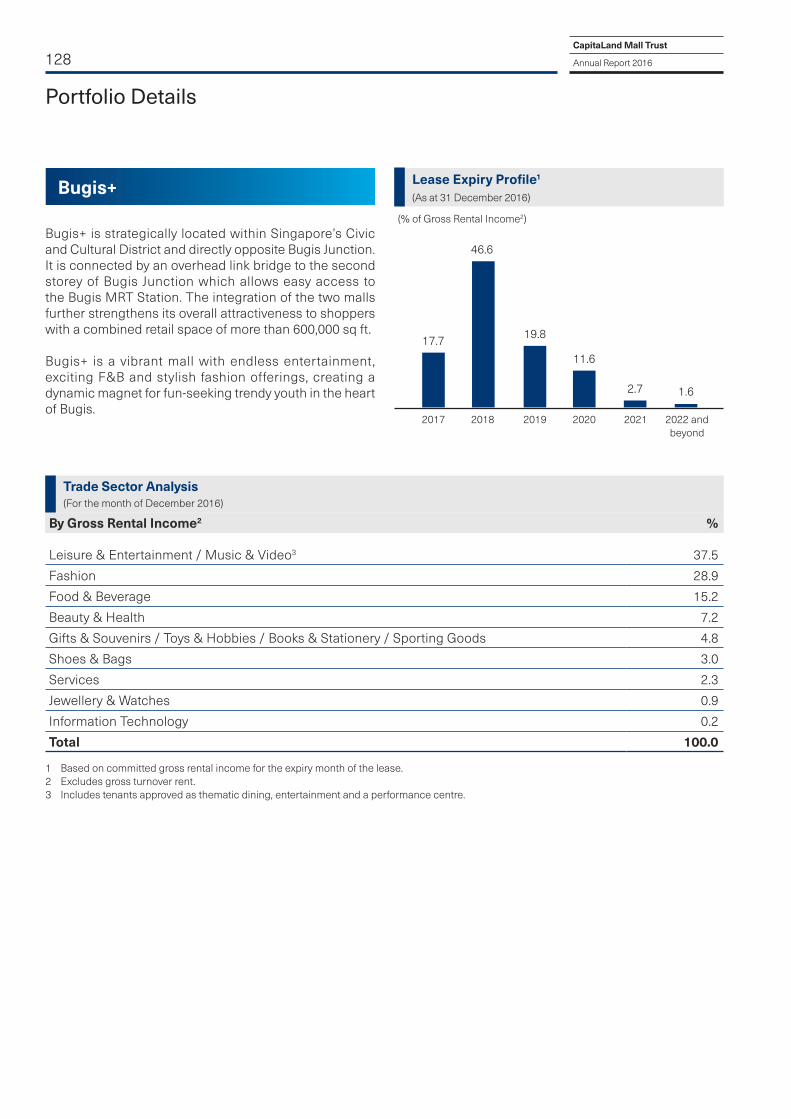
128
Bugis+ is strategically located within Singapore’s Civic and Cultural District and directly opposite Bugis Junction. It is connected by an overhead link bridge to the second storey of Bugis Junction which allows easy access to the Bugis MRT Station. The integration of the two malls further strengthens its overall attractiveness to shoppers with a combined retail space of more than 600,000 sq ft.
Bugis+ is a vibrant mall with endless entertainment, exciting F&B and stylish fashion offerings, creating a dynamic magnet for fun-seeking trendy youth in the heart of Bugis.
Bugis+
By Gross Rental Income2 %
Leisure & Entertainment / Music & Video3 37.5
Fashion 28.9
Food & Beverage 15.2
Beauty & Health 7.2
Gifts & Souvenirs / Toys & Hobbies / Books & Stationery / Sporting Goods 4.8
Shoes & Bags 3.0
Services 2.3
Jewellery & Watches 0.9
Information Technology 0.2
Total 100.0
Trade Sector Analysis (For the month of December 2016)
1 Based on committed gross rental income for the expiry month of the lease.2 Excludes gross turnover rent.3 Includes tenants approved as thematic dining, entertainment and a performance centre.
Portfolio Details
CapitaLand Mall Trust
Annual Report 2016
2018 2019 20212020 2022 and beyond
2017
17.7
46.6
19.8
11.6
2.7 1.6
Lease Expiry Profile1 (As at 31 December 2016)
(% of Gross Rental Income2)
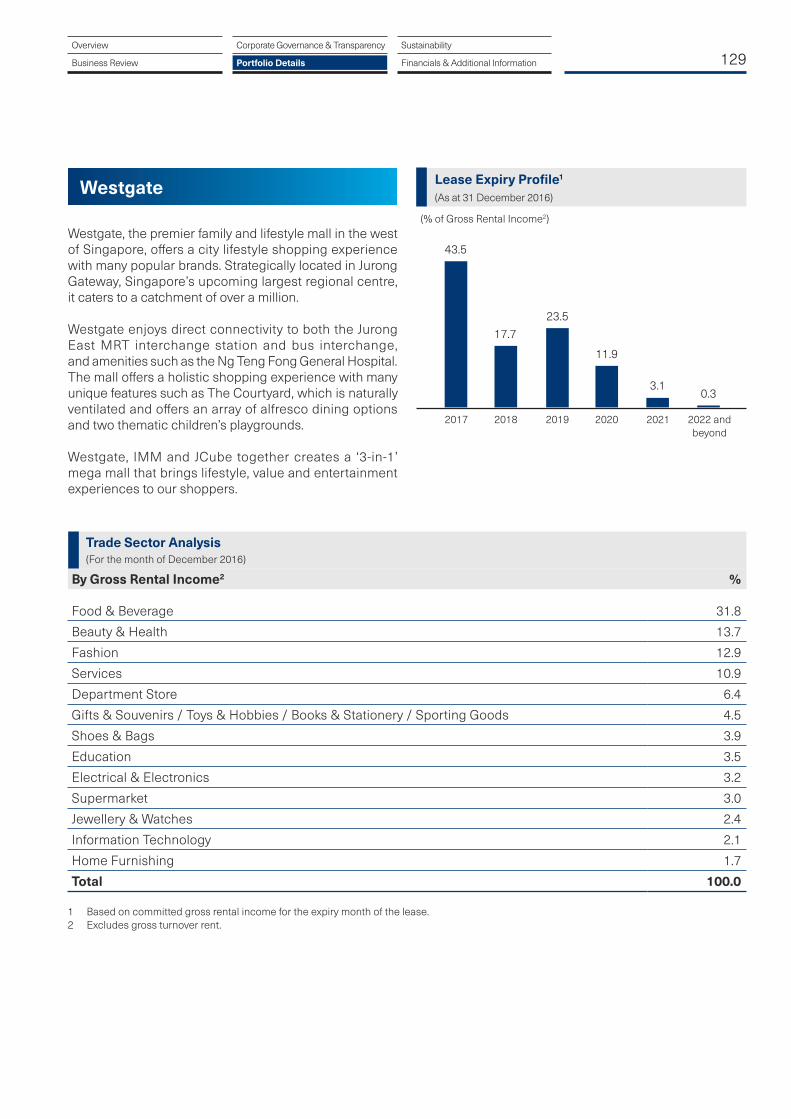
129
Westgate, the premier family and lifestyle mall in the west of Singapore, offers a city lifestyle shopping experience with many popular brands. Strategically located in Jurong Gateway, Singapore’s upcoming largest regional centre, it caters to a catchment of over a million.
Westgate enjoys direct connectivity to both the Jurong East MRT interchange station and bus interchange, and amenities such as the Ng Teng Fong General Hospital. The mall offers a holistic shopping experience with many unique features such as The Courtyard, which is naturally ventilated and offers an array of alfresco dining options and two thematic children’s playgrounds.
Westgate, IMM and JCube together creates a ‘3-in-1’ mega mall that brings lifestyle, value and entertainment experiences to our shoppers.
Westgate
By Gross Rental Income2 %
Food & Beverage 31.8
Beauty & Health 13.7
Fashion 12.9
Services 10.9
Department Store 6.4
Gifts & Souvenirs / Toys & Hobbies / Books & Stationery / Sporting Goods 4.5
Shoes & Bags 3.9
Education 3.5
Electrical & Electronics 3.2
Supermarket 3.0
Jewellery & Watches 2.4
Information Technology 2.1
Home Furnishing 1.7
Total 100.0
Trade Sector Analysis (For the month of December 2016)
1 Based on committed gross rental income for the expiry month of the lease.2 Excludes gross turnover rent.
Overview
Business Review
Corporate Governance & Transparency
Portfolio Details
Sustainability
Financials & Additional Information
2018 2019 20212020 2022 and beyond
2017
43.5
17.723.5
11.9
3.10.3
Lease Expiry Profile1 (As at 31 December 2016)
(% of Gross Rental Income2)

130
Bedok Mall is the first major mall in Bedok, Singapore’s most populous housing estate. It is located in the heart of the Bedok Town Centre. Bedok Mall houses over 200 shops across four floors, offering everyday essentials, F&B options, lifestyle and fashion.
As part of a retail-residential-transport hub development, Bedok Mall enjoys excellent connectivity with direct connection to the Bedok MRT Station and bus interchange.
Bedok Mall
By Gross Rental Income2 %
Food & Beverage 31.9
Fashion 19.3
Beauty & Health 13.3
Services 8.1
Gifts & Souvenirs / Toys & Hobbies / Books & Stationery / Sporting Goods 6.9
Supermarket 5.8
Shoes & Bags 4.4
Jewellery & Watches 3.1
Home Furnishing 2.4
Electrical & Electronics 2.3
Information Technology 1.4
Department Store 0.7
Education 0.3
Leisure & Entertainment / Music & Video 0.1
Total 100.0
Trade Sector Analysis (For the month of December 2016)
1 Based on committed gross rental income for the expiry month of the lease.2 Excludes gross turnover rent.
Portfolio Details
CapitaLand Mall Trust
Annual Report 2016
2018 2019 20212020 2022 and beyond
2017
50.7
16.7 15.912.2
4.50.0
Lease Expiry Profile1 (As at 31 December 2016)
(% of Gross Rental Income2)

131
Funan
A New Paradigm for Live-Work-Play in SingaporeFunan held its groundbreaking ceremony on 7 September 2016 to unveil its new positioning and features of the development.
Funan inspires real estate innovation and will offer a new live-work-play paradigm in Singapore. It will be an exciting lifestyle destination plugged into the world of tech- and socially-savvy consumers. Building on its legacy as the definitive information technology (IT) mall in Singapore over the last three decades, Funan will go beyond selling IT products to incorporating the tech experience throughout the entire integrated development.
Funan has a total gross floor area (GFA) of approximately 887,000 sq ft. Occupying more than half the GFA at approximately 500,000 sq ft is the six-storey retail component, which comprises four levels above ground
and two basement levels. Funan has three towers that sit above, including two six-storey office towers from Level 5 to Level 10. It is envisioned that the two office towers with a combined GFA of approximately 266,000 sq ft, will have different identities – smart offices in the Northern Tower and innovative studios in the Southern Tower – to cater to the various business needs, including co-working. Completing the integrated development is a nine-storey block housing 279 co-living apartment units from Level 4 to Level 12 with a GFA of approximately 121,000 sq ft.
A Thank You Party was held for retailers and loyal shoppers and subsequently Funan DigitaLife Mall was closed from 1 July 2016. When it reopens in 2019, Funan will become Singapore’s new creative intersection where shoppers can learn and discover a myriad of experiences in line with their passions.
Overview
Business Review
Corporate Governance & Transparency
Portfolio Details
Sustainability
Financials & Additional Information
A Thank You Party was held for our retailers and loyal shoppers
An artist’s impression of the new building facade An artist’s impression of Funan’s interior
Groundbreaking ceremony

CMT holds 122.7 million units in CapitaLand Retail China Trust (CRCT), which translates to an approximate 14.11% stake as at 31 December 2016. The fair value of CMT’s investment in CRCT represents 1.6% of CMT and its subsidiaries’ (CMT Group) total asset size as at 31 December 2016. Through its investment in CRCT, CMT’s Unitholders are provided with an opportunity to enjoy the upside from China’s growth potential without CMT’s risk profile being significantly altered.
CRCT is the first China shopping mall real estate investment trust in Singapore, with a portfolio of 11 income-producing shopping malls. Listed on the Singapore Exchange Securities Trading Limited (SGX-ST) on 8 December 2006, it is established with the objective of investing on a long-term basis in a diversified portfolio of income-producing real estate used primarily for retail purposes and located primarily in China, Hong Kong and Macau.
CRCT’s geographically diversified portfolio of quality shopping malls is located in six of China’s cities. The malls are CapitaMall Xizhimen, CapitaMall Wangjing, CapitaMall Grand Canyon, CapitaMall Anzhen and CapitaMall Shuangjing in Beijing; CapitaMall Xinnan in Chengdu, Sichuan Province; CapitaMall Qibao in Shanghai; CapitaMall Minzhongleyuan in Wuhan, Hubei Province; CapitaMall Erqi in Zhengzhou, Henan Province; CapitaMall Saihan in Hohhot, Inner Mongolia; and CapitaMall Wuhu in Wuhu, Anhui Province. As at 31 December 2016, the total asset size of CRCT was approximately S$2.8 billion.
CapitaLand Mall Trust
Annual Report 2016
CapitaLand Retail China Trust
132
All the malls in the portfolio are positioned as one-stop family-oriented shopping, dining and entertainment destinations for the sizeable population catchment areas in which they are located, and are accessible via major transportation routes or access points. A significant portion of the properties’ tenancies consists of major international and domestic retailers such as Beijing Hualian Group, Carrefour and Wal-Mart under master leases or long-term leases, which provide CRCT’s unitholders with stable and sustainable returns. The anchor tenants are complemented by popular specialty brands such as Häagen-Dazs, innisfree, KFC, Nanjing Impressions, Nike, Pandora, Sephora, Starbucks, UNIQLO, Watsons and Zara.
CRCT has long-term growth potential through its right of first refusal arrangements to acquire assets held by CapitaLand Mall China Income Fund I, CapitaLand Mall China Income Fund II, CapitaLand Mall China Income Fund III, CapitaLand Mall Development Fund III, as well as CapitaLand Mall Asia, which is the wholly owned shopping mall business unit of CapitaLand Limited, one of Asia’s largest real estate companies headquartered and listed in Singapore.
CRCT delivered a healthy set of results for the financial year 2016 (FY 2016). Gross revenue and net property income were RMB1,027.5 million (S$214.4 million) and RMB669.8 million (S$139.7 million), up 2.2% and 4.1% year-on-year respectively. Income available for distribution was S$86.7 million. Distribution per unit in FY 2016 was 10.05 Singapore cents. Across the portfolio, CRCT achieved healthy rental reversion of 3.9% and portfolio occupancy was 95.9% as at 31 December 2016.

Financial Statements
134 Report of the Trustee135 Statement by the Manager136 Independent Auditors’ Report139 Statements of Financial Position140 Statements of Total Return141 Distribution Statements143 Statements of Movements in Unitholders’ Funds144 Portfolio Statements149 Statements of Cash Flows152 Notes to the Financial Statements

134CapitaLand Mall Trust
Annual Report 2016
Report of the TrusteeYear ended 31 December 2016
1 As amended by the First Supplemental Deed dated 26 December 2001, the Second Supplemental Deed dated 28 June 2002, the Amending and Restating Deed dated 29 April 2003, the Fourth Supplemental Deed dated 18 August 2003, the Second Amending and Restating Deed dated 9 July 2004, the Sixth Supplemental Deed dated 18 March 2005, the Seventh Supplemental Deed dated 21 July 2005, the Eighth Supplemental Deed dated 13 October 2005, the Ninth Supplemental Deed dated 20 April 2006, the Third Amending and Restating Deed dated 25 August 2006, the Eleventh Supplemental Deed dated 15 February 2007, the Twelfth Supplemental Deed dated 31 July 2007, the Thirteenth Supplemental Deed dated 20 May 2008, the Fourteenth Supplemental Deed dated 13 April 2010, the Fifteenth Supplemental Deed dated 25 March 2013, the Sixteenth Supplemental Deed dated 3 February 2014, the Seventeenth Supplemental Deed dated 6 May 2015 and the Eighteenth Supplemental Deed dated 12 April 2016.
HSBC Institutional Trust Services (Singapore) Limited (the “Trustee”) is under a duty to take into custody and hold the assets of CapitaLand Mall Trust (the “Trust”) and its subsidiaries (the “Group”) in trust for the Unitholders. In accordance with the Securities and Futures Act, Chapter 289 of Singapore, its subsidiary legislation and the Code on Collective Investment Schemes, the Trustee shall monitor the activities of CapitaLand Mall Trust Management Limited (the “Manager”) for compliance with the limitations imposed on the investment and borrowing powers as set out in the deed of trust dated 29 October 2001 constituting the Trust (as amended)1 between the Manager and the Trustee (the “Trust Deed”) in each annual accounting period and report thereon to Unitholders in an annual report.
To the best knowledge of the Trustee, the Manager has, in all material respects, managed the Trust during the period covered by these financial statements, set out on pages 139 to 214 in accordance with the limitations imposed on the investment and borrowing powers set out in the Trust Deed.
For and on behalf of the Trustee,HSBC Institutional Trust Services (Singapore) Limited
Esther FongSenior Vice President, Trustee Services
Singapore17 February 2017
135Overview
Business Review
Corporate Governance & Transparency
Portfolio Details
Sustainability
Financials & Additional Information
Statement by the ManagerYear ended 31 December 2016
In the opinion of the directors of CapitaLand Mall Trust Management Limited, the accompanying financial statements set out on pages 139 to 214 comprising the Statements of Financial Position and Portfolio Statements of the Group and the Trust as at 31 December 2016, and the Statements of Total Return, Distribution Statements, Statements of Movements in Unitholders’ Funds and Statements of Cash Flows of the Group and of the Trust for the year then ended, and a summary of significant accounting policies and other explanatory information of the Group and of the Trust, are drawn up so as to present fairly, in all material respects, the financial position of the Group and of the Trust as at 31 December 2016, and the total return, distributable income, movements in Unitholders’ funds and cash flows of the Group and of the Trust for the year then ended in accordance with the recommendations of Statement of Recommended Accounting Practice 7 “Reporting Framework for Unit Trusts” issued by the Institute of Singapore Chartered Accountants and the provisions of the Trust Deed. At the date of this statement, there are reasonable grounds to believe that the Group and the Trust will be able to meet their financial obligations as and when they materialise.
For and on behalf of the Manager,CapitaLand Mall Trust Management Limited
Tan Wee Yan, WilsonDirector
Singapore17 February 2017

136CapitaLand Mall Trust
Annual Report 2016
Independent Auditors’ ReportUnitholders of CapitaLand Mall Trust(Established in the Republic of Singapore pursuant to a Trust Deed dated 29 October 2001 (as amended))
Report on the audit of the financial statements
Opinion
We have audited the financial statements of CapitaLand Mall Trust (the “Trust”) and its subsidiaries (the “Group”), which comprise the Statements of Financial Position and Portfolio Statements of the Group and the Trust as at 31 December 2016, and the Statements of Total Return, Distribution Statements, Statements of Movements in Unitholders’ Funds and Statements of Cash Flows of the Group and the Trust for the year then ended, and notes to the financial statements, including a summary of significant accounting policies, as set out on pages 139 to 214.
In our opinion, the accompanying consolidated financial statements of the Group and the financial statements of the Trust present fairly, in all material respects, the financial position of the Group and of the Trust as at 31 December 2016 and the total return, distributable income, movements in Unitholders’ funds and cash flows of the Group and of the Trust for the year ended on that date in accordance with the recommendations of Statement of Recommended Accounting Practice 7 “Reporting Framework for Unit Trusts” (“RAP 7”) issued by the Institute of Singapore Chartered Accountants.
Basis for opinion
We conducted our audit in accordance with Singapore Standards on Auditing (“SSAs”). Our responsibilities under those standards are further described in the ‘Auditors’ responsibilities for the audit of the financial statements’ section of our report. We are independent of the Group in accordance with the Accounting and Corporate Regulatory Authority Code of Professional Conduct and Ethics for Public Accountants and Accounting Entities (“ACRA Code”) together with the ethical requirements that are relevant to our audit of the financial statements in Singapore, and we have fulfilled our other ethical responsibilities in accordance with these requirements and the ACRA Code. We believe that the audit evidence we have obtained is sufficient and appropriate to provide a basis for our opinion. Key audit matters
Key audit matters are those matters that, in our professional judgement, were of most significance in our audit of the financial statements of the current period. These matters were addressed in the context of our audit of the financial statements as a whole, and in forming our opinion thereon, and we do not provide a separate opinion on these matters.
Valuation of investment properties and investment properties under development(Group: S$8,509.0 million, Trust: S$7,527.7 million)(Refer to Notes 5 and 6 to the financial statements)
The key audit matter How the matter was addressed in our audit
The Group’s and Trust’s investment portfolios comprise a number of investment properties in Singapore. Investment properties represent the largest asset on the Statement of Financial Position.
In accordance with the accounting policy adopted by the Group, investment properties, which include investment properties under development, are stated at fair values based on independent external valuations.
The valuation of investment properties involves significant judgement and estimation uncertainty. Judgement is required in determining the valuation methodologies applicable as well as in estimating the appropriate assumptions to be applied.
We assessed the process applied by the Manager in selecting, reviewing and assessing the work of the external valuers.
We evaluated the valuers’ objectivity and competency. We also discussed with the valuers their scope of work and basis of valuation to understand if any matters may have impacted their objectivity.
We independently considered the valuation methodologies applied by the valuers, comparing these methodologies to those applied by other valuers for similar properties. We compared the net income applied by the valuer to historical levels of net income. We also compared the capitalisation rates and discount rates, against those applied by other valuers for similar properties, and analysed trends of these key inputs.
For investment properties under development, we evaluated the estimated development costs against proposed cost plans by the quantity surveyor and other supporting evidence.

137Overview
Business Review
Corporate Governance & Transparency
Portfolio Details
Sustainability
Financials & Additional Information
The key audit matter How the matter was addressed in our audit
The valuation methodologies applied are the capitalisation method, discounted cashflow method and residual land value method.
Key inputs used for the capitalisation method include capitalisation rates and estimated net income. Key inputs used for the discounted cashflow method include discount rates and estimated net income. Inputs used for the residual land value method include gross development value and gross development costs.
The valuations are highly sensitive to the above decisions on methodology and key assumptions.
Where the amounts and rates were beyond the expected range, we performed procedures to understand the reasons and drivers.
We have also considered the disclosures in the financial statements in describing the degree of judgement and subjectivity inherent in the valuations.
The Group has adopted a structured process in selecting valuers and in considering and challenging the valuations derived. The valuers belong to generally-recognised professional bodies for valuers.
The valuation methodologies applied were consistent with generally accepted market practices and those used in prior years.
The key inputs and assumptions were comparable to those used by other valuers of similar investment properties. In respect of investment properties under development, the estimated development costs was found to be supported.
We also found that the disclosures in the financial statements are proportionate to the inherent degree of subjectivity and estimation involved.
Other information
The Manager of the Trust (the “Manager”) is responsible for the other information. The other information comprises the information included in the annual report, but does not include the financial statements and our auditors’ report thereon.
Our opinion on the financial statements does not cover the other information and we do not express any form of assurance conclusion thereon.
In connection with our audit of the financial statements, our responsibility is to read the other information and, in doing so, consider whether the other information is materially inconsistent with the financial statements or our knowledge obtained in the audit or otherwise appears to be materially misstated. If, based on the work we have performed, we conclude that there is a material misstatement of this other information, we are required to report that fact. We have nothing to report in this regard.
Responsibilities of the Manager for the financial statements
The Manager is responsible for the preparation and fair presentation of these financial statements in accordance with the recommendations of RAP 7 issued by the Institute of Singapore Chartered Accountants, and for such internal control the Manager determines is necessary to enable the preparation of financial statements that are free from material misstatement, whether due to fraud or error.
In preparing the financial statements, the Manager is responsible for assessing the Group’s ability to continue as a going concern, disclosing, as applicable, matters related to going concern and using the going concern basis of accounting unless the Manager either intends to liquidate the Group or to cease operations, or has no realistic alternative but to do so.
The responsibilities of the Manager include overseeing the Group’s financial reporting process.

138CapitaLand Mall Trust
Annual Report 2016
Independent Auditors’ ReportUnitholders of CapitaLand Mall Trust(Established in the Republic of Singapore pursuant to a Trust Deed dated 29 October 2001 (as amended))
Auditors’ responsibilities for the audit of the financial statements
Our objectives are to obtain reasonable assurance about whether the financial statements as a whole are free from material misstatement, whether due to fraud or error, and to issue an auditors’ report that includes our opinion. Reasonable assurance is a high level of assurance, but is not a guarantee that an audit conducted in accordance with SSAs will always detect a material misstatement when it exists. Misstatements can arise from fraud or error and are considered material if, individually or in the aggregate, they could reasonably be expected to influence the economic decisions of users taken on the basis of these financial statements.
As part of an audit in accordance with SSAs, we exercise professional judgement and maintain professional scepticism throughout the audit. We also:
• Identify and assess the risks of material misstatement of the financial statements, whether due to fraud or error, design and perform audit procedures responsive to those risks, and obtain audit evidence that is sufficient and appropriate to provide a basis for our opinion. The risk of not detecting a material misstatement resulting from fraud is higher than for one resulting from error, as fraud may involve collusion, forgery, intentional omissions, misrepresentations, or the override of internal controls.
• Obtain an understanding of internal controls relevant to the audit in order to design audit procedures that are appropriate in the circumstances, but not for the purpose of expressing an opinion on the effectiveness of the Group’s internal controls.
• Evaluate the appropriateness of accounting policies used and the reasonableness of accounting estimates and related disclosures made by the Manager.
• Conclude on the appropriateness of the use of the going concern basis of accounting by the Manager and, based on the audit evidence obtained, whether a material uncertainty exists related to events or conditions that may cast significant doubt on the Group’s ability to continue as a going concern. If we conclude that a material uncertainty exists, we are required to draw attention in our auditors’ report to the related disclosures in the financial statements or, if such disclosures are inadequate, to modify our opinion. Our conclusions are based on the audit evidence obtained up to the date of our auditors’ report. However, future events or conditions may cause the Group to cease to continue as a going concern.
• Evaluate the overall presentation, structure and content of the financial statements, including the disclosures, and whether the financial statements represent the underlying transactions and events in a manner that achieves fair presentation.
• Obtain sufficient appropriate audit evidence regarding the financial information of the entities or business activities within the Group to express an opinion on the consolidated financial statements. We are responsible for the direction, supervision and performance of the group audit. We remain solely responsible for our audit opinion.
We communicate with the Manager regarding, among other matters, the planned scope and timing of the audit and significant audit findings, including any significant deficiencies in internal controls that we identify during our audit.
We also provide the Manager with a statement that we have complied with relevant ethical requirements regarding independence, and to communicate with them all relationships and other matters that may reasonably be thought to bear on our independence, and where applicable, related safeguards.
From the matters communicated with the Manager, we determine those matters that were of most significance in the audit of the financial statements of the current period and are therefore the key audit matters. We describe these matters in our auditors’ report unless the law or regulations preclude public disclosure about the matter or when, in extremely rare circumstances, we determine that a matter should not be communicated in our report because the adverse consequences of doing so would reasonably be expected to outweigh the public interest benefits of such communication.
The engagement partner on the audit resulting in this independent auditors’ report is Leong Kok Keong.
KPMG LLPPublic Accountants andChartered Accountants
Singapore17 February 2017
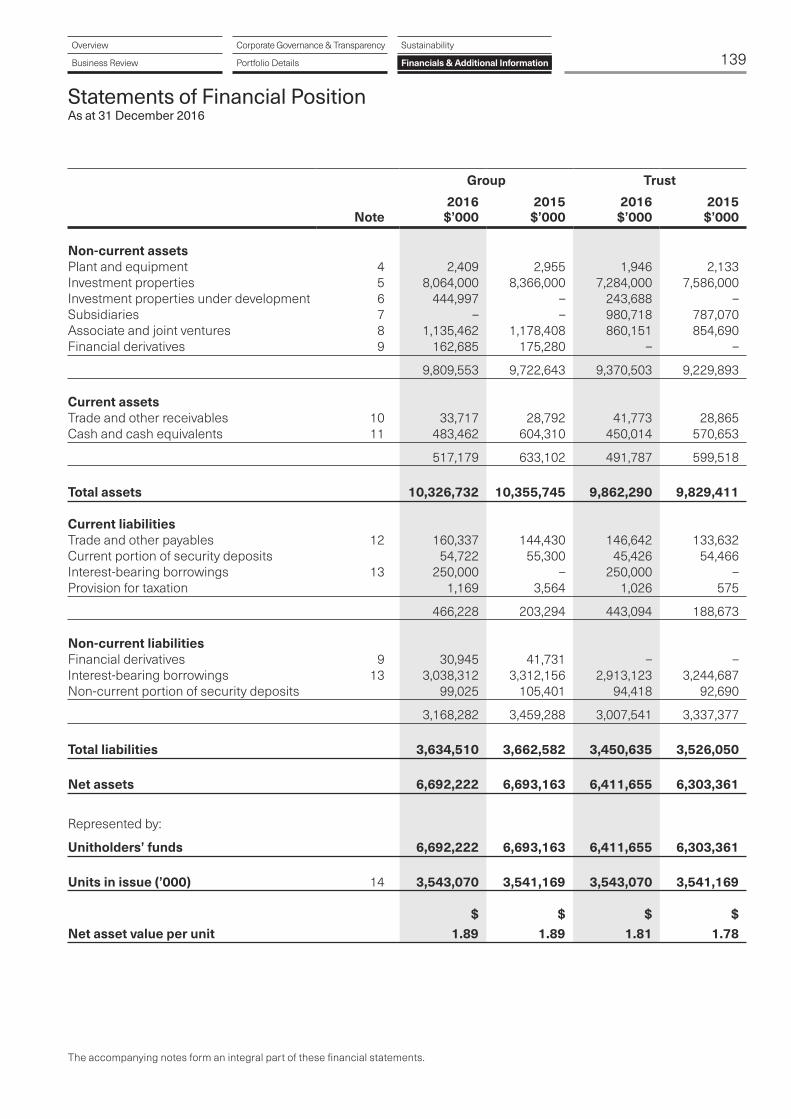
139Overview
Business Review
Corporate Governance & Transparency
Portfolio Details
Sustainability
Financials & Additional Information
Statements of Financial PositionAs at 31 December 2016
Group Trust
Note2016
$’0002015
$’0002016
$’0002015
$’000
Non-current assets Plant and equipment 4 2,409 2,955 1,946 2,133Investment properties 5 8,064,000 8,366,000 7,284,000 7,586,000Investment properties under development 6 444,997 – 243,688 –Subsidiaries 7 – – 980,718 787,070Associate and joint ventures 8 1,135,462 1,178,408 860,151 854,690Financial derivatives 9 162,685 175,280 – –
9,809,553 9,722,643 9,370,503 9,229,893 Current assets Trade and other receivables 10 33,717 28,792 41,773 28,865Cash and cash equivalents 11 483,462 604,310 450,014 570,653
517,179 633,102 491,787 599,518
Total assets 10,326,732 10,355,745 9,862,290 9,829,411 Current liabilities Trade and other payables 12 160,337 144,430 146,642 133,632Current portion of security deposits 54,722 55,300 45,426 54,466Interest-bearing borrowings 13 250,000 – 250,000 –Provision for taxation 1,169 3,564 1,026 575
466,228 203,294 443,094 188,673
Non-current liabilities Financial derivatives 9 30,945 41,731 – –Interest-bearing borrowings 13 3,038,312 3,312,156 2,913,123 3,244,687Non-current portion of security deposits 99,025 105,401 94,418 92,690
3,168,282 3,459,288 3,007,541 3,337,377
Total liabilities 3,634,510 3,662,582 3,450,635 3,526,050
Net assets 6,692,222 6,693,163 6,411,655 6,303,361
Represented by:
Unitholders’ funds 6,692,222 6,693,163 6,411,655 6,303,361
Units in issue (’000) 14 3,543,070 3,541,169 3,543,070 3,541,169 $ $ $ $Net asset value per unit 1.89 1.89 1.81 1.78
The accompanying notes form an integral part of these financial statements.

140CapitaLand Mall Trust
Annual Report 2016
Statements of Total ReturnYear ended 31 December 2016
The accompanying notes form an integral part of these financial statements.
Group Trust
Note2016
$’0002015
$’0002016
$’0002015
$’000
Gross revenue 15 689,732 669,002 631,609 654,746Property operating expenses 16 (210,053) (202,838) (193,875) (198,872)
Net property income 479,679 466,164 437,734 455,874 Interest income 17 11,331 12,270 27,211 16,137Investment income 18 – – 115,784 75,613Asset management fees 19 (44,619) (42,178) (40,671) (41,256)Professional fees (828) (595) (644) (574)Valuation fees (864) (879) (809) (869)Trustee’s fees (1,300) (1,204) (1,253) (1,203)Audit fees (383) (328) (318) (318)Finance costs 20 (106,318) (103,822) (106,318) (103,822)Other expenses (992) (636) (782) (649)
Net income before share of results of associate and joint ventures 335,706 328,792 429,934 398,933Share of results (net of tax) of: - Associate 14,504 17,653 – –- Joint ventures 52,347 54,165 – –
Net income 402,557 400,610 429,934 398,933 Net change in fair value of investment properties 68,503 106,975 68,469 115,209Gain on disposal of investment property 21 – 72,741 – 72,741Impairment loss written back/(loss) on subsidiary and joint venture – – 1,268 (11,333)Dilution (loss)/gain on interest in associate (634) 54 – –
Total return for the year before tax 470,426 580,380 499,671 575,550Income tax expense 22 (1,026) (575) (1,026) (575)
Total return for the year 469,400 579,805 498,645 574,975 Earnings per unit (cents) Basic and diluted 23 13.25 16.65 14.08 16.51

141Overview
Business Review
Corporate Governance & Transparency
Portfolio Details
Sustainability
Financials & Additional Information
Distribution StatementsYear ended 31 December 2016
The accompanying notes form an integral part of these financial statements.
Group Trust
2016
$’0002015
$’0002016
$’0002015
$’000
Amount available for distribution to Unitholders at beginning of year 108,305 105,228 108,305 105,228Net income before share of results of associate and joint ventures 335,706 328,792 429,934 398,933Net tax adjustments (Note A) (5,418) 2,091 (5,992) 4,420Distribution income from: - Associate 12,945 12,516 – –- Joint ventures 79,632 59,956 – –Rollover adjustment 426 1,164 426 1,164Net loss/(profit) from subsidiaries 1,077 (2) – –
424,368 404,517 424,368 404,517
Amount available for distribution to Unitholders 532,673 509,745 532,673 509,745
Distributions to Unitholders during the year: Distribution of 2.86 cents per unit for period from 01/10/2014 to 31/12/2014 – (99,018) – (99,018)Distribution of 2.68 cents per unit for period from 01/01/2015 to 31/03/2015 – (92,806) – (92,806)Distribution of 2.71 cents per unit for period from 01/04/2015 to 30/06/2015 – (93,864) – (93,864)Distribution of 2.98 cents per unit for period from 01/07/2015 to 30/09/2015 – (103,236) – (103,236)Distribution of 2.88 cents per unit for period from 01/10/2015 to 31/12/2015 (101,985) – (101,985) –Distribution of 2.73 cents per unit for period from 01/01/2016 to 31/03/2016 (96,695) – (96,695) –Distribution of 2.74 cents per unit for period from 01/04/2016 to 30/06/2016 (97,059) – (97,059) –Distribution of 2.78 cents per unit for period from 01/07/2016 to 30/09/2016 (98,487) – (98,487) –
(394,226) (388,924) (394,226) (388,924)Amount retained for general corporate and working capital purposes (Note B) (30,045) (12,516) (30,045) (12,516)
Amount available for distribution to Unitholders at end of the year 108,402 108,305 108,402 108,305
Distribution per unit (cents) * 11.13 11.25 11.13 11.25
* The Distribution per unit relates to the distributions in respect of the relevant financial year. The distribution relating to the last quarter of 2016 will be paid after 31 December 2016.

142CapitaLand Mall Trust
Annual Report 2016
Distribution StatementsYear ended 31 December 2016
Note A – Net tax adjustments comprise:
Group Trust
2016
$’0002015
$’0002016
$’0002015
$’000
Non-tax deductible items: - trustee’s fees 1,255 1,204 1,253 1,203- non-deductible interest expenses 2,461 7,315 2,456 7,315- other items 4,829 3,087 4,262 3,337Tax deductible items: - capital allowances/balancing allowances (13,963) (9,515) (13,963) (7,435)
Net tax adjustments (5,418) 2,091 (5,992) 4,420
Note B
Amount retained for general corporate and working capital in financial year 2016 relates to the capital distribution and tax-exempt income received from CapitaLand Retail China Trust (“CRCT”) of $12.9 million and capital distribution received from Infinity Office Trust (“IOT”) of $17.1 million.
For financial year 2015, amount retained relates to the capital distribution and tax-exempt income received from CRCT of $12.5 million.
The accompanying notes form an integral part of these financial statements.

143Overview
Business Review
Corporate Governance & Transparency
Portfolio Details
Sustainability
Financials & Additional Information
Statements of Movements in Unitholders’ FundsYear ended 31 December 2016
Group Trust
2016
$’0002015
$’0002016
$’0002015
$’000
Net assets at beginning of the year 6,693,163 6,282,439 6,303,361 5,966,654 Operations Total return for the year 469,400 579,805 498,645 574,975 Hedging reserves Effective portion of changes in fair value of cashflow hedges (62,939) 49,187 – – Movement in foreign currency translation reserves (17,726) 19,295 – – Movement in general reserves 675 705 – – Unitholders’ transactions Creation of units - Units issued in respect of RCS Trust’s asset management fees 3,875 5,898 3,875 5,898- Units issued in respect of the acquisition of Brilliance Mall Trust: - Consideration units – 136,958 – 136,958 - Acquisition fees – 7,800 – 7,800Distributions to Unitholders (394,226) (388,924) (394,226) (388,924) Net decrease in net assets resulting from Unitholders’ transactions (390,351) (238,268) (390,351) (238,268)
Net assets at end of the year 6,692,222 6,693,163 6,411,655 6,303,361
The accompanying notes form an integral part of these financial statements.

144CapitaLand Mall Trust
Annual Report 2016
Group
Description of Property Tenure of
LandTerm of
Lease
RemainingTerm of
Lease Location Existing Use
Occupancy Rates as at 31 December Carrying Value
Percentage of Total Net Assets
2016%
2015%
2016$’000
2015$’000
2016%
2015%
Investment properties in Singapore
Tampines Mall Leasehold 99 years 75 years 4 Tampines Central 5, Singapore Commercial 99.2 100.0 994,000 983,000 14.8 14.7
Junction 8 Leasehold 99 years 74 years 9 Bishan Place, Singapore Commercial 99.9 100.0 703,000 696,000 10.5 10.4
Funan (formerly known as Funan DigitaLife Mall)1
Leasehold 99 years 62 years 109 North Bridge Road, Singapore Commercial NA 95.3 444,9971 367,000 6.6 5.5
IMM Building Leasehold 60 years 32 years 2 Jurong East Street 21, Singapore Commercial Warehouse
97.9 91.8
96.2 91.7
624,000 622,000 9.3 9.3
Plaza Singapura Freehold – – 68 Orchard Road, Singapore Commercial 100.0 99.7 1,257,000 1,244,000 18.8 18.6
Bugis Junction Leasehold 99 years 73 years 200 Victoria Street, Singapore Commercial 99.9 99.7 1,014,000 995,000 15.2 14.9
Sembawang Shopping Centre Leasehold 999 years 867 years 604 Sembawang Road, Singapore Commercial 100.0 99.4 118,000 114,000 1.8 1.7
JCube Leasehold 99 years 73 years 2 Jurong East Central 1, Singapore Commercial 92.0 88.0 288,000 288,000 4.3 4.3
Lot One Shoppers’ Mall Leasehold 99 years 76 years 21 Choa Chu Kang Avenue 4, Singapore
Commercial 99.9 99.8 512,000 510,000 7.7 7.6
Bukit Panjang Plaza Leasehold 99 years 77 years 1 Jelebu Road, Singapore Commercial 99.9 97.8 310,000 303,000 4.6 4.5
The Atrium@Orchard Leasehold 99 years 91 years 60A & 60B Orchard Road, Singapore Commercial 97.6 98.2 735,000 735,000 11.0 11.0
Clarke Quay Leasehold 99 years 72 years 3A/B/C/D/E River Valley Road, Singapore
Commercial 90.7 88.2 389,000 389,000 5.8 5.8
Bugis+ Leasehold 60 years 49 years 201 Victoria Street, Singapore Commercial 100.0 99.2 340,000 340,000 5.1 5.1
Bedok Mall2 Leasehold 99 years 94 years 311 New Upper Changi Road, Singapore
Commercial 100.0 99.9 780,000 780,000 11.6 11.7
Investment properties and investment properties under development, at valuation 8,508,997 8,366,000 127.1 125.1Investments in associate and joint ventures (Note 8) 1,135,462 1,178,408 17.0 17.6
9,644,459 9,544,408 144.1 142.7Other assets and liabilities (net) (2,952,237) (2,851,245) (44.1) (42.7)
Net assets 6,692,222 6,693,163 100.0 100.0
Portfolio StatementsAs at 31 December 2016
The accompanying notes form an integral part of these financial statements.

145Overview
Business Review
Corporate Governance & Transparency
Portfolio Details
Sustainability
Financials & Additional Information
Group
Description of Property Tenure of
LandTerm of
Lease
RemainingTerm of
Lease Location Existing Use
Occupancy Rates as at 31 December Carrying Value
Percentage of Total Net Assets
2016%
2015%
2016$’000
2015$’000
2016%
2015%
Investment properties in Singapore
Tampines Mall Leasehold 99 years 75 years 4 Tampines Central 5, Singapore Commercial 99.2 100.0 994,000 983,000 14.8 14.7
Junction 8 Leasehold 99 years 74 years 9 Bishan Place, Singapore Commercial 99.9 100.0 703,000 696,000 10.5 10.4
Funan (formerly known as Funan DigitaLife Mall)1
Leasehold 99 years 62 years 109 North Bridge Road, Singapore Commercial NA 95.3 444,9971 367,000 6.6 5.5
IMM Building Leasehold 60 years 32 years 2 Jurong East Street 21, Singapore Commercial Warehouse
97.9 91.8
96.2 91.7
624,000 622,000 9.3 9.3
Plaza Singapura Freehold – – 68 Orchard Road, Singapore Commercial 100.0 99.7 1,257,000 1,244,000 18.8 18.6
Bugis Junction Leasehold 99 years 73 years 200 Victoria Street, Singapore Commercial 99.9 99.7 1,014,000 995,000 15.2 14.9
Sembawang Shopping Centre Leasehold 999 years 867 years 604 Sembawang Road, Singapore Commercial 100.0 99.4 118,000 114,000 1.8 1.7
JCube Leasehold 99 years 73 years 2 Jurong East Central 1, Singapore Commercial 92.0 88.0 288,000 288,000 4.3 4.3
Lot One Shoppers’ Mall Leasehold 99 years 76 years 21 Choa Chu Kang Avenue 4, Singapore
Commercial 99.9 99.8 512,000 510,000 7.7 7.6
Bukit Panjang Plaza Leasehold 99 years 77 years 1 Jelebu Road, Singapore Commercial 99.9 97.8 310,000 303,000 4.6 4.5
The Atrium@Orchard Leasehold 99 years 91 years 60A & 60B Orchard Road, Singapore Commercial 97.6 98.2 735,000 735,000 11.0 11.0
Clarke Quay Leasehold 99 years 72 years 3A/B/C/D/E River Valley Road, Singapore
Commercial 90.7 88.2 389,000 389,000 5.8 5.8
Bugis+ Leasehold 60 years 49 years 201 Victoria Street, Singapore Commercial 100.0 99.2 340,000 340,000 5.1 5.1
Bedok Mall2 Leasehold 99 years 94 years 311 New Upper Changi Road, Singapore
Commercial 100.0 99.9 780,000 780,000 11.6 11.7
Investment properties and investment properties under development, at valuation 8,508,997 8,366,000 127.1 125.1Investments in associate and joint ventures (Note 8) 1,135,462 1,178,408 17.0 17.6
9,644,459 9,544,408 144.1 142.7Other assets and liabilities (net) (2,952,237) (2,851,245) (44.1) (42.7)
Net assets 6,692,222 6,693,163 100.0 100.0
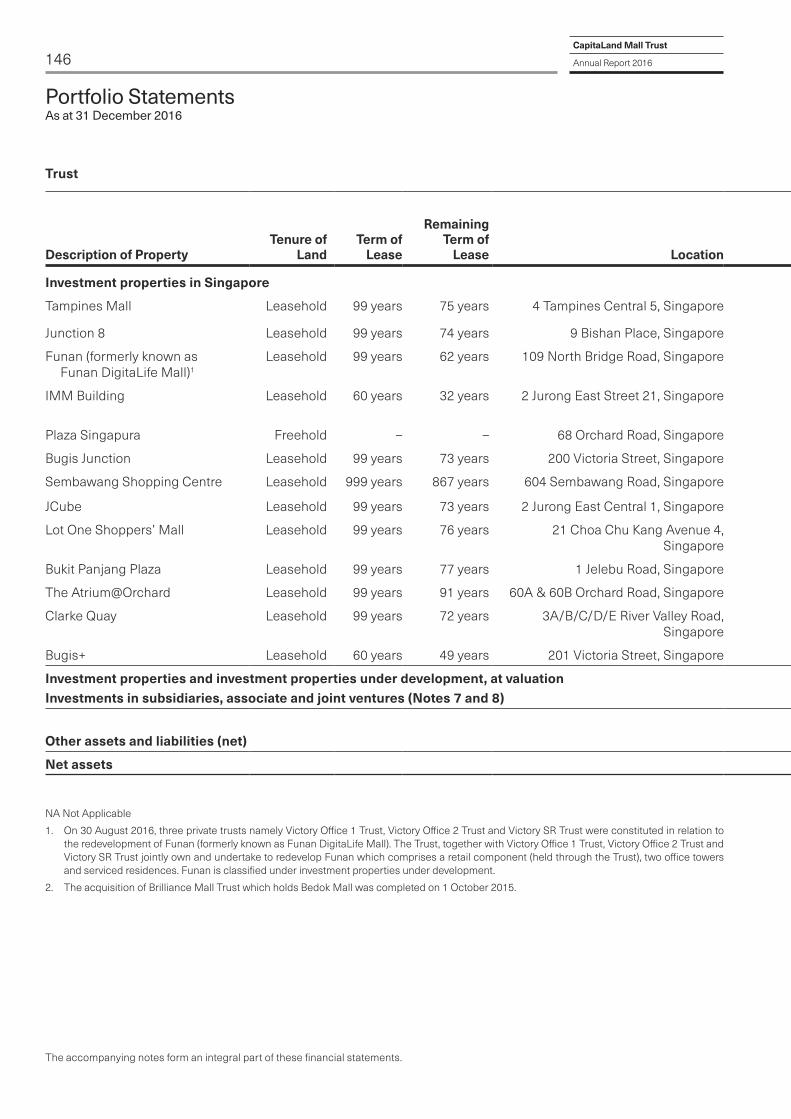
146CapitaLand Mall Trust
Annual Report 2016
Trust
Description of Property Tenure of
LandTerm of
Lease
RemainingTerm of
Lease Location Existing Use
Occupancy Rates as at 31 December Carrying Value
Percentage of Total Net Assets
2016%
2015%
2016$’000
2015$’000
2016%
2015%
Investment properties in Singapore
Tampines Mall Leasehold 99 years 75 years 4 Tampines Central 5, Singapore Commercial 99.2 100.0 994,000 983,000 15.5 15.6
Junction 8 Leasehold 99 years 74 years 9 Bishan Place, Singapore Commercial 99.9 100.0 703,000 696,000 11.0 11.0
Funan (formerly known as Funan DigitaLife Mall)1
Leasehold 99 years 62 years 109 North Bridge Road, Singapore Commercial NA 95.3 243,6881 367,000 3.8 5.8
IMM Building Leasehold 60 years 32 years 2 Jurong East Street 21, Singapore CommercialWarehouse
97.991.8
96.291.7
624,000 622,000 9.7 9.9
Plaza Singapura Freehold – – 68 Orchard Road, Singapore Commercial 100.0 99.7 1,257,000 1,244,000 19.6 19.7
Bugis Junction Leasehold 99 years 73 years 200 Victoria Street, Singapore Commercial 99.9 99.7 1,014,000 995,000 15.8 15.8
Sembawang Shopping Centre Leasehold 999 years 867 years 604 Sembawang Road, Singapore Commercial 100.0 99.4 118,000 114,000 1.9 1.8
JCube Leasehold 99 years 73 years 2 Jurong East Central 1, Singapore Commercial 92.0 88.0 288,000 288,000 4.5 4.6
Lot One Shoppers’ Mall Leasehold 99 years 76 years 21 Choa Chu Kang Avenue 4, Singapore
Commercial 99.9 99.8 512,000 510,000 8.0 8.1
Bukit Panjang Plaza Leasehold 99 years 77 years 1 Jelebu Road, Singapore Commercial 99.9 97.8 310,000 303,000 4.8 4.8
The Atrium@Orchard Leasehold 99 years 91 years 60A & 60B Orchard Road, Singapore Commercial 97.6 98.2 735,000 735,000 11.4 11.7
Clarke Quay Leasehold 99 years 72 years 3A/B/C/D/E River Valley Road, Singapore
Commercial 90.7 88.2 389,000 389,000 6.1 6.2
Bugis+ Leasehold 60 years 49 years 201 Victoria Street, Singapore Commercial 100.0 99.2 340,000 340,000 5.3 5.4
Investment properties and investment properties under development, at valuation 7,527,688 7,586,000 117.4 120.4Investments in subsidiaries, associate and joint ventures (Notes 7 and 8) 1,840,869 1,641,760 28.7 26.0
9,368,557 9,227,760 146.1 146.4Other assets and liabilities (net) (2,956,902) (2,924,399) (46.1) (46.4)
Net assets 6,411,655 6,303,361 100.0 100.0
NA Not Applicable
1. On 30 August 2016, three private trusts namely Victory Office 1 Trust, Victory Office 2 Trust and Victory SR Trust were constituted in relation to the redevelopment of Funan (formerly known as Funan DigitaLife Mall). The Trust, together with Victory Office 1 Trust, Victory Office 2 Trust and Victory SR Trust jointly own and undertake to redevelop Funan which comprises a retail component (held through the Trust), two office towers and serviced residences. Funan is classified under investment properties under development.
2. The acquisition of Brilliance Mall Trust which holds Bedok Mall was completed on 1 October 2015.
Portfolio StatementsAs at 31 December 2016
The accompanying notes form an integral part of these financial statements.

147Overview
Business Review
Corporate Governance & Transparency
Portfolio Details
Sustainability
Financials & Additional Information
Trust
Description of Property Tenure of
LandTerm of
Lease
RemainingTerm of
Lease Location Existing Use
Occupancy Rates as at 31 December Carrying Value
Percentage of Total Net Assets
2016%
2015%
2016$’000
2015$’000
2016%
2015%
Investment properties in Singapore
Tampines Mall Leasehold 99 years 75 years 4 Tampines Central 5, Singapore Commercial 99.2 100.0 994,000 983,000 15.5 15.6
Junction 8 Leasehold 99 years 74 years 9 Bishan Place, Singapore Commercial 99.9 100.0 703,000 696,000 11.0 11.0
Funan (formerly known as Funan DigitaLife Mall)1
Leasehold 99 years 62 years 109 North Bridge Road, Singapore Commercial NA 95.3 243,6881 367,000 3.8 5.8
IMM Building Leasehold 60 years 32 years 2 Jurong East Street 21, Singapore CommercialWarehouse
97.991.8
96.291.7
624,000 622,000 9.7 9.9
Plaza Singapura Freehold – – 68 Orchard Road, Singapore Commercial 100.0 99.7 1,257,000 1,244,000 19.6 19.7
Bugis Junction Leasehold 99 years 73 years 200 Victoria Street, Singapore Commercial 99.9 99.7 1,014,000 995,000 15.8 15.8
Sembawang Shopping Centre Leasehold 999 years 867 years 604 Sembawang Road, Singapore Commercial 100.0 99.4 118,000 114,000 1.9 1.8
JCube Leasehold 99 years 73 years 2 Jurong East Central 1, Singapore Commercial 92.0 88.0 288,000 288,000 4.5 4.6
Lot One Shoppers’ Mall Leasehold 99 years 76 years 21 Choa Chu Kang Avenue 4, Singapore
Commercial 99.9 99.8 512,000 510,000 8.0 8.1
Bukit Panjang Plaza Leasehold 99 years 77 years 1 Jelebu Road, Singapore Commercial 99.9 97.8 310,000 303,000 4.8 4.8
The Atrium@Orchard Leasehold 99 years 91 years 60A & 60B Orchard Road, Singapore Commercial 97.6 98.2 735,000 735,000 11.4 11.7
Clarke Quay Leasehold 99 years 72 years 3A/B/C/D/E River Valley Road, Singapore
Commercial 90.7 88.2 389,000 389,000 6.1 6.2
Bugis+ Leasehold 60 years 49 years 201 Victoria Street, Singapore Commercial 100.0 99.2 340,000 340,000 5.3 5.4
Investment properties and investment properties under development, at valuation 7,527,688 7,586,000 117.4 120.4Investments in subsidiaries, associate and joint ventures (Notes 7 and 8) 1,840,869 1,641,760 28.7 26.0
9,368,557 9,227,760 146.1 146.4Other assets and liabilities (net) (2,956,902) (2,924,399) (46.1) (46.4)
Net assets 6,411,655 6,303,361 100.0 100.0

148CapitaLand Mall Trust
Annual Report 2016
Portfolio StatementsAs at 31 December 2016
On 31 December 2016, independent valuations of Tampines Mall, Junction 8, IMM Building, Bugis Junction and Bugis+ were undertaken by CBRE Pte. Ltd. (“CBRE”), independent valuations of Funan (formerly known as Funan DigitaLife Mall), Plaza Singapura, Sembawang Shopping Centre, The Atrium@Orchard, Bukit Panjang Plaza and Lot One Shoppers’ Mall were undertaken by Knight Frank Pte Ltd (“Knight Frank”), while the independent valuations of JCube, Clarke Quay and Bedok Mall were undertaken by Savills Valuation & Professional Services (S) Pte Ltd.
On 31 December 2015, independent valuations of Junction 8, Funan, Plaza Singapura, Bugis Junction, Sembawang Shopping Centre, The Atrium@Orchard, Clarke Quay and Bugis+ were undertaken by CBRE, independent valuations of Tampines Mall, IMM Building, JCube, Lot One Shoppers’ Mall and Bukit Panjang Plaza were undertaken by Knight Frank, while the independent valuation of Bedok Mall was undertaken by DTZ Debenham Tie Leung (SEA) Pte Ltd. The valuations were based on discounted cash flow, capitalisation and residual land value approaches. The Manager believes that the independent valuers have appropriate professional qualifications and experience in the location and category of the properties being valued. The net change in fair value of the properties has been recognised in the Statement of Total Return.
Investment properties comprise commercial properties that are leased to external customers. Generally, the leases contain an initial non-cancellable period of three years. Subsequent renewals are negotiated with the lessees. Contingent rents recognised in the Statement of Total Return of the Group and the Trust is $31,140,000 (2015: $31,045,000) and $29,405,000 (2015: $30,898,000) respectively.
The accompanying notes form an integral part of these financial statements.

149Overview
Business Review
Corporate Governance & Transparency
Portfolio Details
Sustainability
Financials & Additional Information
Statements of Cash FlowsYear ended 31 December 2016
Group Trust
2016
$’0002015
$’0002016
$’0002015
$’000
Cash flows from operating activities Net income 402,557 400,610 429,934 398,933Adjustments for: Interest income (11,331) (12,270) (27,211) (16,137)Investment income – – (115,784) (75,613)Finance costs 106,318 103,822 106,318 103,822Assets written off 26 19 25 19Gain on disposal of plant and equipment (3) (2) (3) (2)Depreciation and amortisation 1,114 1,052 772 962Receivables written off 17 44 17 44Share of results of: - Associate (14,504) (17,653) – –- Joint ventures (52,347) (54,165) – –
Operating income before working capital changes 431,847 421,457 394,068 412,028Changes in working capital: Trade and other receivables (4,955) (1,815) (10,703) (406)Trade and other payables 16,341 2,232 14,296 2,169Security deposits (6,954) 533 (7,312) 867Income tax paid (3,421) (37) (575) (37)
Cash flows from operating activities 432,858 422,370 389,774 414,621
Cash flows from investing activities Interest received 6,802 8,756 6,554 8,726Interest received from a subsidiary – – 16,123 –Interest received from a joint venture 4,961 4,608 4,961 4,608Distributions received from: - Subsidiary – – 21,165 –- Associate 12,945 12,516 12,945 12,516- Joint ventures 79,136 58,301 79,136 58,301Net cash outflow on acquisition of subsidiary (including acquisition charges) (Note A) – (621,424) – (648,136)Capital expenditure on investment properties (57,370) (94,974) (56,024) (94,389)Capital expenditure on investment properties under development (18,640) – (7,560) –Purchase of plant and equipment (521) (713) (538) (713)Proceeds from disposal of plant and equipment 10 2 10 2Proceeds from disposal of investment property – 186,636 – 186,636Loan to a joint venture – (17,591) – (17,591)Loan to subsidiaries – – (5,934) –Investment in subsidiaries – – (222) –
Cash flows from/(used in) investing activities 27,323 (463,883) 70,616 (490,040)
The accompanying notes form an integral part of these financial statements.

150CapitaLand Mall Trust
Annual Report 2016
Group Trust
2016
$’0002015
$’0002016
$’0002015
$’000
Cash flows from financing activities Payment of issue and financing expenses (3,614) (2,096) (3,614) (2,096)Proceeds from interest-bearing borrowings 349,008 999,798 349,008 999,798Repayment of interest-bearing borrowings (431,008) (987,500) (431,008) (987,500)Distributions to Unitholders (394,226) (388,924) (394,226) (388,924)Interest paid (101,189) (105,007) (101,189) (104,664)
Cash flows used in financing activities (581,029) (483,729) (581,029) (483,386) Net decrease in cash and cash equivalents (120,848) (525,242) (120,639) (558,805)Cash and cash equivalents at beginning of the year 604,310 1,129,552 570,653 1,129,458
Cash and cash equivalents at end of the year (Note 11) 483,462 604,310 450,014 570,653
Statements of Cash FlowsYear ended 31 December 2016
The accompanying notes form an integral part of these financial statements.
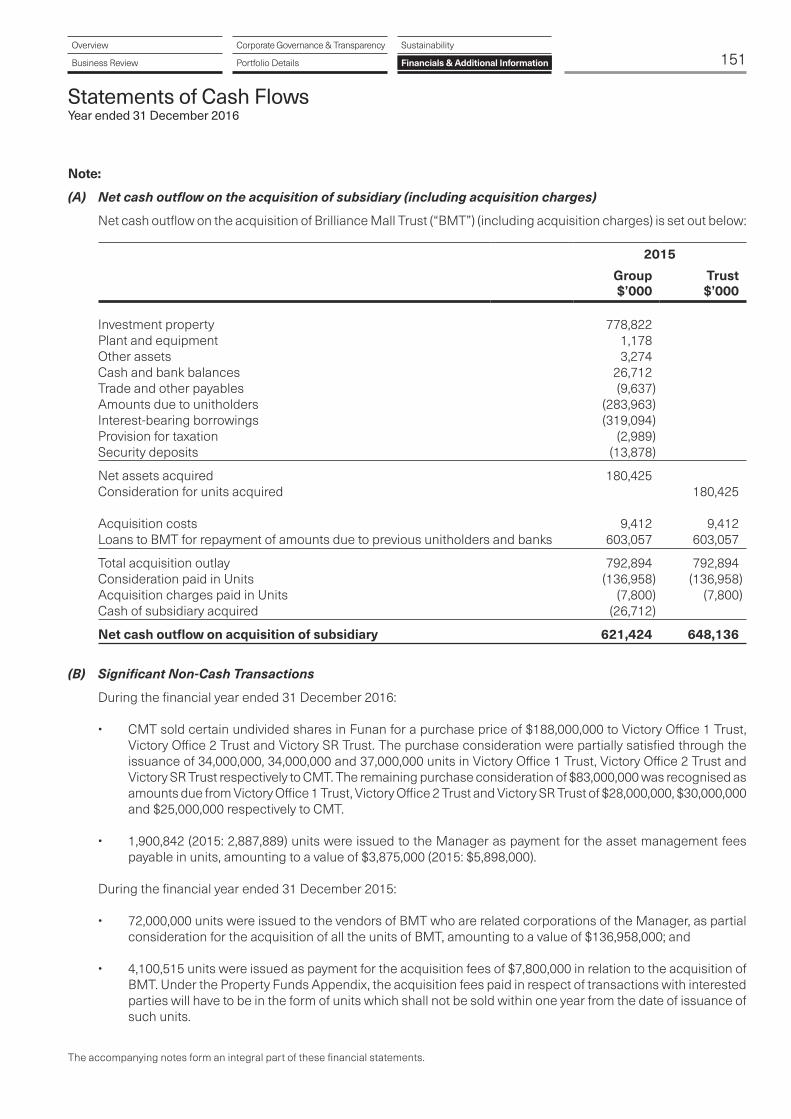
151Overview
Business Review
Corporate Governance & Transparency
Portfolio Details
Sustainability
Financials & Additional Information
Statements of Cash FlowsYear ended 31 December 2016
The accompanying notes form an integral part of these financial statements.
Note:
(A) Netcashoutflowontheacquisitionofsubsidiary(includingacquisitioncharges)
Net cash outflow on the acquisition of Brilliance Mall Trust (“BMT”) (including acquisition charges) is set out below:
2015
Group$’000
Trust$’000
Investment property 778,822 Plant and equipment 1,178 Other assets 3,274 Cash and bank balances 26,712 Trade and other payables (9,637) Amounts due to unitholders (283,963) Interest-bearing borrowings (319,094) Provision for taxation (2,989) Security deposits (13,878)
Net assets acquired 180,425 Consideration for units acquired 180,425 Acquisition costs 9,412 9,412Loans to BMT for repayment of amounts due to previous unitholders and banks 603,057 603,057
Total acquisition outlay 792,894 792,894Consideration paid in Units (136,958) (136,958)Acquisition charges paid in Units (7,800) (7,800)Cash of subsidiary acquired (26,712)
Net cash outflow on acquisition of subsidiary 621,424 648,136
(B) SignificantNon-CashTransactions
During the financial year ended 31 December 2016:
• CMT sold certain undivided shares in Funan for a purchase price of $188,000,000 to Victory Office 1 Trust, Victory Office 2 Trust and Victory SR Trust. The purchase consideration were partially satisfied through the issuance of 34,000,000, 34,000,000 and 37,000,000 units in Victory Office 1 Trust, Victory Office 2 Trust and Victory SR Trust respectively to CMT. The remaining purchase consideration of $83,000,000 was recognised as amounts due from Victory Office 1 Trust, Victory Office 2 Trust and Victory SR Trust of $28,000,000, $30,000,000 and $25,000,000 respectively to CMT.
• 1,900,842 (2015: 2,887,889) units were issued to the Manager as payment for the asset management fees
payable in units, amounting to a value of $3,875,000 (2015: $5,898,000).
During the financial year ended 31 December 2015:
• 72,000,000 units were issued to the vendors of BMT who are related corporations of the Manager, as partial consideration for the acquisition of all the units of BMT, amounting to a value of $136,958,000; and
• 4,100,515 units were issued as payment for the acquisition fees of $7,800,000 in relation to the acquisition of BMT. Under the Property Funds Appendix, the acquisition fees paid in respect of transactions with interested parties will have to be in the form of units which shall not be sold within one year from the date of issuance of such units.

152CapitaLand Mall Trust
Annual Report 2016
Notes to the Financial StatementsYear ended 31 December 2016
These notes form an integral part of the financial statements.
The financial statements were authorised for issue by the Manager and the Trustee on 17 February 2017.
1 General
CapitaLand Mall Trust (the “Trust”) is a Singapore-domiciled unit trust constituted pursuant to the trust deed dated 29 October 2001 (as amended) (the “Trust Deed”) between CapitaLand Mall Trust Management Limited (the “Manager”) and HSBC Institutional Trust Services (Singapore) Limited (the “Trustee”). The Trust Deed is governed by the laws of the Republic of Singapore. The Trustee is under a duty to take into custody and hold the assets of the Trust in trust for the holders (“Unitholders”) of units in the Trust (the “Units”).
The Trust was formally admitted to the Official List of the Singapore Exchange Securities Trading Limited (“SGX-ST”) on 17 July 2002 (“Listing Date”) and was included under the Central Provident Fund (“CPF”) Investment Scheme on 13 September 2002. The principal activity of the Trust is to invest in income producing real estate, which is used or substantially used for retail purposes with the primary objective of achieving an attractive level of return from rental income and for long-term capital growth. The principal activities of the subsidiaries, associate and joint ventures are set out in Notes 7 and 8.
The consolidated financial statements relate to the Trust and its subsidiaries (the “Group”) and the Group’s interest in its associate and joint ventures.
The Trust has entered into several service agreements in relation to management of the Trust and its property operations. The fee structures of these services are as follows:
1.1 Property management fees
Under the property management agreement with CapitaLand Retail Management Pte Ltd (the “Property Manager”), property management fees are charged as follows:
(a) 2.00% per annum of the gross revenue of the properties;
(b) 2.00% per annum of the net property income of the properties; and
(c) 0.50% per annum of the net property income of the properties, in lieu of leasing commissions.
The property management fees are payable monthly in arrears.
153Overview
Business Review
Corporate Governance & Transparency
Portfolio Details
Sustainability
Financials & Additional Information
1 General (continued)
1.2 Asset management fees
Pursuant to the Trust Deed, the asset management fees shall not exceed 0.70% per annum of the Deposited Property or such higher percentage as may be fixed by an Extraordinary Resolution at a meeting of Unitholders. Deposited Property refers to all the assets of the Trust, including all its Authorised Investments (as defined in the Trust Deed) for the time being held or deemed to be held upon the trusts of the Trust Deed.
The asset management fees comprise:
(a) in respect of Authorised Investments which are in the form of real estate, a base component of 0.25% per annum of Deposited Property and a performance component of 4.25% per annum of net property income of the Trust for each financial year; and
(b) in respect of all other Authorised Investments which are not in the form of real estate, 0.5% per annum of the investment value of the Authorised Investment, unless such Authorised Investment is an interest in a property fund (either a real estate investment trust or private property fund) wholly managed by a wholly-owned subsidiary of CapitaLand Limited, in which case no asset management fee shall be payable in relation to such Authorised Investment.
In respect of all Authorised Investments which are in the form of real estate acquired by the Trust:
(a) the base component shall be paid to the Manager in the form of cash and/or Units (as the Manager may elect); and
(b) the performance component shall be paid to the Manager in the form of cash, in the form of Units or a combination of both (as the Manager may elect).
When paid in the form of Units, the Manager shall be entitled to receive such number of Units as may be purchased for the relevant amount of the asset management fee at the market price (as defined in the Trust Deed). The base and performance components of the asset management fees are payable quarterly and yearly in arrears respectively.
For all acquisitions or disposals of properties or investments, the Manager is entitled to receive acquisition fee of 1.0% of the purchase price and a divestment fee of 0.5% of the sale price.
1.3 Trustee’s fees
Pursuant to the Trust Deed, the Trustee’s fees shall not exceed 0.10% per annum of the Deposited Property (subject to a minimum sum of $15,000 per month) payable out of the Deposited Property of the Trust. The Trustee is also entitled to reimbursement of expenses incurred in the performance of its duties under the Trust Deed.
The Trustee’s fees are payable quarterly in arrears.

154CapitaLand Mall Trust
Annual Report 2016
2 Basis of preparation
2.1 Statement of compliance
The financial statements have been prepared in accordance with the Statement of Recommended Accounting Practice 7 “Reporting Framework for Unit Trusts” (“RAP 7”) issued by the Institute of Singapore Chartered Accountants (“ISCA”), the applicable requirements of the Code on Collective Investment Schemes (“CIS Code”) issued by the Monetary Authority of Singapore (“MAS”) and the provisions of the Trust Deed. RAP 7 requires that accounting policies adopted generally comply with the principles relating to recognition and measurement of the Singapore Financial Reporting Standards (“SFRS”).
2.2 Basis of measurement
The financial statements have been prepared on the historical cost basis, except for investment properties, derivative financial instruments and certain financial assets and financial liabilities which are measured at fair value.
2.3 Functional and presentation currency
The financial statements are presented in Singapore dollars, which is the Group’s functional currency. All financial information presented in Singapore dollars has been rounded to the nearest thousand, unless otherwise stated.
2.4 Use of estimates and judgements
The preparation of financial statements in conformity with RAP 7 requires management to make judgements, estimates and assumptions that affect the application of accounting policies and reported amounts of assets, liabilities, income and expenses. Actual results may differ from these estimates.
Estimates and underlying assumptions are reviewed on an ongoing basis. Revisions to accounting estimates are recognised in the period in which the estimates are revised and in any future periods affected.
Information about critical judgement in applying accounting policies that have the most significant effect on the amount recognised in the financial statements is described in the following notes:
• Note 5 & 6 – Classification of investment properties and investment properties under development • Note 8 – Classification of associate and joint ventures.
Information about assumptions and estimation uncertainty that have a significant risk of resulting in a material adjustment within the next financial year are included in following notes:
• Note 5 & 6 – Valuation of investment properties and investment properties under development • Note 26 – Valuation of financial instruments.
Notes to the Financial StatementsYear ended 31 December 2016

155Overview
Business Review
Corporate Governance & Transparency
Portfolio Details
Sustainability
Financials & Additional Information
2 Basis of preparation (continued)
2.4 Use of estimates and judgements (continued)
Measurementoffairvalues
A number of the Group’s accounting policies and disclosures require the measurement of fair values, for both financial and non-financial assets and liabilities.
When measuring the fair value of an asset or a liability, the Group uses market observable data as far as possible. Fair values are categorised into different levels in a fair value hierarchy based on the inputs used in the valuation techniques as follows:
• Level 1: Quoted prices (unadjusted) in active markets for identical assets or liabilities; • Level 2: Inputs other than quoted prices included in Level 1 that are observable for the asset or liability,
either directly (i.e., as prices) or indirectly (i.e., derived from prices); and • Level 3: Inputs for the asset or liability that are not based on observable market data (unobservable data).
If the inputs used to measure the fair value of an asset or a liability fall into different levels of the fair value hierarchy, then the fair value measurement is categorised in its entirety in the same level of the fair value hierarchy as the lowest level input that is significant to the entire measurement (with Level 3 being the lowest).
The Group recognises transfers between levels of the fair value hierarchy as of the end of the reporting period during which the change has occurred.
Further information about the assumptions made in measuring fair values is included in the following notes:
• Note 5 & 6 – Valuation of investment properties and investment properties under development • Note 26 – Valuation of financial instruments.
3 Significant accounting policies
The accounting policies set out below have been applied consistently to all periods presented in these financial statements, and have been applied consistently by the Group.
3.1 Consolidation
Subsidiaries
Subsidiaries are entities controlled by the Group. The Group controls an entity when it is exposed to, or has rights to, variable returns from its involvement with the entity and has the ability to affect those returns through its power over the entity. The financial statements of subsidiaries are included in the consolidated financial statements from the date that control commences until the date that control ceases.
Where the Group acquires an asset or a group of assets that does not constitute a business, the cost of investment is allocated to the individual identifiable assets acquired and liabilities assumed at the date of acquisition.

156CapitaLand Mall Trust
Annual Report 2016
3 Significant accounting policies (continued)
3.1 Consolidation (continued)
Associateandjointventures
Associate is an entity in which the Group has a significant influence, but not control or joint control, over the financial and operating policies of the entity. A joint venture is an arrangement in which the Group has joint control, whereby the Group has rights to the net assets of the arrangement, rather than rights to its assets and obligations for its liabilities.
Investments in an associate and joint ventures are accounted for using the equity method. They are recognised initially at cost, which includes transaction costs. Subsequent to initial recognition, the consolidated financial statements include the Group’s share of profit or loss and other comprehensive income of equity-accounted investees, after adjustments to align the accounting policies with those of the Group, from the date that significant influence or joint control commences until the date that significant influence or joint control ceases.
When the Group’s share of losses exceeds its interest in an equity-accounted investee, the carrying amount of that investment, together with any long-term interests that form part thereof, is reduced to zero, and the recognition of further losses is discontinued except to the extent that the Group has an obligation to fund the investee’s operations or has made payment on behalf of the investee.
Transactionseliminatedonconsolidation
Intra-group balances and transactions, and any unrealised income or expenses arising from intra-group transactions, are eliminated in preparing the consolidated financial statements. Unrealised gains arising from transactions with equity-accounted investees are eliminated against the investment to the extent of the Group’s interest in the investees. Unrealised losses are eliminated in the same way as unrealised gains, but only to the extent that there is no evidence of impairment.
Accountingforsubsidiaries,associateandjointventuresbytheTrust
Investments in subsidiaries, associate and joint ventures are stated in the Trust’s statement of financial position at cost less accumulated impairment losses.
3.2 Plant and equipment
Plant and equipment are measured at cost less accumulated depreciation and impairment losses. Cost includes expenditure that is directly attributable to the acquisition of the asset.
When parts of an item of plant and equipment have different useful lives, they are accounted for as separate items (major components) of plant and equipment.
The cost of replacing part of an item of plant and equipment is recognised in the carrying amount of the item if it is probable that the future economic benefits embodied within the part will flow to the Group and its cost can be measured reliably. The costs of the day-to-day servicing of plant and equipment are recognised in the Statement of Total Return as incurred. Depreciation is provided on a straight-line basis so as to write off items of plant and equipment, and major components that are accounted for separately, over their estimated useful lives as follows:
Furniture, fittings and equipment - 2 to 5 years
Gain or loss arising from the retirement or disposal of plant and equipment is determined by comparing the proceeds from disposal with the carrying amount of plant and equipment and is recognised in the Statement of Total Return.
Depreciation methods, useful lives and residual values are reviewed, and adjusted as appropriate, at each reporting date.
Notes to the Financial StatementsYear ended 31 December 2016

157Overview
Business Review
Corporate Governance & Transparency
Portfolio Details
Sustainability
Financials & Additional Information
3 Significant accounting policies (continued)
3.3 Investment properties and investment properties under development
Investment properties are properties held either to earn rental income or for capital appreciation or for both, but not for sale in the ordinary course of business, use in the production, supply of goods, services or for administrative purposes. Investment properties under development are properties being constructed or developed for future use as investment properties. Investment properties and investment properties under development are accounted for as non-current assets and are stated at initial cost on acquisition and at fair value thereafter. The cost of a purchased property comprises its purchase price and any directly attributable expenditure including capitalised borrowing costs. Directly attributable transaction costs are included in the initial measurement. The cost of self-constructed investment property includes the cost of materials and direct labour, any other costs directly attributable to bringing the investment property to a working condition for their intended use and capitalised borrowing costs. Fair value is determined in accordance with the Trust Deed, which requires the investment properties to be valued by independent registered valuers in the following events:
• in such manner and frequency required under the CIS Code issued by MAS; and
• at least once in each period of 12 months following the acquisition of each parcel of real estate property.
Any increase or decrease on revaluation is credited or charged to the Statement of Total Return as a net change in fair value of the investment properties.
When an investment property or investment property under development is disposed of, the resulting gain or loss recognised in the Statement of Total Return is the difference between net disposal proceeds and the carrying amount of the property.
Investment properties are not depreciated. The properties are subject to continued maintenance and regularly revalued on the basis set out above. For income tax purposes, the Group and the Trust may claim capital allowances on assets that qualify as plant and machinery under the Income Tax Act.
3.4 Foreign currency transactions
Transactions in foreign currencies are translated to the respective functional currencies of the Group at the exchange rates at the dates of the transactions. Monetary assets and liabilities denominated in foreign currencies at the reporting date are translated to the functional currency at the exchange rate at that date. The foreign currency gain or loss on monetary items is the difference between amortised cost in the functional currency at the beginning of the year, adjusted for effective interest and payments during the year, and the amortised cost in foreign currency translated at the exchange rate at the end of the year.
Non-monetary assets and liabilities denominated in foreign currencies that are measured at fair value are translated to the functional currency at the exchange rate at the date that the fair value was determined.
Foreign currency differences arising on translation are recognised in Statement of Total Return, except for the following differences which are recognised in Statement of Movements in Unitholders’ funds, arising on the translation of:
• available-for-sale equity instruments (except on impairment in which case foreign currency differences that have been recognised in Statement of Movements in Unitholders’ funds are reclassified to Statement of Total Return);
• a financial liability designated as a hedge of the net investment in a foreign operation to the extent that the hedge is effective; or
• qualifying cash flow hedges to the extent the hedge is effective.
158CapitaLand Mall Trust
Annual Report 2016
3 Significant accounting policies (continued)
3.5 Financial instruments
Non-derivativefinancialassets
The Group initially recognises loans and receivables on the date that they are originated. All other financial assets (including assets designated at fair value through profit or loss) are recognised initially on the trade date, which is the date that the Group becomes a party to the contractual provisions of the instrument.
The Group derecognises a financial asset when the contractual rights to the cash flows from the asset expire, or it transfers the rights to receive the contractual cash flows on the financial asset in a transaction in which substantially all the risks and rewards of ownership of the financial asset are transferred or it neither transfers nor retains substantially all the risk and rewards of ownership and does not retain control over the transferred asset. Any interest in transferred financial assets that is created or retained by the Group is recognised as a separate asset or liability.
Financial assets and liabilities are offset and the net amount presented in the Statement of Financial Position when, and only when, the Group has a legal right to offset the amounts and intends either to settle on a net basis or to realise the asset and settle the liability simultaneously.
The Group has the following non-derivative financial assets: loans and receivables. Loans and receivables
Loans and receivables are financial assets with fixed or determinable payments that are not quoted in an active market. Such assets are recognised initially at fair value plus any directly attributable transaction costs. Subsequent to initial recognition, loans and receivables are measured at amortised cost using the effective interest method, less any impairment losses.
Loans and receivables comprise trade and other receivables, amounts due from subsidiaries, amounts due from joint ventures and cash and cash equivalents.
Cash and cash equivalents comprise cash balances and bank deposits.
Non-derivativefinancialliabilities
The Group initially recognises debt securities issued on the date that they are originated. All other financial liabilities (including liabilities designated at fair value through profit or loss) are recognised initially on the trade date, which is the date that the Group becomes a party to the contractual provisions of the instrument.
The Group derecognises a financial liability when its contractual obligations are discharged, cancelled or expired.
The Group classifies non-derivative financial liabilities into the other financial liabilities category. Such non-derivative financial liabilities are initially measured at fair value less any directly attributable transaction costs. Subsequent to initial recognition, these financial liabilities are measured at amortised cost using the effective interest method. These financial liabilities comprise interest-bearing borrowings, trade and other payables and security deposits.
Notes to the Financial StatementsYear ended 31 December 2016

159Overview
Business Review
Corporate Governance & Transparency
Portfolio Details
Sustainability
Financials & Additional Information
3 Significant accounting policies (continued)
3.5 Financial instruments (continued)
Derivativefinancialinstruments,includinghedgeaccounting
The Group holds derivative financial instruments to hedge its foreign currency and interest rate risk exposures. Embedded derivatives are separated from the host contract and accounted for separately if the economic characteristics and risks of the host contract and the embedded derivative are not closely related, a separate instrument with the same terms as the embedded derivative would meet the definition of a derivative, and the combined instrument is not measured at fair value through profit or loss.
On initial designation of the derivative as the hedging instrument, the Group formally documents the relationship between the hedging instrument and the hedged item, including the risk management objectives and strategy in undertaking the hedge transaction and the hedge risk, together with the methods that will be used to assess the effectiveness of the hedging relationship. The Group makes an assessment, both at the inception of the hedge relationship as well as on an ongoing basis, of whether the hedging instruments are expected to be “highly effective” in offsetting the changes in the fair value or cash flows of the respective hedged items during the period for which the hedge is designated, and whether the actual results of each hedge are within a range of 80%-125%. For a cash flow hedge of a forecast transaction, the transaction should be highly probable to occur and should present an exposure to variations in cash flows that could ultimately affect reported total return.
Derivatives are recognised initially at fair value; any attributable transaction costs are recognised in the Statement of Total Return as incurred. Subsequent to initial recognition, derivatives are measured at fair value, and changes therein are accounted for as described below. Cash flow hedges
When a derivative is designated as the hedging instrument in a hedge of the variability in cash flows attributable to a particular risk associated with a recognised asset or liability or a highly probable forecast transaction that could affect Statement of Total Return, the effective portion of changes in the fair value of the derivative is recognised in Statement of Movements in Unitholders’ funds and presented in the hedging reserve in Unitholders’ funds. Any ineffective portion of changes in the fair value of the derivative is recognised immediately in Statement of Total Return.
When the hedged item is a non-financial asset, the amount accumulated in Unitholders’ funds is included in the carrying amount of the asset when the asset is recognised. In other cases as well, the amount accumulated in Unitholders’ funds is reclassified to Statement of Total Return in the same period that the hedged item affects Statement of Total Return. If the hedging instrument no longer meets the criteria for hedge accounting, expires or is sold, terminated or exercised, or the designation is revoked, then hedge accounting is discontinued prospectively. If the forecast transaction is no longer expected to occur, then the balance in Unitholders’ funds is reclassified to Statement of Total Return.
Other non-trading derivatives
When a derivative financial instrument is not designated in a hedge relationship that qualifies for hedge accounting, all changes in its fair value are recognised immediately in Statement of Total Return.
160CapitaLand Mall Trust
Annual Report 2016
3 Significant accounting policies (continued)
3.6 Impairment
Non-derivativefinancialassets
A financial asset not carried at fair value through profit or loss, including an interest in a subsidiary, associate and joint venture, is assessed at each reporting date to determine whether there is objective evidence that it is impaired. A financial asset is impaired if objective evidence indicates that a loss event has occurred after the initial recognition of the asset, and that the loss event has an impact on the estimated future cash flows of that asset that can be estimated reliably.
Objective evidence that financial assets are impaired can include default or delinquency by a debtor, restructuring of an amount due to the Group on terms that the Group would not consider otherwise, indications that a debtor or issuer will enter bankruptcy.
Loans and receivables
The Group considers evidence of impairment for loans and receivables at both a specific asset and collective level. All individually significant loans and receivables are assessed for specific impairment. All individually significant loans and receivables found not to be specifically impaired are then collectively assessed for any impairment that has been incurred but not yet identified. Loans and receivables that are not individually significant are collectively assessed for impairment by grouping together loans and receivables with similar risk characteristics.
In assessing collective impairment, the Group uses historical trends of the probability of default, timing of recoveries and the amount of loss incurred, adjusted for the Manager’s judgement as to whether current economic and credit conditions are such that the actual losses are likely to be greater or less than suggested by historical trends. An impairment loss in respect of a financial asset measured at amortised cost is calculated as the difference between its carrying amount and the present value of the estimated future cash flows discounted at the asset’s original effective interest rate. Losses are recognised in the Statement of Total Return and reflected in an allowance account against loans and receivables. Interest on the impaired asset continues to be recognised through the unwinding of the discount. When a subsequent event causes the amount of impairment loss to decrease, the decrease in impairment loss is reversed through the Statement of Total Return.
Subsidiaries, associate and joint ventures
An impairment loss in respect of a subsidiary, associate or joint venture is measured by comparing the recoverable amount of the investment with its carrying amount in accordance with the paragraph below. An impairment loss is recognised in the Statement of Total Return. An impairment loss is reversed if there has been a favourable change in the estimates used to determine the recoverable amount.
Notes to the Financial StatementsYear ended 31 December 2016

161Overview
Business Review
Corporate Governance & Transparency
Portfolio Details
Sustainability
Financials & Additional Information
3 Significant accounting policies (continued)
3.6 Impairment (continued)
Non-financialassets
The carrying amounts of the Group’s non-financial assets, other than investment properties are reviewed at each reporting date to determine whether there is any indication of impairment. If any such indication exists, then the asset’s recoverable amount is estimated.
The recoverable amount of an asset or cash-generating unit (“CGU”) is the greater of its value in use and its fair value less costs to sell. In assessing value in use, the estimated future cash flows are discounted to their present value using a pre-tax discount rate that reflects current market assessments of the time value of money and the risks specific to the asset or CGU. For the purpose of impairment testing, assets that cannot be tested individually are grouped together into the smallest group of assets that generates cash inflows from continuing use that are largely independent of the cash inflows of other assets or CGU.
An impairment loss is recognised if the carrying amount of an asset or its CGU exceeds its estimated recoverable amount. Impairment losses are recognised in the Statement of Total Return.
Impairment losses recognised in prior periods are assessed at each reporting date for any indications that the loss has decreased or no longer exists. An impairment loss is reversed if there has been a change in the estimates used to determine the recoverable amount. An impairment loss is reversed only to the extent that the asset’s carrying amount does not exceed the carrying amount that would have been determined, net of depreciation or amortisation, if no impairment loss had been recognised.
3.7 Interest-bearing borrowings
Interest-bearing borrowings are recognised initially at fair value less attributable transaction costs. Subsequent to initial recognition, interest-bearing borrowings are stated at amortised cost with any difference between cost and redemption value being recognised in the Statement of Total Return over the period of the borrowings on an effective interest basis.
3.8 Unitholders’ funds
Unitholders’ funds represent the Unitholders’ residual interest in the Group’s net assets upon termination and is classified as equity.
Incremental costs directly attributable to the issue of units are recognised as a deduction from Unitholders’ funds.

162CapitaLand Mall Trust
Annual Report 2016
3 Significant accounting policies (continued)
3.9 Revenue recognition
Rentalincomefromoperatingleases
Rental income receivable under operating leases is recognised in the Statement of Total Return on a straight-line basis over the term of the lease, except where an alternative basis is more representative of the pattern of benefits to be derived from the leased assets. Lease incentives granted are recognised as an integral part of the total rental income, over the term of the lease. Contingent rentals, which include gross turnover rental, are recognised as income in the accounting period on a receipt basis. No contingent rentals are recognised if there are uncertainties due to the possible return of amounts received.
Carparkincome
Car park income is recognised as it accrues on a time apportioned basis.
Interest income
Interest income is recognised as it accrues, using the effective interest method.
Investmentincome
Investment income is recognised when the right to receive distribution income is established.
3.10 Expenses
Propertyoperatingexpenses
Property operating expenses consist of quit rents, property taxes, utilities, property management fees, property management reimbursements, marketing, maintenance and other property outgoings in relation to investment properties where such expenses are the responsibility of the Group.
Property management fees are recognised on an accrual basis based on the applicable formula, stipulated in Note 1.1.
Assetmanagementfees
Asset management fees are recognised on an accrual basis using the applicable formula, stipulated in Note 1.2.
Trustee’sfees
The Trustee’s fees are recognised on an accrual basis using the applicable formula, stipulated in Note 1.3.
3.11 Finance costs
Finance costs comprise interest expense on borrowings and amortisation of borrowings related transaction costs, and are recognised in the Statement of Total Return using the effective interest method over the period of borrowings.
Notes to the Financial StatementsYear ended 31 December 2016

163Overview
Business Review
Corporate Governance & Transparency
Portfolio Details
Sustainability
Financials & Additional Information
3 Significant accounting policies (continued)
3.12 Income tax
Income tax expense comprises current and deferred tax. Current and deferred tax is recognised in the Statement of Total Return except to the extent that it relates to items directly related to Unitholders’ funds, in which case it is recognised in Unitholders’ funds.
Current tax is the expected tax payable on the taxable income for the year, using tax rates enacted or substantively enacted at the reporting date, and any adjustment to tax payable in respect of previous years. The amount of current tax payable or receivable is the best estimate of the tax amount expected to be paid or received that reflects uncertainty related to income taxes, if any.
Deferred tax is recognised in respect of temporary differences between the carrying amounts of assets and liabilities for financial reporting purposes and the amounts used for taxation purposes. Deferred tax is not recognised for:
• temporary differences on the initial recognition of assets or liabilities in a transaction that is not a business combination and that affects neither accounting nor taxable profit; and
• temporary differences related to investments in subsidiaries and joint ventures to the extent that it is probable that they will not reverse in the foreseeable future.
The measurement of deferred taxes reflects the tax consequences that would follow the manner in which the Group expects, at the end of the reporting date, to recover or settle the carrying amount of its assets and liabilities. For investment property that is measured at fair value, the presumption that the carrying amount of the investment property will be recovered through sale has not been rebutted. Deferred tax is measured at the tax rates that are expected to be applied to the temporary differences when they reverse, based on the laws that have been enacted or substantively enacted by the reporting date.
Deferred tax assets and liabilities are offset if there is a legally enforceable right to offset current tax liabilities and assets and they relate to taxes levied by the same tax authority on the same taxable entity, or on different tax entities, but they intend to settle current tax liabilities and assets on a net basis or their tax assets and liabilities will be realised simultaneously.
A deferred tax asset is recognised to the extent that it is probable that future taxable profits will be available against which the temporary differences can be utilised. Deferred tax assets are reviewed at each reporting date and are reduced to the extent that it is no longer probable that the related tax benefit will be realised.
In determining the amount of current and deferred tax, the Group takes into account the impact of uncertain tax positions and whether additional taxes and interest may be due. The Group believes that its accruals for tax liabilities are adequate for all open tax years based on its assessment of many factors, including interpretations of tax law and prior experience. This assessment relies on estimates and assumptions and may involve a series of judgements about future events. New information may become available that causes the Group to change its judgement regarding the adequacy of existing tax liabilities; such changes to tax liabilities will impact tax expense in the period that such a determination is made.
The Inland Revenue Authority of Singapore (the “IRAS”) has issued a tax ruling on the tax treatment of the Trust. Subject to meeting the terms and conditions of the tax ruling which includes a distribution of at least 90.0% of the taxable income of the Trust, the Trustee is not subject to tax on the taxable income of the Trust to the extent of the amount distributed. Instead, the distributions made by the Trust out of such taxable income are subject to tax in the hands of Unitholders, unless they are exempt from tax on the Trust’s distributions. This treatment is known as the tax transparency treatment.

164CapitaLand Mall Trust
Annual Report 2016
3 Significant accounting policies (continued)
3.12 Income tax (continued)
Individuals and qualifying Unitholders, i.e. companies incorporated and tax resident in Singapore, Singapore branches of companies incorporated outside Singapore and bodies of persons registered or constituted in Singapore, are entitled to gross distributions from the Trust. For distributions made to foreign non-individual Unitholders, the Trustee is required to withhold tax at the reduced rate of 10.0%. For other types of Unitholders, the Trustee is required to withhold tax at the prevailing corporate tax rate on the distributions made by the Trust. Such other types of Unitholders are subject to tax on the regrossed amounts of the distributions received but may claim a credit for the tax deducted at source at the prevailing corporate tax rate by the Trustee.
The Trust has a distribution policy to distribute at least 90.0% of its taxable income, other than gains from the sale of real estate properties that are determined by the IRAS to be trading gains. For the taxable income that is not distributed, referred to as retained taxable income, tax will be assessed on the Trustee. Where such retained taxable income is subsequently distributed, the Trustee need not deduct tax at source.
3.13 Earnings per unit
The Group and Trust present basic and diluted earnings per unit data for its units. Basic earnings per unit is calculated by dividing the total return by the weighted-average number of units outstanding during the year. Diluted earnings per unit is determined by adjusting the total return and the weighted-average number of ordinary units outstanding, for the effects of all dilutive potential units.
3.14 Segment reporting
An operating segment is a component of the Group that engages in business activities from which it may earn revenues and incur expenses, including revenues and expenses that relate to transactions with any of the Group’s other components. All operating segments’ operating results are reviewed and used by the management for strategic decision making and resources allocation.
3.15 New standards and interpretations not yet adopted
A number of new standards and amendments to standards are effective for annual periods beginning after 1 January 2016 and earlier application is permitted; however, the Group has not early applied the following new or amended standards in preparing these statements.
Applicable to 2017 financial statements
Revision to RAP 7
RAP 7 was revised in June 2016 to take into account, amongst others, the changes made to FRS 32 Financial Instruments: Presentation and FRS 107 Financial Instruments: Disclosures in relation to the offsetting of financial assets and liabilities; and new standards issued after 2012 including FRS 110 Consolidated Financial Statements, FRS 112 Disclosure of Interest in Other Entities and FRS 113 Fair Value Measurement. RAP 7 (Revised June 2016) is applicable to unit trusts with annual periods beginning on or after 1 July 2016. Certain additional disclosures would be required by the Revised RAP 7.
Notes to the Financial StatementsYear ended 31 December 2016
165Overview
Business Review
Corporate Governance & Transparency
Portfolio Details
Sustainability
Financials & Additional Information
3 Significant accounting policies (continued)
3.15 New standards and interpretations not yet adopted (continued)
Applicable to 2018 financial statements
FRS 115 RevenuefromContractswithCustomers
FRS 115 establishes a comprehensive framework for determining whether, how much and when revenue is recognised. It also introduces new cost guidance which requires certain costs of obtaining and fulfilling contracts to be recognised as separate assets when specified criteria are met.
When effective, FRS 115 replaces existing revenue recognition guidance, including FRS 18 Revenue, FRS 11 Construction Contracts, INT FRS 113 Customer Loyalty Programmes, INT FRS 115 Agreements for the Construction of Real Estate, INT FRS 118 Transfers of Assets from Customers and INT FRS 31 Revenue – Barter Transactions Involving Advertising Services.
FRS 115 is effective for annual periods beginning on or after 1 January 2018, with early adoption permitted.
Potential impact on the financial statements
The Group does not expect the impact on the financial statements to be significant.
Transition - The Group plans to adopt the standard when it becomes effective in 2018.
FRS 109 FinancialInstruments
FRS 109 replaces most of the existing guidance in FRS 39 Financial Instruments: Recognition and Measurement. It includes revised guidance on the classification and measurement of financial instruments, a new expected credit loss model for calculating impairment on financial assets, and new general hedge accounting requirements. It also carries forward the guidance on recognition and derecognition of financial instruments from FRS 39.
FRS 109 is effective for annual periods beginning on or after 1 January 2018, with early adoption permitted.
Potential impact on the financial statements
Overall, the Group does not expect a significant impact on its opening unitholders’ funds.
The Group’s initial assessment of the three elements of FRS 109 is as described below.
Classification and measurement
The Group does not expect a significant change to the measurement basis arising from adopting the new classification and measurement model under FRS 109.
Loans and receivables that are currently accounted for at amortised cost will continue to be accounted for using amortised cost model under FRS 109.
For financial assets currently held at fair value, the Group expects to continue measuring most of these assets at fair value under FRS 109. Impairment
The Group plans to apply the simplified approach and record lifetime expected impairment losses on all trade receivables and any contract assets arising from the application of FRS 115. On adoption of FRS 109, the Group does not expect a significant increase in the impairment loss allowance.

166CapitaLand Mall Trust
Annual Report 2016
3 Significant accounting policies (continued)
3.15 New standards and interpretations not yet adopted (continued)
Applicable to 2018 financial statements (continued)
FRS 109 FinancialInstruments (continued)
Hedge accounting
The Group expects that all its existing hedges that are designated in effective hedging relationships will continue to qualify for hedge accounting under FRS 109.
Transition - The Group plans to adopt the standard when it becomes effective in 2018 without restating comparative information.
Applicable to 2019 financial statements
FRS 116 Leases
FRS 116 eliminates the lessee’s classification of leases as either operating leases or finance leases and introduces a single lessee accounting model. Applying the new model, a lessee is required to recognise right-of-use (ROU) assets and lease liabilities for all leases with a term of more than 12 months, unless the underlying asset is of low value.
FRS 116 substantially carries forward the lessor accounting requirements in FRS 17 Leases.
Accordingly, a lessor continues to classify its leases as operating leases or finance leases, and to account for these two types of leases using the FRS 17 operating lease and finance lease accounting models respectively. However, FRS 116 requires more extensive disclosures to be provided by a lessor.
When effective, FRS 116 replaces existing lease accounting guidance, including FRS 17, INT FRS 104 Determining whether an Arrangement contains a Lease, INT FRS 15 Operating Leases – Incentives, and INT FRS 27 Evaluating the Substance of Transactions Involving the Legal Form of a Lease.
FRS 116 is effective for annual periods beginning on or after 1 January 2019, with early adoption permitted if FRS 115 is also applied.
Potential impact on the financial statements
The Group has performed a preliminary high-level assessment of the new standard on its existing operating lease arrangements as a lessee. Based on the preliminary assessment, the Group expects these operating leases to be recognised as ROU assets with corresponding lease liabilities under the new standard. The operating lease commitments on an undiscounted basis amount to approximately 0.2% of the total assets and 0.4% of total liabilities. Assuming no additional new operating leases in future years until the effective date, the Group and Trust expects the amount of ROU asset and lease liability to be lower due to discounting and as the lease terms run down.
The Group plans to adopt the standard when it becomes effective in 2019.
Notes to the Financial StatementsYear ended 31 December 2016

167Overview
Business Review
Corporate Governance & Transparency
Portfolio Details
Sustainability
Financials & Additional Information
4 Plant and equipment
Furniture, fittings and equipment
2016
$’0002015
$’000
Group
Cost At 1 January 8,266 6,813Acquisition of subsidiary – 1,178Additions 521 446Disposals (67) (73)Assets written off (259) (98)
At 31 December 8,461 8,266 Accumulated depreciation At 1 January 5,311 4,670Charge for the year 1,034 793Disposals (60) (73)Assets written off (233) (79)
At 31 December 6,052 5,311 Carrying amounts At 1 January 2,955 2,143
At 31 December 2,409 2,955 Trust
Cost At 1 January 7,355 6,813Additions 538 713Disposals (67) (73)Assets written off (244) (98)
At 31 December 7,582 7,355 Accumulated depreciation At 1 January 5,222 4,670Charge for the year 693 704Disposals (60) (73)Assets written off (219) (79)
At 31 December 5,636 5,222 Carrying amounts At 1 January 2,133 2,143
At 31 December 1,946 2,133

168CapitaLand Mall Trust
Annual Report 2016
5 Investment properties
Group Trust
2016
$’0002015
$’0002016
$’0002015
$’000
At 1 January 8,366,000 7,510,000 7,586,000 7,510,000Acquisition of subsidiary1 – 788,234 – –Disposal of investment property – (116,151) – (116,151)Reclassification to investment properties under development2 (Note 6) (421,000) – (421,000) –Capital expenditure 50,497 76,942 50,531 76,942
7,995,497 8,259,025 7,215,531 7,470,791Net change in fair value of investment properties 68,503 106,975 68,469 115,209
At 31 December 8,064,000 8,366,000 7,284,000 7,586,000
1 Included acquisition fees and acquisition related expenses of $9,412,000.
2 The reclassification to investment properties under development relates to the redevelopment of Funan.
As at 31 December 2016 and 31 December 2015, all investment properties under the Group and Trust are unencumbered.
Fair value hierarchy
The fair value of investment properties is determined by external, independent property valuers, having appropriate recognised professional qualifications and recent experience in the location and category of the property being valued.
The fair value measurement for investment properties of $8,064,000,000 (2015: $8,366,000,000) and $7,284,000,000 (2015: $7,586,000,000) for the Group and Trust respectively have been categorised as level 3 fair values based on inputs to the valuation techniques used.
Level 3 fair values
Reconciliations from the beginning balances to the ending balances for fair value measurements of level 3 investment properties are set out in the table above.
Valuation technique
Investment properties are stated at fair value based on valuation performed by independent professional valuers. In determining the fair value, the valuers have adopted the capitalisation method and discounted cash flow method.
The capitalisation approach is an investment approach whereby the estimated gross passing income (on both a passing and market rent basis) is adjusted to reflect anticipated operating costs to produce a net income on a fully leased basis. The adopted fully leased net income is capitalised over the remaining term of the lease from the valuation date at an appropriate investment yield. The discounted cash flow method involves the estimation and projection of a net income stream over a period and discounting the net income stream with an internal rate of return to arrive at the market value. The discounted cash flow method requires the valuer to assume a rental growth rate indicative of market and the selection of a target internal rate of return consistent with current market requirements. The above valuation methods involve certain estimates. The Manager reviews the key valuation parameters and underlying data including market-corroborated capitalisation rates and discount rates adopted by the valuers and is of view that they are reflective of the market conditions as at the reporting dates.
Notes to the Financial StatementsYear ended 31 December 2016

169Overview
Business Review
Corporate Governance & Transparency
Portfolio Details
Sustainability
Financials & Additional Information
5 Investment properties (continued)
Significant unobservable inputs
The following table shows the key unobservable inputs used in the valuation models:
Group and Trust
Type Key unobservable inputs
Inter-relationship between key unobservable inputs and fair value measurement
Investment propertyCommercial properties for leasing
• Capitalisation rates from 4.0% to 7.5%
(2015: from 4.0% to 7.5%)
• Discount rates from 7.21% to 8.0%
(2015: from 7.25% to 8.0%)
The estimated fair value would increase/(decrease) if the capitalisation rates or discount rates were lower/(higher).
Significant unobservable inputs correspond to:
• Capitalisation rate corresponds to a rate of return on investment properties based on the expected income that the property will generate.
• Discount rate is based on the risk-free rate for 10 year bonds issued by the government in the relevant market, adjusted for a risk premium to reflect the increased risk of investment in the asset class.
6 Investment properties under development
Group Trust
2016
$’0002015
$’0002016
$’0002015
$’000
At 1 January – – – –Reclassification from investment properties1 (Note 5) 421,000 – 421,000 –Capital expenditure 23,997 – 10,688 –Disposal of interest2 – – (188,000) –
At 31 December 444,997 – 243,688 –
1 Relates to the redevelopment of Funan.
2 Sale of certain undivided shares in Funan to Victory Office 1 Trust, Victory Office 2 Trust and Victory SR Trust. See Note 7.

170CapitaLand Mall Trust
Annual Report 2016
6 Investment properties under development (continued)
Fair value hierarchy
The fair value of the investment properties under development is determined by external, independent property valuers, having appropriate recognised professional qualifications and recent experience in the location and category of property being valued.
The fair value measurement for the investment properties under development of $444,997,000 (2015: nil) and $243,688,000 (2015: nil) for the Group and Trust respectively have been categorised as level 3 fair values based on inputs to the valuation techniques used.
Level 3 fair values
Reconciliations from the beginning balances to the ending balances for fair value measurements of level 3 are set out in the table above.
Valuation technique
As at 31 December 2016, the investment properties under development was stated at fair value based on valuation performed by an independent professional valuer, Knight Frank. In determining the fair value, the valuer has adopted the residual land value method.
Under the residual land value method of valuation, the total gross development costs and developer’s profit are deducted from the gross development value to arrive at the residual value of land. The gross development value is the estimated value of the property assuming satisfactory completion of the development as at the date of valuation. The Manager is of the view that the valuation method and estimates are reflective of the market condition at the reporting date.
Significant unobservable inputs
The following table shows the key unobservable inputs used in the valuation model:
Type Key unobservable inputs
Inter-relationship between key unobservable inputs and fair value measurement
Investment properties under developmentCommercial properties • Capitalisation rates
from 4.15% to 5.15% (2015: nil)
• Discount rate of 7.00% (2015: nil)
• Gross development costs
The estimated fair value would increase/(decrease) if the capitalisation rates or discount rate were lower/(higher).
The estimated fair value would increase/(decrease) if the gross development costs decrease/(increase).
Significant unobservable inputs correspond to:
• Capitalisation rate corresponds to a rate of return on investment property based on the expected income that the property will generate.
• Discount rate is based on the risk-free rate for 10 year bonds issued by the government in the relevant market, adjusted for a risk premium to reflect the increased risk of investing in the asset class.
Notes to the Financial StatementsYear ended 31 December 2016

171Overview
Business Review
Corporate Governance & Transparency
Portfolio Details
Sustainability
Financials & Additional Information
7 Subsidiaries
Trust
2016
$’0002015
$’000
Non-current assets Equity investments at cost 294,869 189,837Loans to subsidiaries 692,071 603,137
986,940 792,974Less: Allowance for impairment loss (6,222) (5,904)
980,718 787,070
As at 31 December 2016, the Manager has assessed the recoverable amount of the Trust’s interest in Brilliance Mall Trust (“BMT”) for impairment. The allowance for impairment loss amounting to $6,222,000 (2015: $5,904,000) was recognised in respect of the Trust’s investment in BMT taking into consideration the fair value of the underlying property held by BMT and the liabilities to be settled. The recoverable amount was assessed based on fair value less costs to sell estimated using the revalued net assets of BMT as at 31 December 2016 and categorised as level 3 on the fair value hierarchy.
The key assumptions used in the estimation of the recoverable amount are set out below.
Trust
2016
%2015
%
Investment property Capitalisation rate 5.20 5.20Discount rate 7.50 7.50
The movement in the allowance for impairment loss in respect of the year was as follows:
Trust
2016
$’0002015
$’000
At the beginning of the year 5,904 –Impairment loss 318 5,904
At the end of the year 6,222 5,904
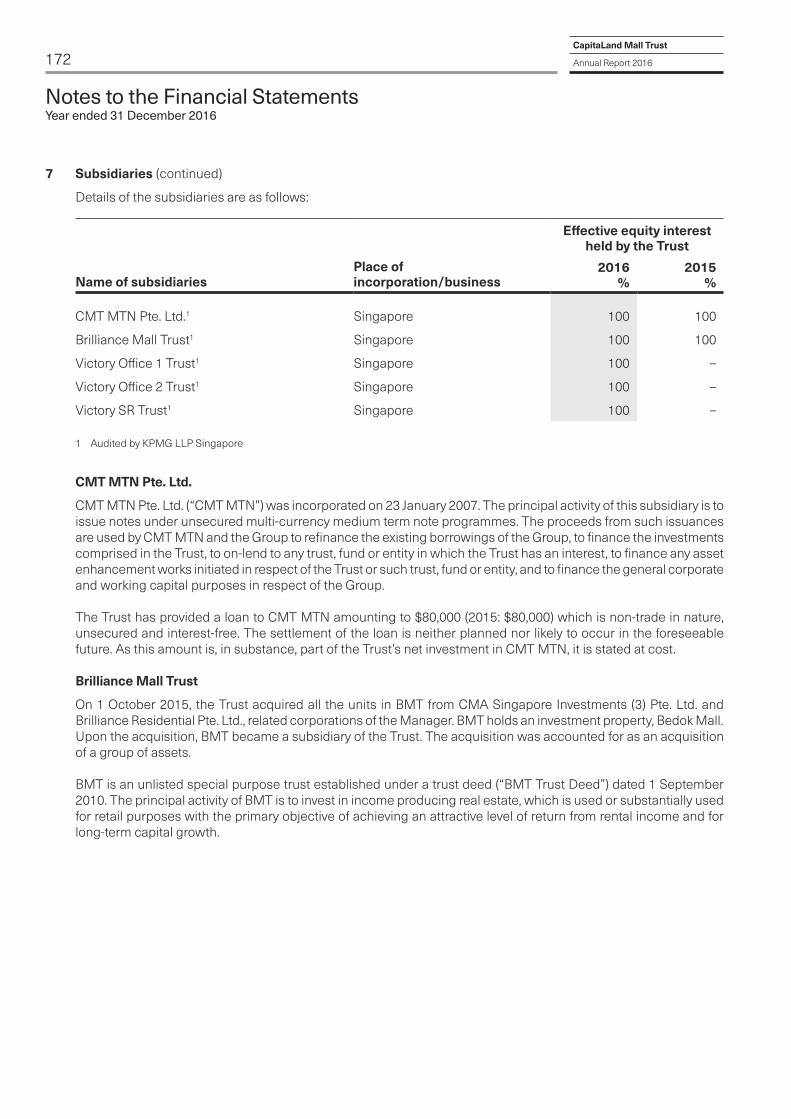
172CapitaLand Mall Trust
Annual Report 2016
7 Subsidiaries (continued)
Details of the subsidiaries are as follows:
Name of subsidiariesPlace of incorporation/business
Effective equity interest held by the Trust
2016%
2015%
CMT MTN Pte. Ltd.1 Singapore 100 100
Brilliance Mall Trust1 Singapore 100 100
Victory Office 1 Trust1 Singapore 100 –
Victory Office 2 Trust1 Singapore 100 –
Victory SR Trust1 Singapore 100 –
1 Audited by KPMG LLP Singapore
CMT MTN Pte. Ltd.
CMT MTN Pte. Ltd. (“CMT MTN”) was incorporated on 23 January 2007. The principal activity of this subsidiary is to issue notes under unsecured multi-currency medium term note programmes. The proceeds from such issuances are used by CMT MTN and the Group to refinance the existing borrowings of the Group, to finance the investments comprised in the Trust, to on-lend to any trust, fund or entity in which the Trust has an interest, to finance any asset enhancement works initiated in respect of the Trust or such trust, fund or entity, and to finance the general corporate and working capital purposes in respect of the Group.
The Trust has provided a loan to CMT MTN amounting to $80,000 (2015: $80,000) which is non-trade in nature, unsecured and interest-free. The settlement of the loan is neither planned nor likely to occur in the foreseeable future. As this amount is, in substance, part of the Trust’s net investment in CMT MTN, it is stated at cost.
Brilliance Mall Trust
On 1 October 2015, the Trust acquired all the units in BMT from CMA Singapore Investments (3) Pte. Ltd. and Brilliance Residential Pte. Ltd., related corporations of the Manager. BMT holds an investment property, Bedok Mall. Upon the acquisition, BMT became a subsidiary of the Trust. The acquisition was accounted for as an acquisition of a group of assets.
BMT is an unlisted special purpose trust established under a trust deed (“BMT Trust Deed”) dated 1 September 2010. The principal activity of BMT is to invest in income producing real estate, which is used or substantially used for retail purposes with the primary objective of achieving an attractive level of return from rental income and for long-term capital growth.
Notes to the Financial StatementsYear ended 31 December 2016
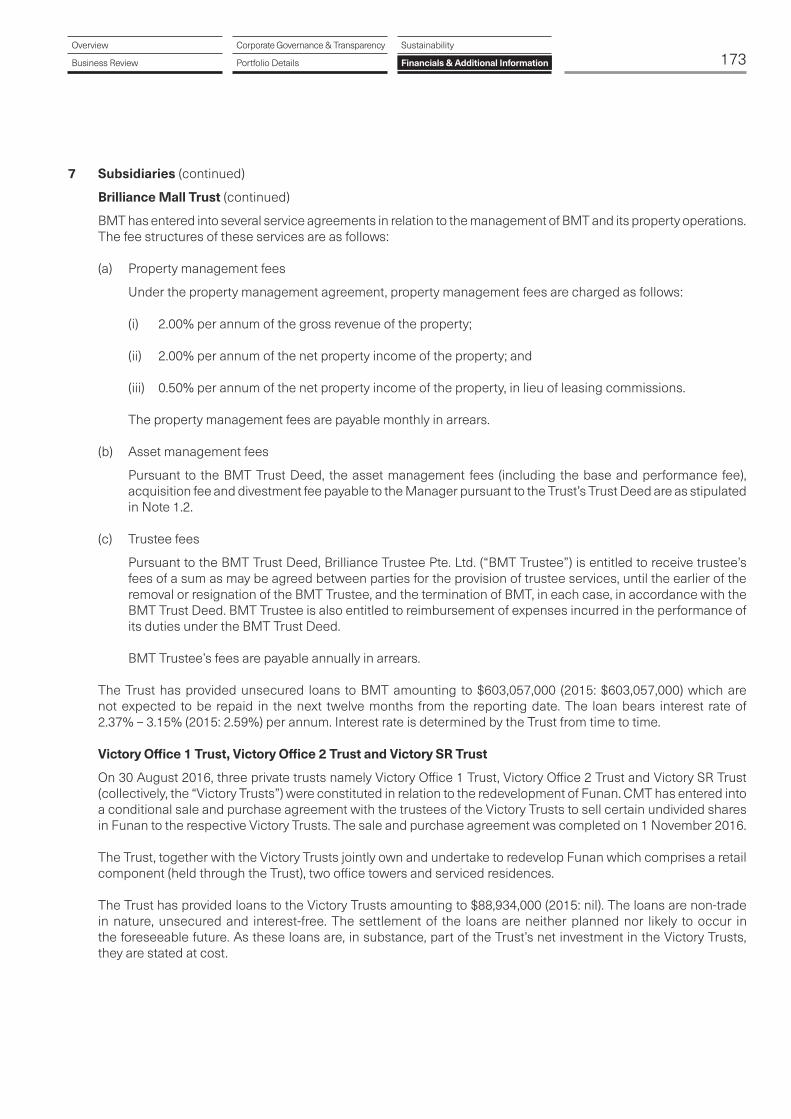
173Overview
Business Review
Corporate Governance & Transparency
Portfolio Details
Sustainability
Financials & Additional Information
7 Subsidiaries (continued)
Brilliance Mall Trust (continued)
BMT has entered into several service agreements in relation to the management of BMT and its property operations. The fee structures of these services are as follows:
(a) Property management fees
Under the property management agreement, property management fees are charged as follows:
(i) 2.00% per annum of the gross revenue of the property;
(ii) 2.00% per annum of the net property income of the property; and
(iii) 0.50% per annum of the net property income of the property, in lieu of leasing commissions.
The property management fees are payable monthly in arrears.
(b) Asset management fees
Pursuant to the BMT Trust Deed, the asset management fees (including the base and performance fee), acquisition fee and divestment fee payable to the Manager pursuant to the Trust’s Trust Deed are as stipulated in Note 1.2.
(c) Trustee fees
Pursuant to the BMT Trust Deed, Brilliance Trustee Pte. Ltd. (“BMT Trustee”) is entitled to receive trustee’s fees of a sum as may be agreed between parties for the provision of trustee services, until the earlier of the removal or resignation of the BMT Trustee, and the termination of BMT, in each case, in accordance with the BMT Trust Deed. BMT Trustee is also entitled to reimbursement of expenses incurred in the performance of its duties under the BMT Trust Deed.
BMT Trustee’s fees are payable annually in arrears.
The Trust has provided unsecured loans to BMT amounting to $603,057,000 (2015: $603,057,000) which are not expected to be repaid in the next twelve months from the reporting date. The loan bears interest rate of 2.37% – 3.15% (2015: 2.59%) per annum. Interest rate is determined by the Trust from time to time.
Victory Office 1 Trust, Victory Office 2 Trust and Victory SR Trust
On 30 August 2016, three private trusts namely Victory Office 1 Trust, Victory Office 2 Trust and Victory SR Trust (collectively, the “Victory Trusts”) were constituted in relation to the redevelopment of Funan. CMT has entered into a conditional sale and purchase agreement with the trustees of the Victory Trusts to sell certain undivided shares in Funan to the respective Victory Trusts. The sale and purchase agreement was completed on 1 November 2016.
The Trust, together with the Victory Trusts jointly own and undertake to redevelop Funan which comprises a retail component (held through the Trust), two office towers and serviced residences. The Trust has provided loans to the Victory Trusts amounting to $88,934,000 (2015: nil). The loans are non-trade in nature, unsecured and interest-free. The settlement of the loans are neither planned nor likely to occur in the foreseeable future. As these loans are, in substance, part of the Trust’s net investment in the Victory Trusts, they are stated at cost.

174CapitaLand Mall Trust
Annual Report 2016
Notes to the Financial StatementsYear ended 31 December 2016
8 Associate and joint ventures
Group Trust
2016
$’0002015
$’0002016
$’0002015
$’000
Investment in associate 191,313 208,866 130,836 130,836Investment in joint ventures 790,173 815,566 579,182 575,307Loan to joint venture 153,976 153,976 153,976 153,976Less: Allowance for impairment loss – – (3,843) (5,429)
1,135,462 1,178,408 860,151 854,690
The loan to joint venture is unsecured, with no fixed terms of repayment and are not expected to be repaid in the next twelve months from the reporting date. The loan bears interest rate of 3.03% to 3.30% (2015: 3.11% to 3.40%) per annum. Interest rate is repriced at intervals of less than twelve months.
Impairment loss and subsequent reversal were recognised in relation to the investment in Infinity Mall Trust (“IMT”). As at 31 December 2016, the Manager has assessed the recoverable amount of the Trust’s interest in IMT for impairment. A reversal of impairment loss amounting to $1,586,000 (2015: nil) was recognised in respect of the Trust’s investment in IMT taking into consideration the fair value of the underlying property held by IMT and the liabilities to be settled. The recoverable amount was assessed based on fair value less costs to sell estimated using the revalued net assets of IMT as at 31 December 2016 and categorised as Level 3 on the fair value hierarchy.
The key assumptions used in the estimation of the recoverable amount are set out below.
Trust
2016
%2015
%
Investment propertyCapitalisation rate 5.20 5.20Discount rate 7.50 7.75
The movement in the allowance for impairment loss in investment in IMT in respect of the year was as follows:
Trust
2016
$’0002015
$’000
At the beginning of the year 5,429 –Impairment loss recognised – 5,429Reversal of impairment loss (1,586) –
At the end of the year 3,843 5,429

175Overview
Business Review
Corporate Governance & Transparency
Portfolio Details
Sustainability
Financials & Additional Information
8 Associate and joint ventures (continued)
Details of the associate and joint ventures are as follows:
Name of associate and joint ventures
Place of constitution/incorporation/business
Effective equity interest held by the Trust
2016%
2015%
Associate1 CapitaLand Retail China Trust Singapore 14.1 14.6 Joint ventures1 RCS Trust Singapore 40.0 40.0Infinity Mall Trust and Infinity Office Trust Singapore 30.0 30.0
1 Audited by KPMG LLP Singapore
Associate
CapitaLand Retail China Trust
CapitaLand Retail China Trust (“CRCT”) is a real estate investment trust constituted in Singapore by a trust deed dated 23 October 2006 (as amended). CRCT was formally admitted to SGX-ST on 8 December 2006. CRCT is established with the objective of investing on a long term basis in a diversified portfolio of income producing real estate and primarily for retail purposes and located primarily in the People’s Republic of China (“China”).
On a recurring basis, as the results of CRCT are not expected to be announced in sufficient time to be included in the Group’s results for the same calendar quarter, the Group will equity account the results of CRCT based on a 3-month lag time.
At the reporting date, the fair value of both the Group’s and the Trust’s investment in CRCT is $168,106,000 (2015: $182,830,000) and categorised as Level 1 on the fair value hierarchy.
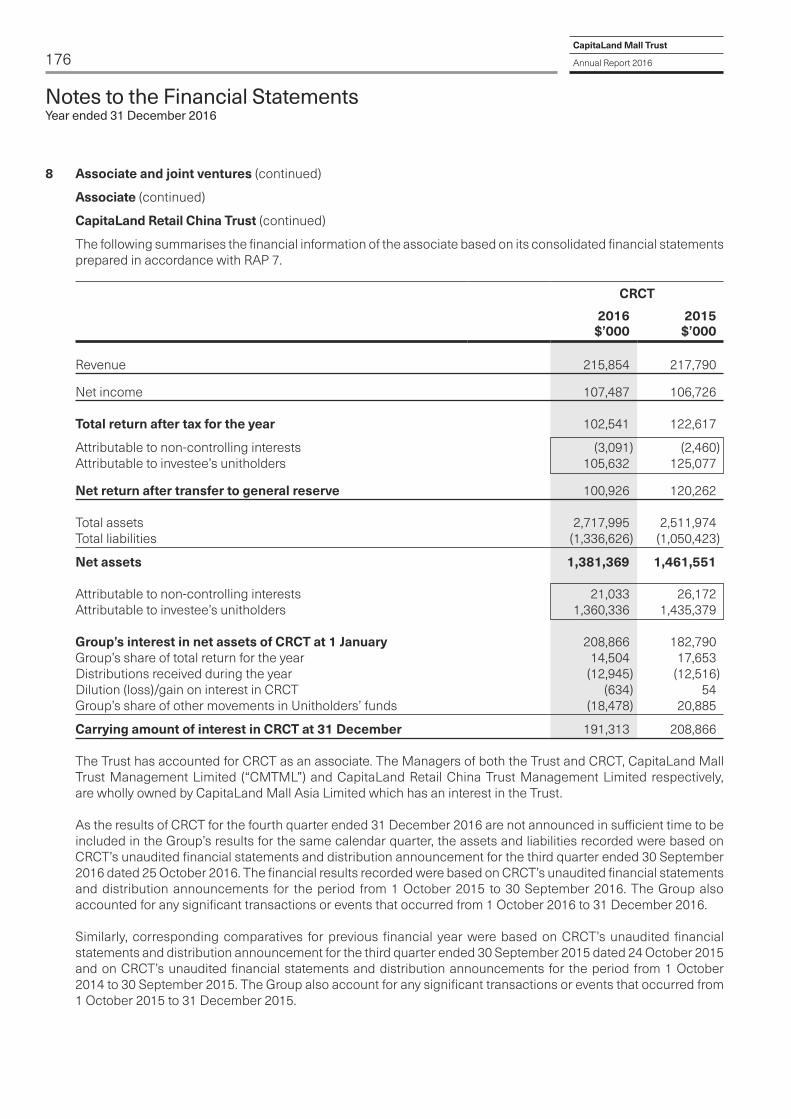
176CapitaLand Mall Trust
Annual Report 2016
Notes to the Financial StatementsYear ended 31 December 2016
8 Associate and joint ventures (continued)
Associate (continued)
CapitaLand Retail China Trust (continued)
The following summarises the financial information of the associate based on its consolidated financial statements prepared in accordance with RAP 7.
CRCT
2016
$’0002015
$’000
Revenue 215,854 217,790
Net income 107,487 106,726 Total return after tax for the year 102,541 122,617
Attributable to non-controlling interests (3,091) (2,460)Attributable to investee’s unitholders 105,632 125,077
Net return after transfer to general reserve 100,926 120,262 Total assets 2,717,995 2,511,974Total liabilities (1,336,626) (1,050,423)
Net assets 1,381,369 1,461,551 Attributable to non-controlling interests 21,033 26,172Attributable to investee’s unitholders 1,360,336 1,435,379 Group’s interest in net assets of CRCT at 1 January 208,866 182,790Group’s share of total return for the year 14,504 17,653Distributions received during the year (12,945) (12,516)Dilution (loss)/gain on interest in CRCT (634) 54Group’s share of other movements in Unitholders’ funds (18,478) 20,885
Carrying amount of interest in CRCT at 31 December 191,313 208,866
The Trust has accounted for CRCT as an associate. The Managers of both the Trust and CRCT, CapitaLand Mall Trust Management Limited (“CMTML”) and CapitaLand Retail China Trust Management Limited respectively, are wholly owned by CapitaLand Mall Asia Limited which has an interest in the Trust.
As the results of CRCT for the fourth quarter ended 31 December 2016 are not announced in sufficient time to be included in the Group’s results for the same calendar quarter, the assets and liabilities recorded were based on CRCT’s unaudited financial statements and distribution announcement for the third quarter ended 30 September 2016 dated 25 October 2016. The financial results recorded were based on CRCT’s unaudited financial statements and distribution announcements for the period from 1 October 2015 to 30 September 2016. The Group also accounted for any significant transactions or events that occurred from 1 October 2016 to 31 December 2016.
Similarly, corresponding comparatives for previous financial year were based on CRCT’s unaudited financial statements and distribution announcement for the third quarter ended 30 September 2015 dated 24 October 2015 and on CRCT’s unaudited financial statements and distribution announcements for the period from 1 October 2014 to 30 September 2015. The Group also account for any significant transactions or events that occurred from 1 October 2015 to 31 December 2015.

177Overview
Business Review
Corporate Governance & Transparency
Portfolio Details
Sustainability
Financials & Additional Information
8 Associate and joint ventures (continued)
Joint Ventures
RCS Trust
RCS Trust is an unlisted special purpose trust established under a trust deed (“RCS Trust Trust Deed”) dated 18 July 2006 entered into between HSBC Institutional Trust Services (Singapore) Limited as trustee-manager of RCS Trust (“RCS Trust Trustee-Manager”), HSBC Institutional Trust Services (Singapore) Limited as trustee of CapitaLand Commercial Trust (“CCT Trustee”), the Trustee, CapitaLand Commercial Trust Management Limited (CCTML as manager of CCT) and the Manager. RCS Trust is 40.0% owned by the Trust and 60.0% owned by CCT. RCS Trust is structured as a separate vehicle and the Group has a residual interest in its net assets. The Group has classified its interest in RCS Trust as a joint venture which is equity accounted. RCS Trust has entered into several service agreements in relation to the management of RCS Trust and its property operations. The fee structures of these services are as follows:
(a) Property management fees
Under the property management agreement, property management fees are charged as follows:
(i) 2.00% per annum of the property income of the property; and
(ii) 2.50% per annum of the net property income of the property.
The property management fees are payable monthly in arrears.
(b) Asset management fees
Pursuant to the RCS Trust Trust Deed, the asset management fees comprise a base component of 0.25% per annum of the value of deposited property of RCS Trust and a performance component of 4.00% per annum of the net property income of RCS Trust, including all its authorised investments for the time being held or deemed to be held upon the trusts of the RCS Trust Trust Deed.
The asset management fees shall be paid entirely in the form of units or, with the unanimous approval of the Manager and CCTML, either partly in units and partly in cash or wholly in cash.
The base and performance components of the asset management fees are payable quarterly and yearly in arrears respectively.
(c) RCS Trust Trustee-Manager’s fees
Pursuant to the RCS Trust Trust Deed, the RCS Trust Trustee-Manager’s fees shall not exceed 0.10% per annum of the value of Deposited Property of RCS Trust, as defined in the RCS Trust Trust Deed (subject to a minimum sum of $15,000 per month), payable out of the Deposited Property of RCS Trust. The RCS Trust Trustee-Manager is also entitled to reimbursement of expenses incurred in the performance of its duties under the RCS Trust Trust Deed.
The base and performance components of RCS Trust Trustee-Manager’s fees are payable quarterly and yearly in arrears respectively.
On 15 April 2016, RCS Trust Trustee-Manager entered into unsecured loan facility agreements with various banks which provide loan facilities of various maturities to refinance RCS Trust’s existing borrowings and for RCS Trust’s future general corporate and working capital purposes.

178CapitaLand Mall Trust
Annual Report 2016
8 Associate and joint ventures (continued)
Joint Ventures (continued)
RCS Trust (continued)
On 21 June 2016, RCS Trust has drawn down $1,069.5 million to repay the secured term loan and revolving credit facility granted by a special purpose company, Silver Oak Ltd. Following the repayment of the outstanding borrowings, the security granted by RCS Trust over its rights in relations to Raffles City Singapore has been discharged and released.
As at 31 December 2016, the total loans drawn down by RCS Trust is $1,100.0 million (2015: $1,044.0 million).
Infinity Mall Trust
Infinity Mall Trust is an unlisted special purpose trust established under a trust deed (“Infinity Mall Trust Trust Deed”) dated 25 May 2011 entered into between the Trustee, CMA Singapore Investments (4) Pte. Ltd., CL JM Pte. Ltd. and JG Trustee Pte. Ltd. (as trustee of Infinity Mall Trust). Infinity Mall Trust is 30.0% owned by the Trust, 50.0% by CMA Singapore Investments (4) Pte. Ltd. and 20.0% by CL JM Pte. Ltd. Infinity Mall Trust is structured as a separate vehicle and the Group has a residual interest in its net assets. Accordingly the Group has classified its interest in Infinity Mall Trust as a joint venture which is equity accounted.
Infinity Mall Trust owns Westgate which commenced operations on 2 December 2013. Infinity Mall Trust has entered into a property management agreement in relation to the management of Infinity Mall Trust and its property operations. The fee structure of these services is as follows:
(a) Property management fees
Under the property management agreement, property management fees are charged as follows:
(i) 2.00% per annum of the gross revenue of the property;
(ii) 2.00% per annum of the net property income of the property; and
(iii) 0.50% per annum of the net property income of the property, in lieu of leasing commissions.
The property management fees are payable monthly in arrears.
(b) Trustee fees
Pursuant to the Infinity Mall Trust Trust Deed, the Infinity Mall Trust Trustee’s fees are $2,000 per annum. JG Trustee Pte. Ltd. is also entitled to reimbursement of expenses incurred in the performance of its duties under Infinity Mall Trust Trust Deed.
JG Trustee Pte. Ltd.’s fees are payable annually in arrears.
Infinity Office Trust
Infinity Office Trust is an unlisted special purpose trust established under a trust deed (“Infinity Office Trust Trust Deed”) dated 25 May 2011 entered into between the Trustee, CMA Singapore Investments (5) Pte. Ltd., CL JO Pte. Ltd. and JG2 Trustee Pte. Ltd. (as trustee of Infinity Office Trust). Infinity Office Trust is 30.0% owned by the Trust, 50.0% by CMA Singapore Investments (5) Pte. Ltd. and 20.0% by CL JO Pte. Ltd. Infinity Office Trust is structured as a separate vehicle and the Group has a residual interest in its net assets. Accordingly the Group has classified its interest in Infinity Office Trust as a joint venture which is equity accounted.
On 23 January 2014, JG2 Trustee Pte. Ltd., in its capacity as trustee of Infinity Office Trust and JG Trustee Pte. Ltd., in its capacity as trustee of Infinity Mall Trust entered into a sale and purchase agreement to sell all the office strata units in Westgate Tower to Westgate Commercial Pte. Ltd. and Westgate Tower Pte. Ltd. for an aggregate consideration of $579.4 million. On 20 October 2016, the strata titles of the office strata units were issued and the sale of all the office strata units in Westgate Tower was completed.
Notes to the Financial StatementsYear ended 31 December 2016

179Overview
Business Review
Corporate Governance & Transparency
Portfolio Details
Sustainability
Financials & Additional Information
8 Associate and joint ventures (continued)
Joint Ventures (continued)
The following summarises the financial information of the Group’s material joint venture based on its financial statements prepared in accordance with RAP 7. The table also includes summarised financial information for the Group’s interest in immaterial joint ventures, based on amounts reported in the Group’s consolidated financial statements.
RCS
$’000
Immaterial joint
ventures$’000
Total$’000
2016
Revenue 234,613
Net income 130,350
Total return for the year(a) 111,611 (a) Includes: - depreciation and amortisation (2,191) - interest income 30 - interest expense (27,111) - income tax expense – Non-current assets 3,169,963 Current assets(b) 43,424 Non-current liabilities(c) (1,118,172) Current liabilities(d) (103,197)
Net assets 1,992,018 (b) Includes cash and cash equivalents 38,457 (c) Includes non-current financial liabilities (excluding trade and other payables and provisions) (1,118,172) (d) Includes current financial liabilities (excluding trade and other payables and provisions) (10,733) Group’s interest in net assets of joint ventures at beginning of the year 804,153 165,389 969,542
Group’s share of total return for the year 44,644 Distributions received during the year (59,213) Group’s share of movement in Unitholders’ funds 3,613
Group’s share of total return and movement in Unitholders’ funds (10,956) (14,437) (25,393)
Carrying amount of interest in joint ventures at end of the year 793,197 150,952 944,149
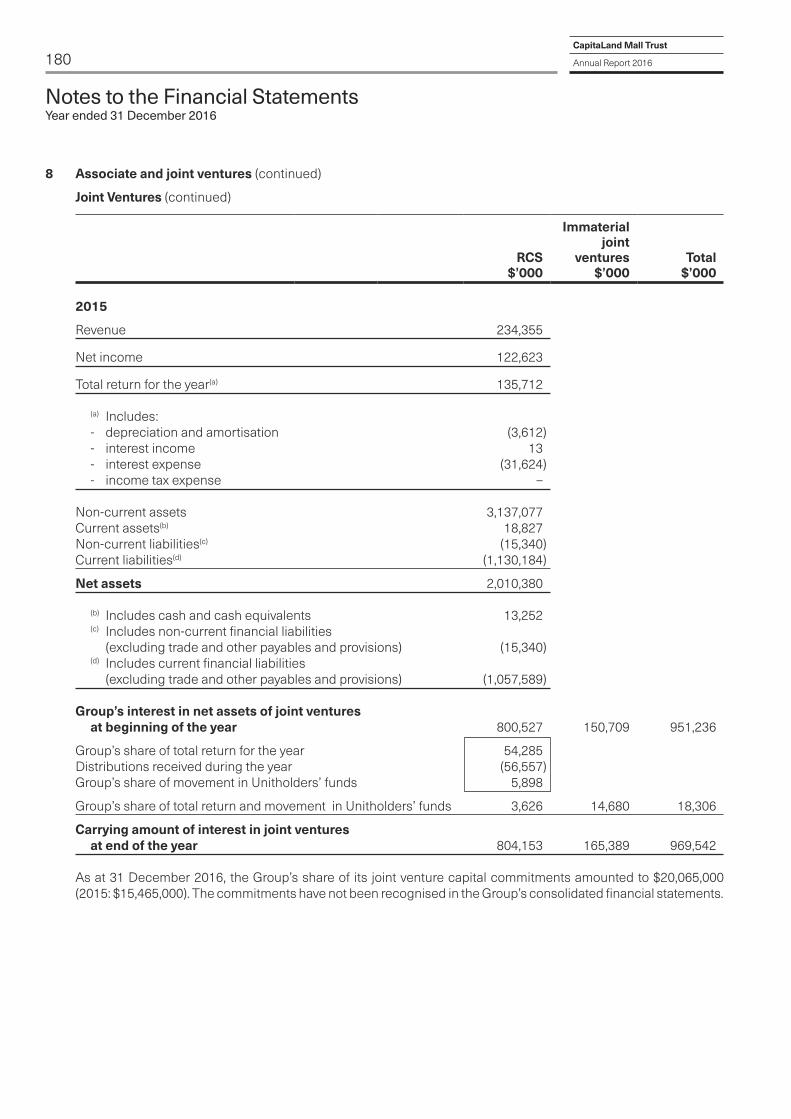
180CapitaLand Mall Trust
Annual Report 2016
8 Associate and joint ventures (continued)
Joint Ventures (continued)
RCS
$’000
Immaterial joint
ventures$’000
Total$’000
2015
Revenue 234,355
Net income 122,623
Total return for the year(a) 135,712 (a) Includes: - depreciation and amortisation (3,612) - interest income 13 - interest expense (31,624) - income tax expense – Non-current assets 3,137,077 Current assets(b) 18,827 Non-current liabilities(c) (15,340) Current liabilities(d) (1,130,184)
Net assets 2,010,380 (b) Includes cash and cash equivalents 13,252 (c) Includes non-current financial liabilities (excluding trade and other payables and provisions) (15,340) (d) Includes current financial liabilities (excluding trade and other payables and provisions) (1,057,589) Group’s interest in net assets of joint ventures at beginning of the year 800,527 150,709 951,236
Group’s share of total return for the year 54,285 Distributions received during the year (56,557) Group’s share of movement in Unitholders’ funds 5,898
Group’s share of total return and movement in Unitholders’ funds 3,626 14,680 18,306
Carrying amount of interest in joint ventures at end of the year 804,153 165,389 969,542
As at 31 December 2016, the Group’s share of its joint venture capital commitments amounted to $20,065,000 (2015: $15,465,000). The commitments have not been recognised in the Group’s consolidated financial statements.
Notes to the Financial StatementsYear ended 31 December 2016

181Overview
Business Review
Corporate Governance & Transparency
Portfolio Details
Sustainability
Financials & Additional Information
9 Financial derivatives
Group
2016
$’0002015
$’000
Non-current assets Cross currency swaps 162,685 175,280 Non-current liabilities Cross currency swaps 30,945 41,731
Cross currency swaps
The Group enters into cross currency swaps (“CCS”) to manage its foreign currency risk arising from its foreign currency borrowings. The Group has designated the cross currency swaps as hedging instruments in cash flow hedges.
As at 31 December 2016, the Group held CCS with a total notional amount of $1,680,962,800 (2015: $1,581,954,800) to provide Singapore dollar fixed rate funding for terms of 6 to 12 years (2015: 6 to 12 years).
Offsettingfinancialassetsandfinancialliabilities
The disclosures set out in the tables below include financial assets and financial liabilities that are subject to an enforceable master netting arrangement, irrespective of whether they are offset in the Statement of Financial Position.
The Group entered into International Swaps and Derivatives Association (“ISDA”) Master Agreements with various bank counterparties (“ISDA Master Agreement”). In certain circumstances following the occurrence of a termination event as set out in an ISDA Master Agreement, all outstanding transactions under such ISDA Master Agreement may be terminated and the early termination amount payable to one party under such agreements may be offset against amounts payable to the other party such that only a single net amount is due or payable in settlement of all transactions.
In accordance with accounting standards, the swaps presented below are not offset in the Statement of Financial Position as the right of set-off of recognised amounts is enforceable only following the occurrence of a termination event as set out in such ISDA Master Agreement. In addition the Group and its counterparties do not intend to settle on a net basis or to realise the assets and settle the liabilities simultaneously.
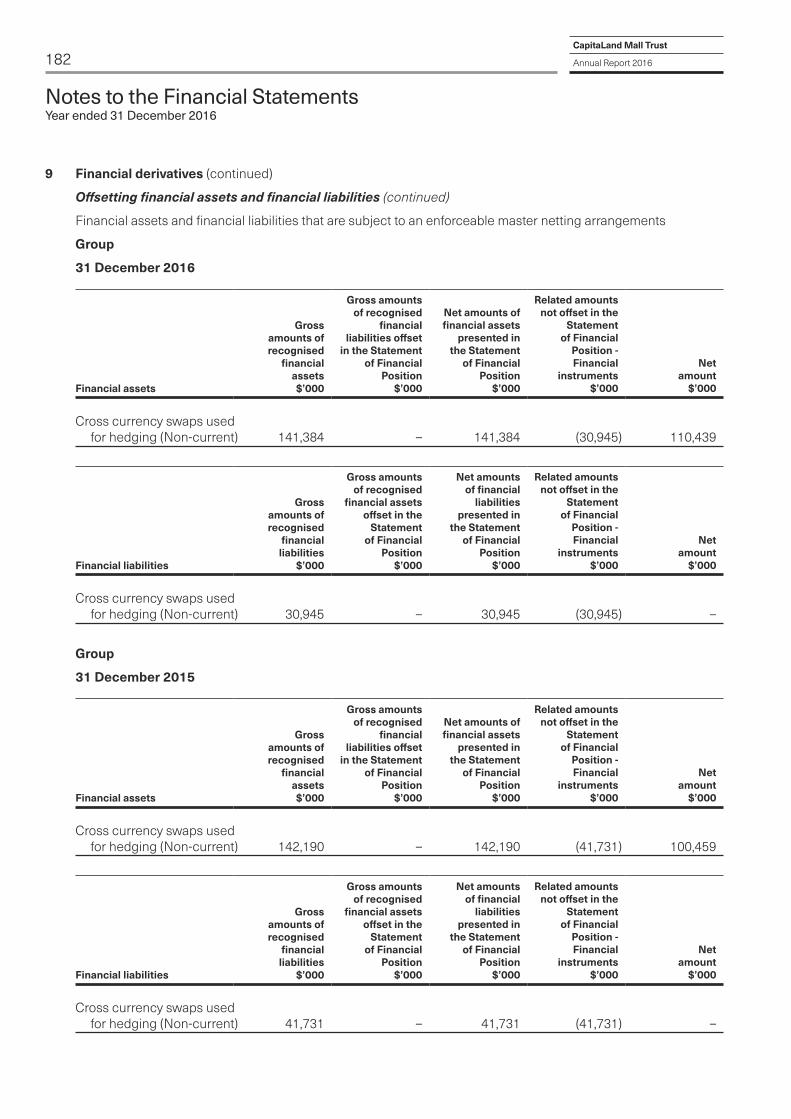
182CapitaLand Mall Trust
Annual Report 2016
9 Financial derivatives (continued)
Offsettingfinancialassetsandfinancialliabilities (continued)
Financial assets and financial liabilities that are subject to an enforceable master netting arrangements
Group
31 December 2016
Financial assets
Grossamounts ofrecognised
financialassets$’000
Gross amounts of recognised
financial liabilities offset
in the Statementof Financial
Position$’000
Net amounts offinancial assets
presented inthe Statement
of FinancialPosition
$’000
Related amounts not offset in the
Statementof Financial
Position -Financial
instruments$’000
Netamount
$’000
Cross currency swaps used for hedging (Non-current) 141,384 – 141,384 (30,945) 110,439
Financial liabilities
Grossamounts ofrecognised
financialliabilities
$’000
Gross amounts of recognised
financial assetsoffset in the
Statementof Financial
Position$’000
Net amounts of financial
liabilitiespresented in
the Statementof Financial
Position$’000
Related amounts not offset in the
Statementof Financial
Position - Financial
instruments$’000
Netamount
$’000
Cross currency swaps used for hedging (Non-current) 30,945 – 30,945 (30,945) –
Group
31 December 2015
Financial assets
Grossamounts ofrecognised
financialassets$’000
Gross amounts of recognised
financial liabilities offset
in the Statementof Financial
Position$’000
Net amounts offinancial assets
presented inthe Statement
of FinancialPosition
$’000
Related amounts not offset in the
Statementof Financial
Position -Financial
instruments$’000
Netamount
$’000
Cross currency swaps used for hedging (Non-current) 142,190 – 142,190 (41,731) 100,459
Financial liabilities
Grossamounts ofrecognised
financialliabilities
$’000
Gross amounts of recognised
financial assetsoffset in the
Statementof Financial
Position$’000
Net amounts of financial
liabilitiespresented in
the Statementof Financial
Position$’000
Related amounts not offset in the
Statementof Financial
Position - Financial
instruments$’000
Netamount
$’000
Cross currency swaps used for hedging (Non-current) 41,731 – 41,731 (41,731) –
Notes to the Financial StatementsYear ended 31 December 2016

183Overview
Business Review
Corporate Governance & Transparency
Portfolio Details
Sustainability
Financials & Additional Information
9 Financial derivatives (continued)
Offsettingfinancialassetsandfinancialliabilities (continued)
Financial assets and financial liabilities that are subject to an enforceable master netting arrangements (continued)
The tables below reconcile the ‘Net amounts of financial assets and financial liabilities presented in Statement of Financial Position’, as set out above, to the line items presented in the Statement of Financial Position.
Group
31 December 2016
Financial assets
Net amounts offinancial assets
presented in the Statement of
Financial Position$’000
Line item in Statement of
Financial Position
Carryingamount inStatement
of FinancialPosition
$’000
Financialassets not
in scope ofoffsetting
disclosures$’000
Cross currency swaps used Non-current for hedging 141,384 financial derivatives 162,685 21,301
Financial liabilities
Net amounts of financial liabilities
presented in the Statement of
Financial Position$’000
Line item in Statement of
Financial Position
Carryingamount inStatement
of FinancialPosition
$’000
Financialliabilities
not in scope of offsetting
disclosures$’000
Cross currency swaps used Non-current for hedging 30,945 financial derivatives 30,945 –
Group
31 December 2015
Financial assets
Net amounts offinancial assets
presented in the Statement of
Financial Position$’000
Line item in Statement of
Financial Position
Carryingamount inStatement
of FinancialPosition
$’000
Financialassets not
in scope ofoffsetting
disclosures$’000
Cross currency swaps used Non-current for hedging 142,190 financial derivatives 175,280 33,090
Financial liabilities
Net amounts of financial liabilities
presented in the Statement of
Financial Position$’000
Line item in Statement of
Financial Position
Carryingamount inStatement
of FinancialPosition
$’000
Financialliabilities
not in scope of offsetting
disclosures$’000
Cross currency swaps used Non-current for hedging 41,731 financial derivatives 41,731 –

184CapitaLand Mall Trust
Annual Report 2016
9 Financial derivatives (continued)
The following table indicates the periods of cash flows associated with financial derivatives:
Cash flows
Carrying amount
$’000
Contractual cash flows
$’000
Within1 year$’000
Within1 to 5 years$’000
More than
5 years$’000
Group
2016Derivative financial assets Cross currency swaps (gross-settled) 162,685 - Inflow 1,945,332 49,380 907,911 988,041- Outflow (1,778,404) (49,204) (826,616) (902,584)
162,685 166,928 176 81,295 85,457
Derivative financial liabilities Cross currency swaps (gross-settled) (30,945) - Inflow 138,285 1,647 136,638 –- Outflow (170,718) (4,384) (166,334) –
(30,945) (32,433) (2,737) (29,696) –
2015Derivative financial assets Cross currency swaps (gross-settled) 175,280 - Inflow 1,680,372 44,500 698,797 937,075- Outflow (1,479,013) (40,640) (625,431) (812,942)
175,280 201,359 3,860 73,366 124,133
Derivative financial liabilities Cross currency swaps (gross-settled) (41,731) - Inflow 348,145 3,145 275,727 69,273- Outflow (393,077) (10,340) (320,250) (62,487)
(41,731) (44,932) (7,195) (44,523) 6,786
Notes to the Financial StatementsYear ended 31 December 2016

185Overview
Business Review
Corporate Governance & Transparency
Portfolio Details
Sustainability
Financials & Additional Information
10 Trade and other receivables
Group Trust
2016
$’0002015
$’0002016
$’0002015
$’000
Trade receivables 7,197 6,535 6,588 6,179Deposits 2,634 3,121 683 660Interest receivables 660 1,092 626 1,053Amounts due from related parties (trade) 17,012 16,322 16,995 16,322Amount due from subsidiary (trade) – – 5,184 3,141Other receivables 5,337 1,079 10,847 878
Loans and receivables 32,840 28,149 40,923 28,233Prepayments 877 643 850 632
33,717 28,792 41,773 28,865
Concentration of credit risk relating to trade receivables is limited due to the Group’s many varied tenants. These tenants comprise retailers engaged in a wide variety of consumer trades. The Group’s historical experience in the collection of accounts receivable falls within the recorded allowances. Due to these factors, the Manager believes that no additional credit risk beyond amounts provided for collection losses is inherent in the Group’s trade receivables.
The maximum exposure to credit risk for trade receivables at the reporting date (by type of consumers) is:
Group Trust
2016
$’0002015
$’0002016
$’0002015
$’000
Retail 7,130 6,449 6,521 6,093Warehouse 67 75 67 75Office – 11 – 11
7,197 6,535 6,588 6,179 The Group’s most significant tenant accounts for $781,000 (2015: $297,000) of the trade receivables carrying amount as at the reporting date.

186CapitaLand Mall Trust
Annual Report 2016
10 Trade and other receivables (continued)
Impairmentlosses
The ageing of receivables at the reporting date is:
Group Trust
Gross$’000
Impairment loss
$’000Gross$’000
Impairment loss
$’000
2016Not past due 4,850 – 4,380 –Past due 31 – 60 days 1,304 – 1,177 –Past due 61 – 90 days 512 – 500 –Over 90 days 531 – 531 –
7,197 – 6,588 –
2015Not past due 5,131 – 4,855 –Past due 31 – 60 days 1,283 2 1,229 2Past due 61 – 90 days 99 – 95 –Over 90 days 42 18 20 18
6,555 20 6,199 20
The movement in the allowance for impairment in respect of trade and other receivables during the year was as follows:
Group and Trust
2016$’000
2015$’000
At 1 January 20 –Impairment loss recognised – 20Reversal of impairment loss (4) –Amount written off (16) –
At 31 December – 20
The Manager believes that, apart from the above, no impairment allowance is necessary in respect of the remaining trade receivables as these receivables arose mainly from tenants that have a good record with the Group and have sufficient security deposits as collateral.
Notes to the Financial StatementsYear ended 31 December 2016

187Overview
Business Review
Corporate Governance & Transparency
Portfolio Details
Sustainability
Financials & Additional Information
11 Cash and cash equivalents
Group Trust
2016
$’0002015
$’0002016
$’0002015
$’000
Cash at bank and in hand 8,525 8,258 7,977 8,006Fixed deposits with financial institutions 474,937 596,052 442,037 562,647
Cash and cash equivalents in the statements of cash flows 483,462 604,310 450,014 570,653 The weighted average effective interest rate relating to cash and cash equivalents at the reporting date for the Group and Trust are 1.07% (2015: 1.27%) and 1.09% (2015: 1.35%) per annum respectively.
12 Trade and other payables
Group Trust
2016
$’0002015
$’0002016
$’0002015
$’000
Trade payables and accrued operating expenses 87,076 90,415 77,274 81,912Amounts due to related parties (trade) 32,079 15,451 29,087 14,083Deposits and advances 13,510 13,269 12,609 12,342Interest payable 27,672 25,295 27,672 25,295
160,337 144,430 146,642 133,632
Included in the amounts due to related parties (trade) of the Group are mainly amounts due to the Manager of $26,991,000 (2015: $11,217,000) and the Property Manager of $2,433,000 (2015: $2,642,000). Included in the amounts due to related parties (trade) of the Trust are mainly amounts due to the Manager of $24,580,000 (2015: $10,295,000) and the Property Manager of $2,061,000 (2015: $2,251,000).
Included in the trade payables and accrued operating expenses of the Group and the Trust is an amount due to the Trustee of $310,000 (2015: $316,000).

188CapitaLand Mall Trust
Annual Report 2016
13 Interest-bearing borrowings
Group Trust
2016
$’0002015
$’0002016
$’0002015
$’000
Current liabilities Medium term notes (“MTN notes”) 250,000 – – –Term loans – – 250,000 –
250,000 – 250,000 –
Non-current liabilities MTN notes 1,523,679 1,396,631 – –Euro-Medium term notes (“EMTN notes”) 1,082,473 1,052,793 – –Retail bonds 350,000 350,000 350,000 350,000Bank loans 87,990 518,998 87,990 518,998Term loans – – 2,480,963 2,381,955Unamortised transaction costs (5,830) (6,266) (5,830) (6,266)
3,038,312 3,312,156 2,913,123 3,244,687
Total interest-bearing borrowings 3,288,312 3,312,156 3,163,123 3,244,687
Notes to the Financial StatementsYear ended 31 December 2016
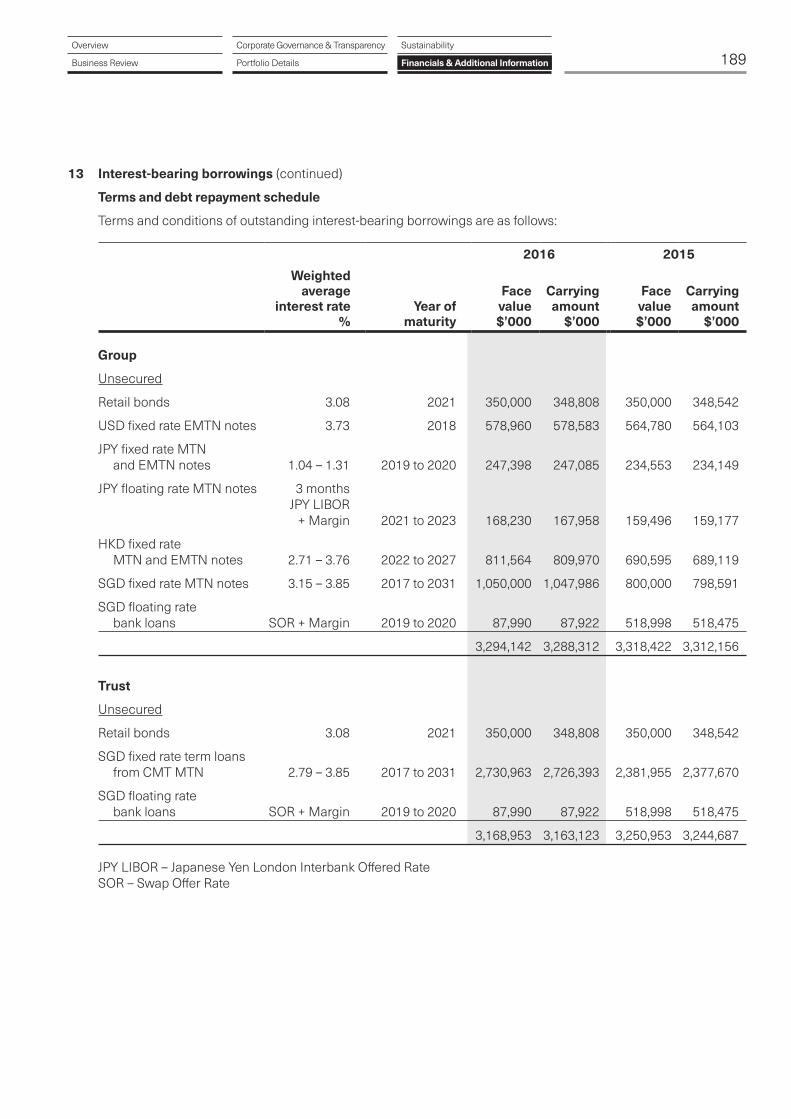
189Overview
Business Review
Corporate Governance & Transparency
Portfolio Details
Sustainability
Financials & Additional Information
13 Interest-bearing borrowings (continued)
Terms and debt repayment schedule
Terms and conditions of outstanding interest-bearing borrowings are as follows:
2016 2015
Weighted average
interest rate%
Year of maturity
Facevalue$’000
Carrying amount
$’000
Facevalue$’000
Carrying amount
$’000
Group
Unsecured
Retail bonds 3.08 2021 350,000 348,808 350,000 348,542
USD fixed rate EMTN notes 3.73 2018 578,960 578,583 564,780 564,103
JPY fixed rate MTN and EMTN notes 1.04 – 1.31 2019 to 2020 247,398 247,085 234,553 234,149
JPY floating rate MTN notes 3 months JPY LIBOR + Margin 2021 to 2023 168,230 167,958 159,496 159,177
HKD fixed rate MTN and EMTN notes 2.71 – 3.76 2022 to 2027 811,564 809,970 690,595 689,119
SGD fixed rate MTN notes 3.15 – 3.85 2017 to 2031 1,050,000 1,047,986 800,000 798,591
SGD floating rate bank loans SOR + Margin 2019 to 2020 87,990 87,922 518,998 518,475
3,294,142 3,288,312 3,318,422 3,312,156
Trust
Unsecured
Retail bonds 3.08 2021 350,000 348,808 350,000 348,542
SGD fixed rate term loans from CMT MTN 2.79 – 3.85 2017 to 2031 2,730,963 2,726,393 2,381,955 2,377,670
SGD floating rate bank loans SOR + Margin 2019 to 2020 87,990 87,922 518,998 518,475
3,168,953 3,163,123 3,250,953 3,244,687
JPY LIBOR – Japanese Yen London Interbank Offered RateSOR – Swap Offer Rate

190CapitaLand Mall Trust
Annual Report 2016
13 Interest-bearing borrowings (continued)
Terms and debt repayment schedule (continued)
The following are the expected contractual undiscounted cash outflows of financial liabilities including interest payments and excluding the impact of netting agreements:
Cash flows
Carrying amount
$’000
Contractual cash flows
$’000
Within 1 year$’000
Within 1 to 5 years$’000
More than
5 years$’000
Group
2016Non-derivative financial liabilities Unsecured Retail bonds 348,808 398,584 10,780 387,804 –USD fixed rate EMTN notes 578,583 611,273 21,601 589,672 –JPY fixed rate MTN and EMTN notes 247,085 257,387 2,896 254,491 –JPY floating rate MTN notes 167,958 171,599 528 64,154 106,917HKD fixed rate MTN and EMTN notes 809,970 1,010,149 25,926 103,943 880,280SGD fixed rate MTN notes 1,047,986 1,307,151 284,974 207,886 814,291SGD floating rate bank loans 87,922 94,431 1,917 92,514 –Trade and other payables 160,337 160,337 160,337 – –Security deposits 153,747 153,747 54,722 96,869 2,156
3,602,396 4,164,658 563,681 1,797,333 1,803,644 2015Non-derivative financial liabilities Unsecured Retail bonds 348,542 409,393 10,810 43,150 355,433USD fixed rate EMTN notes 564,103 617,431 21,130 596,301 –JPY fixed rate MTN and EMTN notes 234,149 246,797 2,773 244,024 –JPY floating rate MTN notes 159,177 164,796 662 2,986 161,148HKD fixed rate MTN and EMTN notes 689,119 879,619 22,723 90,375 766,521SGD fixed rate MTN notes 798,591 976,919 28,470 434,146 514,303SGD floating rate bank loans 518,475 568,696 12,916 555,780 –Trade and other payables 144,430 144,430 144,430 – –Security deposits 160,701 160,701 55,300 102,972 2,429
3,617,287 4,168,782 299,214 2,069,734 1,799,834
Notes to the Financial StatementsYear ended 31 December 2016

191Overview
Business Review
Corporate Governance & Transparency
Portfolio Details
Sustainability
Financials & Additional Information
13 Interest-bearing borrowings (continued)
Terms and debt repayment schedule (continued)
Cash flows
Carrying amount
$’000
Contractual cash flows
$’000
Within 1 year$’000
Within 1 to 5 years$’000
More than
5 years$’000
Trust
2016Non-derivative financial liabilities Unsecured Retail bonds 348,808 398,584 10,780 387,804 –SGD fixed rate term loans 2,726,393 3,256,274 338,562 1,200,837 1,716,875SGD floating rate bank loans 87,922 94,431 1,917 92,514 –Trade and other payables 146,642 146,642 146,642 – –Security deposits 139,844 139,844 45,426 92,263 2,155
3,449,609 4,035,775 543,327 1,773,418 1,719,030 2015Non-derivative financial liabilities Unsecured Retail bonds 348,542 409,393 10,810 43,150 355,433SGD fixed rate term loans 2,377,670 2,849,010 79,451 1,379,827 1,389,732SGD floating rate bank loans 518,475 568,696 12,916 555,780 –Trade and other payables 133,632 133,632 133,632 – –Security deposits 147,156 147,156 54,466 90,261 2,429
3,525,475 4,107,887 291,275 2,069,018 1,747,594
The interest-bearing borrowings comprise the following:
(1) Unsecured retail bonds of the Trust
On 20 February 2014, the Trustee issued $350.0 million in principal amount of bonds under the $2.5 billion Retail Bond Programme which carry an interest of 3.08% per annum, fully repayable on 20 February 2021.
(2) Unsecured bank loans of the Trust
As at 31 December 2016, the Trust has drawn on $88.0 million (2015: $519.0 million) of unsecured bank loans with maturities of between 4 to 5 years (2015: 2 to 5 years) from various banks.
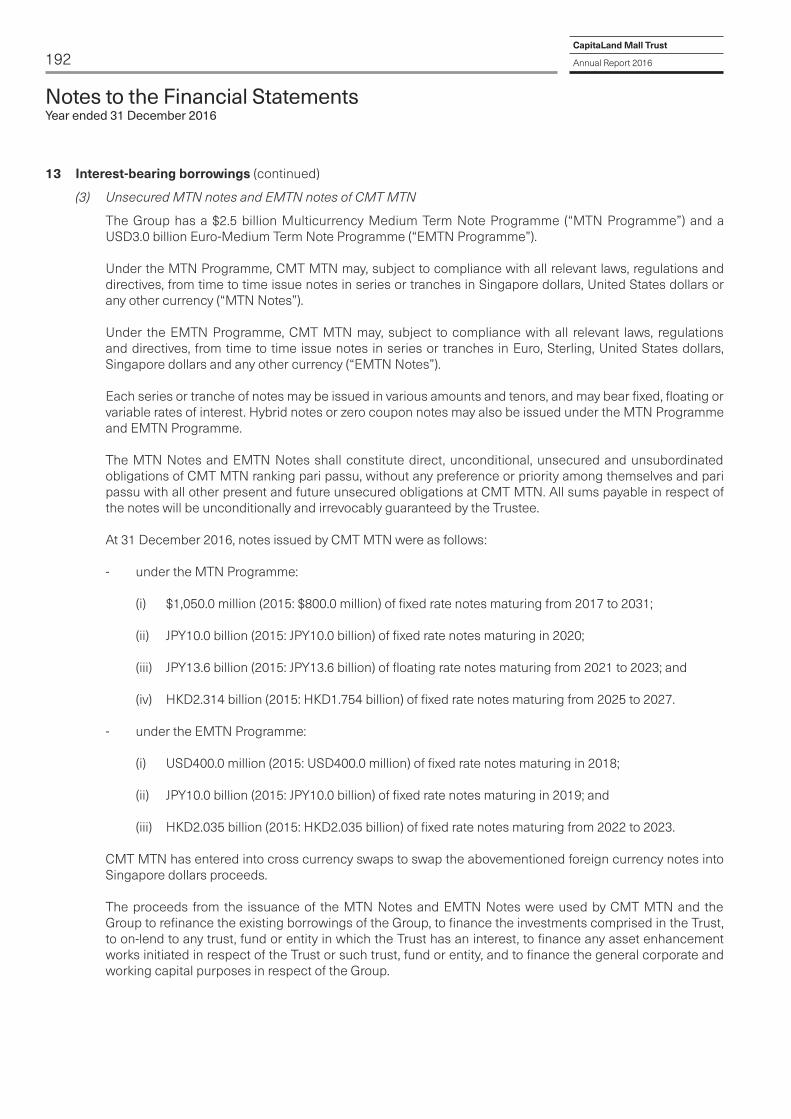
192CapitaLand Mall Trust
Annual Report 2016
13 Interest-bearing borrowings (continued)
(3) Unsecured MTN notes and EMTN notes of CMT MTN
The Group has a $2.5 billion Multicurrency Medium Term Note Programme (“MTN Programme”) and a USD3.0 billion Euro-Medium Term Note Programme (“EMTN Programme”). Under the MTN Programme, CMT MTN may, subject to compliance with all relevant laws, regulations and directives, from time to time issue notes in series or tranches in Singapore dollars, United States dollars or any other currency (“MTN Notes”).
Under the EMTN Programme, CMT MTN may, subject to compliance with all relevant laws, regulations and directives, from time to time issue notes in series or tranches in Euro, Sterling, United States dollars, Singapore dollars and any other currency (“EMTN Notes”).
Each series or tranche of notes may be issued in various amounts and tenors, and may bear fixed, floating or variable rates of interest. Hybrid notes or zero coupon notes may also be issued under the MTN Programme and EMTN Programme.
The MTN Notes and EMTN Notes shall constitute direct, unconditional, unsecured and unsubordinated obligations of CMT MTN ranking pari passu, without any preference or priority among themselves and pari passu with all other present and future unsecured obligations at CMT MTN. All sums payable in respect of the notes will be unconditionally and irrevocably guaranteed by the Trustee.
At 31 December 2016, notes issued by CMT MTN were as follows:
- under the MTN Programme:
(i) $1,050.0 million (2015: $800.0 million) of fixed rate notes maturing from 2017 to 2031;
(ii) JPY10.0 billion (2015: JPY10.0 billion) of fixed rate notes maturing in 2020;
(iii) JPY13.6 billion (2015: JPY13.6 billion) of floating rate notes maturing from 2021 to 2023; and
(iv) HKD2.314 billion (2015: HKD1.754 billion) of fixed rate notes maturing from 2025 to 2027.
- under the EMTN Programme:
(i) USD400.0 million (2015: USD400.0 million) of fixed rate notes maturing in 2018;
(ii) JPY10.0 billion (2015: JPY10.0 billion) of fixed rate notes maturing in 2019; and
(iii) HKD2.035 billion (2015: HKD2.035 billion) of fixed rate notes maturing from 2022 to 2023.
CMT MTN has entered into cross currency swaps to swap the abovementioned foreign currency notes into Singapore dollars proceeds.
The proceeds from the issuance of the MTN Notes and EMTN Notes were used by CMT MTN and the Group to refinance the existing borrowings of the Group, to finance the investments comprised in the Trust, to on-lend to any trust, fund or entity in which the Trust has an interest, to finance any asset enhancement works initiated in respect of the Trust or such trust, fund or entity, and to finance the general corporate and working capital purposes in respect of the Group.
Notes to the Financial StatementsYear ended 31 December 2016

193Overview
Business Review
Corporate Governance & Transparency
Portfolio Details
Sustainability
Financials & Additional Information
14 Units in issue
Group and Trust
2016 ’000
2015 ’000
Units in issue: At 1 January 3,541,169 3,462,180Units created: - payment of asset management fees in relation to the Trust’s 40.0% interest in RCS Trust 1,901 2,888 - payment in relation to the acquisition of BMT - partial consideration – 72,000 - acquisition fees – 4,101
Total issued units at 31 December 3,543,070 3,541,169
Each unit in the Trust represents an undivided interest in the Trust. The rights and interests of Unitholders are contained in the Trust Deed and include the right to:
• Receive income and other distributions attributable to the units held;
• Participate in the termination of the Trust by receiving a share of all net cash proceeds derived from the realisation of the assets of the Trust less any liabilities, in accordance with their proportionate interests in the Trust. However, a Unitholder has no equitable or proprietary interest in the underlying assets of the Trust and is not entitled to the transfer to it of any assets (or part thereof) or of any estate or interest in any asset (or part thereof) of the Trust;
• Attend all Unitholders meetings. The Trustee or the Manager may (and the Manager shall at the request in writing of not less than 50 Unitholders or one-tenth in number of the Unitholders, whichever is lesser) at any time convene a meeting of Unitholders in accordance with the provisions of the Trust Deed; and
• One vote per unit.
The restrictions of a Unitholder include the following:
• A Unitholder’s right is limited to the right to require due administration of the Trust in accordance with the provisions of the Trust Deed; and
• A Unitholder has no right to request the Manager to redeem his units while the units are listed on SGX-ST.
A Unitholder’s liability is limited to the amount paid or payable for any units in the Trust. The provisions of the Trust Deed provide that no Unitholders will be personally liable for indemnifying the Trustee or any creditor of the Trustee in the event that liabilities of the Trust exceed its assets.
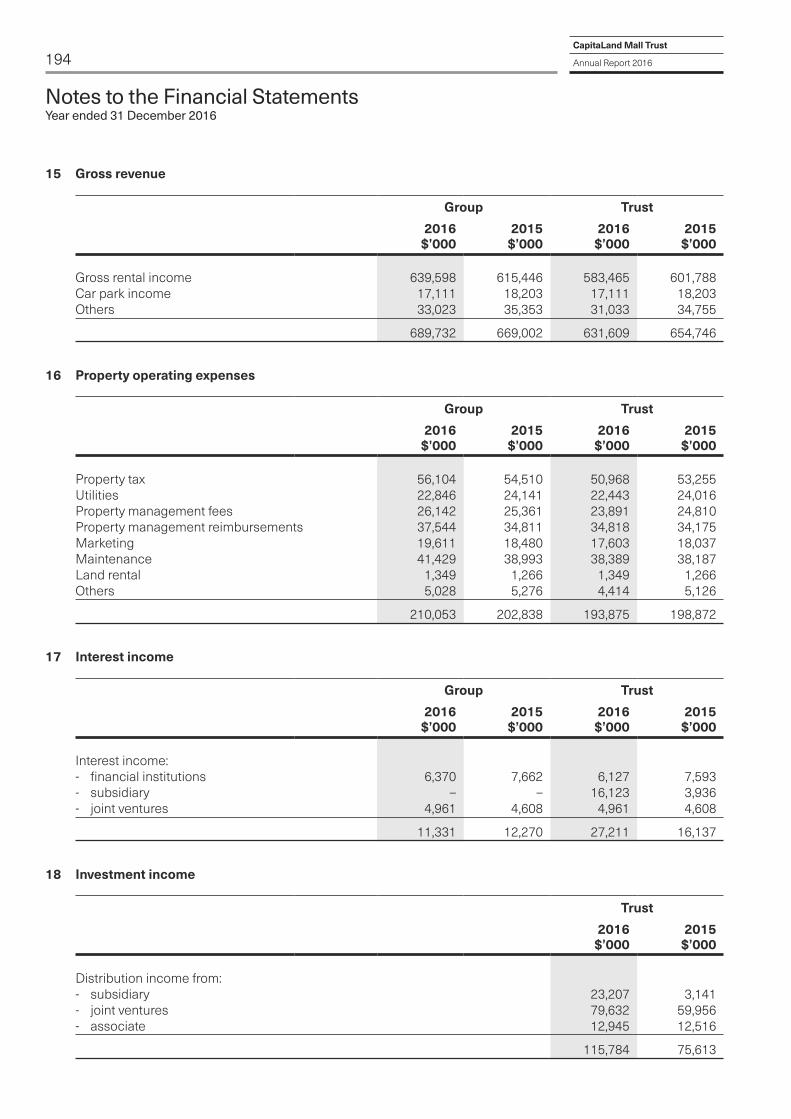
194CapitaLand Mall Trust
Annual Report 2016
15 Gross revenue
Group Trust
2016
$’0002015
$’0002016
$’0002015
$’000
Gross rental income 639,598 615,446 583,465 601,788Car park income 17,111 18,203 17,111 18,203Others 33,023 35,353 31,033 34,755
689,732 669,002 631,609 654,746
16 Property operating expenses
Group Trust
2016
$’0002015
$’0002016
$’0002015
$’000
Property tax 56,104 54,510 50,968 53,255Utilities 22,846 24,141 22,443 24,016Property management fees 26,142 25,361 23,891 24,810Property management reimbursements 37,544 34,811 34,818 34,175Marketing 19,611 18,480 17,603 18,037Maintenance 41,429 38,993 38,389 38,187Land rental 1,349 1,266 1,349 1,266Others 5,028 5,276 4,414 5,126
210,053 202,838 193,875 198,872
17 Interest income
Group Trust
2016
$’0002015
$’0002016
$’0002015
$’000
Interest income: - financial institutions 6,370 7,662 6,127 7,593- subsidiary – – 16,123 3,936- joint ventures 4,961 4,608 4,961 4,608
11,331 12,270 27,211 16,137
18 Investment income
Trust
2016
$’0002015
$’000
Distribution income from: - subsidiary 23,207 3,141- joint ventures 79,632 59,956- associate 12,945 12,516
115,784 75,613
Notes to the Financial StatementsYear ended 31 December 2016

195Overview
Business Review
Corporate Governance & Transparency
Portfolio Details
Sustainability
Financials & Additional Information
19 Asset management fees
Group Trust
2016
$’0002015
$’0002016
$’0002015
$’000
Base fees 23,541 22,414 21,360 21,898Performance fees 21,078 19,764 19,311 19,358
44,619 42,178 40,671 41,256
20 Finance costs
Group and Trust
2016
$’0002015
$’000
Interest expense 103,566 101,445Transaction costs 2,752 2,377
106,318 103,822
21 Gain on disposal of investment property
Gain on disposal of investment property relates to the sale of Rivervale Mall with legal completion on 15 December 2015.
22 Income tax expense
Group Trust
2016
$’0002015
$’0002016
$’0002015
$’000
Current tax expense Current year – – – –Under provision in prior years1 1,026 575 1,026 575
1,026 575 1,026 575
Reconciliationofeffectivetaxrate Net income 402,557 400,610 429,934 398,933 Tax calculated using Singapore tax rate of 17% (2015: 17%) 68,435 68,104 73,089 67,819Effects of results of equity-accounted investees presented net of tax (734) (2,017) – –(Tax deductible)/non-tax deductible items, net (739) 355 (1,019) 751Income not subject to tax – – (5,108) (2,128)Tax transparency (66,962) (66,442) (66,962) (66,442)Under provision in prior years 1,026 575 1,026 575
1,026 575 1,026 575
1 In 2016 and 2015, these relate to tax assessed on the Trust by the Inland Revenue Authority of Singapore (“IRAS”) for years of assessment 2012 and 2011 respectively. The IRAS disallowed certain expenses incurred in the year ended 31 December 2011 and 31 December 2010 and did not allow such adjustments to be included under the rollover income adjustment.

196CapitaLand Mall Trust
Annual Report 2016
23 Earnings per unit
Basic and diluted earnings per unit
The calculation of basic and diluted earnings per unit is based on the weighted average number of units during the year and total return for the year.
Group Trust
2016
$’0002015
$’0002016
$’0002015
$’000
Total return for the year 469,400 579,805 498,645 574,975
Group and Trust Number of Units
2016’000
2015’000
Issued units at beginning of the year 3,541,169 3,462,180Creation of new units during the year: - asset management fees in relation to the Trust’s 40.0% interest in RCS Trust 1,177 1,540- in relation to the acquisition of BMT: - as partial consideration – 18,148 - as acquisition fees – 675
Weighted average number of units at the end of the year 3,542,346 3,482,543
Notes to the Financial StatementsYear ended 31 December 2016

197Overview
Business Review
Corporate Governance & Transparency
Portfolio Details
Sustainability
Financials & Additional Information
24 Related parties
For the purposes of these financial statements, parties are considered to be related to the Group if the Group has the ability, directly or indirectly, to control the parties or exercise significant influence over the parties in making financial and operating decisions, or vice versa, or where the Group and the parties are subject to common significant influence. Related parties may be individuals or other entities. The Manager, Property Manager and Project Manager (CapitaLand Retail Project Management Pte Ltd) are subsidiaries of a substantial Unitholder of the Trust. In the normal course of the operations of the Trust, asset management fees and trustee’s fees have been paid or are payable to the Manager and Trustee respectively. The property management fees and property management reimbursements are payable to the Property Manager. During the financial year, other than those disclosed elsewhere in the financial statements, the following were significant related party transactions carried out in the normal course of business on arm’s length commercial terms:
Group Trust
2016
$’0002015
$’0002016
$’0002015
$’000
Asset enhancement works and consultancy fees paid/payable to related companies of the Manager 2,916 2,437 2,763 2,437Rental and other income received/receivable from related companies of the Manager 1,010 1,190 1,002 1,189Interest paid/payable to subsidiary – – 86,195 85,521Divestment fees payable to the Manager – 953 – 953Other expenses paid/payable to related companies of the Manager 5,265 4,828 4,839 4,737
25 Financial risk management
Capitalmanagement
The Board of the Manager proactively reviews the Group’s and the Trust’s capital and debt management and financing policy regularly so as to optimise the Group’s and the Trust’s funding structure. Capital consists of Unitholders’ funds of the Group. The Board also monitors the Group’s and the Trust’s exposure to various risk elements and externally imposed requirements by closely adhering to clearly established management policies and procedures.
The Trust is subject to the aggregate leverage limit as defined in the Property Funds Appendix of the CIS code. The CIS code stipulates that the total borrowings and deferred payments (together the “Aggregate Leverage”) of a property fund should not exceed 45.0% of the fund’s deposited property. Moody’s Investors Service has affirmed an ‘A2’ issuer rating in July 2015. The Trust has complied with the Aggregate Leverage limit of 45.0% during the financial year. There were no changes in the Group’s and the Trust’s approach to capital management during the financial year.

198CapitaLand Mall Trust
Annual Report 2016
25 Financial risk management (continued)
Overviewofriskmanagement
Risk management is integral to the whole business of the Group. The Group has a system of controls in place to create an acceptable balance between the cost of risks occurring and the cost of managing the risks. The Manager continually monitors the Group’s risk management process to ensure that an appropriate balance between risk and control is achieved. Risk management policies and systems are reviewed regularly to reflect changes in market conditions and the Group’s activities.
The Audit Committee oversees how the Manager monitors compliance with the Group’s risk management policies and procedures and reviews the adequacy of the risk management framework in relation to the risks faced by the Group. The Audit Committee is assisted in its oversight role by Internal Audit. Internal Audit undertakes both regular and ad hoc reviews of risk management controls and procedures, the results of which are reported to the Audit Committee.
Creditrisk
Credit risk is the potential financial loss resulting from the failure of a tenant or a counterparty to settle its financial and contractual obligations to the Group, as and when they fall due.
The Manager has established credit limits for customers and monitors their balances on an ongoing basis. Credit evaluations are performed by the Manager before lease agreements are entered into with tenants.
The Manager establishes an allowance for impairment that represents its estimate of incurred losses in respect of trade and other receivables. The main component of this allowance is a specific loss component that relates to the individually significant exposure.
The allowance account in respect of trade and other receivables is used to record impairment losses unless the Group is satisfied that no recovery of the amount owing is possible. At that point, the financial asset is considered irrecoverable and the amount charged to the allowance account is written off against the carrying amount of the impaired financial asset.
Cash and fixed deposits are placed with financial institutions which are regulated. The Group limits its credit risk exposure in respect of investments by only investing in liquid securities and only with counterparties that have sound credit ratings, thus management does not expect any counterparty to fail to meet its obligations.
At 31 December 2016 and 31 December 2015, there was no significant concentration of credit risk. The maximum exposure to credit risk is represented by the carrying value of each financial asset on the Statement of Financial Position.
Liquidityrisk
The Manager monitors and maintains a level of cash and cash equivalents deemed adequate by management to finance the Group’s operations and to mitigate the effects of fluctuations in cash flows. Typically, the Group ensures that it has sufficient cash on demand to meet expected operational expenses for a period of 60 days, including the servicing of financial obligations. Market risk
Market risk is the risk that changes in market prices, such as interest rates, foreign exchange rates and equity prices will affect the Group’s income or the value of its holdings of financial instruments. The objective of market risk management is to manage and control market risk exposures within acceptable parameters, while optimising the return on risk.
Notes to the Financial StatementsYear ended 31 December 2016
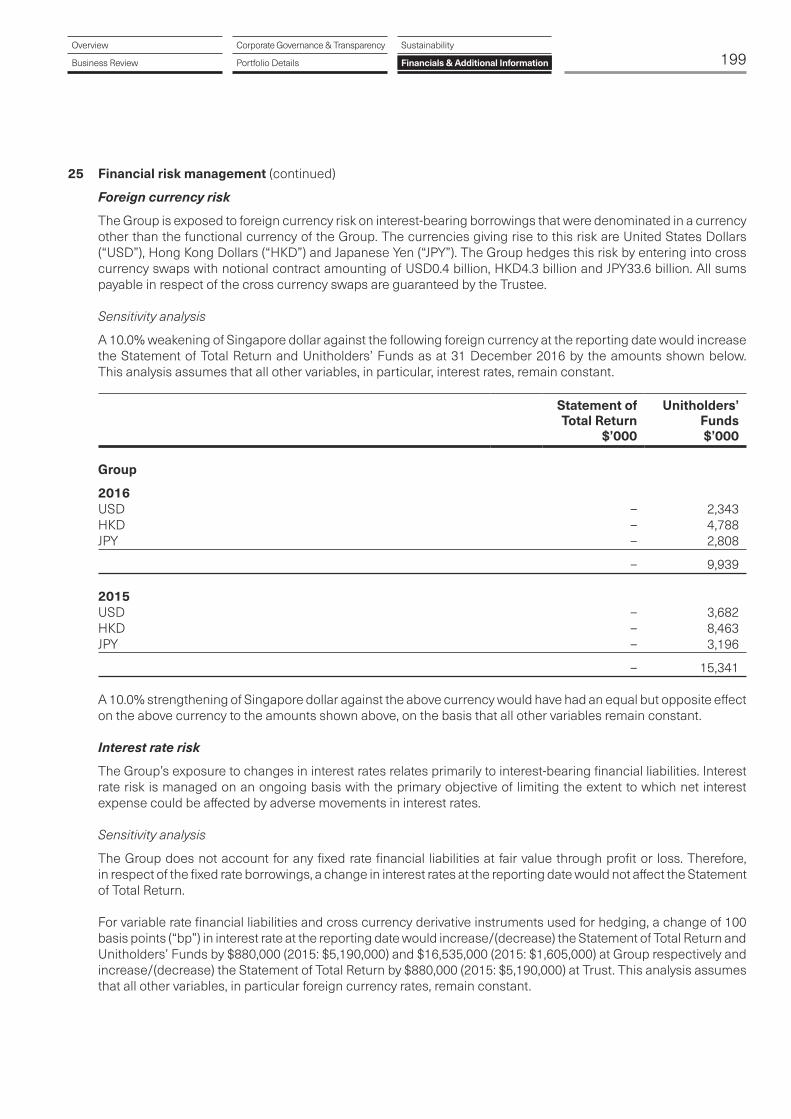
199Overview
Business Review
Corporate Governance & Transparency
Portfolio Details
Sustainability
Financials & Additional Information
25 Financial risk management (continued)
Foreigncurrencyrisk
The Group is exposed to foreign currency risk on interest-bearing borrowings that were denominated in a currency other than the functional currency of the Group. The currencies giving rise to this risk are United States Dollars (“USD”), Hong Kong Dollars (“HKD”) and Japanese Yen (“JPY”). The Group hedges this risk by entering into cross currency swaps with notional contract amounting of USD0.4 billion, HKD4.3 billion and JPY33.6 billion. All sums payable in respect of the cross currency swaps are guaranteed by the Trustee.
Sensitivity analysis
A 10.0% weakening of Singapore dollar against the following foreign currency at the reporting date would increase the Statement of Total Return and Unitholders’ Funds as at 31 December 2016 by the amounts shown below. This analysis assumes that all other variables, in particular, interest rates, remain constant.
Statement of Total Return
$’000
Unitholders’ Funds $’000
Group
2016USD – 2,343HKD – 4,788JPY – 2,808
– 9,939
2015USD – 3,682HKD – 8,463JPY – 3,196
– 15,341
A 10.0% strengthening of Singapore dollar against the above currency would have had an equal but opposite effect on the above currency to the amounts shown above, on the basis that all other variables remain constant.
Interest rate risk
The Group’s exposure to changes in interest rates relates primarily to interest-bearing financial liabilities. Interest rate risk is managed on an ongoing basis with the primary objective of limiting the extent to which net interest expense could be affected by adverse movements in interest rates. Sensitivity analysis
The Group does not account for any fixed rate financial liabilities at fair value through profit or loss. Therefore, in respect of the fixed rate borrowings, a change in interest rates at the reporting date would not affect the Statement of Total Return.
For variable rate financial liabilities and cross currency derivative instruments used for hedging, a change of 100 basis points (“bp”) in interest rate at the reporting date would increase/(decrease) the Statement of Total Return and Unitholders’ Funds by $880,000 (2015: $5,190,000) and $16,535,000 (2015: $1,605,000) at Group respectively and increase/(decrease) the Statement of Total Return by $880,000 (2015: $5,190,000) at Trust. This analysis assumes that all other variables, in particular foreign currency rates, remain constant.
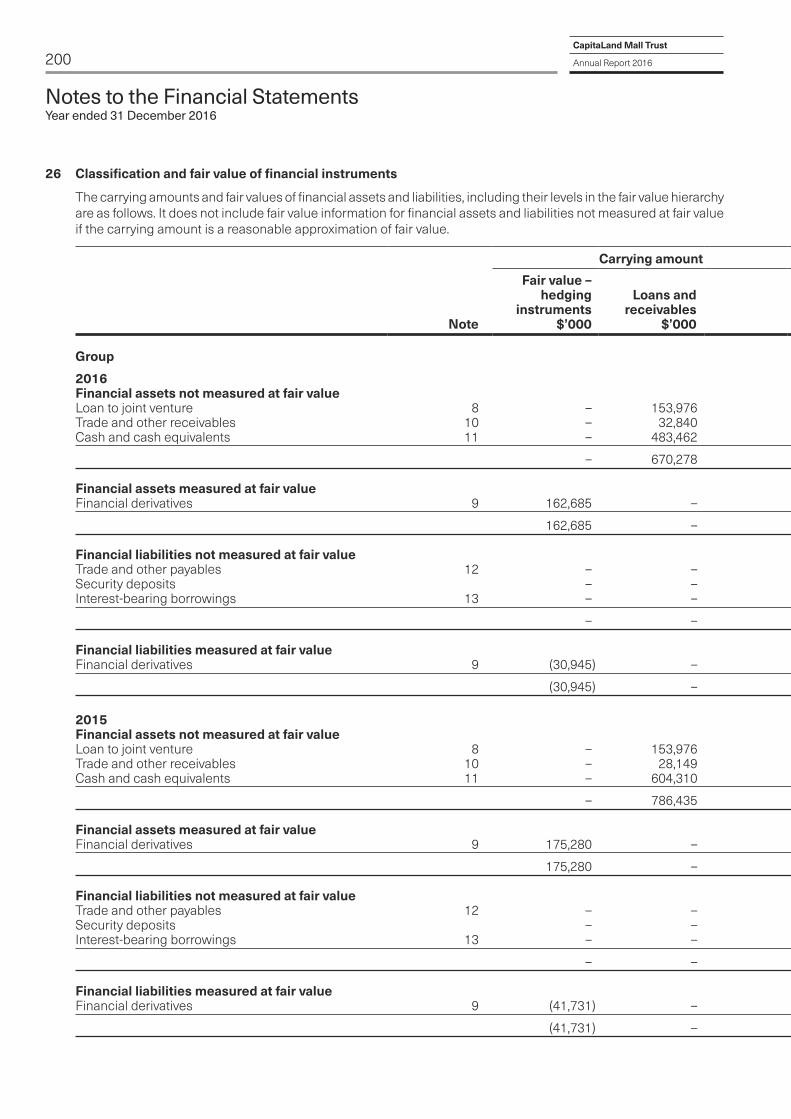
200CapitaLand Mall Trust
Annual Report 2016
26 Classification and fair value of financial instruments
The carrying amounts and fair values of financial assets and liabilities, including their levels in the fair value hierarchy are as follows. It does not include fair value information for financial assets and liabilities not measured at fair value if the carrying amount is a reasonable approximation of fair value.
Carrying amount Fair value
Note
Fair value – hedging
instruments$’000
Loans and receivables
$’000
Other financial liabilities at
amortised cost$’000
Total$’000
Level 1$’000
Level 2$’000
Level 3$’000
Total$’000
Group
2016Financial assets not measured at fair value Loan to joint venture 8 – 153,976 – 153,976 Trade and other receivables 10 – 32,840 – 32,840 Cash and cash equivalents 11 – 483,462 – 483,462
– 670,278 – 670,278
Financial assets measured at fair value Financial derivatives 9 162,685 – – 162,685 – 162,685 – 162,685
162,685 – – 162,685
Financial liabilities not measured at fair value Trade and other payables 12 – – (160,337) (160,337) Security deposits – – (153,747) (153,747)Interest-bearing borrowings 13 – – (3,288,312) (3,288,312) – (3,337,904) – (3,337,904)
– – (3,602,396) (3,602,396) Financial liabilities measured at fair valueFinancial derivatives 9 (30,945) – – (30,945) – (30,945) – (30,945)
(30,945) – – (30,945)
2015Financial assets not measured at fair value Loan to joint venture 8 – 153,976 – 153,976Trade and other receivables 10 – 28,149 – 28,149Cash and cash equivalents 11 – 604,310 – 604,310
– 786,435 – 786,435 Financial assets measured at fair value Financial derivatives 9 175,280 – – 175,280 – 175,280 – 175,280
175,280 – – 175,280
Financial liabilities not measured at fair value Trade and other payables 12 – – (144,430) (144,430) Security deposits – – (160,701) (160,701) Interest-bearing borrowings 13 – – (3,312,156) (3,312,156) – (3,368,140) – (3,368,140)
– – (3,617,287) (3,617,287)
Financial liabilities measured at fair valueFinancial derivatives 9 (41,731) – – (41,731) – (41,731) – (41,731)
(41,731) – – (41,731)
Notes to the Financial StatementsYear ended 31 December 2016

201Overview
Business Review
Corporate Governance & Transparency
Portfolio Details
Sustainability
Financials & Additional Information
26 Classification and fair value of financial instruments
The carrying amounts and fair values of financial assets and liabilities, including their levels in the fair value hierarchy are as follows. It does not include fair value information for financial assets and liabilities not measured at fair value if the carrying amount is a reasonable approximation of fair value.
Carrying amount Fair value
Note
Fair value – hedging
instruments$’000
Loans and receivables
$’000
Other financial liabilities at
amortised cost$’000
Total$’000
Level 1$’000
Level 2$’000
Level 3$’000
Total$’000
Group
2016Financial assets not measured at fair value Loan to joint venture 8 – 153,976 – 153,976 Trade and other receivables 10 – 32,840 – 32,840 Cash and cash equivalents 11 – 483,462 – 483,462
– 670,278 – 670,278
Financial assets measured at fair value Financial derivatives 9 162,685 – – 162,685 – 162,685 – 162,685
162,685 – – 162,685
Financial liabilities not measured at fair value Trade and other payables 12 – – (160,337) (160,337) Security deposits – – (153,747) (153,747)Interest-bearing borrowings 13 – – (3,288,312) (3,288,312) – (3,337,904) – (3,337,904)
– – (3,602,396) (3,602,396) Financial liabilities measured at fair valueFinancial derivatives 9 (30,945) – – (30,945) – (30,945) – (30,945)
(30,945) – – (30,945)
2015Financial assets not measured at fair value Loan to joint venture 8 – 153,976 – 153,976Trade and other receivables 10 – 28,149 – 28,149Cash and cash equivalents 11 – 604,310 – 604,310
– 786,435 – 786,435 Financial assets measured at fair value Financial derivatives 9 175,280 – – 175,280 – 175,280 – 175,280
175,280 – – 175,280
Financial liabilities not measured at fair value Trade and other payables 12 – – (144,430) (144,430) Security deposits – – (160,701) (160,701) Interest-bearing borrowings 13 – – (3,312,156) (3,312,156) – (3,368,140) – (3,368,140)
– – (3,617,287) (3,617,287)
Financial liabilities measured at fair valueFinancial derivatives 9 (41,731) – – (41,731) – (41,731) – (41,731)
(41,731) – – (41,731)

202CapitaLand Mall Trust
Annual Report 2016
26 Classification and fair value of financial instruments (continued)
Carrying amount Fair value
Note
Fair value – hedging
instruments$’000
Loans and receivables
$’000
Other financial liabilities at
amortised cost$’000
Total$’000
Level 1$’000
Level 2$’000
Level 3$’000
Total$’000
Trust
2016Financial assets not measured at fair valueLoan to subsidiary1 7 – 603,057 – 603,057 Loan to joint venture 8 – 153,976 – 153,976 Trade and other receivables 10 – 40,923 – 40,923Cash and cash equivalents 11 – 450,014 – 450,014
– 1,247,970 – 1,247,970
Financial liabilities not measured at fair value Trade and other payables 12 – – (146,642) (146,642)Security deposits – – (139,844) (139,844)Interest-bearing borrowings 13 – – (3,163,123) (3,163,123) – (3,122,985) – (3,122,985)
– – (3,449,609) (3,449,609)
2015Financial assets not measured at fair valueLoan to subsidiary1 7 – 603,057 – 603,057Loan to joint venture 8 – 153,976 – 153,976 Trade and other receivables 10 – 28,233 – 28,233Cash and cash equivalents 11 – 570,653 – 570,653
– 1,355,919 – 1,355,919
Financial liabilities not measured at fair value Trade and other payables 12 – – (133,632) (133,632)Security deposits – – (147,156) (147,156)Interest-bearing borrowings 13 – – (3,244,687) (3,244,687) – (3,248,674) – (3,248,674)
– – (3,525,475) (3,525,475)
1 Relates to loan to Brilliance Mall Trust.
Notes to the Financial StatementsYear ended 31 December 2016
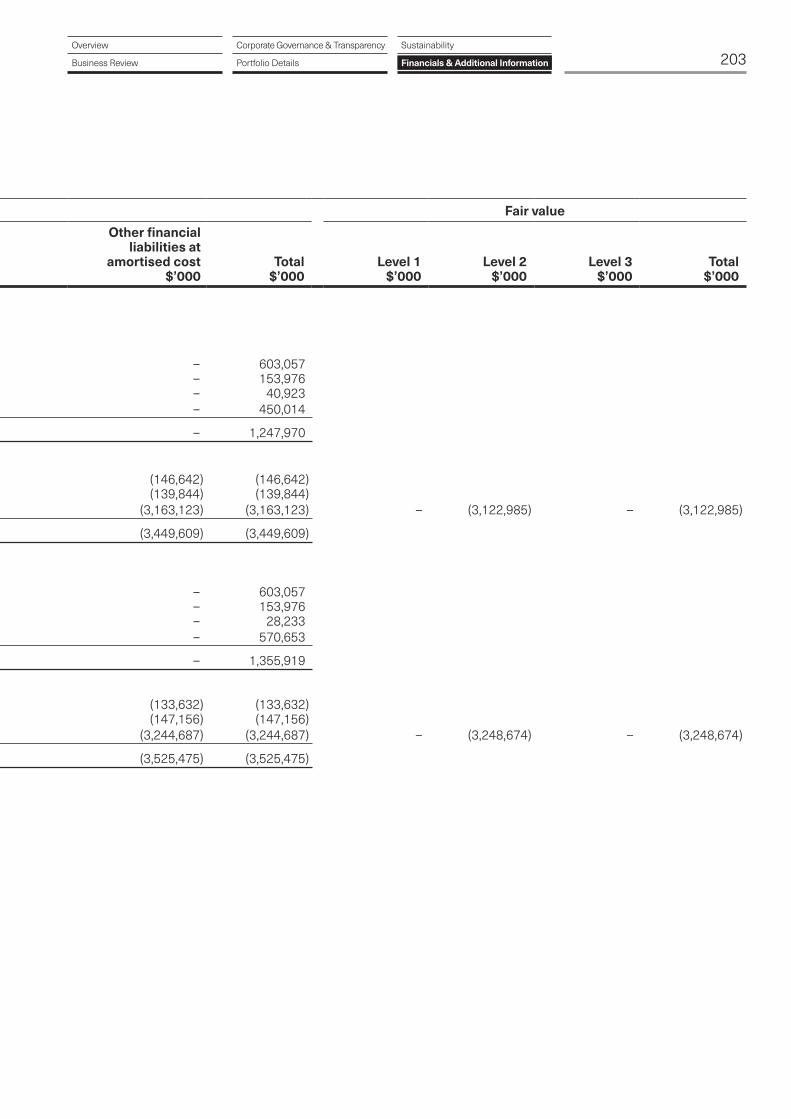
203Overview
Business Review
Corporate Governance & Transparency
Portfolio Details
Sustainability
Financials & Additional Information
26 Classification and fair value of financial instruments (continued)
Carrying amount Fair value
Note
Fair value – hedging
instruments$’000
Loans and receivables
$’000
Other financial liabilities at
amortised cost$’000
Total$’000
Level 1$’000
Level 2$’000
Level 3$’000
Total$’000
Trust
2016Financial assets not measured at fair valueLoan to subsidiary1 7 – 603,057 – 603,057 Loan to joint venture 8 – 153,976 – 153,976 Trade and other receivables 10 – 40,923 – 40,923Cash and cash equivalents 11 – 450,014 – 450,014
– 1,247,970 – 1,247,970
Financial liabilities not measured at fair value Trade and other payables 12 – – (146,642) (146,642)Security deposits – – (139,844) (139,844)Interest-bearing borrowings 13 – – (3,163,123) (3,163,123) – (3,122,985) – (3,122,985)
– – (3,449,609) (3,449,609)
2015Financial assets not measured at fair valueLoan to subsidiary1 7 – 603,057 – 603,057Loan to joint venture 8 – 153,976 – 153,976 Trade and other receivables 10 – 28,233 – 28,233Cash and cash equivalents 11 – 570,653 – 570,653
– 1,355,919 – 1,355,919
Financial liabilities not measured at fair value Trade and other payables 12 – – (133,632) (133,632)Security deposits – – (147,156) (147,156)Interest-bearing borrowings 13 – – (3,244,687) (3,244,687) – (3,248,674) – (3,248,674)
– – (3,525,475) (3,525,475)
1 Relates to loan to Brilliance Mall Trust.

204CapitaLand Mall Trust
Annual Report 2016
26 Classification and fair value of financial instruments (continued)
Measurement of fair values
Financial instruments that are measured at fair value
Derivatives
The fair values of cross currency swaps (Level 2 fair values) are based on banks’ quotes. These quotes are assessed for reasonableness by discounting estimated future cash flows based on the terms and maturity of each contract and using market rates for a similar instrument at the measurement date. Fair values reflect the credit risk of the instrument and include adjustments to take into account the credit risk of the Group and counterparties when appropriate.
Financialinstrumentsthatarenotmeasuredatfairvalue
Other non-derivative financial liabilities are measured at fair value at initial recognition and for disclosure purposes, at each annual reporting date. The fair value of quoted interest-bearing borrowings is their quoted ask price at the reporting date. Fair value for unquoted interest-bearing borrowings is calculated based on the present value of future principal and interest cash flows, discounted at the market rate of interest at the measurement date. Other non-derivative financial liabilities include interest-bearing borrowings.
Interestratesusedindeterminingfairvalues
The interest rates used to discount estimated cash flows, where applicable, are based on forward rates as at 31 December plus a credit spread, and are as follows:
2016%
2015%
Interest-bearing borrowings 1.66 – 3.73 1.98 – 3.98
Financialinstrumentsforwhichfairvalueisequaltothecarryingvalue
These financial instruments include loans to subsidiaries and joint venture, trade and other receivables, cash and cash equivalents, trade and other payables and security deposits. The carrying amounts of these financial instruments are an approximation of their fair values because they are either short term in nature, effect of discounting is immaterial or reprice frequently.
Notes to the Financial StatementsYear ended 31 December 2016

205Overview
Business Review
Corporate Governance & Transparency
Portfolio Details
Sustainability
Financials & Additional Information
27 Operating segments
For the purpose of making resource allocation decisions and the assessment of segment performance, the Group’s Chief Operating Decision Makers (“CODMs”) reviews internal/management reports of its investment properties. This forms the basis of identifying the operating segments of the Group consistent with FRS 108 Operating Segments.
Segment revenue comprises mainly income generated from its tenants. Segment net property income represents the income earned by each segment after allocating property operating expenses. This is the measure reported to the CODMs for the purpose of assessment of segment performance. In addition, the CODMs monitor the non-financial assets as well as financial assets attributable to each segment when assessing segment performance.
Segment results, assets and liabilities include items directly attributable to a segment as well as those that can be allocated on a reasonable basis. Unallocated items comprise mainly income-earning assets and revenue, interest-bearing borrowings and expenses, related assets and expenses. Segment capital expenditure is the total cost incurred during the year to acquire segment assets that are expected to be used for more than one year.
GeographicalsegmentsSegment information in respect of the Group’s geographical segments is not presented, as the Group’s activities for the year ended 31 December 2016 and 31 December 2015 related to properties located in Singapore.
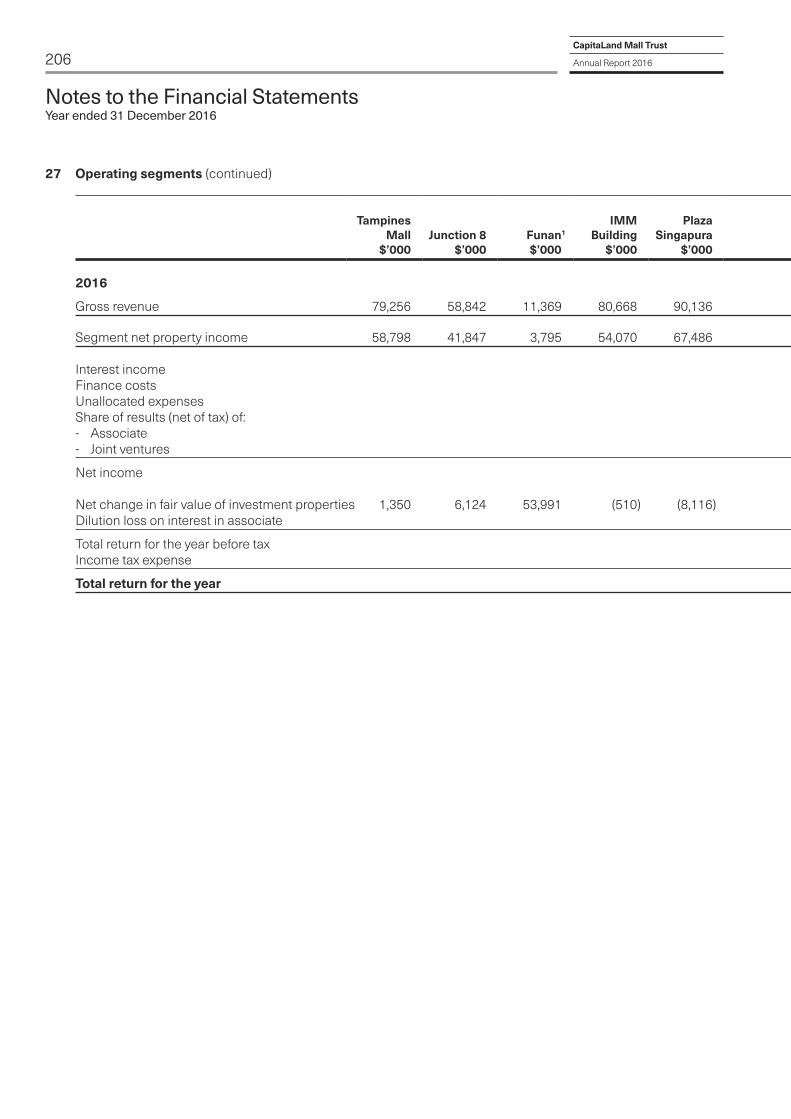
206CapitaLand Mall Trust
Annual Report 2016
27 Operating segments (continued)
Tampines Mall
$’000Junction 8
$’000 Funan 1
$’000
IMM Building
$’000
Plaza Singapura
$’000
Bugis Junction
$’000
Lot One Shoppers’
Mall$’000
Bukit Panjang
Plaza$’000
The Atrium@ Orchard
$’000
Clarke Quay
$’000Bugis+
$’000
Other Investment Properties 2
$’000 BMT 3
$’000Group$’000
2016
Gross revenue 79,256 58,842 11,369 80,668 90,136 83,854 44,256 28,399 49,213 36,543 32,616 36,457 58,123 689,732
Segment net property income 58,798 41,847 3,795 54,070 67,486 60,774 30,760 18,336 37,762 21,260 22,348 19,707 42,736 479,679 Interest income 11,331Finance costs (106,318)Unallocated expenses (48,986)Share of results (net of tax) of: - Associate 14,504- Joint ventures 52,347
Net income 402,557 Net change in fair value of investment properties 1,350 6,124 53,991 (510) (8,116) 13,768 1,215 137 (669) (750) (1,140) 3,069 34 68,503Dilution loss on interest in associate (634)
Total return for the year before tax 470,426Income tax expense (1,026)
Total return for the year 469,400
Notes to the Financial StatementsYear ended 31 December 2016

207Overview
Business Review
Corporate Governance & Transparency
Portfolio Details
Sustainability
Financials & Additional Information
27 Operating segments (continued)
Tampines Mall
$’000Junction 8
$’000 Funan 1
$’000
IMM Building
$’000
Plaza Singapura
$’000
Bugis Junction
$’000
Lot One Shoppers’
Mall$’000
Bukit Panjang
Plaza$’000
The Atrium@ Orchard
$’000
Clarke Quay
$’000Bugis+
$’000
Other Investment Properties 2
$’000 BMT 3
$’000Group$’000
2016
Gross revenue 79,256 58,842 11,369 80,668 90,136 83,854 44,256 28,399 49,213 36,543 32,616 36,457 58,123 689,732
Segment net property income 58,798 41,847 3,795 54,070 67,486 60,774 30,760 18,336 37,762 21,260 22,348 19,707 42,736 479,679 Interest income 11,331Finance costs (106,318)Unallocated expenses (48,986)Share of results (net of tax) of: - Associate 14,504- Joint ventures 52,347
Net income 402,557 Net change in fair value of investment properties 1,350 6,124 53,991 (510) (8,116) 13,768 1,215 137 (669) (750) (1,140) 3,069 34 68,503Dilution loss on interest in associate (634)
Total return for the year before tax 470,426Income tax expense (1,026)
Total return for the year 469,400
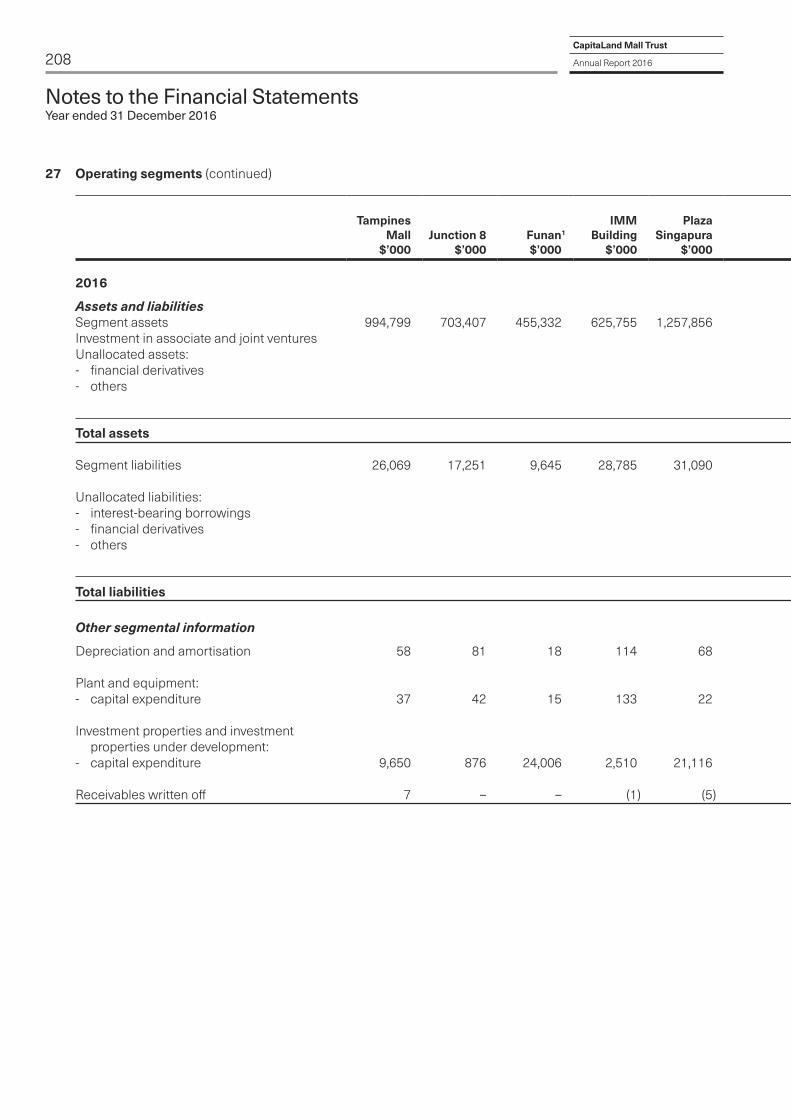
208CapitaLand Mall Trust
Annual Report 2016
27 Operating segments (continued)
Tampines Mall
$’000Junction 8
$’000 Funan 1
$’000
IMM Building
$’000
Plaza Singapura
$’000
Bugis Junction
$’000
Lot One Shoppers’
Mall$’000
Bukit Panjang
Plaza$’000
The Atrium@ Orchard
$’000
Clarke Quay
$’000Bugis+
$’000
Other Investment Properties 2
$’000 BMT 3
$’000Group$’000
2016
Assetsandliabilities Segment assets 994,799 703,407 455,332 625,755 1,257,856 1,014,718 512,363 310,651 736,119 391,543 340,988 406,898 811,072 8,561,501Investment in associate and joint ventures 1,135,462Unallocated assets: - financial derivatives 162,685- others 467,084
629,769
Total assets 10,326,732 Segment liabilities 26,069 17,251 9,645 28,785 31,090 26,719 13,057 14,165 12,312 21,977 9,941 15,853 24,591 251,455 Unallocated liabilities: - interest-bearing borrowings 3,288,312- financial derivatives 30,945- others 63,798
3,383,055
Total liabilities 3,634,510 Othersegmentalinformation
Depreciation and amortisation 58 81 18 114 68 19 35 70 69 84 68 88 342 1,114
Plant and equipment: - capital expenditure 37 42 15 133 22 40 73 83 37 21 11 24 (17) 521
Investment properties and investment properties under development: - capital expenditure 9,650 876 24,006 2,510 21,116 5,232 785 6,863 669 750 1,140 931 (34) 74,494
Receivables written off 7 – – (1) (5) 1 – – – 20 – (5) – 17
Notes to the Financial StatementsYear ended 31 December 2016

209Overview
Business Review
Corporate Governance & Transparency
Portfolio Details
Sustainability
Financials & Additional Information
27 Operating segments (continued)
Tampines Mall
$’000Junction 8
$’000 Funan 1
$’000
IMM Building
$’000
Plaza Singapura
$’000
Bugis Junction
$’000
Lot One Shoppers’
Mall$’000
Bukit Panjang
Plaza$’000
The Atrium@ Orchard
$’000
Clarke Quay
$’000Bugis+
$’000
Other Investment Properties 2
$’000 BMT 3
$’000Group$’000
2016
Assetsandliabilities Segment assets 994,799 703,407 455,332 625,755 1,257,856 1,014,718 512,363 310,651 736,119 391,543 340,988 406,898 811,072 8,561,501Investment in associate and joint ventures 1,135,462Unallocated assets: - financial derivatives 162,685- others 467,084
629,769
Total assets 10,326,732 Segment liabilities 26,069 17,251 9,645 28,785 31,090 26,719 13,057 14,165 12,312 21,977 9,941 15,853 24,591 251,455 Unallocated liabilities: - interest-bearing borrowings 3,288,312- financial derivatives 30,945- others 63,798
3,383,055
Total liabilities 3,634,510 Othersegmentalinformation
Depreciation and amortisation 58 81 18 114 68 19 35 70 69 84 68 88 342 1,114
Plant and equipment: - capital expenditure 37 42 15 133 22 40 73 83 37 21 11 24 (17) 521
Investment properties and investment properties under development: - capital expenditure 9,650 876 24,006 2,510 21,116 5,232 785 6,863 669 750 1,140 931 (34) 74,494
Receivables written off 7 – – (1) (5) 1 – – – 20 – (5) – 17

210CapitaLand Mall Trust
Annual Report 2016
27 Operating segments (continued)
Tampines Mall
$’000Junction 8
$’000 Funan 1
$’000
IMM Building
$’000
Plaza Singapura
$’000
Bugis Junction
$’000
Lot One Shoppers’
Mall$’000
Bukit Panjang
Plaza$’000
The Atrium@ Orchard
$’000
Clarke Quay
$’000Bugis+
$’000
Other Investment Properties 2
$’000 BMT 3
$’000Group$’000
2015
Gross revenue 76,822 58,581 33,836 73,140 91,354 83,283 43,869 26,572 51,359 34,930 32,480 48,520 14,256 669,002
Segment net property income 56,788 41,906 22,855 46,857 67,847 61,937 30,691 17,214 38,945 20,895 22,030 27,909 10,290 466,164 Interest income 12,270Finance costs (103,822)Unallocated expenses (45,820)Share of results (net of tax) of: - Associate 17,653- Joint ventures 54,165
Net income 400,610 Net change in fair value of investment properties 46,804 32,111 5,800 (767) 11,660 44,248 6,228 (370) 3,507 6,475 2,586 (43,073) (8,234) 106,975Gain on disposal of investment property 72,741Dilution gain on interest in associate 54
Total return for the year before tax 580,380Income tax expense (575)
Total return for the year 579,805
Notes to the Financial StatementsYear ended 31 December 2016
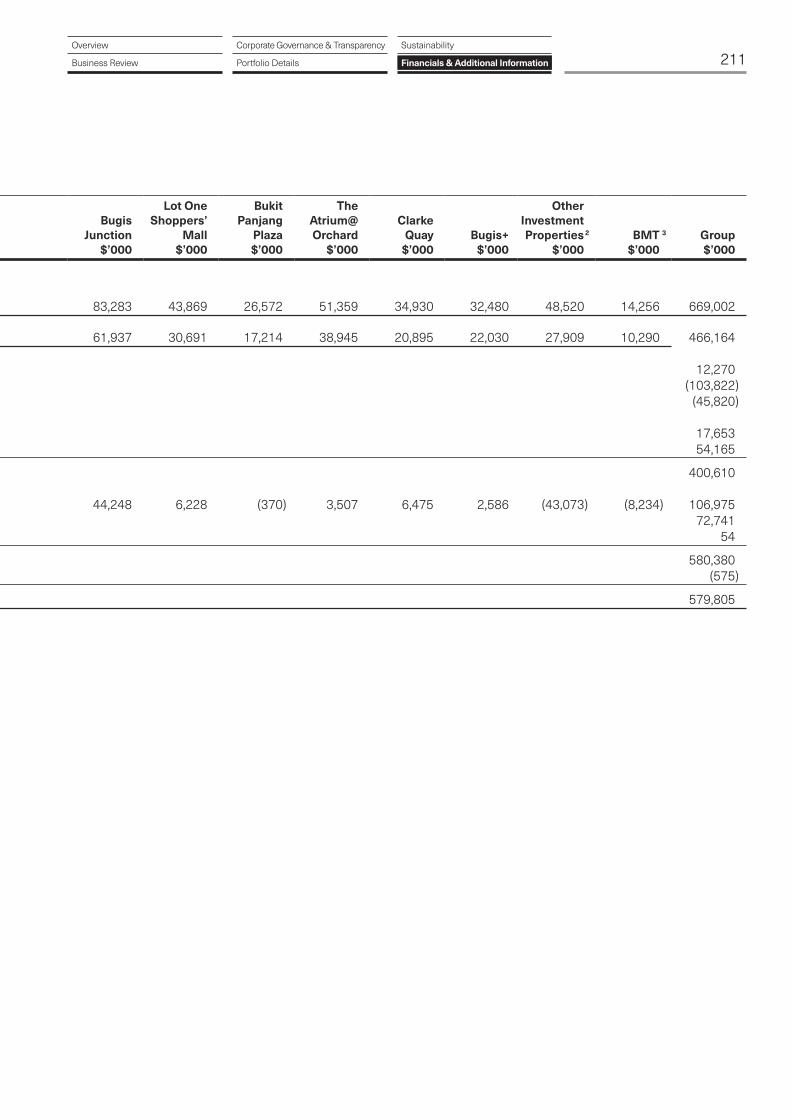
211Overview
Business Review
Corporate Governance & Transparency
Portfolio Details
Sustainability
Financials & Additional Information
27 Operating segments (continued)
Tampines Mall
$’000Junction 8
$’000 Funan 1
$’000
IMM Building
$’000
Plaza Singapura
$’000
Bugis Junction
$’000
Lot One Shoppers’
Mall$’000
Bukit Panjang
Plaza$’000
The Atrium@ Orchard
$’000
Clarke Quay
$’000Bugis+
$’000
Other Investment Properties 2
$’000 BMT 3
$’000Group$’000
2015
Gross revenue 76,822 58,581 33,836 73,140 91,354 83,283 43,869 26,572 51,359 34,930 32,480 48,520 14,256 669,002
Segment net property income 56,788 41,906 22,855 46,857 67,847 61,937 30,691 17,214 38,945 20,895 22,030 27,909 10,290 466,164 Interest income 12,270Finance costs (103,822)Unallocated expenses (45,820)Share of results (net of tax) of: - Associate 17,653- Joint ventures 54,165
Net income 400,610 Net change in fair value of investment properties 46,804 32,111 5,800 (767) 11,660 44,248 6,228 (370) 3,507 6,475 2,586 (43,073) (8,234) 106,975Gain on disposal of investment property 72,741Dilution gain on interest in associate 54
Total return for the year before tax 580,380Income tax expense (575)
Total return for the year 579,805

212CapitaLand Mall Trust
Annual Report 2016
27 Operating segments (continued)
Tampines Mall
$’000Junction 8
$’000 Funan 1
$’000
IMM Building
$’000
Plaza Singapura
$’000
Bugis Junction
$’000
Lot One Shoppers’
Mall$’000
Bukit Panjang
Plaza$’000
The Atrium@ Orchard
$’000
Clarke Quay
$’000Bugis+
$’000
Other Investment Properties 2
$’000 BMT 3
$’000Group$’000
2015
Assetsandliabilities Segment assets 983,803 696,639 367,480 623,478 1,244,917 995,720 510,425 303,640 736,211 390,376 340,874 402,910 814,310 8,410,783Investment in associate and joint ventures 1,178,408Unallocated assets: - financial derivatives 175,280- others 591,274
766,554
Total assets 10,355,745 Segment liabilities 27,738 17,124 11,571 32,557 34,982 25,850 13,663 11,100 14,336 21,777 10,638 19,644 27,320 268,300 Unallocated liabilities: - interest-bearing borrowings 3,312,156- financial derivatives 41,731- others 40,395
3,394,282
Total liabilities 3,662,582 Othersegmentalinformation
Depreciation and amortisation 44 79 25 133 102 19 29 54 271 78 87 41 90 1,052 Plant and equipment: - capital expenditure 121 28 28 31 159 12 28 180 57 (73) 6 136 (267) 446 Investment properties: - capital expenditure 14,196 1,889 200 19,767 9,340 (248) 772 11,370 3,493 11,525 414 4,224 – 76,942 Receivables written off – – – 17 – – – – – – – 27 – 44
1 From 1 November 2016, Funan is held through the Trust, Victory Office 1 Trust, Victory Office 2 Trust and Victory SR Trust.
2 Other investment properties comprise Sembawang Shopping Centre, JCube and Rivervale Mall. Rivervale Mall was divested on 15 December 2015.
3 The acquisition of BMT which holds Bedok Mall was completed on 1 October 2015.
Notes to the Financial StatementsYear ended 31 December 2016
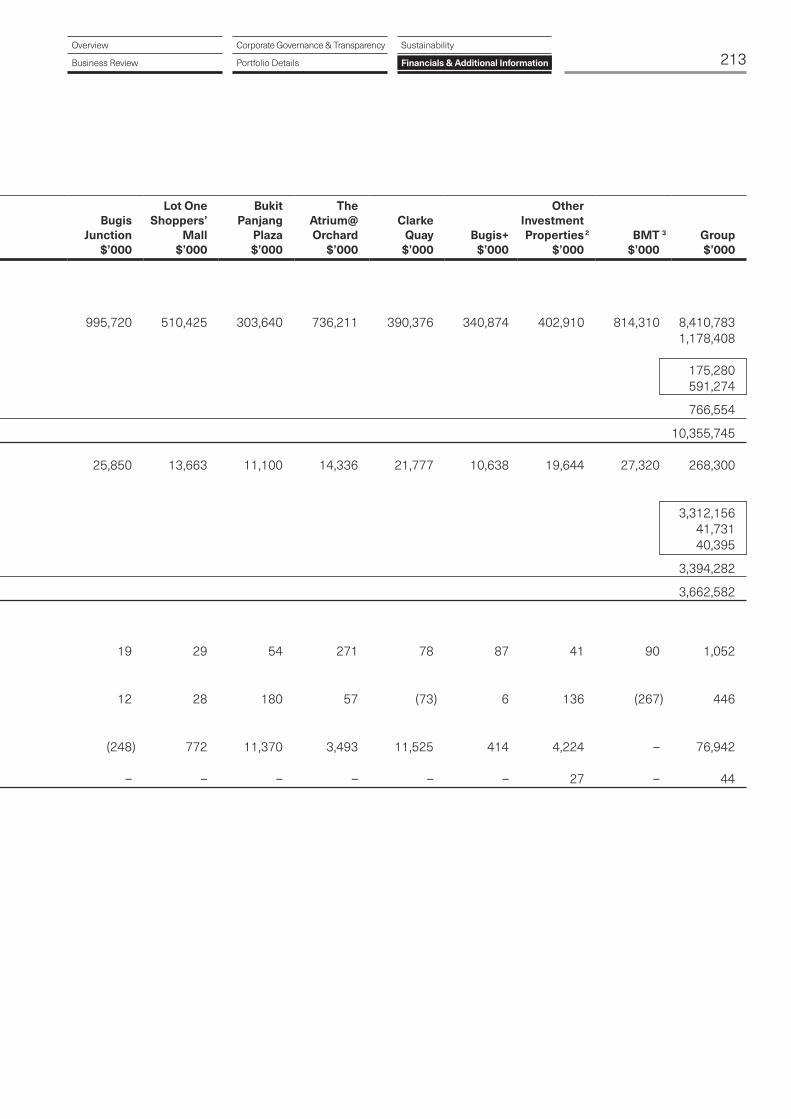
213Overview
Business Review
Corporate Governance & Transparency
Portfolio Details
Sustainability
Financials & Additional Information
27 Operating segments (continued)
Tampines Mall
$’000Junction 8
$’000 Funan 1
$’000
IMM Building
$’000
Plaza Singapura
$’000
Bugis Junction
$’000
Lot One Shoppers’
Mall$’000
Bukit Panjang
Plaza$’000
The Atrium@ Orchard
$’000
Clarke Quay
$’000Bugis+
$’000
Other Investment Properties 2
$’000 BMT 3
$’000Group$’000
2015
Assetsandliabilities Segment assets 983,803 696,639 367,480 623,478 1,244,917 995,720 510,425 303,640 736,211 390,376 340,874 402,910 814,310 8,410,783Investment in associate and joint ventures 1,178,408Unallocated assets: - financial derivatives 175,280- others 591,274
766,554
Total assets 10,355,745 Segment liabilities 27,738 17,124 11,571 32,557 34,982 25,850 13,663 11,100 14,336 21,777 10,638 19,644 27,320 268,300 Unallocated liabilities: - interest-bearing borrowings 3,312,156- financial derivatives 41,731- others 40,395
3,394,282
Total liabilities 3,662,582 Othersegmentalinformation
Depreciation and amortisation 44 79 25 133 102 19 29 54 271 78 87 41 90 1,052 Plant and equipment: - capital expenditure 121 28 28 31 159 12 28 180 57 (73) 6 136 (267) 446 Investment properties: - capital expenditure 14,196 1,889 200 19,767 9,340 (248) 772 11,370 3,493 11,525 414 4,224 – 76,942 Receivables written off – – – 17 – – – – – – – 27 – 44
1 From 1 November 2016, Funan is held through the Trust, Victory Office 1 Trust, Victory Office 2 Trust and Victory SR Trust.
2 Other investment properties comprise Sembawang Shopping Centre, JCube and Rivervale Mall. Rivervale Mall was divested on 15 December 2015.
3 The acquisition of BMT which holds Bedok Mall was completed on 1 October 2015.

214CapitaLand Mall Trust
Annual Report 2016
Notes to the Financial StatementsYear ended 31 December 2016
28 Commitments
Group Trust
2016
$’0002015
$’0002016
$’0002015
$’000
Capitalcommitments: - contracted but not provided for 399,367 32,659 228,995 32,659
Operatingleaserentalreceivable
The Group leases out its investment properties. Non-cancellable operating lease rentals are receivable as follows:
Group Trust
2016
$’0002015
$’0002016
$’0002015
$’000
Within 1 year 536,819 567,237 500,980 512,678After 1 year but within 5 years 684,772 692,971 642,872 660,532More than 5 years 36,772 60,069 36,772 60,069
1,258,363 1,320,277 1,180,624 1,233,279
Operatingleaseexpensepayable
Non-cancellable operating lease rentals are payable as follows:
Group Trust
2016
$’0002015
$’0002016
$’0002015
$’000
Within 1 year 2,497 1,822 2,487 1,811After 1 year but within 5 years 6,347 4,568 6,338 4,550More than 5 years 6,382 7,462 6,382 7,462
15,226 13,852 15,207 13,823
29 Financial ratios
Group
2016%
2015%
Expenses to weighted average net assets1 - including performance component of Manager’s management fees 0.73 0.72- excluding performance component of Manager’s management fees 0.42 0.41Portfolio turnover rate2 – 3.13
1 The annualised ratios are computed in accordance with the guidelines of Investment Management Association of Singapore. The expenses used in the computation relate to expenses of the Group, excluding property expenses and finance costs.
2 The annualised ratio is computed based on the lesser of purchases or sales of underlying investment properties of the Group expressed as a percentage of average net asset value.

215Overview
Business Review
Corporate Governance & Transparency
Portfolio Details
Sustainability
Financials & Additional Information
Additional Information
Interested Person Transactions
The transactions entered into with interested persons during the financial year, which fall under the Listing Manual of the Singapore Exchange Securities Trading Limited (SGX-ST) and the Property Funds Appendix of the Code on Collective Investment Schemes (excluding transactions less than S$100,000 each), are as follows:
Name of Interested Person
Aggregate value of all interested person
transactions during the financial year under review
(excluding transactions less than S$100,000
and transactions conducted under shareholders’ mandate
pursuant to Rule 920)S$’000
Aggregate value of all interested person
transactions during the financial year under review
conducted under shareholders’ mandate
pursuant to Rule 920 (excluding transactions
less than S$100,000)S$’000
CapitaLand Limited and its subsidiaries or associates - Management fees1 50,617 – - Property management fees and reimbursables1 70,350 – - Extension of Property Management Agreement for Raffles City Singapore1 39,200 –- Project management and consultancy fees for asset enhancement works1 8,440 – - Rental and service income1 1,438 – - General services1 6,999 – Temasek Holdings (Private) Limited and its associates - Rental and service income1 2,785 – - General services1 21,482 – HSBC Institutional Trust Services (Singapore) Limited - Trustee fees1 1,459 – 1 This includes CMT’s interest in joint ventures.
216CapitaLand Mall Trust
Annual Report 2016
Additional Information
Saved as disclosed above, there were no additional interested person transactions (excluding transactions less than S$100,000 each) entered into during the financial year under review.
On 10 February 2004, the SGX-ST has granted a waiver to CMT from Rules 905 and 906 of the Listing Manual of the SGX-ST in relation to, inter alia, payments for management fees, payments for acquisition and divestment fees, as well as payments of trustee’s fees. Such payments are not to be included in the aggregated value of total interested person transactions as governed by Rules 905 and 906 of the Listing Manual of the SGX-ST as long as there are no changes to the terms, rates and/or bases for such fees and expenses.
In addition, the entry into the Master Property Management Agreement 2011 dated 1 December 2011 was approved by the Unitholders at an extraordinary general meeting held on 13 April 2011 and the total property management fees and reimbursements to the property manager in respect of payroll and related expenses payable thereunder were aggregated for the purpose of Rule 905 in financial year 2011. Accordingly, such fees and expenses will not be subject to aggregation or further Unitholders’ approval requirements under Rules 905 and 906 of the Listing Manual of the SGX-ST, to the extent that there is no subsequent change to the rates and/or bases for such fees and expenses.
Please also see Note 24 on Related Parties in the financial statements.
Subscription of CMT Units
For the financial year ended 31 December 2016, an aggregate of 1,900,842 CMT units were issued and subscribed for. As at 31 December 2016, 3,543,069,556 CMT units were in issue and outstanding.
Additional Disclosure for Operating Expenses
The total operating expenses incurred by CMT Group and CMT’s proportionate share of operating expenses incurred by its joint ventures (being RCS Trust, Infinity Mall Trust and Infinity Office Trust) amounted to S$295.3 million in 2016, which was equivalent to 4.4% of CMT Group’s net asset value as at 31 December 2016. The amount included all fees and charges paid to the Manager and interested parties.
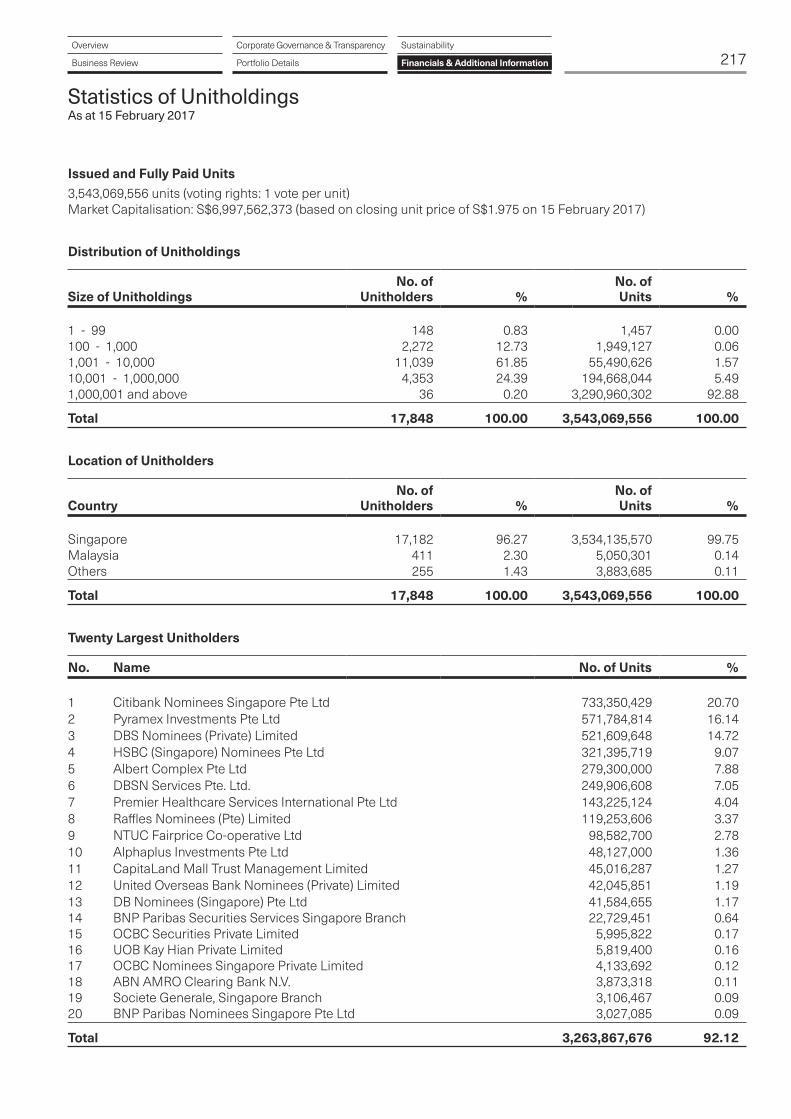
217Overview
Business Review
Corporate Governance & Transparency
Portfolio Details
Sustainability
Financials & Additional Information
Statistics of Unitholdings As at 15 February 2017
Issued and Fully Paid Units3,543,069,556 units (voting rights: 1 vote per unit) Market Capitalisation: S$6,997,562,373 (based on closing unit price of S$1.975 on 15 February 2017)
Distribution of Unitholdings
Size of UnitholdingsNo. of
Unitholders % No. ofUnits %
1 - 99 148 0.83 1,457 0.00100 - 1,000 2,272 12.73 1,949,127 0.061,001 - 10,000 11,039 61.85 55,490,626 1.5710,001 - 1,000,000 4,353 24.39 194,668,044 5.491,000,001 and above 36 0.20 3,290,960,302 92.88
Total 17,848 100.00 3,543,069,556 100.00
Location of Unitholders
CountryNo. of
Unitholders % No. ofUnits %
Singapore 17,182 96.27 3,534,135,570 99.75Malaysia 411 2.30 5,050,301 0.14Others 255 1.43 3,883,685 0.11
Total 17,848 100.00 3,543,069,556 100.00
Twenty Largest Unitholders
No. Name No. of Units %
1 Citibank Nominees Singapore Pte Ltd 733,350,429 20.702 Pyramex Investments Pte Ltd 571,784,814 16.143 DBS Nominees (Private) Limited 521,609,648 14.724 HSBC (Singapore) Nominees Pte Ltd 321,395,719 9.075 Albert Complex Pte Ltd 279,300,000 7.886 DBSN Services Pte. Ltd. 249,906,608 7.057 Premier Healthcare Services International Pte Ltd 143,225,124 4.048 Raffles Nominees (Pte) Limited 119,253,606 3.379 NTUC Fairprice Co-operative Ltd 98,582,700 2.7810 Alphaplus Investments Pte Ltd 48,127,000 1.3611 CapitaLand Mall Trust Management Limited 45,016,287 1.2712 United Overseas Bank Nominees (Private) Limited 42,045,851 1.1913 DB Nominees (Singapore) Pte Ltd 41,584,655 1.1714 BNP Paribas Securities Services Singapore Branch 22,729,451 0.6415 OCBC Securities Private Limited 5,995,822 0.1716 UOB Kay Hian Private Limited 5,819,400 0.1617 OCBC Nominees Singapore Private Limited 4,133,692 0.1218 ABN AMRO Clearing Bank N.V. 3,873,318 0.1119 Societe Generale, Singapore Branch 3,106,467 0.0920 BNP Paribas Nominees Singapore Pte Ltd 3,027,085 0.09
Total 3,263,867,676 92.12

218CapitaLand Mall Trust
Annual Report 2016
Statistics of Unitholdings As at 15 February 2017
Directors’ Interests in Units and Convertible Securities as at 21 January 2017
Based on the Register of Directors’ Unitholdings, save for those disclosed below, none of the Directors holds any interest in Units and convertible securities issued by CMT.
No. of UnitsContingent Awards of Units1
under the Manager’s
Name of DirectorDirect
InterestDeemed Interest
Performance Unit Plan
Restricted Unit Plan
Richard R. Magnus 75,799 – – – Lim Ming Yan 866,000 – – – Tan Wee Yan, Wilson 20,456 – 0 to 251,886 2 0 to 118,972 2,3
Tan Kian Chew 71,099 64,000 – – Lee Khai Fatt, Kyle 31,362 – – – Fong Kwok Jen 23,393 – – – Gay Chee Cheong 23,548 – – – Jason Leow Juan Thong 20,000 – – –
1 This refers to the number of Units which are the subject of contingent awards granted but not released under the Manager’s Performance Unit Plan (PUP) and Restricted Unit Plan (RUP). The final number of Units that will be released could range from 0% to a maximum of 200% of the baseline award under the PUP and from 0% to a maximum of 150% of the baseline award under the RUP.
2 The final number of Units to be released will depend on the achievement of pre-determined targets at the end of the respective performance periods for PUP and RUP.
3 On the final vesting, an additional number of Units of a total value equal to the value of the accumulated distributions which are declared during each of the vesting periods and deemed foregone due to the vesting mechanism of RUP, will also be released.
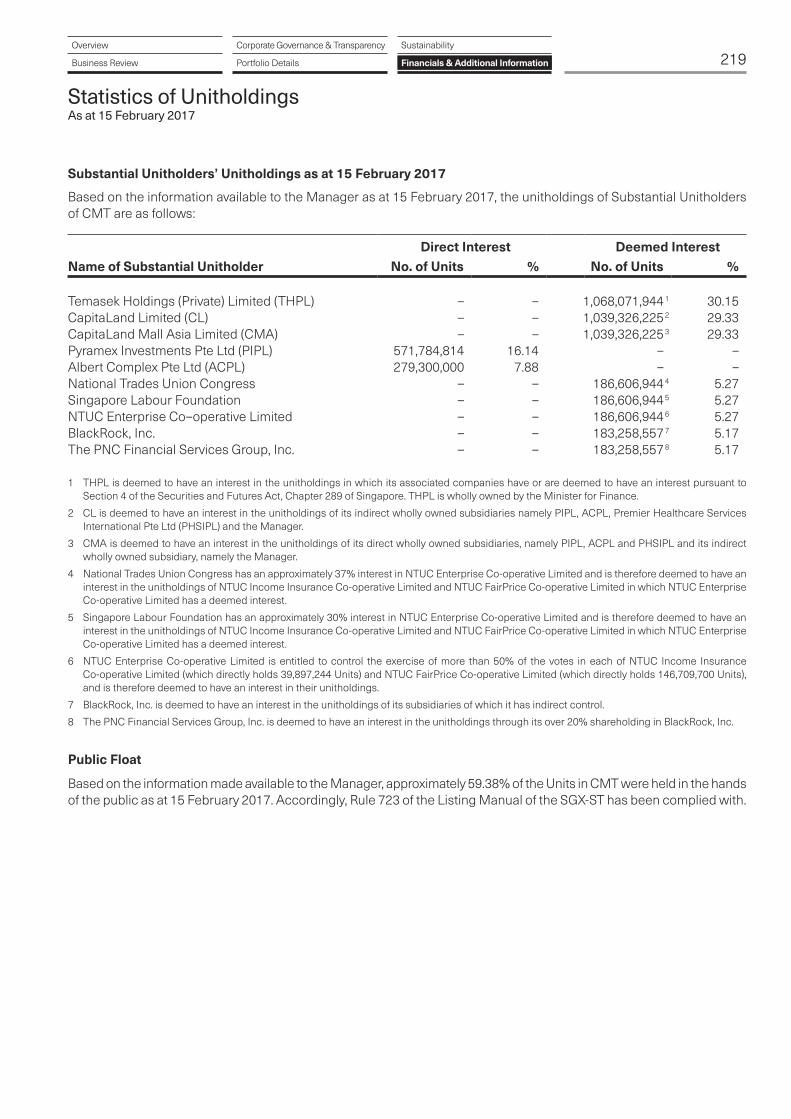
219Overview
Business Review
Corporate Governance & Transparency
Portfolio Details
Sustainability
Financials & Additional Information
Statistics of Unitholdings As at 15 February 2017
Substantial Unitholders’ Unitholdings as at 15 February 2017
Based on the information available to the Manager as at 15 February 2017, the unitholdings of Substantial Unitholders of CMT are as follows:
Direct Interest Deemed InterestName of Substantial Unitholder No. of Units % No. of Units %
Temasek Holdings (Private) Limited (THPL) – – 1,068,071,944 1 30.15CapitaLand Limited (CL) – – 1,039,326,225 2 29.33CapitaLand Mall Asia Limited (CMA) – – 1,039,326,225 3 29.33Pyramex Investments Pte Ltd (PIPL) 571,784,814 16.14 – –Albert Complex Pte Ltd (ACPL) 279,300,000 7.88 – –National Trades Union Congress – – 186,606,944 4 5.27Singapore Labour Foundation – – 186,606,944 5 5.27NTUC Enterprise Co–operative Limited – – 186,606,944 6 5.27BlackRock, Inc. – – 183,258,557 7 5.17The PNC Financial Services Group, Inc. – – 183,258,557 8 5.17
1 THPL is deemed to have an interest in the unitholdings in which its associated companies have or are deemed to have an interest pursuant to Section 4 of the Securities and Futures Act, Chapter 289 of Singapore. THPL is wholly owned by the Minister for Finance.
2 CL is deemed to have an interest in the unitholdings of its indirect wholly owned subsidiaries namely PIPL, ACPL, Premier Healthcare Services International Pte Ltd (PHSIPL) and the Manager.
3 CMA is deemed to have an interest in the unitholdings of its direct wholly owned subsidiaries, namely PIPL, ACPL and PHSIPL and its indirect wholly owned subsidiary, namely the Manager.
4 National Trades Union Congress has an approximately 37% interest in NTUC Enterprise Co-operative Limited and is therefore deemed to have an interest in the unitholdings of NTUC Income Insurance Co-operative Limited and NTUC FairPrice Co-operative Limited in which NTUC Enterprise Co-operative Limited has a deemed interest.
5 Singapore Labour Foundation has an approximately 30% interest in NTUC Enterprise Co-operative Limited and is therefore deemed to have an interest in the unitholdings of NTUC Income Insurance Co-operative Limited and NTUC FairPrice Co-operative Limited in which NTUC Enterprise Co-operative Limited has a deemed interest.
6 NTUC Enterprise Co-operative Limited is entitled to control the exercise of more than 50% of the votes in each of NTUC Income Insurance Co-operative Limited (which directly holds 39,897,244 Units) and NTUC FairPrice Co-operative Limited (which directly holds 146,709,700 Units), and is therefore deemed to have an interest in their unitholdings.
7 BlackRock, Inc. is deemed to have an interest in the unitholdings of its subsidiaries of which it has indirect control.
8 The PNC Financial Services Group, Inc. is deemed to have an interest in the unitholdings through its over 20% shareholding in BlackRock, Inc.
Public Float
Based on the information made available to the Manager, approximately 59.38% of the Units in CMT were held in the hands of the public as at 15 February 2017. Accordingly, Rule 723 of the Listing Manual of the SGX-ST has been complied with.

Mall Directory
Bedok Mall
311 New Upper Changi Road, Singapore 467360Tel: +65 6702 5120Fax: +65 6844 9701Website: www.bedokmall.com.sg
Bugis+
201 Victoria Street, Singapore 188067Tel: +65 6634 6810Fax: +65 6835 7840Website: www.bugisplus.com.sg
Bugis Junction
200 Victoria Street, Singapore 188021Tel: +65 6557 6557Fax: +65 6835 7840Website: www.bugisjunction-mall.com.sg
Bukit Panjang Plaza
1 Jelebu Road, Singapore 677743Tel: +65 6314 6388Fax: +65 6763 4829Website: www.bukitpanjangplaza.com.sg
Clarke Quay
3 River Valley Road, Singapore 179024Tel: +65 6337 3292Fax: +65 6334 8423Website: www.clarkequay.com.sg
Funan
109 North Bridge Road, Singapore 179097Tel: +65 6713 1857Website: www.funan.com.sg
IMM Building
2 Jurong East Street 21, Singapore 609601Tel: +65 6665 8268Fax: +65 6562 3933Website: www.imm.sg
JCube
2 Jurong East Central 1, Singapore 609731Tel: +65 6684 2153Fax: +65 6684 2151Website: www.jcube.com.sg
Junction 8
9 Bishan Place, Singapore 579837Tel: +65 6354 2955Fax: +65 6354 2977Website: www.junction8.com.sg
Lot One Shoppers’ Mall
21 Choa Chu Kang Avenue 4, Singapore 689812Tel: +65 6314 6200Fax: +65 6763 2405Website: www.lotone.com.sg
Plaza Singapura
68 Orchard Road, Singapore 238839Tel: +65 6332 9248Fax: +65 6339 5006Website: www.plazasingapura.com.sg
Raffles City Singapore
252 North Bridge Road, Singapore 179103Tel: +65 6338 7766Fax: +65 6337 3618Website: www.rafflescity.com.sg
Sembawang Shopping Centre
604 Sembawang Road, Singapore 758459Tel: +65 6757 8000Fax: +65 6257 1463Website: www.sembawangsc.com.sg
Tampines Mall
4 Tampines Central 5, Singapore 529510Tel: +65 6788 8370Fax: +65 6787 0995Website: www.tampinesmall.com.sg
The Atrium@Orchard
68 Orchard Road, Singapore 238839Tel: +65 6332 9248Fax: +65 6339 5006Website: www.cmt.com.sg/the-atrium-and-orchard.html
Westgate
3 Gateway Drive, Singapore 608532Tel: +65 6908 3737Fax: +65 6465 9631Website: www.westgate.com.sg
CapitaLand Mall Trust
Annual Report 2016220
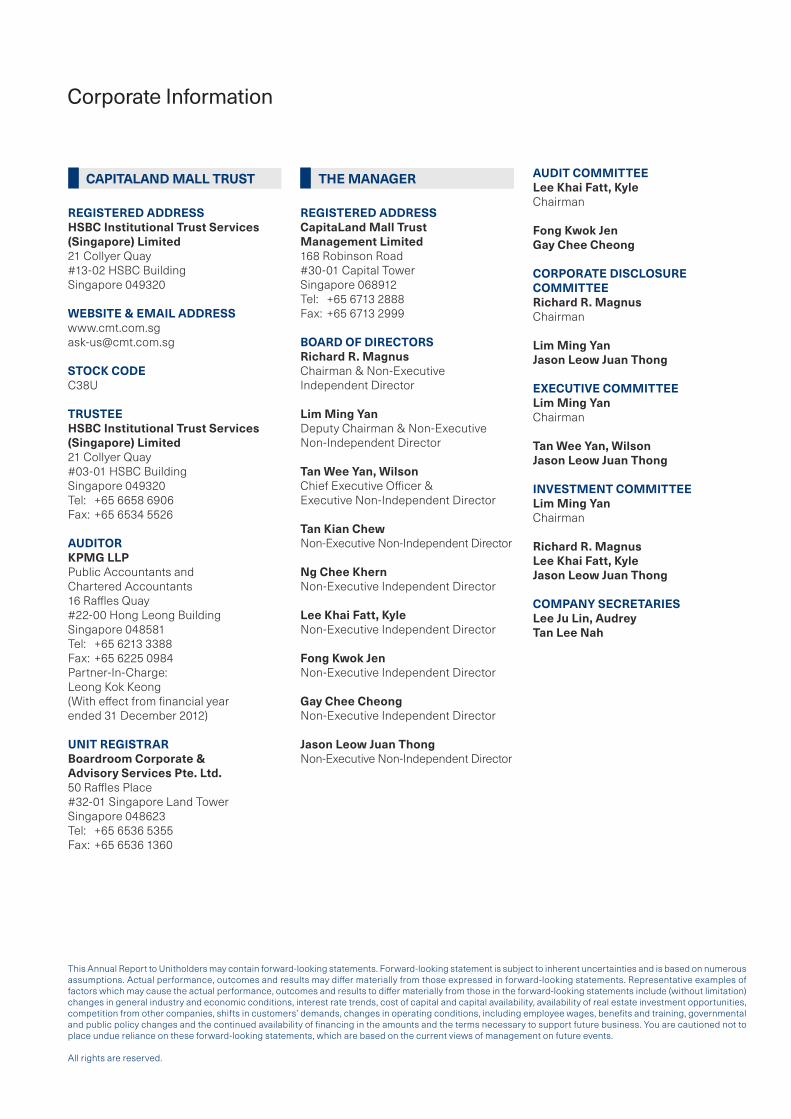
This Annual Report to Unitholders may contain forward-looking statements. Forward-looking statement is subject to inherent uncertainties and is based on numerous assumptions. Actual performance, outcomes and results may differ materially from those expressed in forward-looking statements. Representative examples of factors which may cause the actual performance, outcomes and results to differ materially from those in the forward-looking statements include (without limitation) changes in general industry and economic conditions, interest rate trends, cost of capital and capital availability, availability of real estate investment opportunities, competition from other companies, shifts in customers’ demands, changes in operating conditions, including employee wages, benefits and training, governmental and public policy changes and the continued availability of financing in the amounts and the terms necessary to support future business. You are cautioned not to place undue reliance on these forward-looking statements, which are based on the current views of management on future events.
All rights are reserved.
Corporate Information
CAPITALAND MALL TRUST
REGISTERED ADDRESSHSBC Institutional Trust Services(Singapore) Limited21 Collyer Quay#13-02 HSBC BuildingSingapore 049320
WEBSITE & EMAIL [email protected]
STOCK CODEC38U
TRUSTEEHSBC Institutional Trust Services(Singapore) Limited21 Collyer Quay#03-01 HSBC BuildingSingapore 049320Tel: +65 6658 6906Fax: +65 6534 5526
AUDITORKPMG LLPPublic Accountants andChartered Accountants16 Raffles Quay#22-00 Hong Leong BuildingSingapore 048581Tel: +65 6213 3388Fax: +65 6225 0984Partner-In-Charge:Leong Kok Keong(With effect from financial yearended 31 December 2012)
UNIT REGISTRARBoardroom Corporate &Advisory Services Pte. Ltd.50 Raffles Place#32-01 Singapore Land TowerSingapore 048623Tel: +65 6536 5355Fax: +65 6536 1360
THE MANAGER
REGISTERED ADDRESSCapitaLand Mall TrustManagement Limited168 Robinson Road#30-01 Capital TowerSingapore 068912Tel: +65 6713 2888Fax: +65 6713 2999
BOARD OF DIRECTORSRichard R. MagnusChairman & Non-ExecutiveIndependent Director
Lim Ming YanDeputy Chairman & Non-ExecutiveNon-Independent Director
Tan Wee Yan, WilsonChief Executive Officer &Executive Non-Independent Director
Tan Kian ChewNon-Executive Non-Independent Director
Ng Chee KhernNon-Executive Independent Director
Lee Khai Fatt, KyleNon-Executive Independent Director
Fong Kwok JenNon-Executive Independent Director
Gay Chee CheongNon-Executive Independent Director
Jason Leow Juan ThongNon-Executive Non-Independent Director
AUDIT COMMITTEELee Khai Fatt, KyleChairman
Fong Kwok JenGay Chee Cheong
CORPORATE DISCLOSURECOMMITTEERichard R. MagnusChairman
Lim Ming YanJason Leow Juan Thong
EXECUTIVE COMMITTEELim Ming YanChairman
Tan Wee Yan, WilsonJason Leow Juan Thong
INVESTMENT COMMITTEELim Ming YanChairman
Richard R. MagnusLee Khai Fatt, KyleJason Leow Juan Thong
COMPANY SECRETARIESLee Ju Lin, AudreyTan Lee Nah
CapitaLand Mall Trust Management LimitedAs Manager of CapitaLand Mall Trust Company Registration No. 200106159R
168 Robinson Road#30-01 Capital TowerSingapore 068912Tel: +65 6713 2888Fax: +65 6713 2999Email: [email protected]
www.cmt.com.sg
This report is printed using soy-based ink on FSC mix uncoated paper which is part
produced using hydroelectric power.


