www.rti.org RTI International is a registered trademark and a trade name of Research Triangle Institute. Innovation Corridor Innovation and Economic Data Analysis Michael Hogan, Sara VanLear, Elizabeth Brown, Alison Bean, Joshua Fletcher and Sara Lawrence April 2020
Transcript
www.rti.orgRTI International is a registered trademark and a trade name of Research Triangle Institute.
Innovation Corridor Innovation and Economic Data Analysis
Michael Hogan, Sara VanLear, Elizabeth Brown, Alison Bean, Joshua Fletcher and Sara LawrenceApril 2020
The Innovation Corridor study includes four phases of research to develop ideas for transformative growth in NC over the next few decades. This Data Appendix represents PhaseI of RTI’s research: a summary of NC’s and the Innovation Corridor’s economic and innovation performance over the last decade.
Innovation Corridor Data Appendix Overview
Summary of Research Approach
Innovation and Economic Analysis
Qualitative Review of
KC’s Regional Needs
Targeted Industry and
Market Analysis
Blueprint for Innovation Corridor
Phase I
Summarized state and regional innovation
economy.
Developed economic and innovation profiles for the Corridor and the
four economic hubs.
Created this Data Appendix.
Phase II
Conducted exploratory interviews with stakeholders.
Ground-truthed Phase I findings, identified
emerging and cross-cutting innovation trends, and refined research outcomes.
Phase III
Determined industry sectors with high
potential for tech-driven growth and economic
opportunity.
Determined market size, potential, and capabilities
required for growth.
Phase IV
Conducted targeted interviews with stakeholders
in each economic hub. Assessed key investments
required to enhance “quality of place” to attract business
and talent.
Created blueprint for Innovation Corridor.
The Innovation Corridor Geography
RTI proposed an integrated Innovation Corridor from Winston-Salem to Greenville to expand the potential, opportunity, and impacts of an innovation economy across North Carolina. This corridor represents:
§ A diverse economic region with nearly 4.4 million residents and over $218 billion in economic output.
§ Economic activities that are integrated by commuting patterns and supply chain linkages.
§ Cities with geographic and economic diversity that provide a “test bed” for analyzing the types of investments that can transform growth in a range of regional contexts.
The Proposed Innovation CorridorThe study area is a continuous corridor including the combined statistical areas (CSAs) of
Greensboro-Winston-Salem-High Point, Raleigh-Durham-Chapel Hill, Rocky Mount-Wilson-Roanoke Rapids, and Greenville-Washington.
Source: U.S. Census Bureau, Combined Statistical Areas.
2. Economic Overview of North Carolina (Slides 16-29)a) Macroeconomic Indicators (17-18)b) Industry Composition and Trends (19-21)c) High-Tech Industry Trends (22-23)d) Innovation Performance (24-26)e) Jobs and Occupations Trends (27-29)
3. Understanding the Innovation Corridor (Slides 30-68)a) Population Summary (31-34)
i. Socioeconomic Trendsii. Economic Mobility
b) Commuting Patterns (35-36)c) Industry Makeup and Trends across Innovation
Corridor (37-42)i. Industry Trends: Greenville-Washington CSAii. Industry Trends: Rocky Mount-Wilson-Roanoke Rapids CSAiii. Industry Trends: Greensboro-Winston-Salem-High Point CSAiv. Industry Trends: Raleigh-Durham-Chapel Hill CSA
d) Jobs in High-Technology Industries (43-48)i. Jobs in High Tech in Industry Subsectors in KC CSAsii. Jobs in High Tech: Greenville-Washington CSAiii. Jobs in High Tech: Rocky Mount-Wilson-Roanoke Rapids
CSAiv. Jobs in High Tech: Greensboro-Winston-Salem-High Point
CSAv. Jobs in High Tech: Raleigh-Durham-Chapel Hill CSA
e) STEM Jobs (49-54)i. STEM Jobs: Occupations in KC CSAsii. STEM Jobs: Greenville-Washington CSAiii. STEM Jobs: Rocky Mount-Wilson-Roanoke Rapids CSAiv. STEM Jobs: Greensboro-Winston-Salem-High Point CSAv. STEM Jobs: Raleigh-Durham-Chapel Hill CSA
f) Talent Pipeline (55-56)i. Degrees Conferredii. Science and Engineering Degrees
g) Innovation Assets (57-68)i. Innovation Ecosystem Assets across KC CSAsii. Patents Granted in North Carolinaiii. Startup Capitaliv. R&D Expenditures and Licensing
4. Data Definitions and Limitations (Slides 69-73)
Appendix Table of Contents
Innovation and Economic Analysis: Overall Findings
North Carolina’s Economy and Industries
§ North Carolina’s population has grown by 11% over a 10-year period, yet economic growth as measured by gross domestic product (GDP) has not kept pace.– NC has recovered from the 2008–2009 recession, but the economy as a whole is
growing more slowly (36.9%) than the national average (39.3%).§ NC has seen an industry shift from manufacturing to a range of services
during the same time period.– Professional services, wholesale trade, and real estate rental and leasing grew the
most. – Manufacturing, the largest single contributor to GDP, grew by 24%, which is slower
than overall state growth (36.9%) and national manufacturing growth (30%). § The state’s high-technology industry is growing at twice the rate of the
national average.
North Carolina’s Jobs and Wages
§ There is growth in high-skilled, high-wage occupations, such as computer, financial, and health care jobs, and in highly skilled industries such as professional and technical services and finance. This growth is concentrated in the Research Triangle region.
§ Manufacturing job losses have affected Greensboro, Rocky Mount, and Greenville. These losses have had an indirect effect on job losses in transportation, warehousing, wholesale trade, and construction.
§ Some of the largest areas of employment, including accommodation and food services, retail, and some areas of health care, are seeing growth in low-wage jobs.
North Carolina’s Technology and Innovation Performance
§ Eight percent of jobs in North Carolina are in high-tech industries. High-tech jobs are growing at close to two times the national average, but they tend to pay less than the national average for high-tech jobs.
§ Compared with national and regional peers, the state has risen quickly in the ranks of research and development (R&D) expenditures, patenting, SBIR funding, and STEM and high-tech jobs.
§ Venture capital per $1 million of GDP in the state had risen in total value to $875 in 2018 (from $567 in 2010), but relative performance is flat with a steady ranking of 12th over the 10-year period.
Innovation Corridor’s Economy and Industries
The region has recovered from its pre-recession peak of over 1.4 million jobs, with a net job growth of 8% between 2008 and 2018. The fastest growing job segments were leisure and hospitality (27% growth) and professional and business services (20% growth).
Over the same period, manufacturing jobs in the region declined by 12% compared with an 8% decline for the state.
Economic output for the Innovation Corridor is $218 billion. The region has over 1.6 million private-sector jobs with most employment in:
§ Trade, transportation, and utilities (21%) § Education and health services (18%)§ Professional and business services (18%)
The Innovation Corridor is a region of extremes. For example population ranges from 2.2 million in the Raleigh-Durham-Chapel Hill CSA to 226,000 in the Greenville-Washington CSA, and the poverty rate is 12% and 25% respectively in these two CSAs.
Growth Is Concentrated in Raleigh-Durham
Since 2008, the growth in the Innovation Corridor has been highly concentrated in the Research Triangle region (Raleigh and Durham-Chapel Hill metropolitan statistical areas [MSAs]). It has a fast-growing and highly diversified high-tech sector.
From 2008 through 2018, the region grew by 132,000 private-sector jobs (19%), while the remaining regions saw flat or negative job growth.
In 2018, within the Innovation Corridor, the Raleigh-Durham-Chapel Hill CSA had: § 52% of all jobs§ 70% of science and engineering degrees conferred§ 74% of all jobs in high-tech industries§ 78% of STEM jobs
Raleigh and Durham-Chapel Hill MSAs
Innovation Corridor’s Jobs and Wages
§ STEM jobs in the Innovation Corridor are highly concentrated and growing in the Triangle region. The Raleigh-Durham-Chapel Hill CSA has 38% of the STEM occupations in the state and 78% of STEM jobs in the Innovation Corridor. The majority of STEM jobs in the region are in computer science.
§ The Piedmont Triad (Greensboro-Winston-Salem-High Point CSA) benefits from a core of headquarters and management, but high-tech growth is occurring in smaller emerging sectors, including professional services and aerospace manufacturing. – Major corporate headquarters contribute many jobs, but the management sector is declining
slowly in the region. § Pharmaceutical manufacturing is the primary source of high-tech jobs and
growth in the eastern part of the Innovation Corridor largely because of the manufacturing facilities of Pfizer, Merck, Thermo Fischer, and others.
§ STEM jobs pay a median wage of $81,000 per year compared with $34,000 per year for non-STEM jobs.
Trends in Innovation and Research
§ Private-sector companies headquartered in NC make up 33% of patents granted to North Carolina inventors. – Common technologies include computing, calculating, counting; medical or
veterinary science, hygiene; electronic communication; and basic electric elements.
§ Emerging technology areas with growth in patents granted include wireless communication, power electronics, gene therapy, microorganisms, and health care informatics.
§ The Corridor boasts significant innovation assets, including 267 organizations that support R&D, technology commercialization, and entrepreneurship.
Innovation Corridor’s Innovation Performance and Assets
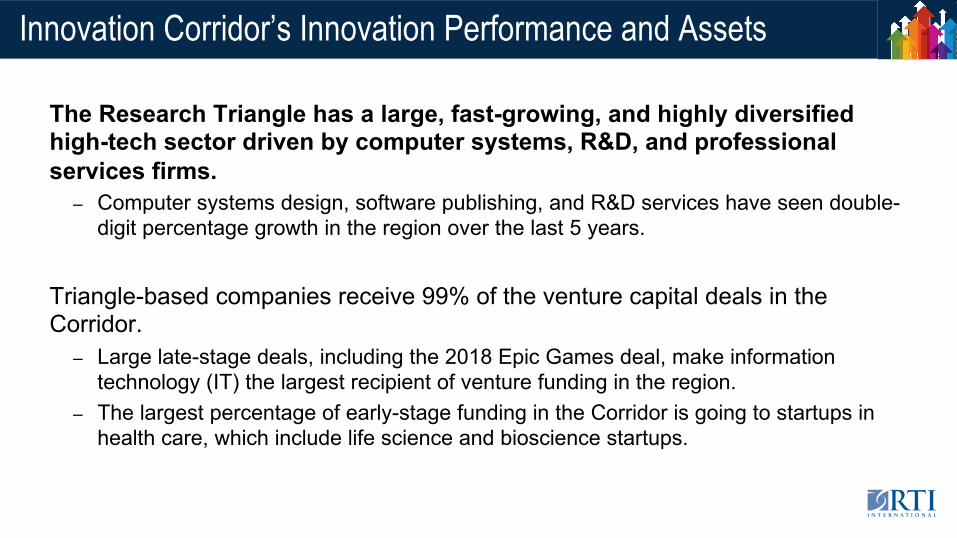
The Research Triangle has a large, fast-growing, and highly diversified high-tech sector driven by computer systems, R&D, and professional services firms.
– Computer systems design, software publishing, and R&D services have seen double-digit percentage growth in the region over the last 5 years.
Triangle-based companies receive 99% of the venture capital deals in the Corridor.
– Large late-stage deals, including the 2018 Epic Games deal, make information technology (IT) the largest recipient of venture funding in the region.
– The largest percentage of early-stage funding in the Corridor is going to startups in health care, which include life science and bioscience startups.
North Carolina’s Economy:Current Structure and Performance
Population GDP GDP per Capita
Household Income Poverty Rate
2018 value 10,273,419Rank: 9th
$565.8B Rank: 11th
$45,834Rank: 39th
$52,413Rank: 44th
14.0%Rank: 35th
2008 value 9,222,414Rank: 10th
$413.4BRank: 9th
$37,636Rank: 32nd
$46,549Rank: 40th
14.6%Rank: 36th
10-year% change +11.4% +36.9% +21.8% +17.3% +0.7%
Rank trend
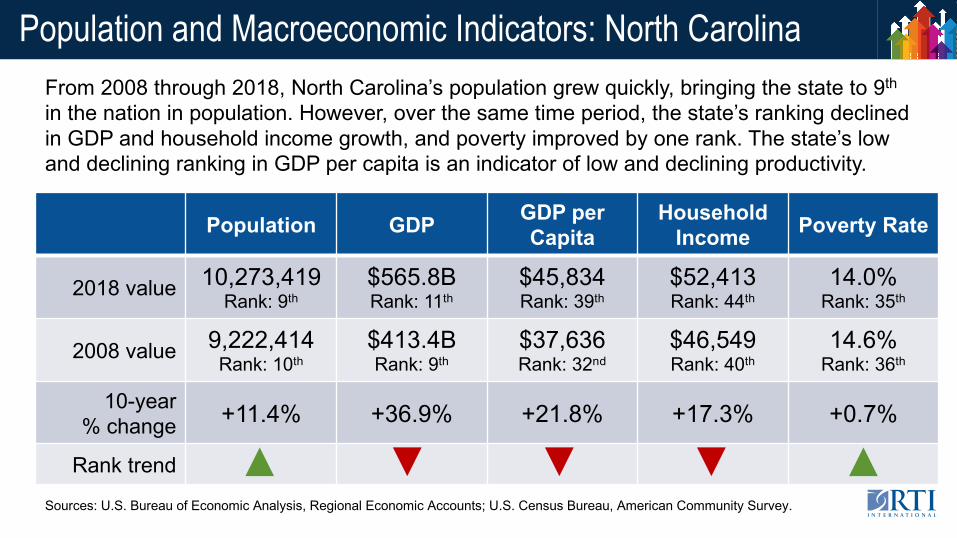
Population and Macroeconomic Indicators: North CarolinaFrom 2008 through 2018, North Carolina’s population grew quickly, bringing the state to 9th
in the nation in population. However, over the same time period, the state’s ranking declined in GDP and household income growth, and poverty improved by one rank. The state’s low and declining ranking in GDP per capita is an indicator of low and declining productivity.
Sources: U.S. Bureau of Economic Analysis, Regional Economic Accounts; U.S. Census Bureau, American Community Survey.
North Carolina has recovered slowly from the 2008–2009 recession.
Since 2008, North Carolina’s economy (36.9% growth) has grown more slowly than the U.S. economy (39.3%) despite being one of the fastest growing states in the nation in population.
Source: U.S. Bureau of Economic Analysis, Regional Economic Accounts.
GDP Growth: 2008–2018North Carolina, Southeast, and National: 2008=100
GDP Industry Growth Composition
Manufacturing (24%)
Real estate and rental and leasing
Finance and insurance
Health care and social assistance
Professional, scientific, and technical services (70%)
Composition of North Carolina GDP Growth: 2008–2018From 2008 through 2018, North Carolina’s GDP grew by 36.9%, more slowly than the nation as a whole at 39.3%.
Professional services (70%), wholesale trade (48%), and real estate rental and leasing (46%) grew the most. Manufacturing, the largest single contributor to GDP, grew by 24%, below the state growth (36.9%) and national manufacturing growth (30%).
Industry (growth percent)
Source: U.S. Department of Commerce, Bureau of Economic Analysis, Regional Economic Accounts.Figures limited to sectors contributing up to 50% of state output. Figures in current dollar value.
GDP Makeup: Less Manufacturing, More Services
20%
0% 1% 1% 1% 2% 2% 2% 2% 3% 3% 4% 4%5% 6% 6% 7%
9%
11%
18%
Mining, q
uarryin
g, oil a
nd gas
Arts, en
te rtainm
ent, a
nd rec
reation
Agricultu
re, fo res
try, fis
h ing, h
unting
Educatio
nal se
rvices
Utilities
Other se
rvices
Managem
ent of
compan
ies
Transpo
rtation
and w
arehou
sing
Accommoda
tion an
d food
Adminis
trative
and wast
e serv
ices
Inform
ation
Constru
ction
Retail tr
ade
Wholesa
le trad
e
Profess
ional a
nd tec
hnica l se
rvices
Health
care a
nd soc
ial ass
istance
Finance
and in
suranc
e
Real es
tate an
d renta
l and lea
sing
Manufac
turing
2008 2018
Percentage of state GDP, by sectorNorth Carolina, 2008–2018
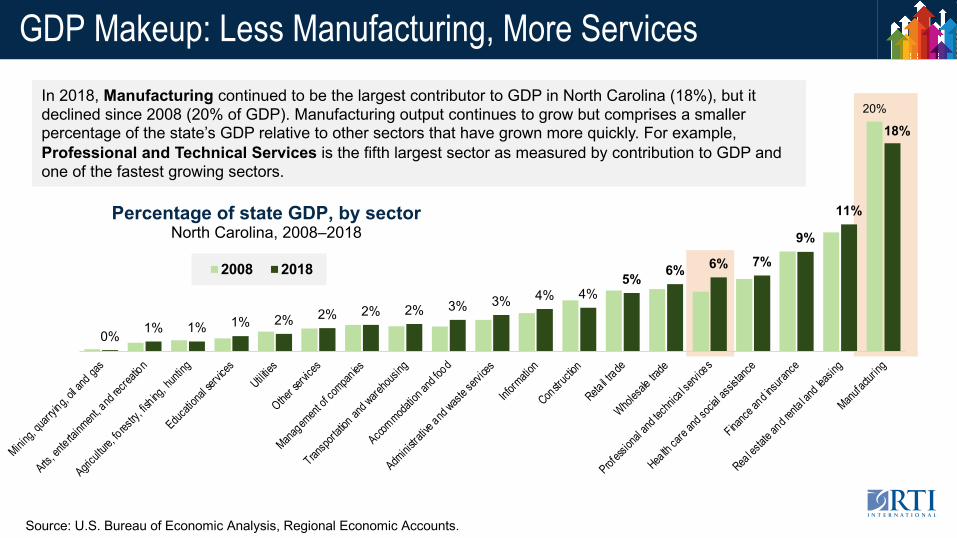
In 2018, Manufacturing continued to be the largest contributor to GDP in North Carolina (18%), but it declined since 2008 (20% of GDP). Manufacturing output continues to grow but comprises a smaller percentage of the state’s GDP relative to other sectors that have grown more quickly. For example, Professional and Technical Services is the fifth largest sector as measured by contribution to GDP and one of the fastest growing sectors.
Source: U.S. Bureau of Economic Analysis, Regional Economic Accounts.
GDP of Manufacturing: Increasing Output, Declining Jobs
Sources: U.S. Bureau of Economic Analysis, Regional Economic Accounts; U.S. Bureau of Labor Statistics, Quarterly Census of Employment and Wages. Output expressed in 2018 dollars.
2008–201824% increase in output
Manufacturing Contribution to GDP and Jobs in North Carolina: 1998–2018Over the last two decades, jobs in manufacturing in North Carolina have declined, while GDP output has risen, passing $100 billion in 2018. Manufacturing jobs are 8% below 2008 levels but have increased since 2010.
High-Technology Industries: Why They Matter
Opportunities exist across the Innovation Corridor region to strengthen and grow high-tech industries, which have an outsized impact on R&D intensity and STEM jobs. § High-tech industries make up 3.6% of jobs
nationally, but they account for a greater share of R&D activity, exports, wages, and output.
3.6%
3.8%
6.2%
8.1%
27.2%
58.7%
70.1%
Share of Jobs
Share of Firms
Share of Gross Output
Share of Wages
Share of Exports
Share of R&D Jobs
Share of Business R&DInvestment
Share of Economic Activity by High-Tech IndustriesUnited States, 2017
Source: Information Technology & Innovation Foundation (2017). How Technology-Based Startups Support U.S. Economic Growth, pp.15-16. Bureau of Labor Statistics (BLS).
BLS identifies 28 high-tech industries, including professional services, manufacturing, IT, utilities, and others. They include a mix of STEM and non-STEM occupations.
Source: EMSI.
The high-tech sector in North Carolina outpaces the nation in job growth and is projected to grow at a steady pace.
On average, high-tech jobs in NC tend to pay 12% below the national average high-tech wage.
High-Technology Industries: Growth in North Carolina
401,742Jobs (2018)
4% above national average per capita
+23.4%Growth (2001–2018)
1.9x national average Nation: +12.2%
$118,627Average earnings per job (2018)
12% below national averageNation: $135,849
High-Tech Industries in North Carolina: Job Growth and Earnings
Innovation: NC Performance from 2008 to Present
Indicator - most recent year
10-Year Past
Value
10-Year Past Rank
Current Value
Current Rank
Trend Rank
Gross Expenditures on R&D as a Percentage of GDP (%) - 2015
2.05% 23 2.35% 19 p
Industry Expenditures on R&D as a Percentage of Private Industry Output (%) -2016
1.63% 19 2.24% 15 p
Academic Expenditures on R&D per $1,000 of GDP ($) - 2017
$4.83 8 $5.72 3 p
Patents Awarded per 1,000 Individuals in S&E Occupations (Number) - 2017
12.08 24 17.87 20 p
SBIR and STTR Funding per $1 Million Dollars GDP ($) - 2014-16
$106.67 31 $107.79 19 p
Tech-based Startups as a Share of Total Firms (%) - 2016
NA NA 2.97% 17 NA
Venture Capital per $1 Million GDP ($) -2017
$566.8 12 $875.1 12 —
STEM Workforce: Individuals in S&E Occupations as a Percentage of All Occupations (%) - 2017
3.56% 31 4.82% 18 p
High Tech Jobs as a Percentage of Total Employment (%) - 2017
3.6% 25 5.6% 10 p
GDP ($B) - 2018 $413.3 9 $565.8 11 q
GDP per Capita ($) - 2018 $37,636 32 $45,834 39 q
Population (Number) - 2018 9,309,449 10 10,383,620 9 —
Over the last decade, North Carolina has outperformed the nation in growth of science, technology, and innovation (STI) outputs.
Compared with national and regional peers, the state has risen quickly in the ranks of R&D expenditures, patenting, SBIR funding, and STEM and high-tech jobs.
However, the pay for high-tech jobs is below the national average, and growth in STI indicators has occurred alongside declining GDP per capita rankings (NC ranks 39th).
Innovation: Research and Development Spending
Indicator 2008 Value
2008 Rank
2015-17
Value
2015-17
Rank
Rank Trend
Gross Expenditures on R&D as a Percentage of GDP (%) - 2015
2.0% 23rd 2.4% 19th p
Industry Expenditures on R&D as a Percentage of Private Industry Output (%) - 2016
1.6% 19th 2.2% 15th p
Academic Expenditures on R&D per $1,000 of GDP ($) - 2017
$4.83 8th $5.72 3rd p
Over the past 10 years, North Carolina has moved up nationally in R&D expenditures by both industry and academic institutions. NC is a national leader in academic R&D expenditures, ranking 3rd in expenditures per $1,000 of GDP.
Gross Expenditure on Research & Development Percentage of GDP, North Carolina and Peers, 2001–2015
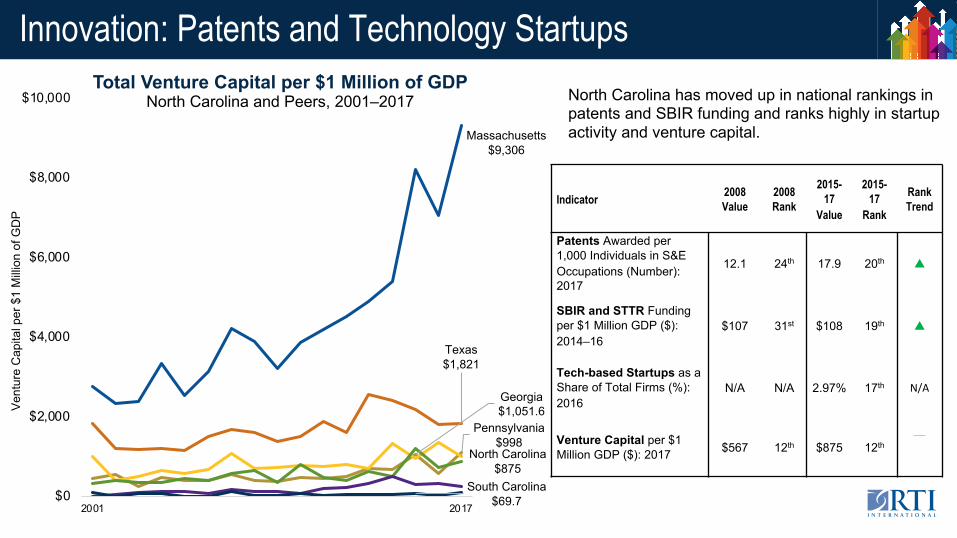
Innovation: Patents and Technology Startups
Indicator 2008 Value
2008 Rank
2015-17
Value
2015-17
Rank
Rank Trend
Patents Awarded per 1,000 Individuals in S&E Occupations (Number): 2017
12.1 24th 17.9 20th p
SBIR and STTR Funding per $1 Million GDP ($): 2014–16
$107 31st $108 19th p
Tech-based Startups as a Share of Total Firms (%): 2016
N/A N/A 2.97% 17th N/A
Venture Capital per $1 Million GDP ($): 2017 $567 12th $875 12th
—
Total Venture Capital per $1 Million of GDPNorth Carolina and Peers, 2001–2017
Massachusetts$9,306
Texas$1,821
Georgia$1,051.6
Pennsylvania$998
North Carolina$875
South Carolina$69.7$0
$2,000
$4,000
$6,000
$8,000
$10,000
2001 2017
Vent
ure
Cap
ital p
er $
1 M
illion
of G
DP
North Carolina has moved up in national rankings in patents and SBIR funding and ranks highly in startup activity and venture capital.
Jobs in North Carolina: Growth Concentrated in Services
3,116
27,087
220,584
474,843
14,498
59,976
72,386
79,912
83,884
86,065
109,889
133,695
173,356
182,400
254,600
296,823
430,408
499,888
505,746
Mining, quarrying, oil and gas
Agriculture, fo restry, fish ing and hunting
Construction
Manufacturing
Utilities
Rea l estate and renta l and leasing
Arts, entertainment, and recreation
Information
Management of compan ies
Educational services
Other services
Transportation and warehousing
Finance and insurance
Wholesale trade
Professional and technica l services
Administrative and waste services
Accommodation and food
Reta il trade
Hea lth care and social assistance
2008
2018
Jobs in year
Sectors gaining jobs
Sectors losing jobs
North Carolina’s post-recession growth has been strongest in services, with high job growth in areas like health care, retail, and food services. Production areas, including manufacturing and construction, have declined.
Growing sectors—health care, retail, and accommodation and food services—are large and growing, supporting 400,000–500,000 jobs each. However, retail and accommodation and food services rank at the bottom for average pay in the state.
Declining sectors: The manufacturing sector is large (475,000 jobs) but has shed employment since 2008. Construction, agriculture, and mining have also lost employment since 2008.
Private-Sector Jobs, by IndustryNorth Carolina, 2008–2018
Source: U.S. Bureau of Labor Statistics, QCEW.
Jobs in North Carolina: Growth in Low-Wage Industries
$17,840$28,632
$31,229$35,105$36,449$37,081
$47,982$49,245$50,823$50,872
$54,610$59,834
$61,805$74,066
$83,926$84,838
$95,254$99,946
$108,530
Accommodation and foodReta il trade
Arts, ente rtainment, and recreationOther services
Agriculture, fo restry, fish ingAdministrative and waste servicesHea lth care and social assistanceTransportation and warehousingRea l estate, rental and leasing
Educational servicesConstruction
ManufacturingMining, quarrying, oil and gas
Wholesale tradeInformation
Professional and technica l servicesUtilities
Finance and insuranceManagement of compan ies
Since 2008, the three largest growing industry sectors in North Carolina (health care, retail, accommodation and food service) have fallen to the bottom 50% of average pay.
Source: U.S. Bureau of Labor Statistics, Quarterly Census of Employment and Wages.
Professional and technical services has contributed to high wages and job growth since 2008.
Average Annual Pay, by IndustryNorth Carolina, 2018
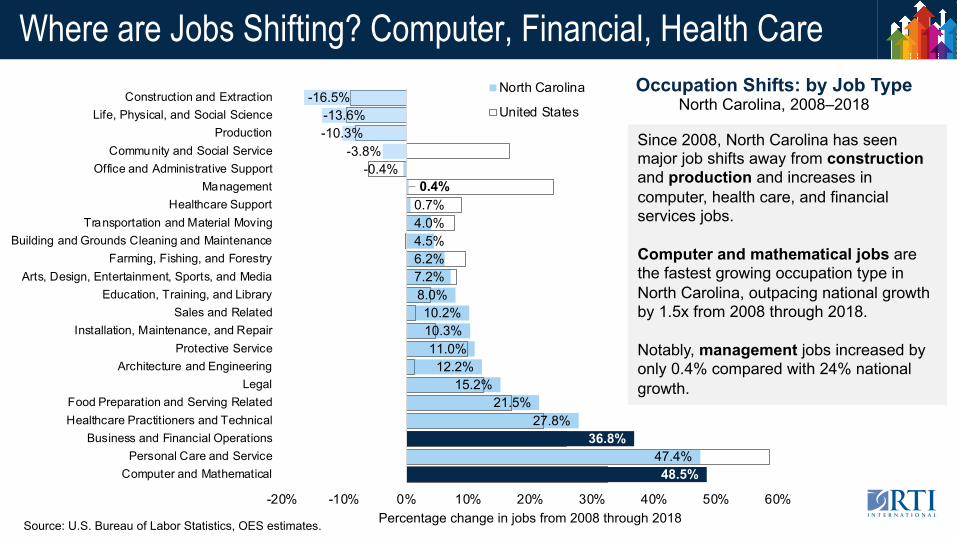
Where are Jobs Shifting? Computer, Financial, Health Care
48.5%47.4%
36.8%27.8%
21.5%15.2%
12.2%11.0%
10.3%10.2%
8.0%7.2%6.2%4.5%4.0%0.7%0.4%
-0.4%-3.8%
-10.3%-13.6%
-16.5%
-20% -10% 0% 10% 20% 30% 40% 50% 60%
Computer and MathematicalPersonal Care and Service
Business and Financial OperationsHealthcare Practitioners and TechnicalFood Preparation and Serving Related
LegalArchitecture and Engineering
Protective ServiceInstallation, Maintenance, and Repair
Sales and RelatedEducation, Training, and Library
Arts, Design, Entertainment, Sports, and MediaFarming, Fishing, and Forestry
Building and Grounds Cleaning and MaintenanceTransportation and Material Moving
Healthcare SupportManagement
Office and Administrative SupportCommunity and Social Service
ProductionLife, Physical, and Social Science
Construction and Extraction
Percentage change in jobs from 2008 through 2018
North Carolina
United States
Source: U.S. Bureau of Labor Statistics, OES estimates.
Since 2008, North Carolina has seen major job shifts away from constructionand production and increases in computer, health care, and financial services jobs.
Computer and mathematical jobs are the fastest growing occupation type in North Carolina, outpacing national growth by 1.5x from 2008 through 2018.
Notably, management jobs increased by only 0.4% compared with 24% national growth.
Occupation Shifts: by Job TypeNorth Carolina, 2008–2018
The Innovation Corridor’s Economic, Talent, and Innovation Assets
Four Innovation Corridor Economies: Overview
2,199,459Population
$126.8BEconomy
$65,093HH Income
12%Poverty
Raleigh-Durham-Chapel Hill CSA
1,663,532Population
$71.3BEconomy
$48,158HH Income
17%Poverty
Greensboro-Winston-Salem-High Point CSA
299,581Population
$11.7BEconomy
$41,220HH Income
16%Poverty
Rocky Mount-Wilson-Roanoke Rapids CSA
226,130Population
$8.4BEconomy
$44,209HH Income
25%Poverty
Greenville-Washington CSA
10,273,419Population
$565.8BEconomy
$52,413Median Household
Income (2018)
14%PovertyNorth Carolina
Source: U.S. Census Bureau, Census Reporter; U.S. Bureau of Economic Analysis, Regional Economic Accounts.
Innovation Corridor’s PopulationThe Innovation Corridor is a region of extremes. For example, population ranges from 2.2 million in the Raleigh-Durham-Chapel Hill CSA (17% growth over the last decade) to just under 300,000 in the Rocky Mount-Wilson-Roanoke Rapids CSA (4% decline over the last decade). Across the Innovation Corridor, the population has grown by 10% since 2010.
A portion of the population change is attributed to in-migration to Innovation Corridor CSAs. The top sources of in-migration include:
Source: U.S. Census, American Community Survey, 2013-2017 Metro Area In-, Out-, Net and Gross Migration.
Innovation Corridor’s Population, Continued The poverty rate is 15% and the unemployment rate is 4%—down from 10% in 2010. The poverty rate is 15% in the Innovation Corridor but varies dramatically across CSAs: the lowest poverty rate is 12% in Raleigh-Durham-Chapel Hill and the highest is in Greenville-Washington at 25%.
The population of the Innovation Corridor is aging. In 2010, 12% of the population was over 65. By 2018, 15% of the population was over 65.
All CSAs in the Innovation Corridor are becoming more racially and ethnically diverse.
All CSAs in the Innovation Corridor have experienced an increase in educational attainment for associate’s, bachelor’s, and doctorate/professional degrees. The share of people getting a college degree grew from 38% to 43%.
Educational Attainment as a Share of Total Population2010–2018
2010 2018
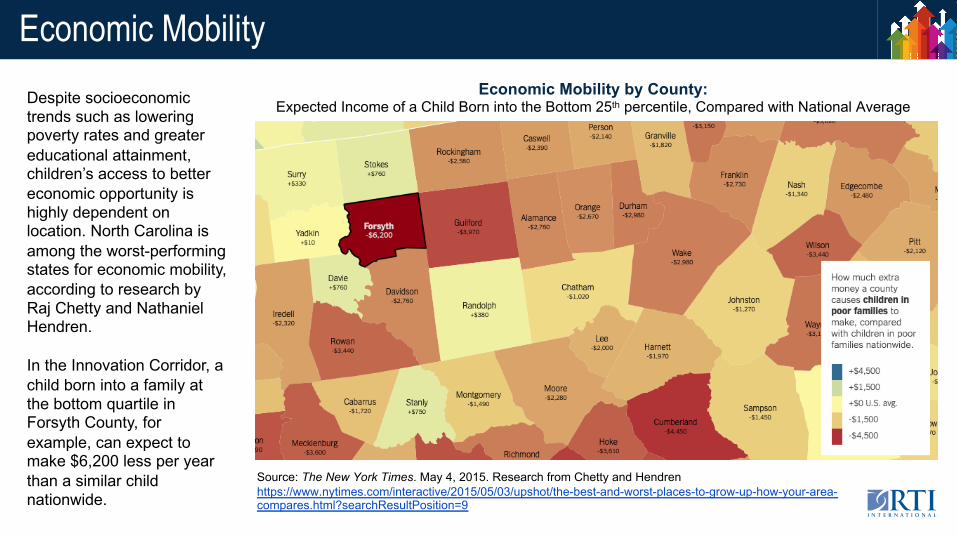
Economic MobilityEconomic Mobility by County:
Expected Income of a Child Born into the Bottom 25th percentile, Compared with National AverageDespite socioeconomic trends such as lowering poverty rates and greater educational attainment, children’s access to better economic opportunity is highly dependent on location. North Carolina is among the worst-performing states for economic mobility, according to research by Raj Chetty and Nathaniel Hendren.
In the Innovation Corridor, a child born into a family at the bottom quartile in Forsyth County, for example, can expect to make $6,200 less per year than a similar child nationwide.
Source: The New York Times. May 4, 2015. Research from Chetty and Hendren https://www.nytimes.com/interactive/2015/05/03/upshot/the-best-and-worst-places-to-grow-up-how-your-area-compares.html?searchResultPosition=9
Commuting Patterns in the Innovation CorridorThe corridor has multiple employment centers and commuters in the corridor are highly mobile: 736,465 people live in a different metro area than their place of work, representing 42% of primary jobs in the corridor.
Commuting Patterns by Metro Area of Primary Job
Proposed Innovation Corridor 2017
Source: U.S. Census Bureau. OnTheMap. Metropolitan Statistical Area (MSA) definitions from Census Bureau.
Metropolitan Statistical Area (MSA)
Net Job: Inflow/ Outflow
Employees Live and Work within MSA
% of Employees Commuting into
Other MSAs
% Employees Commuting from
Corridor Counties
Winston Salem Outflow Majority (63%) 37% 9%
Greensboro-High Point Inflow Majority (60%) 40% 7%
Durham-Chapel Hill Inflow Less than half (47%) 53% 26%
Raleigh Inflow Majority (61%) 39% 5%
Wilson Inflow Less than half (42%) 58% 22%
Rocky Mount Outflow Majority (56%) 44% 16%
Roanoke Rapids Outflow Majority (59%) 41% 11%
Greenville Inflow Majority (55%) 45% 8%
Washington Outflow Less than half (47%) 53% 15%
Commuting patterns are not uniform: 5 of the 9 MSAs have a net inflow of employees. Durham-Chapel Hill and Wilson MSAs have the highest inflow of employees from other Corridor metros or counties.
Source: U.S. Census Bureau. OnTheMap.
Commuting Patterns Across MSAs
Industry Makeup of the Innovation CorridorConstruction
6%
Manufacturing13%
Trade, transportation,
and utilities21%
Information2%
Financial activities5%
Professional and business services
18%
Education and health services
18%
Leisure and hospitality
13%
Other services3%
Innovation Corridor employment by sector
Total
1.6 million Private-sector jobs
$218 billion economic output
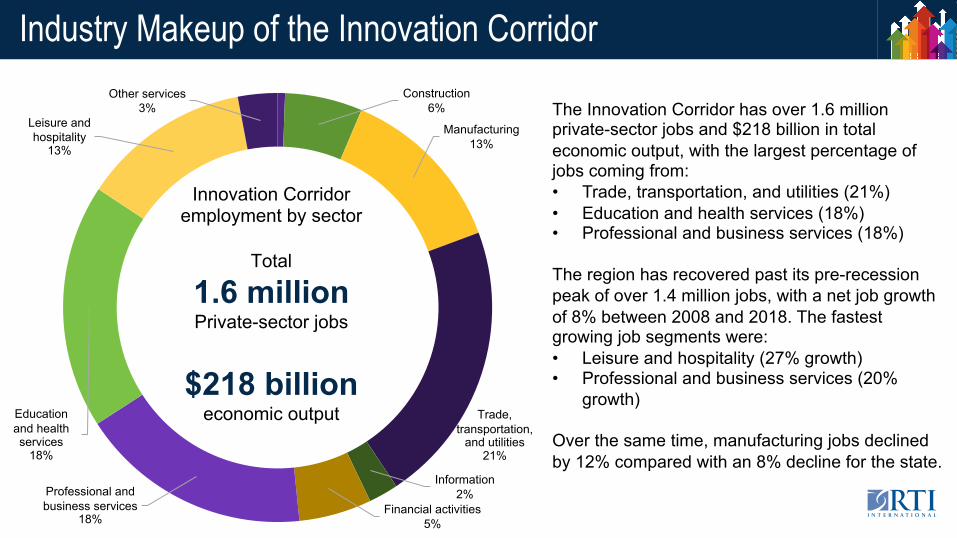
The Innovation Corridor has over 1.6 million private-sector jobs and $218 billion in total economic output, with the largest percentage of jobs coming from: • Trade, transportation, and utilities (21%) • Education and health services (18%)• Professional and business services (18%)
The region has recovered past its pre-recession peak of over 1.4 million jobs, with a net job growth of 8% between 2008 and 2018. The fastest growing job segments were: • Leisure and hospitality (27% growth) • Professional and business services (20%
growth)
Over the same time, manufacturing jobs declined by 12% compared with an 8% decline for the state.
The Geography of Industry Growth in Innovation Corridor
Source: U.S. Bureau of Labor Statistics, Quarterly Census of Employment and Wages.
Private-Sector Employment by Region Proposed Innovation Corridor: 1998–2018
+19%
Post-recession job growth(2008–2018)
+1%
-2%-10%
Gre
at R
eces
sion
In 2018, there were over 1.6 millionprivate-sector jobs in the Innovation Corridor, an increase from fewer than 1.4 million at the lowest point of the Great Recession in 2010.
The region has seen an uneven recovery since the recession: • The Research Triangle Region
has added over 130,000 jobs compared with pre-recession and makes up 52% of jobs in the Corridor.
• The remaining regions have seen a net loss of 5,600 jobs over the same period, with the largest losses in the Rocky Mount region.
Sector Shifts: Greenville-Washington, NC
Utilities
Construction
Manufacturing
Wholesale trade
Retail trade
Transportation and warehousing
Information
Finance and insurance Real estate and rental and leasing
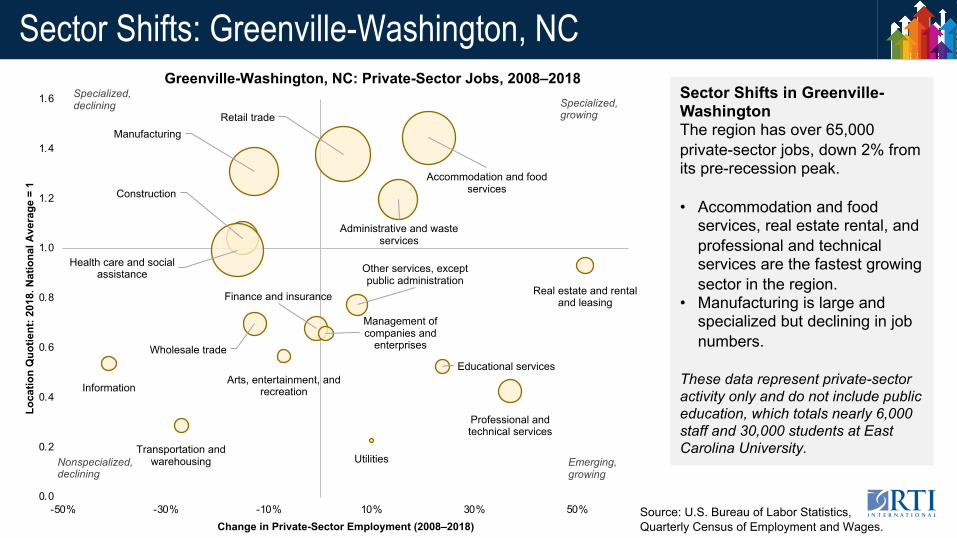
Sector Shifts in Greenville-WashingtonThe region has over 65,000 private-sector jobs, down 2% from its pre-recession peak.
• Accommodation and food services, real estate rental, and professional and technical services are the fastest growing sector in the region.
• Manufacturing is large and specialized but declining in job numbers.
These data represent private-sector activity only and do not include public education, which totals nearly 6,000 staff and 30,000 students at East Carolina University.
Source: U.S. Bureau of Labor Statistics, Quarterly Census of Employment and Wages.
Sector Shifts: Rocky Mount-Wilson-Roanoke RapidsSector Shifts in Rocky Mount-Wilson-Roanoke RapidsThe region has over 93,000 private-sector jobs, down 10% from its pre-recession peak.
• Manufacturing is the largest and most specialized sector in the region (2.0X the national average jobs per capita). Large pharmaceutical and tire manufacturers in the region are major employers.
• Private educational services, management, accommodation and food services, and health care are growing in the region.
Agriculture, forestry, fishing and hunting
Utilities
Construction
Manufacturing
Wholesale trade
Retail trade
Transportation and warehousing
Information
Finance and insuranceReal estate and rental
and leasing
Professional and technical services
Management of companies and
enterprisesAdministrative and
waste services
Educational services
Health care and social assistance
Arts, entertainment, and recreation
Accommodation and food services
Other services, except public administration
0.0
0.5
1.0
1.5
2.0
2.5
-40% -30% -20% -10% 0% 10% 20%
Loca
tion
Quo
tient
: 201
8. N
atio
nal A
vera
ge =
1
Change in Total Private-Sector Employment (2008-2018)
Source: U.S. Bureau of Labor Statistics, Quarterly Census of Employment and Wages.
Sector Shifts: Greensboro-Winston-Salem-High PointSector Shifts in Greensboro-Winston-Salem-High PointThe region has over 620,000 private-sector jobs, an increase of 1% from its pre-recession peak.
• Manufacturing has seen large job losses but is still the largest and most specialized sector in the region (1.6X the national average jobs per capita). Tobacco, textile, and furniture manufacturers employ fewer people, while aerospace and transportation manufacturing have grown.
• Health care, accommodation and food services, and trade are growing in the region. Agriculture, forestry,
fishing and hunting
Mining, quarrying, and oil and gas extraction
Utilities
Construction
Manufacturing
Wholesale tradeRetail trade
Transportation and warehousing
Information
Finance and insurance
Real estate and rental and leasing
Professional and technical services
Management of companies and
enterprises
Administrative and waste services
Educational services
Health care and social assistance
Arts, entertainment, and recreation
Accommodation and food services
Other services, except public administration
0.0
0.2
0.4
0.6
0.8
1.0
1.2
1.4
1.6
1.8
-50% -30% -10% 10% 30% 50% 70%
Loca
tion
Quo
tient
: 201
8. N
atio
nal A
vera
ge =
1
Change in Total Private Sector Employment (2008-2018)
Source: U.S. Bureau of Labor Statistics, Quarterly Census of Employment and Wages
Sector Shifts: Raleigh-Durham-Chapel HillSector Shifts in Raleigh-Durham-Chapel Hill The region has over 837,000 private-sector jobs, an increase of 19% from its pre-recession peak.
• Private educational services and professional and technical services are large, highly specialized, and fast-growing sectors.
• Health care and retail trade are the largest employment sectors.
• Manufacturing is less specialized and employs fewer people.
• Finance, health care, accommodation and food services, entertainment, utilities, and transportation and warehousing are emerging and fast-growing sectors. Agriculture, forestry,
fishing and hunting
Utilities
Construction
Manufacturing
Wholesale tradeRetail trade
Transportation and warehousing
Information
Finance and insurance
Real estate and rental and leasing
Professional and technical services
Management of companies and
enterprises
Administrative and waste services
Educational services
Health care and social assistance
Arts, entertainment, and recreation
Accommodation and food services
Other services, except public administration
0.0
0.2
0.4
0.6
0.8
1.0
1.2
1.4
1.6
1.8
2.0
-30% -10% 10% 30% 50% 70% 90%
Loca
tion
Quo
tient
: 201
8. N
atio
nal A
vera
ge =
1
Change in Total Private Sector Employment (2008-2018)
Emerging, growing Source: U.S. Bureau of Labor Statistics,
Quarterly Census of Employment and Wages
Jobs in High-Technology Industries
Source: EMSI*EMSI models self-employed and proprietors not captured in BLS QCEW, so totals may differ from BLS estimates. **Data are not available for Roanoke Rapids (Halifax and Northampton Counties) and Washington County.
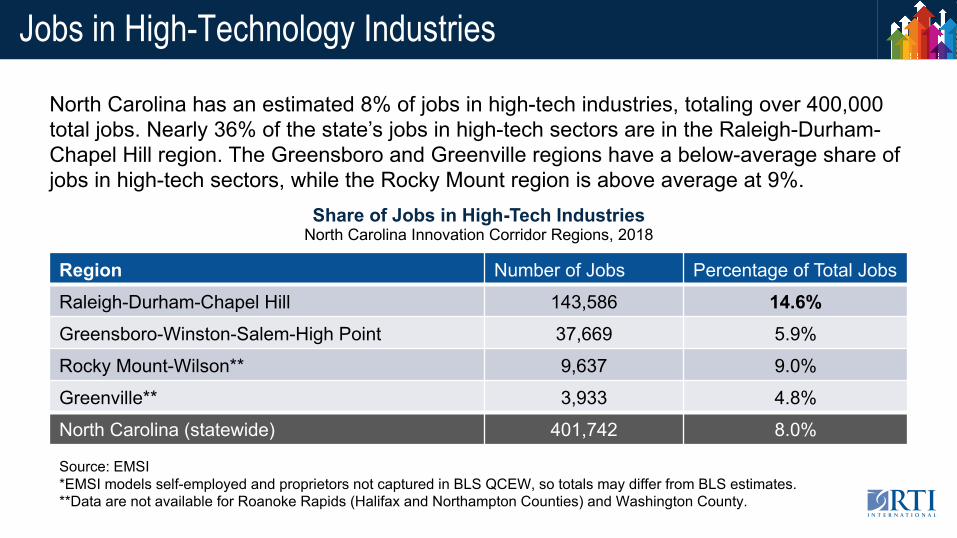
North Carolina has an estimated 8% of jobs in high-tech industries, totaling over 400,000 total jobs. Nearly 36% of the state’s jobs in high-tech sectors are in the Raleigh-Durham-Chapel Hill region. The Greensboro and Greenville regions have a below-average share of jobs in high-tech sectors, while the Rocky Mount region is above average at 9%.
Region Number of Jobs Percentage of Total Jobs
Raleigh-Durham-Chapel Hill 143,586 14.6%Greensboro-Winston-Salem-High Point 37,669 5.9%
Rocky Mount-Wilson** 9,637 9.0%
Greenville** 3,933 4.8%
North Carolina (statewide) 401,742 8.0%
Share of Jobs in High-Tech IndustriesNorth Carolina Innovation Corridor Regions, 2018
Jobs in High-Technology Industries: Subsectors and Regions
967
998
1,044
1,248
1,820
2,025
2,988
3,228
3,834
4,337
6,040
8,883
9,152
9,569
11,351
15,855
17,400
18,387
19,019
26,815
29,102
Industrial Machinery Manufacturing
Commercial and Service Industry Machinery…
Other Information Services
Basic Chemical Manufacturing
Communications Equipment Manufacturing
Other Telecommunications
Electrical Equipment Manufacturing
Aerospace Product and Par ts Manufacturing
Electric Power Generation, Transmission and…
Data Processing, Hosting, and Related Services
Semiconductor and Other Electronic Component…
Navigational, Measur ing, Electromedical, and Control…
Computer and Per ipheral Equipment Manufacturing
Wired and Wireless Telecommunications Carriers
Software Publishers
Pharmaceutical and Medicine Manufacturing
Management, Sc ientific, and Technical Consulting…
Scientific Research and Development Serv ices
Architectural, Engineering, and Related Services
Computer Systems Design and Related Serv ices
Management of Companies and Enterprises
Raleigh-Durham-Chapel Hill
Greensboro-Winston-Salem-High Point
Rocky Mount-Wilson
Greenville
High-tech employment in the Innovation Corridor is concentrated in the Research Triangle and the largest high-tech subsectors include:
§ Management of companies§ Computer science fields including computer
systems design, software publishers, computer equipment manufacturing, electromedical manufacturing, electronic component manufacturing, data processing, telecommunications, and other electronics manufacturing fields
§ Professional services including architecture and engineering, scientific R&D, and management consulting
Number of Jobs in High-Tech IndustriesNC Innovation Corridor, 2018
Source: EMSI, Bureau of Labor Statistics.
Jobs in High-Tech Industries: Greenville
Source: RTI analysis of Emsi - economicmodeling.com.*Note: Data were not available for Washington County.
40
55
64
76
127
148
181
320
361
669
1,823
Software Publishers
Other Telecommunications
Semiconductor and Component Manufacturing
Basic Chemical Manufacturing
Computer Systems Design and Related Services
Electrical Equipment Manufacturing
Wired and Wireless Telecommunications Carriers
Management, Scientific, and Technical ConsultingServices
Architectural, Engineering , and Related Services
Management of Companies and Enterprises
Pharmaceutical and Medicine Manufacturing
20132018
Number of Jobs in High-Tech IndustriesGreenville*: 2013–2018
Pharmaceutical manufacturing is the largest contributor to jobs and growth in the region, with major manufacturers including Thermo Fischer Scientific, Mayne Pharma, and Dyneema.
Architectural and engineering services and management, scientific, and technical consulting are growing slowly in the region.
Jobs in High-Tech Industries: Rocky Mount-Wilson
13
17
47
60
72
375
435
518
546
892
897
2,259
3,505
Scient ific Research and Development Services
Semiconductor and Component Manufacturing
Electric Power Generation, Transmission and Distribution
Industrial Machinery Manufactu ring
Computer Systems Design and Related Services
Architectural, Engineering , and Related Services
Wired and Wireless Telecommunications Carriers
Navigational, Measuring, Electromed ical, and ControlInstruments Manufacturing
Electrical Equipment Manufacturing
Data Processing, Hosting, and Related Services
Management, Scientific, and Technical Consulting Services
Management of Companies and Enterprises
Pharmaceutical and Medicine Manufacturing
20132018
Source: RTI analysis of Emsi - economicmodeling.com.*Note: Data were not available for Halifax and Northampton Counties.
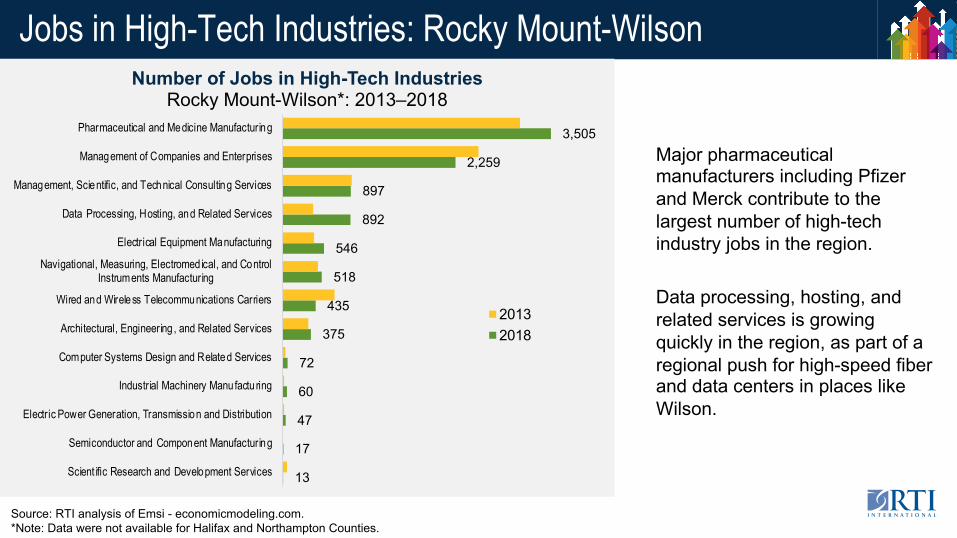
Number of Jobs in High-Tech IndustriesRocky Mount-Wilson*: 2013–2018
Major pharmaceutical manufacturers including Pfizer and Merck contribute to the largest number of high-tech industry jobs in the region.
Data processing, hosting, and related services is growing quickly in the region, as part of a regional push for high-speed fiber and data centers in places like Wilson.
Jobs in High-Tech Industries: Greensboro-W-S-High Point
451
471
531
673
687
734
745
750
818
2,036
2,572
2,950
3,012
3,018
3,550
13,776
Basic Chemical Manufacturing
Commercial and Service Indust ry Machinery Manufacturing
Computer and Peripheral Equipment Manufacturing
Navigational, Measuring, Electromed ical, and Control…
Industrial Machinery Manufactu ring
Electric Power Generation, Transmission and Distribution
Pharmaceutical and Medicine Manufacturing
Scient ific Research and Development Services
Data Processing, Hosting, and Related Services
Semiconductor and Other Electronic Component Manufacturing
Aerospace Product and Parts Manufacturing
Wired and Wireless Telecommunications Carriers
Architectural, Engineering , and Related Services
Management, Scientific, and Technical Consulting Services
Computer Systems Design and Related Services
Management of Companies and Enterprises
20132018
Source: RTI analysis of Emsi - economicmodeling.com.
Number of Jobs in High-Tech IndustriesGreensboro-Winston-Salem-High Point: 2013–2018
Major corporate headquarters (management of companies and enterprises) make up a large portion of the industry designated as high-tech, but there has been slow job decline in the sector.
Aerospace product and parts manufacturing is the fastest-growing high-tech sector.
Technical and professional services including computer systems design, architecture and engineering, and data processing are growing slowly in the region.
Jobs in High-Tech Industries: Raleigh-Durham-Chapel Hill
956 1,778 1,785 2,218 2,626 3,053
3,923 6,003
7,692 8,622
9,781 11,136
12,398 13,164
15,272 17,592
23,066
Other Information Services
Other Telecommunications
Communications Equipment Manufacturing
Electrical Equipment Manufacturing
Data Processing, Hosting, and Related Services
Electric Power Generation, Transmission and Distribution
Semiconductor and Other Electronic Component Manufacturing
Wired and Wireless Telecommunications Carriers
Navigational, Measuring, Electromed ical, and Control…
Computer and Peripheral Equipment Manufacturing
Pharmaceutical and Medicine Manufacturing
Software Publishers
Management of Companies and Enterprises
Management, Scientific, and Technical Consulting Services
Architectural, Engineering , and Related Services
Scient ific Research and Development Services
Computer Systems Design and Related Services
20132018
Source: RTI analysis of Emsi - economicmodeling.com.
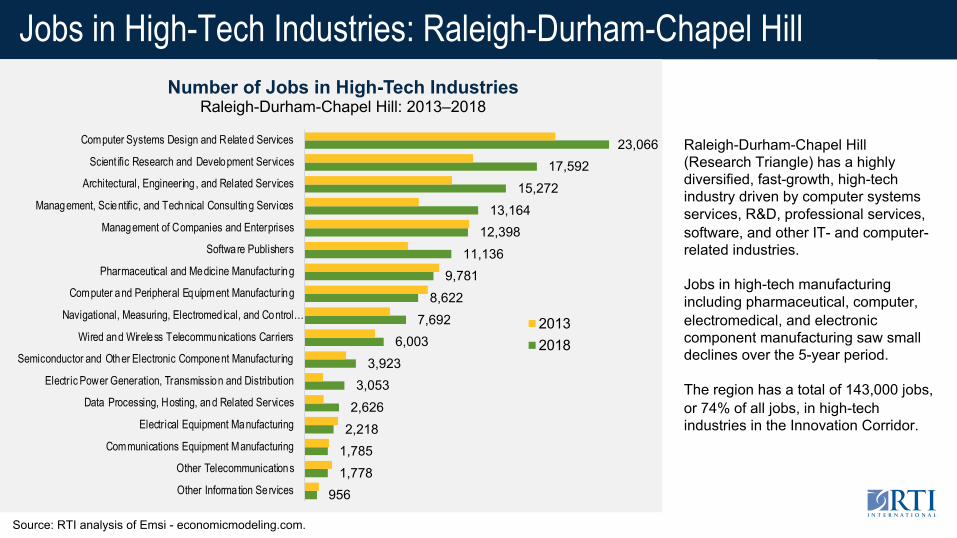
Number of Jobs in High-Tech IndustriesRaleigh-Durham-Chapel Hill: 2013–2018
Raleigh-Durham-Chapel Hill (Research Triangle) has a highly diversified, fast-growth, high-tech industry driven by computer systems services, R&D, professional services, software, and other IT- and computer-related industries.
Jobs in high-tech manufacturing including pharmaceutical, computer, electromedical, and electronic component manufacturing saw small declines over the 5-year period.
The region has a total of 143,000 jobs, or 74% of all jobs, in high-tech industries in the Innovation Corridor.
STEM Jobs: Central to the Innovation Economy
2008* 2018
STEM Jobs*STEM (% of total jobs)* STEM Jobs
STEM (% of total jobs)
Greenville** 610 0.8% 1,770 2.3%
Rocky Mount-Wilson** 590 1.0% 850 1.6%
Greensboro-Winston-Salem-High Point 14,060 2.2% 26,440 3.8%
Raleigh-Durham-Chapel Hill 48,320 6.1% 102,270 10.9%
North Carolina — — 271,090 6.2%
Source: U.S. Bureau of Labor Statistics, OES, 2008 and 2018. *Percentages are estimates based on 2018 definitions. Some data from 2008 are unavailable because of changes in OES methodology over time. **Data are not available for Roanoke Rapids (Halifax and Northampton Counties) and Washington County.
North Carolina’s shifting manufacturing sector and growing service sectors rely on a base of human capital that drives an innovation economy. Science, technology, engineering, and math (STEM) jobs, as defined by Occupational Employment Statistics (OES), are a critical component. They earn a median annual wage of over $81K (compared with $34K for non-STEM).
STEM jobs make up 6.2% of jobs in North Carolina but are unevenly distributed throughout the state and the Innovation Corridor: The Research Triangle Region has 38% of the STEM occupations in the state and 78% of the STEM occupations in the Corridor.
STEM Jobs: Occupations and Geography
16,940
13,110
10,850
7,550
5,9605,320
4,700 4,370 4,320 3,790
SoftwareDevelopers,Applications
ComputerSystems Analysts
Computer UserSupport
Specialists
SalesRepresentat ives,Wholesale andManufacturing,Technical and
In the Innovation Corridor, the majority of STEM jobs in the region are in software and computer occupations: 6 of the top 7 have a computer, software, or IT focus.
Occupations such as industrial engineers are found more frequently in manufacturing sectors concentrated in Greensboro-Winston-Salem-High Point and Rocky Mount-Wilson.
STEM Occupations in the Innovation Corridor (2018)
Source: U.S. Bureau of Labor Statistics, OES, 2018.*Data are not available for Roanoke Rapids (Halifax and Northampton Counties) and Washington County.
STEM Jobs: Greenville-Washington
Top STEM Occupations by Employment
Rank Occupation Employment Median Income
1 Chemists 360 $56,610
2 Computer User Support Specialists 330 $47,540
3 Computer Systems Analysts 120 $79,820
4 Industrial Engineers 120 $80,210
5 Civil Engineers 120 $84,920
6 Network and Computer Systems Administrators 100 $66,860
7 Computer Network Support Specialists 80 $46,020
8 Computer Programmers 80 $69,410
The most common STEM occupation in Greenville is chemist. The occupations mix is reflective of Greenville’s biopharmaceutical manufacturing sector, with a presence of chemists and engineers working in the sector.
Greenville-Washington’s STEM occupations mix also includes IT jobs as computer technicians and support staff, but fewer programmers and developers.
Source: U.S. Bureau of Labor Statistics, OES, 2018.
STEM Jobs: Rocky Mount-Wilson-Roanoke Rapids
Top STEM Occupations by Employment
Rank Occupation Employment Median Income
1 Industrial Engineers 220 $78,630
2 Computer User Support Specialists 120 $43,440
3 Mechanical Engineers 90 $88,030
4 Network and Computer Systems Administrators 80 $69,150
5 Computer Systems Analysts 70 $85,710
6 Electrical Engineers 70 $79,480
7 Electrical and Electronics Engineering Technicians 60 $58,940
8 Industrial Engineering Technicians 40 $46,770
The most common STEM occupation in Rocky Mount-Wilson-Roanoke Rapids is industrial engineer. The region’s STEM jobs mix has many engineering occupations, reflecting its manufacturing sector.
The STEM mix of Rocky Mount-Wilson-Roanoke Rapids also includes computer technicians and support staff.
Source: U.S. Bureau of Labor Statistics, OES, 2018.
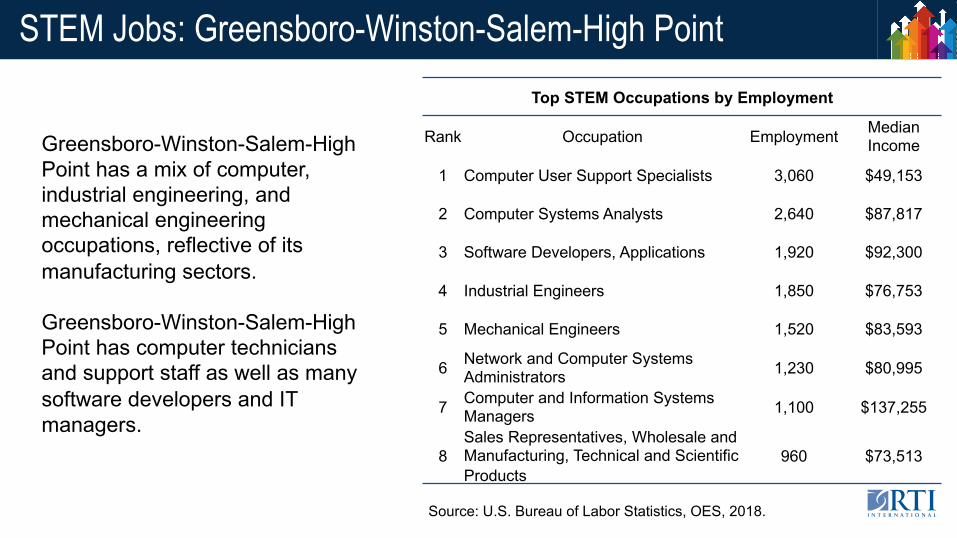
STEM Jobs: Greensboro-Winston-Salem-High PointTop STEM Occupations by Employment
Rank Occupation Employment Median Income
1 Computer User Support Specialists 3,060 $49,153
2 Computer Systems Analysts 2,640 $87,817
3 Software Developers, Applications 1,920 $92,300
4 Industrial Engineers 1,850 $76,753
5 Mechanical Engineers 1,520 $83,593
6 Network and Computer Systems Administrators 1,230 $80,995
7 Computer and Information Systems Managers 1,100 $137,255
8Sales Representatives, Wholesale and Manufacturing, Technical and Scientific Products
960 $73,513
Greensboro-Winston-Salem-High Point has a mix of computer, industrial engineering, and mechanical engineering occupations, reflective of its manufacturing sectors.
Greensboro-Winston-Salem-High Point has computer technicians and support staff as well as many software developers and IT managers.
Source: U.S. Bureau of Labor Statistics, OES, 2018.
STEM Jobs: Raleigh-Durham-Chapel HillTop STEM Occupations by Employment
Raleigh-Durham-Chapel Hill Greensboro-Winston-Salem-High Point Greenville Rocky Mount-Wilson-RR
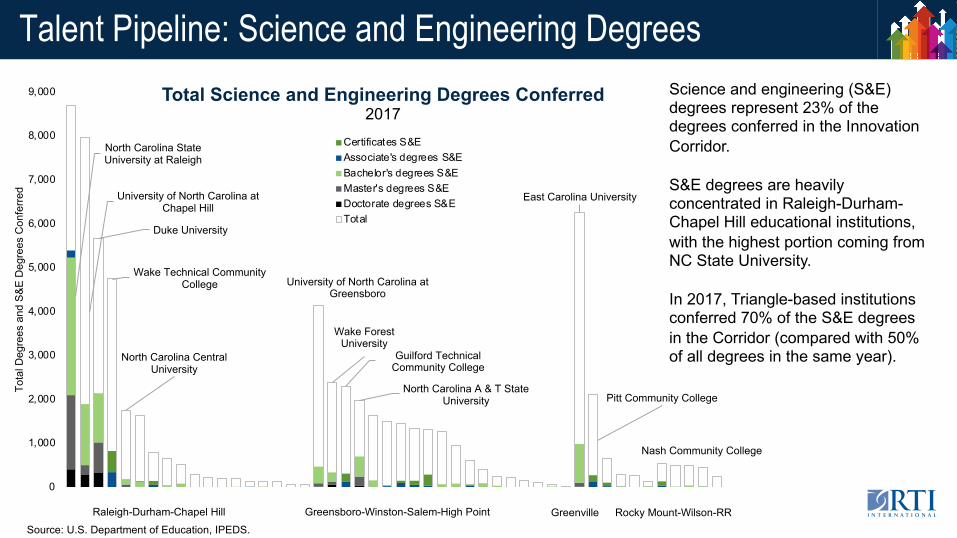
The Innovation Corridor’s human capital is supported by a broad mix of higher education institutions, conferring over 68,000 degrees in 2017. These are relatively evenly distributed throughout the Corridor:
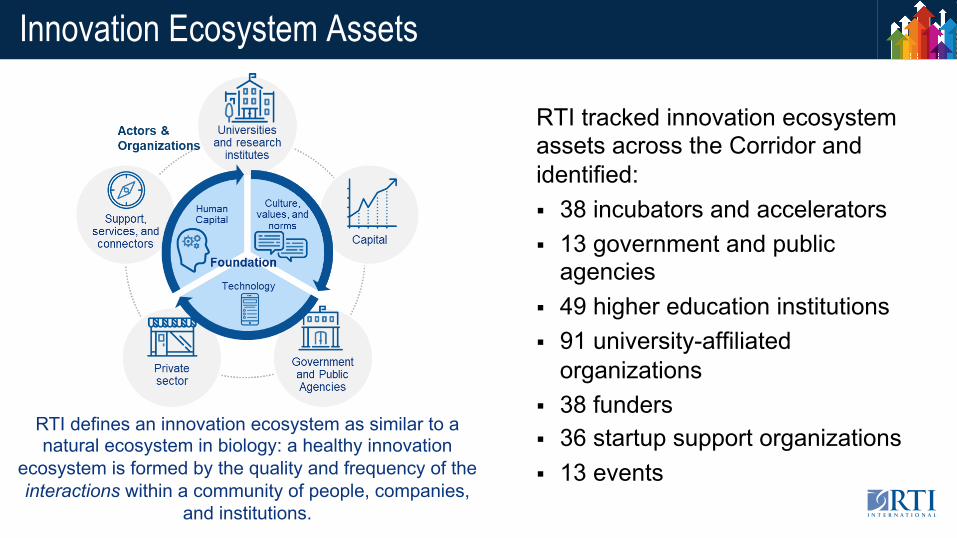
organizations§ 38 funders§ 36 startup support organizations§ 13 events
RTI defines an innovation ecosystem as similar to a natural ecosystem in biology: a healthy innovation
ecosystem is formed by the quality and frequency of the interactions within a community of people, companies,
and institutions.
Innovation Ecosystem Assets: Spread Across the Corridor
Source: RTI. The team tracked innovation ecosystem assets across the Corridor and identified 267 organizations with a physical address, as well as 15 networks and events without a fixed address. Locations are clustered by zip code in the map.
Innovation Ecosystem Assets in the Innovation Corridor
Patents Granted to Inventors in North Carolina
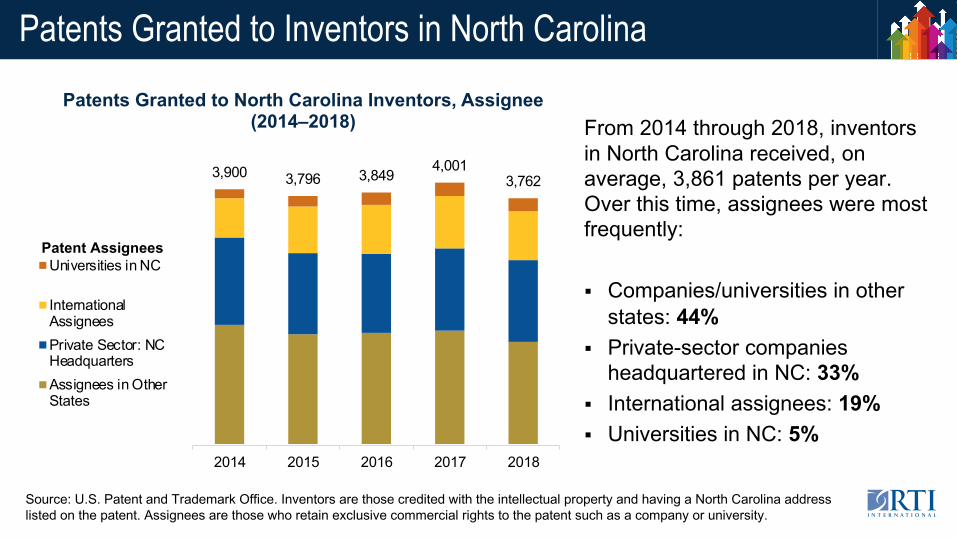
From 2014 through 2018, inventors in North Carolina received, on average, 3,861 patents per year. Over this time, assignees were most frequently:
§ Companies/universities in other states: 44%
§ Private-sector companies headquartered in NC: 33%
§ International assignees: 19%§ Universities in NC: 5%
Patents Granted to North Carolina Inventors, Assignee(2014–2018)
Source: U.S. Patent and Trademark Office. Inventors are those credited with the intellectual property and having a North Carolina address listed on the patent. Assignees are those who retain exclusive commercial rights to the patent such as a company or university.
3,900 3,796 3,849 4,0013,762
2014 2015 2016 2017 2018
Universities in NC
InternationalAssigneesPrivate Sector: NCHeadquartersAssignees in OtherStates
Patent Assignees
Private-sector companies headquartered in NC make up 33% of patents granted, with some of the largest located in the Innovation Corridor. Common technologies include:
§ Data analytics, computing, calculating, and counting
§ Medical or veterinary science, hygiene
§ Electronic communication§ Basic electric elements
Company Patents
Cree (Durham) 673Bank of America, Inc. (Charlotte) 558
Red Hat (Raleigh) 330Corning Optical Communications & Corning Cable Systems (Hickory) 309
Qorvo and RF Micro Devices (Greensboro) 223
SAS Institute (Cary) 216RJ Reynolds Tobacco (Winston-Salem) 142
Patents Granted to Companies Headquartered in NCPatents Granted to North Carolina Inventors
Private-Sector Assignees, 2014–2018Innovation Corridor HQs in bold
Source: U.S. Patent and Trademark Office.
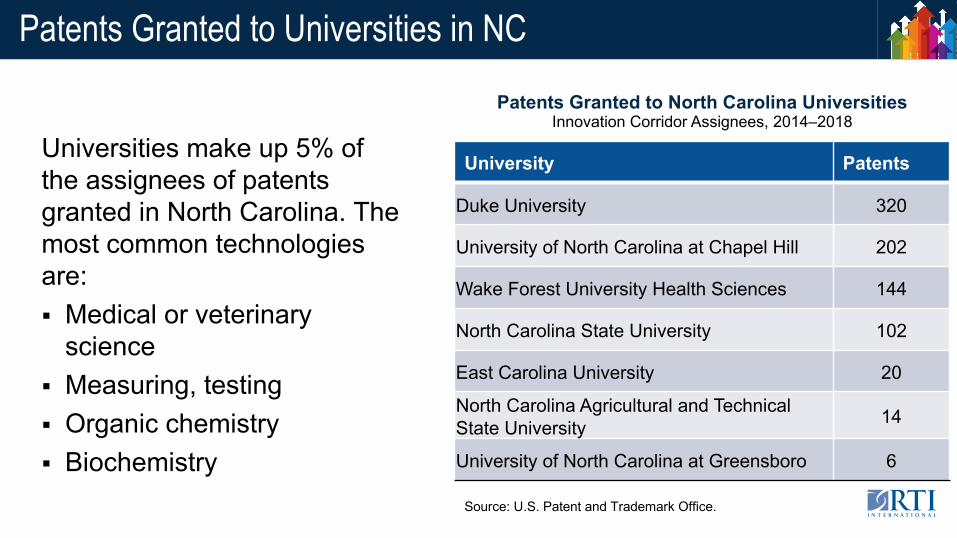
Universities make up 5% of the assignees of patents granted in North Carolina. The most common technologies are: § Medical or veterinary
North Carolina Agricultural and Technical State University 14
University of North Carolina at Greensboro 6
Patents Granted to Universities in NC
Patents Granted to North Carolina UniversitiesInnovation Corridor Assignees, 2014–2018
Source: U.S. Patent and Trademark Office.
Assignees headquartered outside of North Carolina make up the largest percentage of patents (53%).
Large domestic technology (IBM, Cisco, Qualcomm) and international (Lenovo, Ericsson) firms make up the largest portion of patents granted.
Assignee PatentsIBM 3,041
Lenovo 995
Cisco Technology, Inc. 257
QUALCOMM Incorporated 222
Telefonaktiebolaget LM Ericsson 162
NetApp, Inc. 143
EMC Corporation 133
NVIDIA Corporation 108
BorgWarner Inc. 95
Cook Medical Technologies LLC 94
Domestic and International PatentsPatents Granted to North Carolina Inventors
Assignees outside of North Carolina, 2014–2018
Source: U.S. Patent and Trademark Office.
Based on trends in CPC Codes for patents granted from 2014 through 2018, several themes emerged: § Prominent technology areas
include data processing and analytics and medical technology
§ Recent growth in IP production provides a snapshot of future technology areas including power electronics and gene therapy.
§ Some traditional technology areas are declining, including microelectronics and wired telephone technology.
Recent Growth (2014–2018) § Power electronics§ Health care informatics§ Wireless communication, signaling§ Gene therapy, microorganisms
Established But Declining Areas (2014–2018)§ Data analytics*§ Microelectronics, semiconductors§ Electric transmission and wired telephone technology§ Optical systems
*Companies are choosing to maintain trade secrets rather than patent and disclose in data analytics and software, contributing to some of the decline in the number of patents.
Technology Types
Source: U.S. Patent and Trademark Office.
Startup Capital: All Recent DealsTotal Value of Funding Deals, by Sector
Millions of Dollars, 2017–2018In 2017–2018, startups in the Innovation Corridor raised a total of $2.5 billion in funding across all rounds.• Over 99% of funding went to
firms headquartered in the Research Triangle Region; Durham, Raleigh, Morrisville, and Cary accounted for 645 total deals over 2 years.
IT is the largest recipient of venture funding in the region.• Cary-based Epic Games’ $1.2
billion deal in 2018 accounted for 76% of the deal value in IT and 50% of the total deal value.
Source: Pitchbook.
$1,587
$480
$305
$69 $51$6
$0
$200
$400
$600
$800
$1,000
$1,200
$1,400
$1,600
$1,800
InformationTechnology
Healthcare BusinessProducts and
Services (B2B)
Materials andResources
ConsumerProducts and
Services (B2C)
FinancialServices
Large late-stage deals, including the 2018 Epic Games deal, make IT the largest recipient of venture funding in the region.
However, the largest percentage of early-stage funding in the Innovation Corridor is going to startups in health care, which include life science and bioscience startups.
Early-stage health care startups raised over $208 million in 61 unique deals in 2017–2018 from private funders, federal grants, local institutions, and academic sources.
Startup Capital: Early-Stage Funding
6.62.3 12.2 9.4 9.4 3.2
1.112.4
29.2
163.8
64.9
31.4
$0
$50
$100
$150
$200
$250
Healthcare InformationTechnology
BusinessProducts and
Services(B2B)
ConsumerProducts and
Services(B2C)
Healthcare InformationTechnology
Materials andResources
Greensboro-Winston-Salem-High Point
Raleigh-Durham-Chapel Hill
Tota
l Val
ue o
f Ear
ly-S
tage
Fun
ding
Dea
ls (m
illion
s $)
Grant
Early Stage VC
Accelerator/Incubator
Seed Round
Angel (individual)
Product Crowdfunding
Value of Early-Stage Funding Deals, by SectorMillions of Dollars, 2017–2018
Source: Pitchbook.
R&D Expenditures by Corridor Research Universities
$0
$100
$200
$300
$400
$500
$600
$700
$800
$900
Duke University UNC-Chapel Hill NCSU Wake ForestUniversity
ECU NC A&T University UNC-Greensboro
$ M
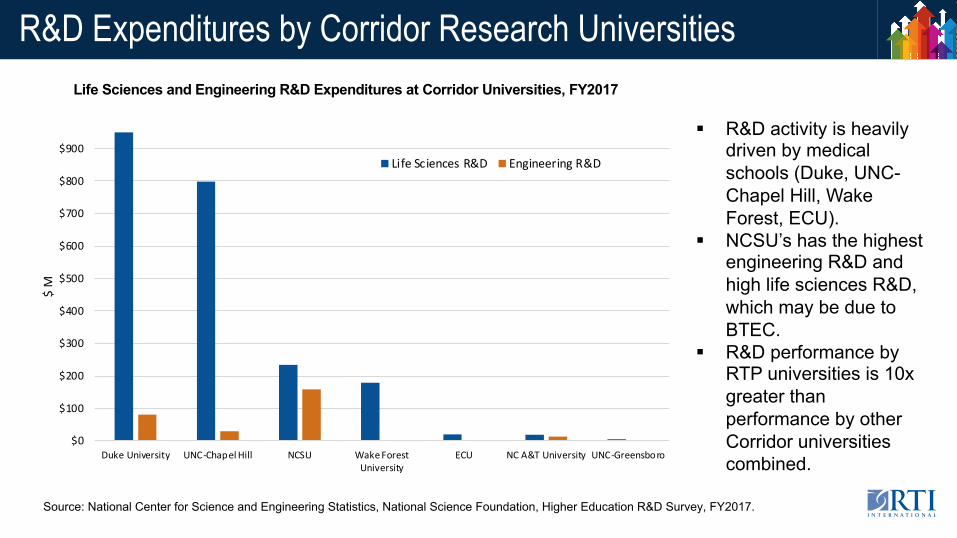
Life Sciences R&D Engineering R&D
§ R&D activity is heavily driven by medical schools (Duke, UNC-Chapel Hill, Wake Forest, ECU).
§ NCSU’s has the highest engineering R&D and high life sciences R&D, which may be due to BTEC.
§ R&D performance by RTP universities is 10x greater than performance by other Corridor universities combined.
Life Sciences and Engineering R&D Expenditures at Corridor Universities, FY2017
Source: National Center for Science and Engineering Statistics, National Science Foundation, Higher Education R&D Survey, FY2017.
Tech Transfer Metrics for Corridor Research Universities
§ Licensing activity indicates industry demand for technology that has commercial potential.
§ Nationally, universities with medical schools or engineering schools and higher shares of industry-sponsored R&D have more licensing activity and income.
§ Universities with similar total R&D can have very different licensing activity:– Duke issues 2x as many licenses and
generated 10x as much licensing revenue as UNC-Chapel Hill.
– ECU issued the same number of licenses, on average, as UNC-Greensboro but generated 4x the licensing income/$1M R&D expenditures.
FY2015–2017 Average
InstitutionMed
SchoolTotal R&D Exp ($M)
Industry/ Total R&D Exp (%)
Avg Annual
Licenses Issued
Licenses/$10M
R&D Exp
Gross Licensing
Income ($M)
Licensing Income/$1M
R&D Exp
Duke University Yes $1,073.1 22.0% 108 1.0 $38.5 $35,888
UNC-Chapel Hill Yes $1,038.1 3.3% 59 0.6 $3.9 $3,729
NCSU No $486.2 12.4% 91 1.9 $5.3 $10,895
ECU Yes $26.0 9.0% 5 1.8 $0.23 $9,048
UNC-Greensboro no $22.6 1.2% 5 2.2 $0.06 $2,918
Note: AUTM data were not available for Wake Forest and North Carolina A&T University. Source: National Science Foundation, Higher Education R&D Survey, FY2015–FY2017; Association of University Technology Managers, STATT Database, FY2015–FY2017 or latest available year.
R&D Expenditures and Licensing at Corridor Universities, FY2015–2017 Averages
§ NCSU stands out for executing a similar number of licenses as Duke with less than half the R&D expenditures. The income generated from these licenses is one-third of Duke’s but 3x that of UNC-Chapel Hill.
§ Duke’s licenses for blockbuster drugs is a big reason for the skewed licensing income.
R&D and Tech Transfer by Corridor Research Universities
Year InstitutionMed
SchoolNational Rank
in R&DTotal R&D Exp ($M)
Industry R&D Exp ($M)
Industry/ Total R&D
ExpLicenses Executed
Licenses/$10M R&D
Exp
Gross Licensing
Income
Licensing Income/
$1M R&D Exp
$1M+ Licenses
2017 Duke University Yes 8 $1,126.9 $234.8 20.8% 97 0.9 $44,562,379 $39,543 4.0
Note: AUTM data were not available for Wake Forest and North Carolina A&T University. Source: National Center for Sciences and Engineering Statistics, National Science Foundation, Higher Education R&D Survey, FY2015–FY2017; Association of University Technology Managers, STATT Database, FY2015–FY2017 or latest available year.
Data Definitions and Limitations
Data Sources
RTI analyzed each region’s industry base, employment levels, wage profiles, incomes, occupations, and educational pipeline using publicly available data from:
§ U.S. Bureau of Economic Analysis, Regional Economic Accounts§ U.S. Bureau of Labor Statistics, Occupational Employment Statistics§ U.S. Bureau of Labor Statistics, Quarterly Census of Wages§ U.S. Census Bureau, Census Reporter§ U.S. Department of Education, Integrated Postsecondary Education
Data System
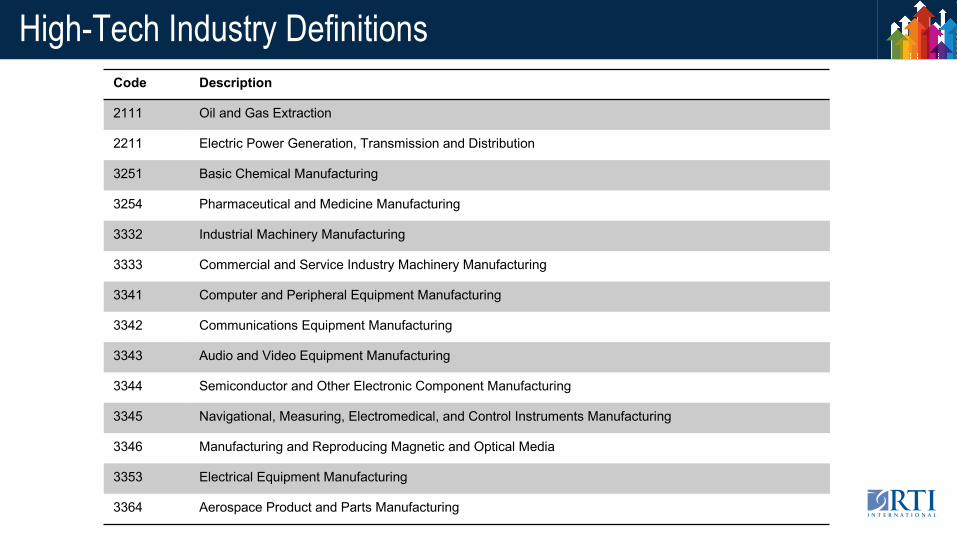
High-Tech Industry DefinitionsCode Description
2111 Oil and Gas Extraction
2211 Electric Power Generation, Transmission and Distribution
3251 Basic Chemical Manufacturing
3254 Pharmaceutical and Medicine Manufacturing
3332 Industrial Machinery Manufacturing
3333 Commercial and Service Industry Machinery Manufacturing
3341 Computer and Peripheral Equipment Manufacturing
3342 Communications Equipment Manufacturing
3343 Audio and Video Equipment Manufacturing
3344 Semiconductor and Other Electronic Component Manufacturing
3345 Navigational, Measuring, Electromedical, and Control Instruments Manufacturing
3346 Manufacturing and Reproducing Magnetic and Optical Media
3353 Electrical Equipment Manufacturing
3364 Aerospace Product and Parts Manufacturing
High-Tech Industry Definitions, Continued Code Description
4861 Pipeline Transportation of Crude Oil
4862 Pipeline Transportation of Natural Gas
4869 Other Pipeline Transportation
5112 Software Publishers
5173 Wired and Wireless Telecommunications Carriers
5174 Satellite Telecommunications
5179 Other Telecommunications
5182 Data Processing, Hosting, and Related Services
5191 Other Information Services
5413 Architectural, Engineering, and Related Services
5415 Computer Systems Design and Related Services
5416 Management, Scientific, and Technical Consulting Services
5417 Scientific Research and Development Services
5511 Management of Companies and Enterprises
Data Limitations
§ Analyzed the CSA for each region, which comprises major MSAs (i.e., Greensboro-High Point, Rocky Mount, Greenville, Raleigh, Durham-Chapel Hill) and adjacent counties with lower population levels.
§ A key limitation is that industry employment and occupation data are often suppressed to protect the identify of individual employers, especially if there are one or two major employers.
§ Data suppression is also an issue at the four-digit NAICS code level. To attempt to circumvent this issue, RTI used Emsi data, which provides data for proprietors and self-employed individuals and employment estimates for major employers.