16
Innovation Day 2018 Curt Espeland Executive Vice President and Chief Financial Officer

Innovation Day 2018
Curt EspelandExecutive Vice President and Chief Financial Officer

During these presentations, we make certain forward-looking statements concerning plans and expectations for Eastman Chemical Company. We caution you that actual events or
results may differ materially from our plans and expectations. Throughout these presentations, “F” is used to indicate projected, or “forecasted”, amounts. See Eastman’s most recent
Form 10-K and 10-Q filings with the Securities and Exchange Commission and these slides and the remarks in the presentations for risks and uncertainties which could cause actual
results to differ materially from current expectations.
Forward-looking statements
Non-GAAP financial measuresAll earnings measures in these presentations are non-GAAP and exclude certain non-core and unusual items. Full-year 2017 amounts are from our February 1 and 2 public
disclosures of our 2017 financial results but will be final when we file our 2017 Form 10-K with the SEC.
“Adjusted Net Income” is “Net Income” adjusted to exclude the same non-core and any unusual or non-recurring items as are excluded from the Company's other non-GAAP
earnings measures for the same periods.
“Debt to EBITDA” Ratio is defined as Total Debt divided by Adjusted EBITDA.
“Diversified Peers” are BASF, CE, HUN.
“EBITDA” is net earnings or net earnings per share before interest, taxes, depreciation and amortization adjusted to exclude the same non-core and any unusual or non-recurring
items as are excluded from the Company's other non-GAAP earnings measures for the same periods. “EBITDA Margin” is EBITDA divided by the GAAP measure sales revenue
in the Company’s income statement for the period presented. Information concerning use of the non-GAAP measures. Projections of future Adjusted EBITDA and EBITDA
Margin also exclude any non-core or non-recurring items.
“Free cash flow” is cash provided by operating activities less cash used for additions to properties and equipment, both the GAAP measures in the Company’s statements of
cash flows for the period presented. Information concerning use of the non-GAAP measure free cash flow is available in the Company’s Form 10-Q for third quarter 2017.
“Adjusted Free Cash Flow” is cash provided by operating activities excluding non-core or unusual items less cash used for additions to properties and equipment.
“Free cash flow conversion” is Adjusted Free Cash Flow divided by Adjusted Net Income.
“IRR” is the Internal Rate of Return calculated based on 10-year project cash flow assumptions.
“Return on Invested Capital” (or “ROIC”) is adjusted net income plus interest expense after tax divided by average total borrowings plus average stockholders’ equity for the
period presented, each derived from the GAAP measures in the Company’s financial statements for the periods presented.
“Specialty Peers” are ALB, ASH, FMC, IFF, PPG.
“Variable Margin” defined as GAAP measure sales revenue in the Company’s income statement for the period presented minus total raw material costs, total purchased energy
costs, and variable distribution costs divided by the GAAP measure sales revenue in the Company’s income statement for the period presented.
“Operating Margin” defined as operating earnings divided by the GAAP measure sales revenue in the Company’s income statement for the period presented.
Reconciliations to the most directly comparable GAAP financial measures and other associated disclosures, including a description of the excluded and adjusted items, are available
in the Appendix and in the “Management’s Discussion and Analysis of Financial Condition and Results of Operations” sections of the Forms 10-K and 10-Q filed and Forms 8-K
furnished and filed with the SEC for the periods for which non-GAAP financial measures are presented. Projected future earnings exclude any non-core, unusual, or non-recurring
items, and projections of future earnings per share assume that the adjusted tax rate for the most recent completed period will be the actual tax rate for the projected periods. Unless
otherwise indicated, except for earnings per share, all dollar amounts are millions “($M)” or billions “($B)”.

Here’s what you’ve heard today
World-Class
Technology
Platforms
Relentlessly
Engage
the Market
Differentiated
Application
Development
ADDITIVES & FUNCTIONAL PRODUCTS ADVANCED MATERIALS FIBERS
OPERATING
MARGIN
~20%
OPERATING
EARNINGS
CAGR
5%–7%2018–2020
REVENUE
GROWTH
mid-single
digits
OPERATING
MARGIN
~20%
OPERATING
EARNINGS
CAGR
7%–10%2018–2020
REVENUE
GROWTH
mid-single
digits
OPERATING
MARGIN
>25%
OPERATING
EARNINGS
CAGR
1%–3% 2018–2020
REVENUE
GROWTH
low-single
digits
Significant integration and scale enable innovation, reliability and cost advantage
Advantaged growth and execution capability and culture
Aggressive and disciplined portfolio management
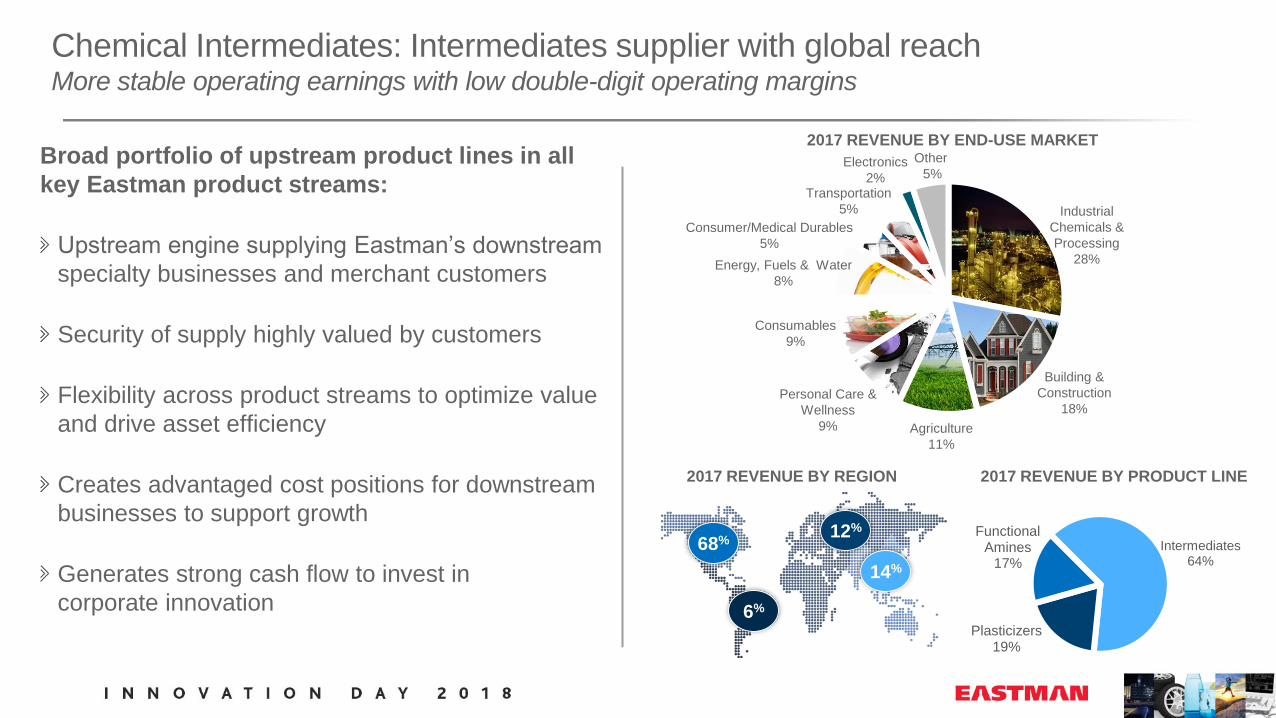
Chemical Intermediates: Intermediates supplier with global reachMore stable operating earnings with low double-digit operating margins
68%
14%
6%
12%
Intermediates64%
Plasticizers19%
Functional Amines
17%
2017 REVENUE BY PRODUCT LINE2017 REVENUE BY REGION
2017 REVENUE BY END-USE MARKETOther
5%
Industrial
Chemicals &
Processing
28%
Building &
Construction
18%Personal Care &
Wellness
9% Agriculture
11%
Consumables
9%
Energy, Fuels & Water
8%
Consumer/Medical Durables
5%
Transportation
5%
Electronics
2%
Broad portfolio of upstream product lines in all
key Eastman product streams:
Upstream engine supplying Eastman’s downstream
specialty businesses and merchant customers
Security of supply highly valued by customers
Flexibility across product streams to optimize value
and drive asset efficiency
Creates advantaged cost positions for downstream
businesses to support growth
Generates strong cash flow to invest in
corporate innovation

Above end-market growth that is sustainable
Key assumptions
Macroeconomic growth similar to 2017:
Industrial production growth to average ~2.5%
Stable oil:
Brent crude oil price forecast $60–$70 per barrel
Stable currencies:
U.S. dollar to Euro exchange rate expected to be ~$1.20
Eastman tax rate expected to be 18%–20%

0%
5%
10%
15%
20%
25%
30%
EMN ALB FMC ASH GRA IFF0
20
40
60
80
100
120
140
160
180
2010 2011 2012 2013 2014 2015 2016 2017
Cu
mu
lati
ve
cap
ac
ity i
ncre
as
e (
kM
T)
Crystex Acetyl Stream Olefins
Oxo Aldehydes Polymer Intermediates Copolyesters
PVB Resin
Continued success with productivity and aggressive cost management
LEVERAGING TECHNICAL CAPABILITIES TO INCREASE
CAPACITY THROUGH PRODUCTIVITY/DEBOTTLENECKING
SGA+R&D/REVENUE
RELATIVE TO SPECIALTY PEERS
(2013–2017 average)
Note: 2017 represents mean of available sell-side equity analysts’ estimates for peer companies
as of 12/31/2017.

0%
4%
8%
12%
EMN Specialty Diversified
RETURN ON INVESTED CAPITAL(2015-2017 average)
0%
20%
40%
60%
80%
100%
EMN Specialty Diversified
FREE CASH FLOW CONVERSION(2015–2017 average)
0%
4%
8%
12%
EMN Specialty Diversified
EPS CAGR(2010–2017)
0%
5%
10%
15%
20%
25%
EMN Specialty Diversified
EBITDA MARGIN(2015–2017 average)
Established track record of creating value1,2
1) Source: Bloomberg, Nasdaq, and company filings. Refer to non-GAAP financial measures of Forward-Looking Statements slide for peer listing.
2) 2017 represents analyst mean estimate for peer companies as of 12/31/2017

Operating cash flow growing
with our businesses
Will continue working capital
discipline in line with growth
2018 operating cash flow
negatively impacted by coal
gas incident
$0
$300
$600
$900
$1,200
$1,500
$1,800
2010 2011 2012 2013 2014 2015 2016 2017 2018F 2019F 2020F
Strong and growing cash from operations driven by continued
growth in corporate earnings
OPERATING CASH FLOW 2010–2020F
$M

$0
$100
$200
$300
$400
$500
$600
$700
2010 2011 2012 2013 2014 2015 2016 2017 2018F 2019F 2020F
Maintenance & incremental growth Growth Incident
% of
sales4% 6% 6% 5% 6% 7% 7% 6% 5% 5% 5%
Targeted capital expenditures funding organic growth
and maintenance
Annual maintenance capital
expected to be $300–$350 million
Will continue to fund targeted
growth initiatives
Anticipate future projects will be
driven by innovation and other
growth programs
Recent examples include TritanTM,
CrystexTM, PVB resin, and ketones
Expected return on growth
investments of 10%–15%+
CAPITAL EXPENDITURES 2010–2020F
$M

10
Acquisitions improve and sustain earnings and free cash flow profile
9–10x EBITDAAcquisition multiple
Corporate tax rate
34%20%>90% key talent retained
11%-13%
post-
completion
IRREMN FCF/Revenue 2%>10%
>$160M cost synergies
Increased breadth
and scale of
innovation
programs

$0
$300
$600
$900
$1,200
$1,500
2010 2011 2012 2013 2014 2015 2016 2017 2018F 2019F 2020F
Free cash flow over next 3 years expected to be ~$3.5 billion
FREE CASH FLOW 2010–2020F
$M
Expect to fully deploy free cash flow

0.0x
0.5x
1.0x
1.5x
2.0x
2.5x
3.0x
3.5x
4.0x
$0
$1,000
$2,000
$3,000
$4,000
$5,000
$6,000
$7,000
$8,000
2014 2015 2016 2017 2018F 2019F 2020F
Maintain investment-grade credit rating that provides financial flexibility
to invest in growth and reward stockholders
TOTAL DEBT
Expect ~2.5x debt to EBITDA ratio in next 12 to 24 months
$M

Strong balance sheet and sufficient liquidity
$0
$400
$800
$1,200
2018 2019 2020 2021 2022 2023 2024 2025 2026 2027 2042 2044
Remain committed to investment-grade
credit rating
Expect to delever over next
12–24 months
Manageable debt maturities
in 2019 and 2020
Sources of liquidity:
$1.25 billion revolver
$300 million accounts receivable
securitization program
Meaningful return of cash to stockholders
PUBLIC DEBT MATURITIES
Combination of cash flow generation, strong balance sheet, and liquidity
provides flexibility to pursue growth
$M

$0.00
$0.50
$1.00
$1.50
$2.00
$2.50
2010 2011 2012 2013 2014 2015 2016 2017 2018F
Long history of returning capital to stockholders
$0
$200
$400
$600
$800
2013 2014 2015 2016 2017 2018F
Dividends Share repurchases
DIVIDENDS PER SHARE CAGR ~13%
(2010–2017)
$2.4B OF CAPITAL RETURNED TO STOCKHOLDERS
(2013–2017)
$M
New $2B share repurchase authorization

Innovation-
Driven
Growth
Earnings
ROICCash flow
A sustained high level of returns as the company grows
0%
5%
10%
15%
20%
2017 2020F
Expect ROIC of 10%–15% as the company grows in a disciplined manner
RETURN ON INVESTED CAPITAL (ROIC)

Position of strength
Expect to generate free cash flow approaching ~$3.5 billion 2018–2020
Maintain capital structure that provides financial flexibility to invest for growth
and reward stockholders
Strong balance sheet and sufficient liquidity foundation for growth
Continue to improve ROIC with an expectation to return 10%–15%
Strong execution track record enables sustainable value creation


