Innovations in Health Care Reform Experience of Academic Health Centers Experience of Academic Health Centers The Science of Quality The Science of Quality VBP, HAC, and More October 28 2011 October 28, 2011 Robert Panzer, MD Chief Quality Officer A i VP P i C Q li & S f Associate VP, Patient Care Quality & Safety Professor of Medicine, and of Community & Preventive Medicine
Transcript
Innovations in Health Care ReformExperience of Academic Health CentersExperience of Academic Health Centers
The Science of QualityThe Science of QualityVBP, HAC, and More
October 28 2011October 28, 2011
Robert Panzer, MD
Chief Quality OfficerA i VP P i C Q li & S fAssociate VP, Patient Care Quality & Safety
Professor of Medicine, and of Community & Preventive Medicine
Topics
• How do we balance our priorities and work?– The P4P quality measurement Tsunami– Quality measures we respect and don’t respect
• Focusing attention– Board scorecard– Weekly Report of Harm
Topics
• How do we balance our priorities and work?– The P4P quality measurement Tsunami– Quality measures we respect and don’t respect
• Focusing attention– Board scorecard– Weekly Report of Harm
Expand Inpatient Pay for Reporting
Linking Quality and Payment
Inpatient Pay for
Reporting10
Measures
Expand Inpatient Pay for
Reporting21
Measures
Pay for Reporting27 MeasuresAdd Patient
Satisfaction and30-day Mortality
Measures
Expand Hospital Pay
for Reporting
30 Measures
2011 IPPS Proposed
Quality Measures
59 Additional
2010 IPPS Proposed
Quality Measures
72 MeasuresMinus 0.4
percentage points if not
report
MeasuresMinus 2.0
percentage points
Minus 2.0 percentage
points
Measures Minus 2.0
percentage points
Potential Measures Minus 2.0
percentage points
Measures Minus 2.0
percentage points
FY 2006 20112009FY 2010200820072005 2006
Outpatient Pay for
Reporting
Hospital Acquired
ConditionsValue-BasedPurchasing
Candidate Hospital Acquired p g
7 MeasuresMinus 2.0
percentage points
11 Conditions
Potential Payment
Reductions
PurchasingPending
CongressionalApproval
qConditions
(6 additional conditions)
Building Health Care Delivery System Reform
Increase Health Care The Goal “Value”
Improve Quality Reduce Costs
T ti
V
PreveReadm
HospitalCond
Bundled
AccountOrgan
Medical H
oCare, Chro
GeogVari
Tactics
Value‐BasePurchasing
entable missions
l‐Acquired
ditions
Payments
table Care izations
omes, Prim
aonic Care M
g
graphic iation
Prerequisite
ed g
Information Technology(Electronic Health Records, CPOE, TeleMedicine)
ary gt.
( , , )
Source: HFMA‐Modified5RJP
VBP Proposal – 3 Domains
Clinical Process Measures
• Heart Attack• Heart Failure• Pneumonia
(Core Measures)• Pneumonia• Surgical Care Improvement ProjectValue‐Based
Purchasing
HCAHPS • Patient Experience of CareQuality Domains
OutcomesFFY 2014
2007 Report to Congress
FFY 2014
FFY 2014 ‐ Efficiency
VideoP4P T iP4P Tsunami
CMS Pay for Performance in 2014
Process (Core Measures) - 20%
Outcomes (Mortality, HAC, PSI, IQ) – 30%
Efficiency (Spending 3 days before to 30 days after stay) – 20%Efficiency (Spending 3 days before to 30 days after stay) 20%
• How do we balance our priorities and work?– The P4P quality measurement Tsunami– Quality measures we respect and don’t respect
• Focusing attention– Board scorecard– Weekly Report of Harm
21st Century Public Reporting of Quality:A Tale of Two Competing Approaches
• Case-mix and severity-adjusted outcomes using administrative (billing) data( g)– Mortality, Readmissions, HAC, PSI,
• Outcomes and processes measures based on clinical data collection: CMS JCAHO AHA AHAclinical data collection: CMS, JCAHO, AHA, AHA (Heart), Leapfrog, SCIP, NSQIP, NHSN– Mortality – Coronary artery bypass grafting,
P t i t tiPercutaneous coronary intervention– Complications – HAI, etc– Process measures – e.g. Acute myocardial infarction,
C i h f il P i S i lCongestive heart failure, Pneumonia, Surgical Infection Prevention
Public Reporting – Motivations?• Proprietary systems
– e g HealthGrades Thomson US Newse.g. HealthGrades, Thomson, US News• Payor systems
– e.g. Excelluse g ce us• Purchaser systems
– e.g. Leapfrog Group, NYS Niagara g p g p gbusiness coalition
• Regulatory systemsJCAHO– e.g. JCAHO
• Government systemse g CMS NYS– e.g. CMS, NYS
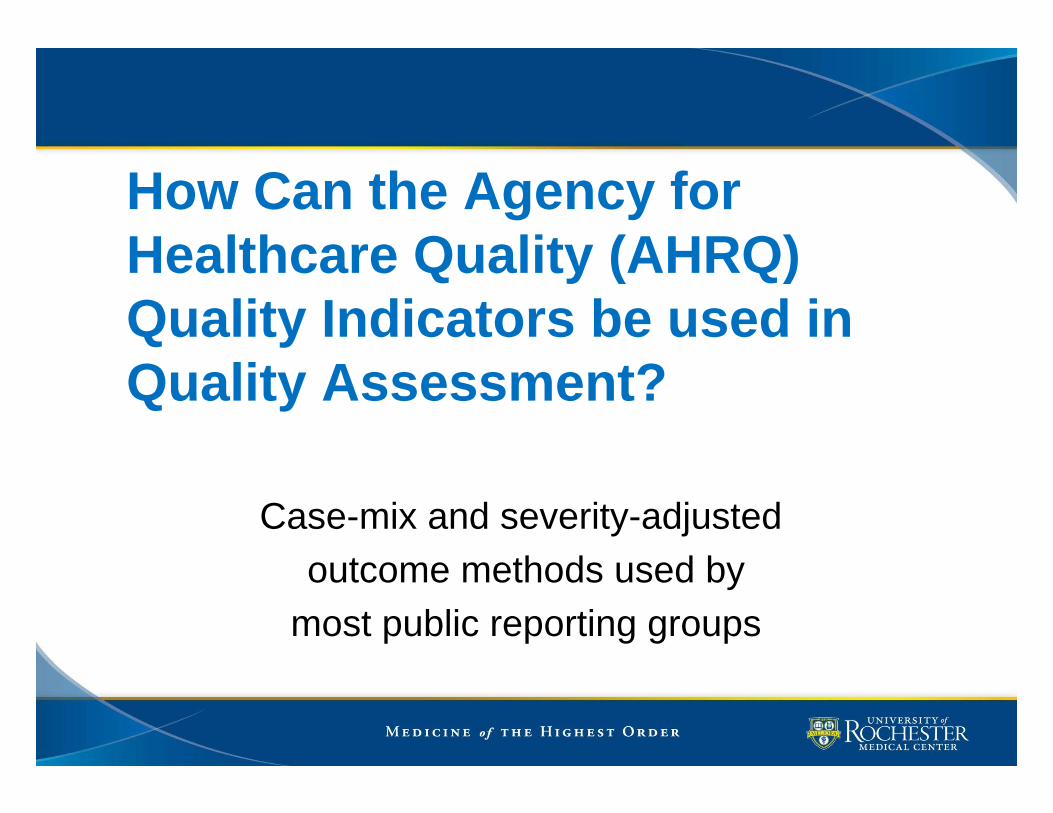
How Can the Agency for Healthcare Quality (AHRQ)Healthcare Quality (AHRQ) Quality Indicators be used in Quality Assessment?
Case-mix and severity-adjustedt th d d boutcome methods used by
most public reporting groups
Per AHRQ Web Site during software release
“The QIs were developed as a screening tool to provide an accessible and low cost approach toprovide an accessible and low-cost approach to
identifying potential problems in quality of care for organizations that lack the resources to develop theirorganizations that lack the resources to develop their
own quality assessment program.
Because they were designed to use existing hospital discharge abstract data that are readily available in
many States additional data collection efforts are notmany States, additional data collection efforts are not required.”
“However, because of known limitations in discharge data, the QIs are a screen—they are not designed to be
d t l t ti i ti t kused as a tool to sanction organizations or to make purchasing decisions.
Furthermore, the Inpatient Quality Indicators and Prevention Quality Indicators should be used cautiously for public reporting with disclosure of hospitalfor public reporting with disclosure of hospital identities.”
L t “Th P ti t S f t I di t tLater: “The Patient Safety Indicators are not recommended for public reporting with disclosure of hospital identities.”
Topics
• How do we balance our priorities and work?– The P4P quality measurement Tsunami– Quality measures we respect and don’t respect
• Focusing attention– Board scorecard– Weekly Report of Harm
CLABSI ‐ Hospital‐Wide HAC, VBP, NYS PPNO, UHC Indicator (PSI‐7), Partnership for Patients CVICU only
Performance Assessments
SSI ‐ CABG NYS PPNOSSI ‐ COLONSSI ‐ Orthopaedic Surgery NYS PPNOSSI ‐ All clean surgeries Partnership for PatientsVAP (adult ICU) Partnership for PatientsC. diff (HA)( )CAUTI HAC, VBP, NYS PPNO, Partnership for PtsFalls (w/severe injury) HAC,NYS PPNO, Partnership for PatientsInjury from Other Trauma Note ‐ NYS PPNOPU (stage 3,4, DTI) HAC, VBP, UHC Indicator (PSI‐3), Partnership for PatientsForeign Object Retained After Surgery HAC and NYS PPNOAir Embolism HAC and NYS PPNOAir Embolism HAC and NYS PPNOBlood Incompatibility HAC and NYS PPNOManifestations of Poor Glycemic Control HAC and NYS PPNOIatrogenic Pneumothorax VBP and UHC Indicator (PSI‐6)Post‐operative DVT/PE VBP and UHC Indicator (PSI‐12)DVT or PE (joint replacement) NYS PPNOPost‐operative Hip Fracture VBP (PSI‐8)Post‐operative Sepsis VBP (PSI‐13)Post‐operative Wound Dehiscence VBP (PSI‐14)Accidental Puncture or Laceration VBP (PSI‐15)Post‐op Hemorrhage and Hemotoma UHC Indicator (PSI‐9)Post‐operative Respiratory Failure UHC Indicator (PSI‐11)
21
p p yAdverse Drug Events Partnership for PatientsObstetrical Adverse Events Partnership for Patients
SMH Quality & Safety Scorecard
Joint Committee on Quality of CareOctober 13 2011October 13, 2011
C Difficile Interventions
• Infection Prevention Measures:C t t ti ( l d ) d i t– Contact precautions (gloves and gown) and private room
– Increase dedicated equipmentIncrease dedicated equipment– Hand hygiene, emphasizing soap and water
• Environmental Measures– Cleaning and disinfection of equipment and the
environment• Antibiotic Stewardship
23
The Central Line Insertion Intervention
• Five evidence-based procedures recommended by the CDC and identified as having theby the CDC and identified as having the greatest effect on the rate of CLABSI and the lowest barriers to implementationp– Hand washing– Full-barrier precautions– Clean the site with chlorhexidine– Avoid the femoral site if possible– Remove unnecessary catheters
Central Line Maintenance
• Multiple components involved in line maintenance require consistent applicationmaintenance require consistent application of best practices– Dressing changes– Site assessment and care– Documentation
Tubing changes– Tubing changes– Lab draws– Accessing lines to administer medicationsg– Administering multiple medications per port– Caring for lines placed in other clinical areas
Topics
• How do we balance our priorities and work?– The P4P quality measurement Tsunami– Quality measures we respect and don’t respect
• Focusing attention– Board scorecard– Weekly Report of Harm
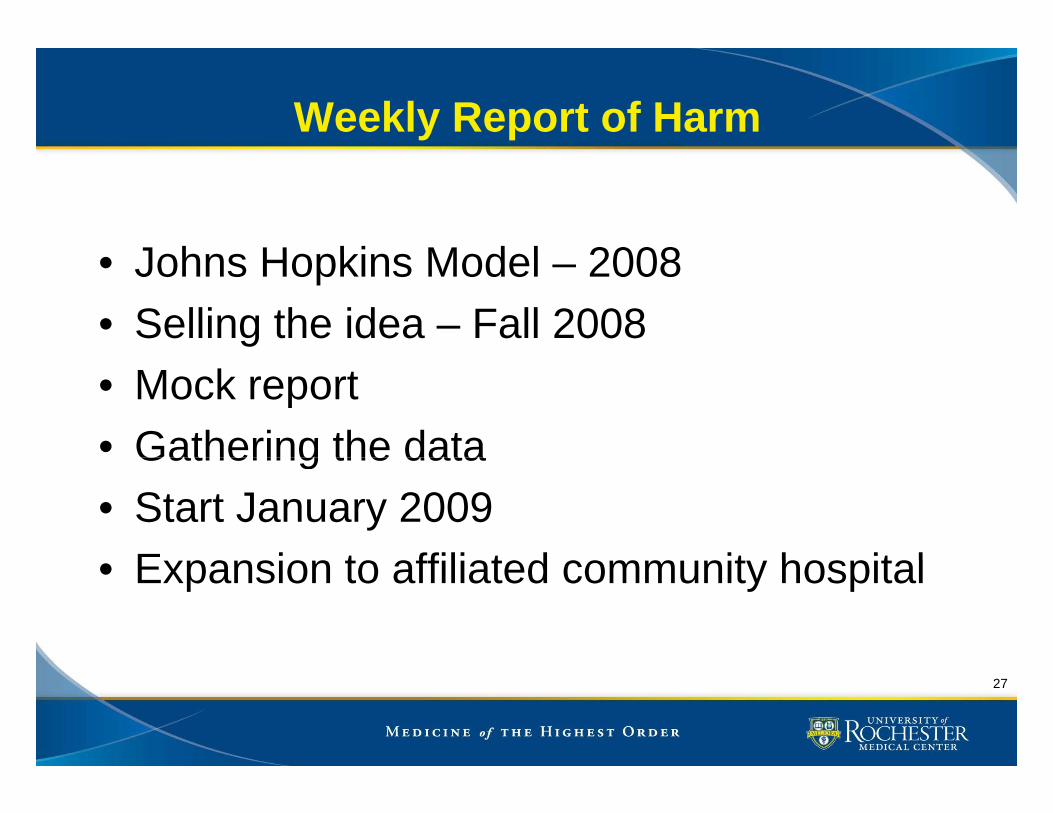
Weekly Report of Harm
J h H ki M d l 2008• Johns Hopkins Model – 2008• Selling the idea – Fall 2008• Mock report• Gathering the dataGathering the data• Start January 2009
E pansion to affiliated comm nit hospital• Expansion to affiliated community hospital
27
Weekly Report of Harm (Selected Adverse Events)
For Week Ending: 07/03/2010 (for further information contact Dr. Panzer at [email protected] or at 273-4438) Inpatient Report of Hospital Acquired Infections C t l Li A i t d Bl d St I f ti h it l i dCentral Line Associated Blood Stream Infections, hospital acquired Week Ending Date 05/15 05/22 05/29 06/05 06/12 06/19 06/26 07/03 Total Weeks
since last NICU PICU MICU SICU CVICU BTICU Pediatric units Medical units Surgical units Cancer units Cardiac units (non-ICU) All other TOTAL Ventilator Associated Pneumonia, hospital acquired Week Ending Date 05/15 05/22 05/29 06/05 06/12 06/19 06/26 07/03 Total Weeks
since last MICU SICU CVICU BTICU TOTAL Surgical Site Infections (by week of procedure) Month 05/15 05/22 05/29 06/05 06/12 06/19 06/26 07/03 Total Weeks
since lastCABG Leg CABG Sternal Colon Total
28
* indicate counts that have been updated since last report