29
1 INNOVATIONS IN INDEXING – APPLICATION TO ASIA Asia Roadshow November/December 2011
| Date post: | 29-Mar-2018 |
| Category: |
Documents |
| Upload: | duongduong |
| View: | 215 times |
| Download: | 1 times |

1
INNOVATIONS IN INDEXING – APPLICATION TO ASIA
Asia Roadshow November/December 2011

2
Agenda
1. STOXX Ltd. – Introduction Page 03
2. Evolution of indexing - Asia Page 08
3. The next level – enhanced indexing Page 21
3
1. STOXX LTD - INTRODUCTION

4
STOXX at a glance
Shareholder
structure
History of STOXX » STOXX was founded in 1998 and the first to launch the European family of
indices - STOXX® indices, including the EURO STOXX 50® Index, which marked the beginning of a unique success story
» Deutsche Börse and SIX Group are the shareholders of STOXX
STOXX is marketing agent for DAX, SMI indices and iNAV ® » Unified sales platform not only for STOXX indices but also for leading
national indices » Provides real time indicative net asset value (iNAV® ) calculation service
Global
presence
Unified sales
platform
Focus on
innovation
and clients
STOXX aims Global » STOXX has over 60 employees worldwide » STOXX is headquartered in Zurich, Switzerland and has satellite offices in
Frankfurt, Hong Kong, London, Madrid, New York, Paris, Singapore, Stockholm, and Tokyo
STOXX is dedicated to deliver innovation in indices » The indices are licensed to more than 400 companies among the world’s
largest financial products issuers, capital owners, and asset managers » Proven track record for innovation to be continued

5
STOXX – the proven innovator in the last decade and the future
» First index provider using free-float market cap weighting throughout its
index family
» First index provider offering an optimized investability
(by considering borrowing availability) for both sector & country indices
» Offering access to direct dividend investments
("dividend point indices")
» Leading provider of European volatility concepts
Innovation in indexing
» First pan-European equity, size, and sector ETFs, and futures and options
» First buy-write ETFs globally, first dividend point, and volatility strategy
ETFs
Innovative financial products
Innovations

1368
657
191
225
169
96
80
688
357
65
114
82
48
42
2049
727
335
53
270
83
66
36
36131716Kospi
S&P
STOXX
DAX
RTS
Nikkei
Taiex
Nasdaq
STOXX is a leading global index provider
ETF market
A
Derivatives market
B
Struct. prod. market
C
Index pro-vider
31 Dec 2010 30 Jun 2011
AuM1)
# ETFs AuM1)
# ETFs Delta2)
AUM/#
MSCI 337.8 389 366.9 453 9/16
S&P 301.1 315 325.6 355 8/13
BarCap 111.2 84 126.4 100 14/19
STOXX (incl. DAX and SIX)
89.7 283 105.3 290 17/2
Russell 80.5 70 84.5 91 5/30
FTSE 54.9 161 60.6 175 10/9
Dow Jones
46.7 138 54.5 159 17/15
Markit 45.1 112 48.3 125 7/12
Nasdaq 31.7 61 33.6 62 6/2
NYSE 16.6 41 17.3 46 4/12
Traded futures & options3) Index
# issues in 2010
# issues in Q1-Q3/2011
Delta Q1-Q3/2011 vs. 2010
DAX 139`526 234'871 168%
STOXX 44`363 52'719 119%
S&P 8`669 8'272 95%
Dow Jones
5`950 5'766 97%
Hang Seng
1`942 5'772 297%
Euronext 4`561 4'154 91%
FTSE 1`586 1'045 66%
MSCI 1`672 2'044 122%
Number 4 globally in the ETF market
Number 3 out of the top 7 derivatives globally
Largest provider of SP underlyings globally
Market position
1) bn USD; Source: BlackRock 2) figures in % 3) In million contracts
Source: BlackRock, Homepagestatistics, FIA, Structured Retail Products
6
2010 H1/2010 H1/2011

7
STOXX operates a unique global index family with innovative
focus
Total Market Index
(“TMI”)
Standard
indices
(“STOXX“)
Advanced
indices
(“STOXX+“)
Broad
indices
Blue-
chip
indices
Sector
indices
Style
indices
Size
indices
Leverage
and Short
indices
Risk
Control indices
Optimal
Leverage
indices
(Sub-) Regions
» Global » Americas » Asia » Pacific
» All Europe » Latin America » BRIC
Global index universe
Comprehensive set of indices … available worldwide
Total 53 countries covered
Countries » Argentina » Australia » Austria » …
» … » Ukraine » United Kingdom » USA

8
2. EVOLUTION OF INDEXING - ASIA
9
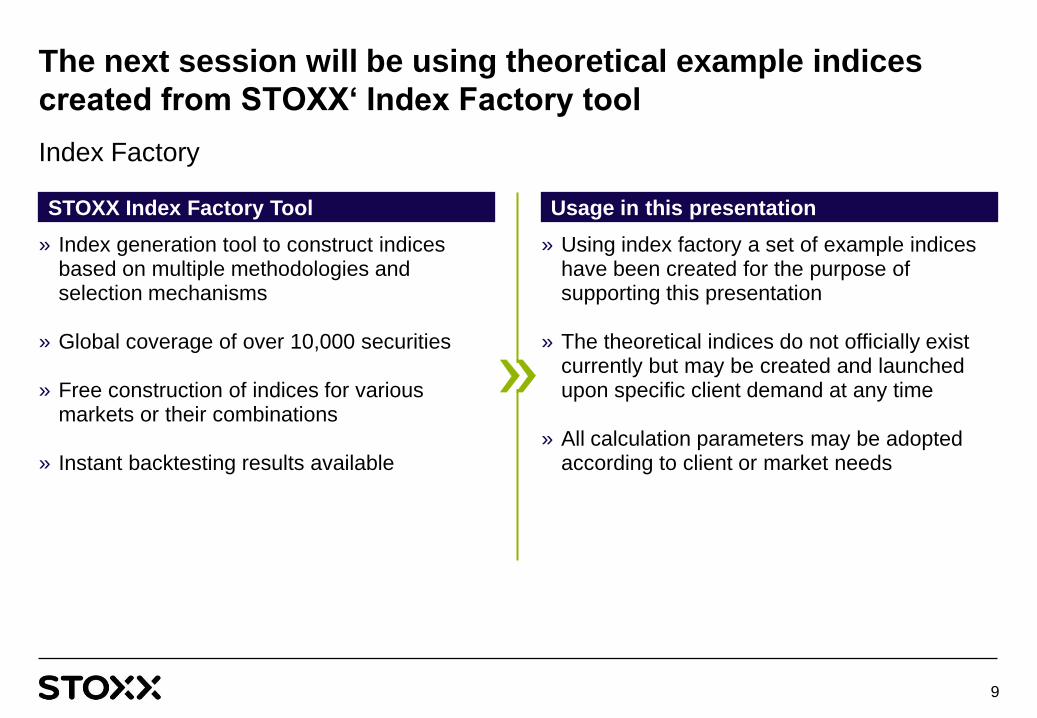
The next session will be using theoretical example indices
created from STOXX„ Index Factory tool
» Index generation tool to construct indices based on multiple methodologies and selection mechanisms
» Global coverage of over 10,000 securities
» Free construction of indices for various markets or their combinations
» Instant backtesting results available
STOXX Index Factory Tool
» Using index factory a set of example indices have been created for the purpose of supporting this presentation
» The theoretical indices do not officially exist currently but may be created and launched upon specific client demand at any time
» All calculation parameters may be adopted according to client or market needs
Usage in this presentation
Index Factory

10
Evolution of indexing for a region will be looked at in three
major steps
» Compilation of broad market benchmarks (TMI indices)
» Construction of represen-tative, liquid and tradeable blue chip indices
Individual countries
» Developed market core index
» Stepwise addition of emerging markets according to investors preferences
Regional indices
» Application of enhanced index strategies to previously built indices
Enhanced indices 3 2 1
Overview
In the next step examples for constructing these steps for the Asian region will be discussed

11
First step is creation of a broad market index for the individual
country as market measurement
STOXX Japan TMI STOXX Singapore TMI STOXX Hong Kong TMI
Step 1a - country TMI indices
1) Annualized 27/12/01 – 14/11/11
2) in mn USD for current composition
Return1) 0.39%
Volatility1) 25.28%
Ø ADTV2) 6.68
Ø MCap2) 1,484.11
Return1) 7.71%
Volatility1) 24.43%
Ø ADTV2) 1.18
Ø MCap2) 249.30
Return1) 9.46%
Volatility1) 20.77%
Ø ADTV2) 0.22
Ø MCap2) 66.52
0
500
1,000
1,500
2,000
2,500
'01 '02 '03 '04 '05 '06 '07 '08 '09 '10
0
500
1,000
1,500
2,000
2,500
3,000
3,500
'01 '02 '03 '04 '05 '06 '07 '08 '09 '10
0
500
1,000
1,500
2,000
2,500
3,000
3,500
'01 '02 '03 '04 '05 '06 '07 '08 '09 '10
12
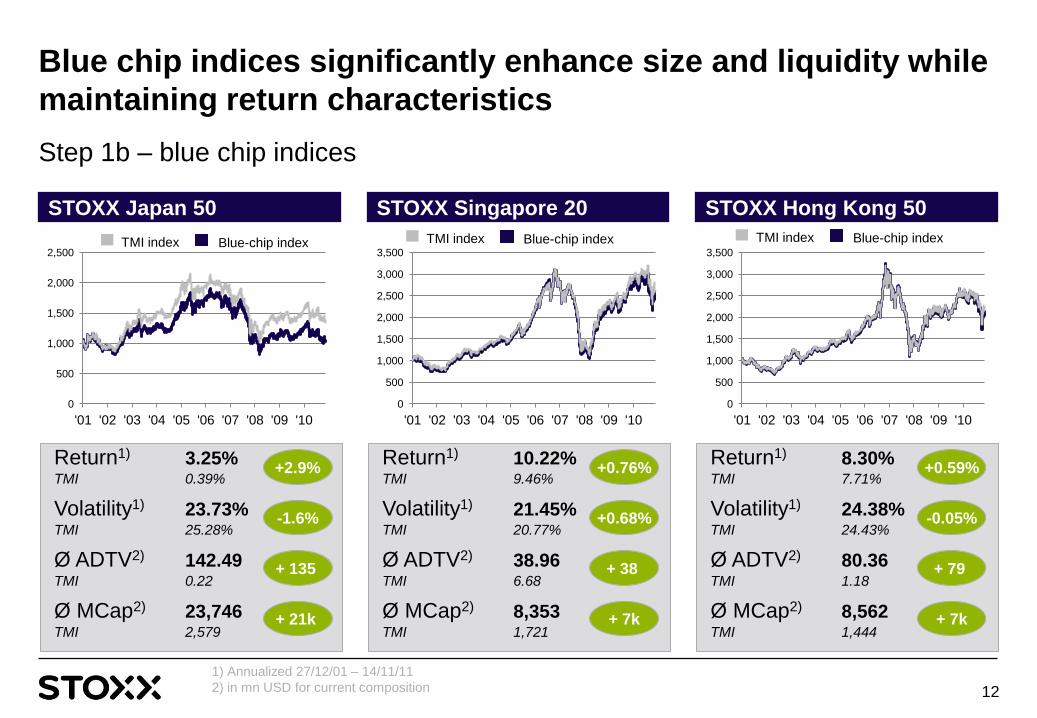
Blue chip indices significantly enhance size and liquidity while
maintaining return characteristics
Return1) 3.25% TMI 0.39%
Volatility1) 23.73% TMI 25.28%
Ø ADTV2) 142.49 TMI 0.22
Ø MCap2) 23,746 TMI 2,579
STOXX Japan 50 STOXX Singapore 20 STOXX Hong Kong 50
Step 1b – blue chip indices
1) Annualized 27/12/01 – 14/11/11
2) in mn USD for current composition
Return1) 8.30% TMI 7.71%
Volatility1) 24.38% TMI 24.43%
Ø ADTV2) 80.36 TMI 1.18
Ø MCap2) 8,562
TMI 1,444
Return1) 10.22% TMI 9.46%
Volatility1) 21.45% TMI 20.77%
Ø ADTV2) 38.96 TMI 6.68
Ø MCap2) 8,353 TMI 1,721
0
500
1,000
1,500
2,000
2,500
'01 '02 '03 '04 '05 '06 '07 '08 '09 '10
0
500
1,000
1,500
2,000
2,500
3,000
3,500
'01 '02 '03 '04 '05 '06 '07 '08 '09 '10
0
500
1,000
1,500
2,000
2,500
3,000
3,500
'01 '02 '03 '04 '05 '06 '07 '08 '09 '10
+2.9%
-1.6%
+ 135
+ 21k
+0.76%
+0.68%
+ 38
+ 7k
+0.59%
-0.05%
+ 79
+ 7k
Blue-chip index TMI index Blue-chip index TMI index Blue-chip index TMI index

13
Regional index covers entire region with high liquidity and
market cap – significant underrun vs. global equity
Step 2a – regional indices
Developed market Asia index (DMAI)
DMAI STOXX Global 1800
» Developed Asia Index with significantly different performance to global index
» Underperformance over last 10 years overall though compared to global developed markets
Source: STOXX calculations
0
500
1000
1500
2000
2500
2002 2003 2004 2005 2006 2007 2008 2009 2010
Return1) 4.9% STOXX Gl. 1800 7.1%
Volatility1) 23.5% STOXX Gl. 1800 17.8%
-2.2%
+5.7%

14
Results of index calculations in the presentation will be
compared on risk / return matrix
Overview risk / return profile
Risk / Return matrix Indices
» STOXX Japan 50 » STOXX Singapore 20 » STOXX Hong Kong 50 » DMAI
1) Footnote, 10 pt
0%
2%
4%
6%
8%
10%
12%
18% 19% 20% 21% 22% 23% 24% 25% 26%
DMAI
STOXX
Singapore 20
STOXX
Japan 50
STOXX Hong
Kong 50
No huge diversification effect on portfolio – strong dominance of Japan

15
Small portion of South Korean stocks to the developed market
basket leads to improved risk return profile
Step 2b – regional indices with further markets (1/4)
DMAI + South Korea (DMAI+SK)
DMAI+SK DMAI
» South Korean Index with extreme outperformance
» Addition of only 20 stocks adds over 3% performance p.a. and reduces risk
Source: STOXX calculations
Return1) 8.1% DMAI 4.9%
Volatility1) 22.4% DMAI 23.5%
+3.2%
-1.1%
South Korea Index
0
1000
2000
3000
4000
5000
6000
7000
8000
9000
10000
2002 2003 2004 2005 2006 2007 2008 2009 2010

16
Addition of further markets lead to smaller change in risk
return profile – lower risk observed
Step 2b – regional indices with further markets (2/4)
DMAI+SK + Malaysia (DMAI+SK+MA)
DMAI+SK+MA DMAI
» Addition of Malaysia (20 stocks) adds further performance and risk reduction
» Smaller additional effect though
Source: STOXX calculations
Return1) 8.4% DMAI 4.9%
Volatility1) 22.1% DMAI 23.5%
+3.5%
-1.4%
Malaysia Index
0
500
1000
1500
2000
2500
3000
2002 2003 2004 2005 2006 2007 2008 2009 2010

17
Adding markets with smaller companies such as Phillipines
with limited impact on portfolio
Step 2b – regional indices with further markets (3/4)
DMAI+SK+MA + Phillipines (DMAI+SK+MA+PH)
DMAI+SK+MA+PH DMAI
» Addition adds only 1/10 % to performance
» This is due to relatively small market cap of Philippine stocks added
Source: STOXX calculations
Return1) 8.5% DMAI 4.9%
Volatility1) 22.1% DMAI 23.5%
+3.6%
-1.4%
Philippine Index
0
1000
2000
3000
4000
5000
6000
2002 2003 2004 2005 2006 2007 2008 2009 2010

18
Addition of major market such as China leads to further risk
reduction – negative impact on performance though
Step 2b – regional indices with further markets (4/4)
DMAI+SK+MA+PH + China (DMAI+SK+MA+PH+CN)
DMAI+SK+MA+PH+CN DMAI
» 30 Chinese stocks offer additional diversification potential and reduce risk by further 0.5%
» Performance impact is negative due to relative underperformance of China
Source: STOXX calculations
Return1) 8.3% DMAI 4.9%
Volatility1) 21.6% DMAI 23.5%
+3.4%
-1.9%
China Index
0
500
1000
1500
2000
2500
3000
3500
4000
4500
2002 2003 2004 2005 2006 2007 2008 2009 2010

19
Results of index calculations in the presentation will be
compared on risk / return matrix
Overview risk / return profile
Risk / Return matrix Indices
» STOXX Japan 50 » STOXX Singapore 20 » STOXX Hong Kong 50 » DMAI » DMAI+SK » DMAI+SK+MA » DMAI+SK+MA+CN » DMAI+SK+MA+CN+PH
Source: STOXX calculations
0%
2%
4%
6%
8%
10%
12%
18% 19% 20% 21% 22% 23% 24% 25% 26%
DMAI
DMAI + EM
STOXX
Singapore 20
STOXX
Japan 50
STOXX Hong
Kong 50
Addition of EM with significant improvement of risk/return profile

20
Index calculation framework allows fast analysis and
implementation of asset allocation strategies for Asia
» Index performance for developed Asia has not been overly exciting over 10 year time span compared to global developed markets
» Addition of small portions of more emerging markets can significantly shift risk return profile into the right direction
» Not all markets are equally tradeable for all market participants
» Countries with larger companies add more value to this approach than smaller ones
Observations
» Overall asset allocation to different markets drives portfolio performance
» Standardized frameworks for constructing indiviudal indices to fit investor needs forms as a basis to startegically steer investments
» The road does not end here – enhanced indexing as next step of development on top of the standard market indices! More in the next chapter!
Conclusions
Intermediary summary

21
3. THE NEXT LEVEL – ENHANCED INDEXING

22
Enhanced indexing adds further dimension to the investment
objective
» Enables investors to indivually choose their desired risk level, while maintaining exposure to the desired underlying market
» ALREADY LAUNCHED
STOXX Asia
100 Risk
Control
Enhanced indexing applications to Asia
» Strategy aimed at optimizing the level of exposure to the target market depending on current market conditions
» ALREADY LAUNCHED
STOXX Asia
100 Optimal
Leverage
» Using already developed index and applying equal weighting strategy to the portfolio to conquer the shortcomings of market cap weighted portfolios
» CONCEPT ONLY
Asia Equal
Weight
» Application of STOXX‘ groundbreaking ESG rating model to the developed Asia markets
» Enables investors to comply with sustainability restrictions » CONCEPT ONLY
STOXX Asia
ESG Leaders
Index

0
500
1000
1500
2000
2500
3000
3500
2002 2004 2006 2008 2010
23
Risk control indices allow investors to choose their risk level
while investing in specific markets
» The risk control strategy is available at multiple risk
levels ranging from 5% to 20% but could also
accommodate custom levels
» The strategy leverages or de-leverages an investment
in an underlying index according to the current market
volatility
» If market volatility is below the desired risk level,
the investment is leveraged up to achieve the
higher risk level
» If market volatility is higher than the desired risk
level the investment is de-leveraged by means
of cash investment to achieve the lower risk
level
Name Performance1) Volatility1)
STOXX Asia 100 Risk Control 20%
9.27% 18.96%
STOXX Asia 100 5.10% 25.63%
Concept Overview
STOXX Asia 100 Risk Control Performance Chart
1) Annualized June 2002-2011
STOXX Asia 100
STOXX Asia 100 Risk Control 20%

0
500
1000
1500
2000
2500
3000
2002 2004 2006 2008 2010
24
Optimal leverage uses a leverage factor between 0.5 and 4 to
optimized returns from an underlying index
» The optimal leverage strategy ensures high leverage
in bull markets, by increasing the leverage factor due
to increasing index returns
» Reduces leverage in turbulent market by reducing the
leverage factor due to increasing volatility
» Uses volatility as risk measure to ensure a timely
response to market turbulences
» The index portfolio consists of
» Leveraged STOXX blue-chip index
» A loan in the overnight money-market to
finance the leverage
» The optimal leverage factor is determined monthly
based on the risk / return profile of the underlying
blue-chip index
Name Performance1) Volatility1)
STOXX Asia 100 Optimal Leverage
2.03% 20.03%
STOXX Asia 100 5.10% 25.63%
Concept Overview
STOXX Asia 100 Optimal Leverage Performance Chart
1) Annualized June 2002-2011
STOXX Asia 100
STOXX Asia 100 Optimal Leverage

300
500
700
900
1100
1300
2006 2007 2008 2009 2010 2011
25
Equal weighting of each constituent brings small or large cap
effects to the fore
» Equal weighting uses an existing index and modifies
the weighting to level all components weights on a
quarterly basis
» This enhances the weight of small and mid caps in
the indices – the performance does thus change
accordingly
» Mismatch of majority of allocated capital to highly
valued companies is broken up leading to positive
performance effect historically
» Phases of strong outperformance but also
underperformance observed historically
Name Performance1) Volatility1)
DMAI Equal Weight -3.26% 25.3%
DMAI -4.54% 25.7%
Concept Overview
Asia Index Equal Weight Performance Chart
1) Annualized 2006-2011
DMAI
DMAI Equal Weight
CONCEPT

0%
2%
4%
6%
8%
10%
12%
18% 19% 20% 21% 22% 23% 24% 25% 26%
DMAI
DMAI + EM
STOXX Asia 100
26
Results of index calculations in the presentation will be
compared on risk / return matrix
Overview risk / return profile
Risk / Return matrix Indices
» STOXX Japan 50 » STOXX Signapore 20 » STOXX Hong Kong 50 » DMAI » DMAI+SK » DMAI+SK+MA » DMAI+SK+MA+CN » DMAI+SK+MA+CN+PH » STOXX Asia 100 » STOXX Asia 100 Risk Control » STOXX Asia 100 Optimal Lev.
Source: STOXX Calculations
STOXX Asia 100
Optimal Leverage
STOXX
Singapore 20
STOXX
Japan 50
STOXX Hong
Kong 50
Overlay of strategies can shift risk levels massively: varying effects on returns
STOXX Asia 100
Risk Control 20%
27
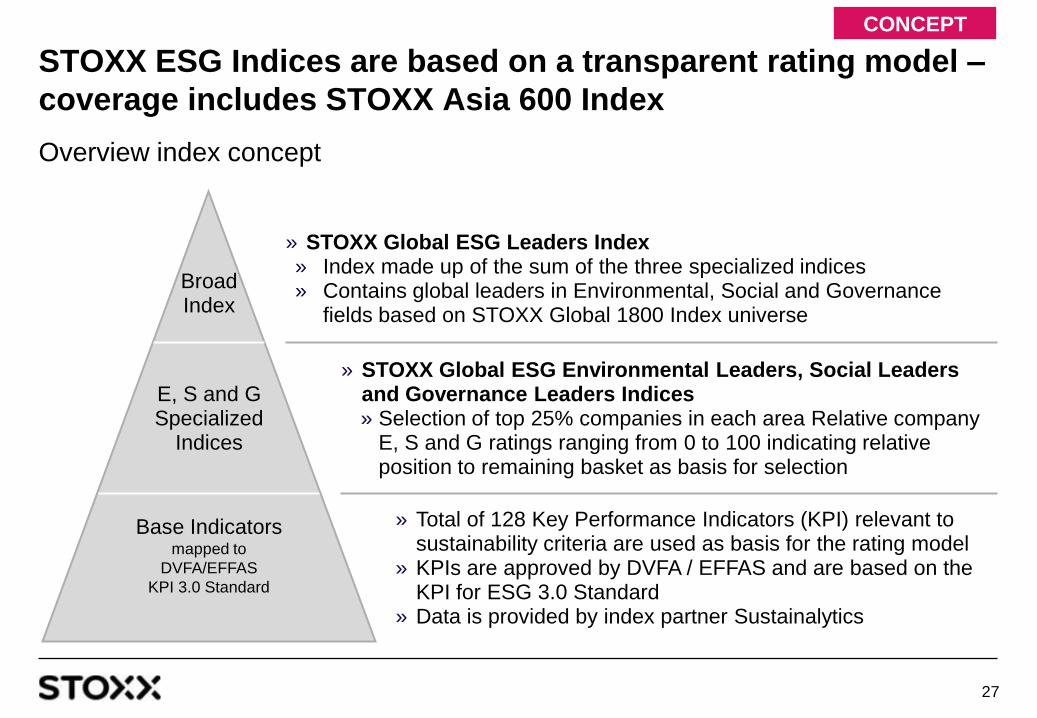
STOXX ESG Indices are based on a transparent rating model –
coverage includes STOXX Asia 600 Index
Overview index concept
» STOXX Global ESG Leaders Index » Index made up of the sum of the three specialized indices » Contains global leaders in Environmental, Social and Governance
fields based on STOXX Global 1800 Index universe
» STOXX Global ESG Environmental Leaders, Social Leaders and Governance Leaders Indices » Selection of top 25% companies in each area Relative company
E, S and G ratings ranging from 0 to 100 indicating relative position to remaining basket as basis for selection
» Total of 128 Key Performance Indicators (KPI) relevant to sustainability criteria are used as basis for the rating model
» KPIs are approved by DVFA / EFFAS and are based on the KPI for ESG 3.0 Standard
» Data is provided by index partner Sustainalytics
Broad Index
E, S and G Specialized
Indices
Base Indicators mapped to
DVFA/EFFAS
KPI 3.0 Standard
CONCEPT

28
Customization and enhancing of index concepts allows
individual steering of risk return profile
» If you look at an index product for the Asian region, make sure to consider the country composition
and its fit to your investment objectives
» Indices for all requirements of country allocation and strategy overlay can be constructed easily at your demand based on a fully standardized set of index and strategy rules
» Your index provider should be able to help you implement the ideal underlying for your investment product – from simple to highly complex – just give us a call!
Contact Details: Konrad Sippel Global Head of Product Development STOXX Ltd. [email protected] +49 69 211 17369
Three things to take home today
Summary

29
Disclaimer
About STOXX STOXX Ltd. is an established and leading index specialist of European origins. The launch of the first STOXX® indices in 1998, including the EURO STOXX 50® Index, marked the beginning of a unique success story, based on the company’s neutrality and independence. Since then, STOXX has been at the forefront of market developments, continuously expanding its portfolio of innovative indices – and now operating on a global level, across all asset classes. The indices are licensed to more than 400 companies among the world’s largest financial products issuers, capital owners, and asset managers. They are used not only as underlyings for financial products such as ETFs, futures and options, and structured products, but also for risk and performance measurement. In addition, STOXX Ltd. is the marketing agent for the indices of Deutsche Börse AG and SIX Swiss Exchange Indices, among them the DAX® and the SMI® indices.
The indices in the presentation and the trademarks used in the index names are the intellectual property of
STOXX Ltd, or SIX Swiss Exchange AG, or Deutsche Börse AG.
The use of the STOXX®, DAX®, and SMI indices® and of the respective index data for financial products or
for other purposes requires a license from STOXX, Deutsche Börse AG, or SIX Swiss Exchange AG. STOXX
and its owners do not make any warranties or representations, express or implied, with respect to the
timeliness, sequence, accuracy, completeness, currentness, merchant- ability, quality, or fitness for any
particular purpose of its index data. STOXX and its owners are not providing investment advice through the
publication of indices or in connection therewith. In particular, the inclusion of a company in an index, its
weighting, or the exclusion of a company from an index, does not in any way reflect an opinion of STOXX or
its owners on the merits of that company. Financial instruments based on the STOXX®, DAX®, or SMI
indices® are in no way sponsored, endorsed, sold, or promoted by STOXX or its owners.


