United States Environmental Protection Agency Solid Waste and Emergency Response (5102G) EPA 542-R-01-011 August 2001 www.epa.gov http://cluin.org Innovations in Site Characterization Technology Evaluation: Real-time VOC Analysis Using a Field Portable GC/MS
Innovations in SiteCharacterizationTechnology Evaluation: Real-timeVOC Analysis Using a Field PortableGC/MS
EPA 542-R-01-011August 2001
Innovations in Site CharacterizationTechnology Evaluation:
Real-time VOC Analysis Using a Field Portable GC/MS
U.S. Environmental Protection AgencyOffice of Solid Waste and Emergency Response
Technology Innovation OfficeWashington, DC 20460
ii August 2001
Notice
This material has been funded wholly by the United States Environmental Protection Agency underContract Number 68-W0-0122. Mention of trade names or commercial products does not constituteendorsement or recommendation for use.
Copies of this report are available free of charge from the National Service Center for EnvironmentalPublications (NSCEP), PO Box 42419, Cincinnati, Ohio 45242-2419; telephone (800) 490-9198 or (513)489-8190 (voice) or (513) 489-8695 (facsimile). Refer to document EPA 542-R-01-011, Innovations inSite Characterization Technology Evaluation: Real-time VOC Analysis Using a Field Portable GC/MS. This document can also be obtained through EPA’s Clean Up Information (CLU-IN) System on theWorld Wide Web at http://cluin.org.
Comments or questions about this report may be directed to the United States Environmental ProtectionAgency, Technology Innovation Office (5102G), 1200 Pennsylvania Ave., NW, Washington, DC 20460;telephone (703) 603-9910.
iii August 2001
Foreword
This evaluation of a field portable analytical technology is part of a series of case studies designed toprovide cost and performance information for innovative tools supporting less costly and morerepresentative site characterization. Based on actual field projects, these case studies include reports onnew technologies as well as innovative applications of familiar tools in the context of more efficientwork strategies. The ultimate goal of this case study series is to aid practicing site professionals toenhance the cost-effectiveness and defensibility of decisions regarding the disposition of hazardous wastesites.
Acknowledgments
This document was prepared by Science Applications International Corporation (SAIC) for the UnitedStates Environmental Protection Agency’s (EPA) Technology Innovation Office under EPA contract 68-W0-0122. Special acknowledgment is given to the U.S. Army Corps of Engineers, Sacramento District,and Field-Portable Analytical, Inc. for their support in preparing this technology evaluation.
Current Site Activities:Continuing investigations of extent ofground water contamination
Period of Operation:MPA: 1942-1989Operable Unit: Not applicable
Analytical Service Provider:Field-Portable Analytical, Inc.3330 Cameron Park Dr., Suite 850
Point of Contact:Jerry VincentU.S. Army Corps of Engineers-Sacramento District(916) 557-7452
Media and Contaminants:Ground water contaminated withchlorinated volatile organiccompounds (VOCs)
Cameron Park, CA 95682(530) 676-6620http://www.fieldportable.com
Number of Samples Analyzed during the Phase of the Site Investigation:Fourteen ground water samples collected from borehole locations were quantitatively analyzed for VOCs by theHAPSITE GC/MS (EPA SW-846 Method 8260) using equilibrium headspace as the sample preparation method(EPA SW-846 Method 5021). Fifty-three QC samples were analyzed [20 calibration standards + 10 blanks + 4MS/MSDs (2 pairs) + 9 duplicates + 10 instrument tuning standards].
Estimated Resource Savings Using Real-time Data Results: $27,000 (26% of total projected costs) and 4 days of field time
Description:During site investigation activities at the MPA, an on-site measurement technology (HAPSITE GC/MS) wasused to determine the appropriate placement of monitoring wells to characterize the horizontal extent of atrichloroethene (TCE) plume migrating beyond site boundaries. A drill rig drilled borings from which groundwater samples were collected using disposable bailers. Through the use of quantitative field analyses, real-timeVOC results from the samples were used to model the plume, to guide decisions about locating additionalborings, and to select which borings would be converted to permanent monitoring wells. Two years later, real-time VOC results were again successfully used, this time to characterize the vertical extent of TCEcontamination. Field-Portable Analytical Inc. provided the HAPSITE GC/MS instrumentation, the associatedstandards and supplies, and the analytical chemist operator able to produce VOC data of the quality desired bythe client.
Results: This project illustrated the successful use of low-cost, real-time field analyses, using a technology (HAPSITEGC/MS) based on a definitive determinative method (SW-846 Method 8260), to guide real-time decisionmaking. The data were effective for making correct decisions concerning the placement of borings and theinstallation of long-term monitoring wells. In the on-site area of investigation, TCE was detected in 8downgradient borehole locations at the northeastern portion of the site. In the off-site area of investigation, TCEwas detected in 8 of the 13 borehole locations along the proposed path of the TCE plume.
The analytical performance criteria in the project’s quality assurance/quality control (QA/QC) protocol weresatisfactorily achieved. Split sample analysis during a previous work phase at this site had established to theCorps’ satisfaction that the on-site analytical service provider could use the field GC/MS to generate VOC datacomparable to fixed laboratory GC/MS data. The correctness of the real-time, field decisions based on theHAPSITE VOC data was later verified by fixed laboratory analysis of ground water collected from thecompleted monitoring wells. The HAPSITE GC/MS was successfully used to produce low-cost, real-time datathat supported real-time decision-making within a single field mobilization of 3 weeks. The use of off-sitelaboratory analyses instead of field analyses would have resulted in higher costs and a longer project time frame.
viii August 2001
this page intentionally left blank
ix August 2001
TECHNOLOGY QUICK REFERENCE SHEETHAPSITE Field Portable Gas Chromatograph/Mass Spectrometer (GC/MS)
Technology Evaluation: On-Site VOC Analysis at Monterey PeninsulaAirport (MPA) Using the HAPSITE Field Portable GC/MS
Technology Name: HAPSITE Field Portable Gas Chromatograph/Mass Spectrometer (GC/MS) withHeadspace Sample Introduction System
Summary of Technology Evaluation's Performance Information
Project Role: Provide real-time volatile organic compound (VOC) results tomodel a trichloroethene (TCE) plume and guide the placementof borings and permanent monitoring wells.
Analytical Information Provided: Quantitative VOC results using EPA SW-846Methods 5021 and 8260 for ten VOC targetanalytes.
Total Project Cost: Approximately $75,000. Included 17 days in the fieldfor a 3-person drilling crew,the on-site analytical team, andthe USACE personnel.
Cost Per Sample: Not applicable. Analytical services were procured on a per day basis, not on aper sample basis. The cost was approximately $2000/day for analytical servicesthat included the instrument and its operation, consumables, and labor costs(including second-person data review and preparation of electronicdeliverables).
Project Cost Breakdown
Instrument Cost:Instrument was provided byanalytical service provider.
Consumables Cost: Sample handling accessories(syringes, vials, standards,etc.): about $50/day (costincluded in daily service rate).
Labor Cost: Included in dailyservice rate.
Waste Disposal Cost:Analytical wastesdisposed withinvestigation-derivedwaste; no additional cost.
Site-Specific Precision/Accuracy Achieved: Analytical Precision: For the MPA samples, the HAPSITE instrument providedprecision of 6-17 relative percent difference (RPD) for duplicate sample results (n = 5analyte results); and 0-1 RPD for matrix spike duplicate (n = 1 MSD). Analytical Accuracy: HAPSITE accuracy ranged from 86% to 94% recovery for 3analytes spiked into sample matrix (n = 1 matrix spike). The recovery of surrogatecompounds over a 10-day project period ranged between 78 and 127% (n = 42; as 14samples X 3 surrogate analytes each).
Throughput Achieved: 25-30 water samples/day[Results for watersamples can be turnedaround in ½ - 1 hr.; gas sample results inabout ½ hr.]
General Commercial Information (Information valid as of June 2001)
Vendor Contact:1-800-223-0633www.inficon.com
Vendor Information:INFICON Inc.Two Technology PlaceEast Syracuse, NY 13057
Limitations on Performance:GC oven temperature range is limited to 10ECabove ambient (coolest temperature) to amaximum of 80EC (warmest temperature).For stack (gas) sampling, the gas stream musthave less than 95% relative humidity to avoidcondensation
(continued)
x August 2001
TECHNOLOGY QUICK REFERENCE SHEET (continued)HAPSITE Field Portable Gas Chromatograph/Mass Spectrometer (GC/MS)
General Commercial Information (Information Valid as of June 2001) (continued)
Availability/Rates:Commercially available forpurchase:• Instrument without service
module: $75,000• Instrument with vacuum
pump service module: $95,000
• Field portable printer:$300-$500
Leasing options may beavailable.
Principle of AnalyticalOperation: VOC concentrations in thesample equilibrate with VOCconcentrations in theheadspace of the sample vial.Headspace vapor is swept into the GC column using acarrier gas. The GC columnseparates analytes, which arethen detected by MS. The MScan be programmed to identifyselected compounds in eitherthe full scan or selected ionmonitoring (SIM) mode.
PowerRequirements:Either self-contained batteries (nickel-cadmium) or line(ac) power.
Battery lifetime is2-3 hours for theGC/MS, and 4-6hours for theheadspacesamplingaccessory.
Instrument Weightand/or Footprint:GC/MS: 15.9 kg (withbatteries), 46 cm x 43 cm x 18 cmHeadspace samplingsystem: 6.8 kg, 36 cm x39.5 cm x 19 cmNotebook computer: 3.6 kgPrinter: 2.3 kgComplete system: 28.6 kg
General Performance Information
Known or Potential Interferences: As with all GC/MS analyses, the coelution of non-target compounds with target analytes poses the potential forinterference and/or errors in quantitation.
Analytes Measurable withExpected Detection Limits: Volatile organic compounds(VOCs) at concentrationsbetween 2 and 5 µg/L (usingthe MS in full scan mode).
Detection limits of about 0.5ppb are possible using the MSin the SIM mode.
Other General Accuracy/PrecisionInformation: In an EPA ETV evaluation [1],the HAPSITE GC/MS detected 100% (59 of59) of calibrated analytes present in excess of5 µg/L in PE samples. Correlation coefficientsof HAPSITE results against referencelaboratory results averaged 0.989. Across 22target compounds, precision ranged from 2 to28% relative standard deviation, and accuracyranged from 1 to 33% absolute percentdifference.
Wastes Generated RequiringSpecial Disposal: None
Rate of Throughput:In the EPA ETV evaluation, water sampleswere analyzed at a rate of 2-3 samples/hour,including periodic analysis of blanks andcalibration check samples.
Note: [ ] indicates a cited reference. Cited references appear both in the text and in some section headings.
Monterey Peninsula Airport
1 August 2001
EXECUTIVE SUMMARY
This technology evaluation report describes the use of a field-based measurement technology, theportable INFICON HAPSITE gas chromatograph/mass spectrometer (GC/MS), to measure volatileorganic contaminant levels, particularly trichloroethene (TCE), in ground water on a real-time basis. Theresults were effective for making decision-making in the field that guided characterization of the plumeand optimal placement of monitoring wells. Real-time use of the technology allowed well installation ata lower cost than if more conventional technologies with a longer turnaround time for results (i.e.,conventional off-site fixed laboratory analyses) had been used.
The Monterey Peninsula Airport (MPA) is located near the city of Monterey, California. PastDepartment of Navy (DoN) activities released TCE contamination into soil and ground water. The U.S.Army Corps of Engineers (USACE) began conducting a series of activities to characterize the extent ofthe TCE contamination and migration. During 1999, the USACE collected ground water samples fromsoil borings and monitoring wells both inside and outside the boundaries of the MPA for on-site analysisof volatile organic compounds (VOCs). The HAPSITE GC/MS instrument was used as the determinativemethod (i.e., the instrumentation generating the analytical result) according to the EnvironmentalProtection Agency’s (EPA’s) SW-846 Method 8260 (Volatile Organic Compounds by GasChromatography/Mass Spectrometry) [2]. Sample preparation and introduction (into the GC/MSinstrument) was accomplished using an equilibrium headspace technique (SW-846 Method 5021) [3].
The USACE had previously used Field-Portable Analytical, Inc. in 1998 as a contracted analyticalservice provider to furnish on-site analysis of MPA ground water VOC samples. During this earlier work,the USACE requested split sample VOC analyses, so that the same ground water samples were run bothby the on-site analytical team (using the HAPSITE GC/MS) and by a conventional fixed laboratory. Thisactivity established that the on-site analytical service provider could generate VOC data of known anddocumented quality comparable to traditional VOC data on the site-specific sample matrix. During the1999 project, ground water samples collected from the soil borings were analyzed by the HAPSITEinstrument only. It was not necessary to again split samples for confirmatory analysis by an off-sitelaboratory because the reliability of the analytical service provider had already been demonstrated. Thevalidity of the 1999 field-generated VOC data set was confirmed through the use of a field qualityassurance/quality control (QA/QC) program specified in the project’s quality assurance plan.
Upon completion of plume definition, the HAPSITE instrument left the site, and the installation ofpermanent monitoring wells in selected borings was completed. After the wells had been developed bysurging, bailing, and purging, ground water samples were collected and sent to a conventional laboratoryfor VOC analysis using Methods 5030 (purge & trap) and 8260 (GC/MS). The two sets of VOC data(on-site versus off-site laboratory) were not expected to be directly comparable because the sample setsthemselves were not directly comparable (water collected from a boring versus water collected from afully developed well). Although a comparison between the two data sets shows expected variations,there is excellent agreement between the two data sets when they are assessed according to their abilityto support project decision-making.
The HAPSITE instrument was used again at the MPA in 2001 for real-time characterization of thevertical extent of TCE contamination. Although this report does not include an evaluation the data setgenerated in 2001, the USACE again reported complete satisfaction with the ability of the field GC/MSto provide reliable data supporting a dynamic work plan strategy that modeled vertical stratification ofthe TCE plume to a degree not feasible using traditional off-site analyses.
In addition to presenting the performance of the HAPSITE GC/MS in the MPA project, this report brieflyreviews the HAPSITE’s performance in an EPA Environmental Technology Verification (ETV)
Monterey Peninsula Airport
2 August 2001
EXECUTIVE SUMMARY (continued)
demonstration that assessed the ability of several field portable instruments (including the HAPSITEGC/MS) to detect and measure VOCs in ground water. The ETV reports for this demonstration,including the HAPSITE report, are available through the ETV website for "Well-Head Monitoring -VOCs," which can be found on the http://www.epa.gov/etv/verifrpt.htm#monitoring webpage.
According to the USACE [4], the portion of the MPA site characterization effort that encompassed thesummer of 1999 cost approximately $75,000. This figure included not just the HAPSITE activities, butalso the drilling team and USACE personnel costs. The USACE estimates that use of the HAPSITEinstrument resulted in a savings of approximately $27,000 and at least four days of field time, whencompared to projected work flow assuming the fastest possible turnaround of data from an off-sitelaboratory.
The USACE was charged a daily rate by the analytical service provider, who provided allinstrumentation, supplies and personnel as part of a turnkey service. If purchased from the instrumentvendor, the HAPSITE GC/MS unit costs approximately $60,000 and the headspace sampling accessorycosts approximately $15,000, for a total cost of $75,000. (A vacuum pump service module costs anadditional $20,000.) Both the instrument and accessory may be available for lease. Depending on thetype and number of analyses being performed, varying quantities of consumable items, such as syringes,vials, gloves, bottled gases and reagents may be required at costs ranging from $50 to $250 per day.
Instrument operation requires at least one well-trained GC/MS operator. Sample throughput can varydepending on a number of factors, including the target analyte list and the number of samples submittedfor analysis, which can be up to 25 to 30 samples per day. As with all on-site analyses, comparing thecost of analytical alternatives on a "cost per sample" basis is seldom reflective of the true economic valueof using field analytical technologies. The real value in using field methods is the time and labor savingsrealized when the ability to make accurate real-time decisions minimizes (1) the down-time of costlyequipment and services (such as a subcontracted drill rig and team), and (2) repeated mobilizations backto the field to fill data gaps. In addition, the opportunity to make many more measurements in the fieldwhile the analytical equipment is available on-site provides a cost-effective means of managing the majorsource of data uncertainty, which is that due to sampling variability in heterogeneous environmentalmedia [5].
The HAPSITE GC/MS and accessories provides the versatility to generate reliable, real-time, and cost-efficient data for measuring VOCs in ground water, solid media (such as soil and sediment samples), andgaseous samples (e.g., ambient air, exhaust, stack emissions, and soil gas).
Monterey Peninsula Airport
3 August 2001
SITE INFORMATION
Identifying InformationMonterey Peninsula AirportMonterey, CA
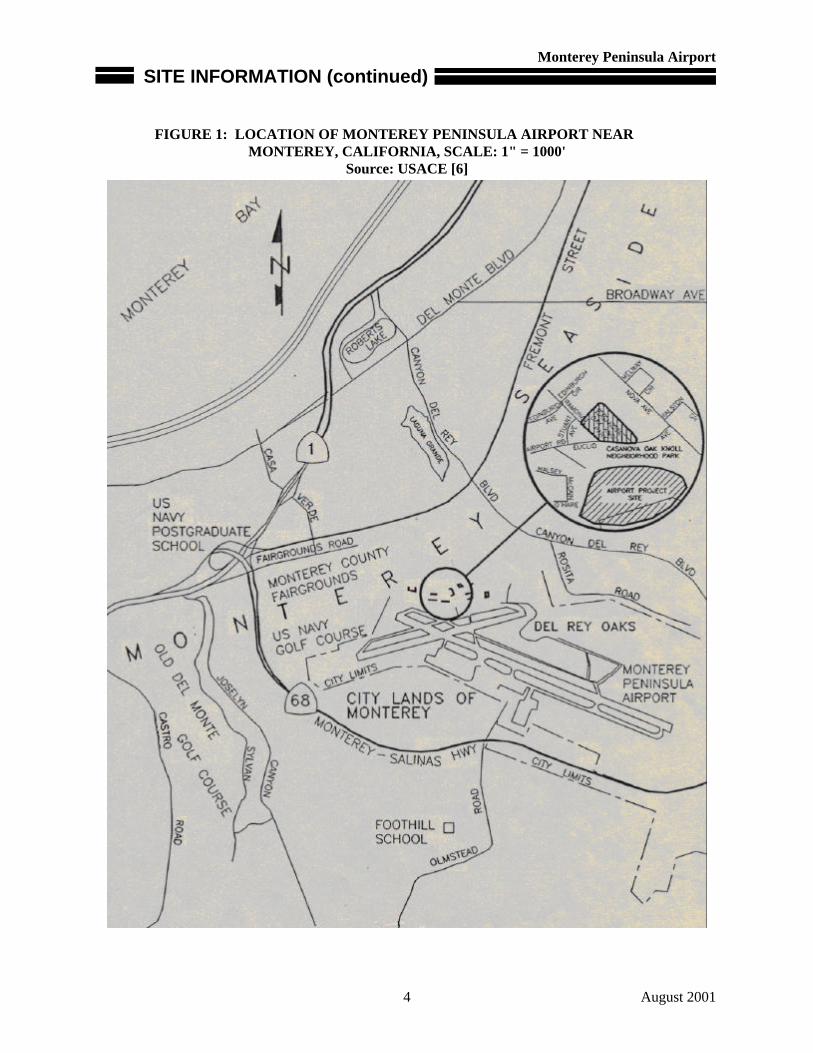
Background [6, 7]Physical Description: The Monterey Peninsula Airport (MPA) is located approximately two miles eastof the city of Monterey, California, within the MPA District. Figure 1 illustrates the site location relativeto Monterey, California. The MPA covers a total of 455 acres. One acre within the MPA's total acreageand approximately one acre off site in a residential area were of primary interest in this study.
Site Use: From 1942 to 1989, the Department of the Navy (DoN) leased the 455-acre site from the MPADistrict and used it as an air base. In 1946, the Federal government determined that the airport was notrequired for full military purposes. Consequently, the MPA District was granted joint and equal use of the landing facilities. Other MPA facilities such as parking aprons, hangers, repair shops and storagetanks continued to be solely used by the DoN. Between 1972 and 1982, the Naval Postgraduate Schoolof the DoN at Monterey continually renewed its lease with the MPA District which included the use ofunderground fuel storage tanks and supporting pipelines in the cantonment area at the north end of theproperty. In 1989, the MPA District released DoN from its lease of the 455-acre parcel. The site iscurrently a municipal airport.
Release/Investigation History: From the 1940s to 1972, Building 17 of the MPA was used by the DoNas an engine repair facility. In this facility, aircrafts parts were cleaned by spraying them withtrichloroethene (TCE). Spills were collected in a concrete sump located outside the hangar where thecontents were allowed to evaporate. Reportedly, the sump was frequently clogged with organic debriscausing the contents to spill unchecked down the slope. Leakage of materials may also have occurredthrough the bottom of the sump.
In March and April of 1997, the U.S. Army Corps of Engineers (USACE), Sacramento District,conducted an investigation to characterize and determine the extent of soil and ground watercontamination released from two 50,000-gallon underground storage tanks (USTs), and to remove fivesmaller USTs ranging in size from 300 to 700 gallons. In addition, three 2,500-gallon USTs wereremoved from locations directly downgradient from the 50,000-gallon USTs. Soil contamination fromreleased fuel was evident at the locations of all USTs.
In January 1998, the Sacramento District of the USACE conducted a supplemental investigation thatcontinued the on-site characterization of the petroleum plume initiated in 1997 at the MPA, and extendedthe investigation off-site into the residential neighborhood north of the airport. The petroleum plume was being delineated using the field-portable HAPSITE GC/MS, when the GC/MS unexpectedly showed thatTCE was also present in the ground water. The on-site availability of the GC/MS made it possible tomodify the project work plan to accommodate a preliminary assessment of the TCE plume at that time. A more thorough investigation of the TCE plume extent for the purpose of installing a TCE monitoringwell network was conducted in 1999, again using the HAPSITE GC/MS. The 1999 investigation formsthe basis of this technology evaluation report.
Monterey Peninsula Airport
4 August 2001
FIGURE 1: LOCATION OF MONTEREY PENINSULA AIRPORT NEAR MONTEREY, CALIFORNIA, SCALE: 1" = 1000'
Source: USACE [6]
SITE INFORMATION (continued)
Monterey Peninsula Airport
5 August 2001
SITE INFORMATION (continued)
Regulatory Context [8]: Monterey Peninsula Airport is being addressed under the military’s FormerlyUsed Defense Site (FUDS) Program. At MPA, FUDS oversight includes two 50,000-gallon, concrete,underground storage tanks (USTs), Building 17, a fire fighting training facility, and numerous smallerUST sites. Chemicals of concern include petroleum products and their associated compounds, andchlorinated solvents (e.g., TCE). Site assessment activities to date have determined the extent and degreeof ground water impacts associated with the two 50,000-gallon fuel tanks. The USACE is monitoring thesite for UST/petroleum hydrocarbon impacts on a quarterly basis pending design of a remediationsystem. Ground water assessment activities in 1998 associated with the two former 50,000-gallon dieseltanks near Building 17 unexpectedly revealed significant concentrations of TCE in ground water (up to1,400 ppb near the source).
Investigation activities at this site began slowly, but became more intense during the latter part of year2000 due to regulator concern over potential contamination of private wells by TCE. Identifying allprivate wells in the area of the TCE plume thus became a priority. The area is supplied by a municipalwater system, however, some residents use private wells for irrigation. The municipal system wasrecently tested at several of the resident’s outdoor faucets to confirm the integrity of local water supplylines, and contamination was not detected. However, some private wells have been found to containTCE, while it has been shown that other private wells do not contain TCE contamination. Regulatorystaff coordinated efforts with neighborhood representatives to encourage residents to come forward withinformation regarding historic practices by the military or others that may be causing environmentalproblems.
National Priority List (NPL) listing: None
Enforcement Dates: A Notice of Violation was issued July 24, 2000, by the California Regional WaterQuality Control Board. It contained a schedule for compliance with Cleanup or Abatement Order (CAO)99-005. CAO 99-005 concerns the cleanup of the contaminated areas at MPA.
Site Logistics/ContactsLead Regulatory Agency Contact: Grant HimebaughCalifornia Regional Water Quality Control BoardCentral Coast RegionSan Luis Obispo, CA(805) 542-4636
USACE Project Manager:Jerry VincentU.S. Army Corps of EngineersPrograms & Project Management DivisionSacramento District(916) 557-7452
USACE Quality Assurance Contact:Pam WehrmannU.S. Army Corps of EngineersEnvironmental Chemistry SectionSacramento District(916) 557-6662
USACE Project Geologist:Pat CantrellU.S. Army Corps of EngineersEnvironmental Design SectionSacramento District(916) 557-5371
Analytical Service Provider:Field-Portable Analytical, Inc.3330 Cameron Park Dr. Suite 850Cameron Park, CA 95682(530) 676-6620http://www.fieldportable.com
Monterey Peninsula Airport
6 August 2001
MEDIA AND CONTAMINANTS
Matrix IdentificationType of Matrix Sampled and Analyzed: Ground water
Site Geology/Stratigraphy [6]The surficial geological units mapped in the vicinity of MPA are Pleistocene to Holocene alluvium,Pleistocene Aromas sand, Pleistocene dune deposits, and the Miocene Monterey Formation, whichconsists of siliceous mudstone. A cross section through the central portion of the airport shows that theAromas sand and the older alluvium are underlain by the Monterey Formation. Lithologic logs fromground water monitoring wells at the MPA indicate that the underlying alluvial deposits consist primarilyof sand lenses of variable thickness interbedded with minor lenses of clay.
The MPA is located in the Carmel sub-basin, which enclosed two ground water systems: the CarmelValley aquifer and the Canyon del Rey aquifer. The Carmel Valley aquifer is composed mostly ofalluvium and terrace deposits. Ground water moves northwest down the valley and discharges intoCarmel Bay. The Canyon del Rey aquifer consists of recent sand dunes and underlying unconsolidated sediments. In the airport vicinity, movement of the Chupines fault has elevated the Monterey Formationand led to the erosion and removal of the main water-bearing formations. What remains of the airportaquifer is primarily older alluvium and the Aromas sand. Ground water movement is northwest towardMonterey Bay.
Contaminant CharacterizationPrimary Contaminant Groups at the Site: Volatile organic compounds (VOCs), primarily benzene,toluene, ethylbenzene, and xylenes (BTEX) and trichloroethene (TCE).
Matrix Characteristics Affecting Characterization Cost or PerformanceThere were no matrix characteristics that adversely affected either characterization costs or performancewhen using the HAPSITE GC/MS.
Monterey Peninsula Airport
7 August 2001
SITE CHARACTERIZATION PROCESS
Goal of Site Characterization The goal of the 1999 ground water investigation at the Monterey Peninsula Airport was to quantitativelycharacterize the horizontal extent of TCE contamination due to the DoN activities at Building 17, theformer engine repair facility, in the ground water on-site and off-site of the Monterey Peninsula Airport. The field-portable gas chromatograph/mass spectrometer (HAPSITE GC/MS) was used to provide real-time, low-cost data to guide optimal placement of permanent monitoring wells in a timely manner.
In addition to the 1999 horizontal characterization of the plume, the HAPSITE GC/MS was used duringthe early part of 2001 to vertically characterize TCE levels within the plume. The purpose in 2001 wasto determine the full extent of contamination and whether TCE stratification was occurring within thesubsurface aquifer formation.
Sampling Work Plan [6, 7]In March 1999, the USACE developed a field sampling plan (FSP) for the summer of 1999 TCE groundwater investigation at the MPA (the subject of this report). The FSP addressed the forthcoming groundwater investigation and the location of proposed borings and temporary wells and soil and ground watersample collection from each boring and subsequent laboratory analysis of the samples. The FSPspecified that ground water samples would be collected for analysis by both an "on-site laboratory" and a"conventional laboratory," and that the samples collected for analysis by the on-site laboratory would useEPA SW-846 Method 8260 to analyze for VOC contamination.
The field-portable HAPSITE GC/MS was selected for the 1999 investigation since the HAPSITE hadbeen instrumental in the 1998 investigation that initially discovered and partially delineated the TCEplume. Split sample analyses during the 1998 investigation established to the satisfaction of the USACEproject team that Field-Portable Analytical, Inc. was fully capable of using the HAPSITE instrument toproduce data of known and documented quality for VOC analytes in the site’s ground water matrix. Theresults of the 1998 investigation also formed the basis for selecting the initial 1999 sampling locations. Based on the VOC results from each boring, decisions would be made in the field about whetheradditional borings were required to adequately characterize the plume and where those locations wouldbe. Decisions would also be made about whether a particular boring would be converted to a permanentmonitoring well, or back-filled and sealed. After a boring was drilled, ground water samples werecollected from the open borings using disposable bailers, and the samples were analyzed for VOCs by theHAPSITE GC/MS instrument using the equivalent of SW-846 Method 8260 [2].
For the on-site investigation, 9 soil borings (MPA-B7, -B7A, -B8, -B9, -B10, -B11, -B12, -B18, and -B19) were drilled at representative locations within the light industrial area. Five of these 9 boringswere later converted to monitoring wells (MPA-MW9, -MW10, -MW11, -MW12, -MW13). One wellwas installed north of Building 17, three were located downgradient, and one upgradient from the sourceof contamination. For the off-site investigation in the residential area, 5 soil borings (MPA-B13, -B14,-B16, -B17, and -B20) were drilled at representative locations within the boundaries of the city park andtwo adjacent streets. Three of these 5 borings were later converted to monitoring wells (MPA-MW14, -MW15, and -MW16). Two additional borings (MPA-B15 and MPA-B15A) yielded no water andtherefore no analyses were performed.
Monterey Peninsula Airport
8 August 2001
CHARACTERIZATION TECHNOLOGIES
Sample Collection Technologies or Procedures [6, 7]Ground water samples were collected from open borings using disposable bailers and transferred to 40-mL VOA vials. Only one sample was taken from the bottom of each borehole. (Collection at multipleintervals within the boring was not possible since hollow-stem auger drilling was used.) Within minutesafter collection, the VOA vials were handed to the HAPSITE GC/MS operator, who poured the VOAvial’s contents into a 50-mL gas tight syringe. Using the syringe, exactly 20 mL of sample wasintroduced into a headspace vial and sealed. A measured amount of internal standard/surrogate solutionor matrix spike solution was then injected into the sealed headspace vial through the septum. Becausesample analysis was nearly immediate, neither chemical nor physical means of sample preservation wasrequired. The USACE used the VOC results on a real-time basis to determine whether the boring shouldbe filled and sealed or converted into a monitoring well. When monitoring wells were installed, theywere developed prior to further sampling by surging, bailing, and purging.
One of the values of on-site analysis becomes evident when one contrasts this sampling sequence, whichtakes the sample from bailer to the analytical instrument in a matter of a few minutes, to a moretraditional sampling and analysis sequence, in which up to 14 days can pass between collection andanalysis. In addition to the expense and inconvenience of waiting for days or weeks for data, the longerthe elapsed time between sample collection and analysis, the greater the likelihood that target analyteswill be lost. Furthermore, a traditional sampling and analysis sequence requires the addition of chemicalpreservatives (acid to retard the growth of organisms, and sodium thiosulfate when the presence of freechlorine is suspected) which increases the likelihood of sample contamination and/or analyte lossthrough chemical reaction. Sample handling and transport provides additional opportunities for samplecontamination or compromise through proximity to higher concentration wastes, loss of volatile analyteswhen temperatures exceed 4EC, or a complete loss of the sample through container breakage.
A comparison of the analytical results for samples obtained from the boreholes using the field-portableHAPSITE GC/MS and those for samples from the monitoring wells using fixed laboratory analysesshows that the data are in agreement (see Table 6 under "Performance Evaluation" section). In otherwords, both data sets support the same conclusions about the nature and extent on TCE contamination.However, differences in the numerical results do, of course, exist because the samples were collected atdifferent times under different conditions. There are a number of factors related to sample support (i.e.,the physical characteristics of the sample, such as the volume of ground water withdrawn from theaquifer, the degree of physical mixing between chemically stratified zones, etc.) and sample collectionthat could contribute to any observed differences, including:
• Random temporal variability within a boring/monitoring well location might explain differencesbetween constituent concentrations found at the time the boring sample was collected versus thetime the sample was collected from the permanent monitoring well.
• Samples obtained from an open borehole represent ground water from saturated zonesthroughout the depth of the borehole, whereas samples obtained from a permanent monitoringwell represent ground water entering the well from the screened interval.
• Drilling techniques such as the use of augers cause disturbance to the subsurface and groundwater immediately adjacent to the borehole. Disturbances due to drilling activities may cause theloss of volatiles or increased turbidity in the borehole samples. Development of the permanentmonitoring wells, however, decreases the impact of drilling activities on the samples obtainedfrom the monitoring wells.
Monterey Peninsula Airport
9 August 2001
CHARACTERIZATION TECHNOLOGIES (continued)
In addition to the 1999 horizontal characterization of the contaminant plume at the MPA, the USACEagain used the HAPSITE GC/MS during early 2001 to further characterize the vertical and horizontalextent of TCE levels within the plume. Although the 2001 characterization effort is not the primarysubject of this report, it provides an excellent example of how field measurement instrumentationsupports better and faster decision-making at low cost. The 2001 characterization effort involvedcollecting a series of ground water samples at 5-foot intervals while moving deeper into the aquifer. After submission to the on-site analytical service provider, VOC results were made available to theproject team within 30 minutes to 1 hour. A cone penetrometer (CPT) rig was used during thischaracterization to permit collection of samples at multiple intervals. Once sample analyses provided"non-detect" at two consecutive depths, sample collection at that location ceased and the testingoperation moved to a different location. Given that this characterization did not experience the time lagassociated with off-site laboratory analyses, the USACE saved both time and money by using a real-timeapproach. In fact, the USACE may not have considered conducting the vertical characterization withoutthe ability to provide real-time data results to guide the procedure. The USACE found discernabledegrees of TCE stratification throughout the plume in as little as a 5-foot change in depth. This fact willgreatly influence the planning and design of follow-up remedial and monitoring activities.
Field Analytical Technologies [7, 9, 10]The INFICON HAPSITE GC/MS is a full featured quadrapole GC/MS, equipped with a 27-m SPB-1column and a 3-m blackflush column [11]. The interface between the GC and the MS is a 70% dimethylsilicone/30% polycarbonate membrane that allows organic constituents to migrate into the MS, whilekeeping inorganic constituents out of the MS. The instrument utilizes a chemical "getter" pump tomaintain adequate vacuum for weeks at a time, although the getter pump must be periodically replaced asa consumable item. The optional service module serves as a rough/turbo vacuum pump that initiallydevelops the vacuum within the MS after change-out of the getter pump. Vacuum is then maintained bythe getter pump. If sufficient power is readily available, the MS may be run directly using the turbovacuum pump during routine instrument operation so that the life of the getter pump is extended.
For the investigation at the MPA, the instrument was transported and operated in the back of a van (seecover photo). Standards were stored in the van on ice. The HAPSITE GC/MS was connected to aheadspace sampling accessory that uses the equilibrium headspace method for introduction of samplesinto the GC. Precisely measured samples (20 mL) were loaded into headspace vials (40-mL screw capVOA vials), then sealed with a PTFE coated septum. An internal standard/surrogate solution wasinjected into each sample, blank, and standard. The vials were then placed in an pre-heated (60EC) ovenand allowed to equilibrate for a minimum of 20 minutes. As the samples were heated, volatileconstituents were driven from the water sample into the vapor phase above the sample (headspace). When equilibrium was established, the headspace in the vial was swept into the HAPSITE GC/MS usinga nitrogen carrier gas.
Target analytes were identified based on comparison of chromatographic retention time to that ofstandards, and on the relative abundance of characteristic ions in the resulting mass spectrum. Becausethe partition coefficient of each target analyte between a specified volume of water and volume ofheadspace is characteristic of that compound, the concentrations of target analytes were quantitatedbased on direct comparison with a standard curve. Note that although the principles behind theequilibrium headspace sample preparation method used for the field technique (SW-846 Method 5021)are somewhat different from those for purge & trap (SW-846 Method 5030, the most commonly usedfixed laboratory method), the numerical results from the HAPSITE GC/MS should be directlycomparable to fixed laboratory GC/MS analysis if other sampling and analytical factors are alsocomparable.
Monterey Peninsula Airport
10 August 2001
CHARACTERIZATION TECHNOLOGIES (continued)
Quality Assurance/Quality Control [7, 10]All quantitative analyses, whether conducted in a fixed laboratory or in the field with portableinstrumentation, require quality control (QC) measurements that document the quality of the analyticalresults. Quality control results are evaluated against acceptance criteria determined both by the method(to ensure that the method is being implemented properly) and by the project’s data quality needs (toensure that the analytical results are adequate for their intended purpose). When project personnel planfor using a field-portable analytical technology such as the HAPSITE GC/MS, it is important to drawupon the expertise of an analytical chemist so that selection and usage of the technology will beappropriate to the project goals. The chemist will also design a QC protocol that is sufficient to ensurethat the resulting data will be of known quality commensurate with its intended use. If needed to meetproject goals, the same types of QC activities used in a fixed laboratory can be applied to field analyses.
The QC activities required for quantitative analysis of VOCs by both field and fixed laboratory GC/MSinstrumentation include:
• Initial calibration - A calibration curve is prepared by analyzing standards at a minimum of 5different concentrations. The mathematical expression of a line defined by the response of theinstrument to these standards is used to calculate the concentration of target analyte(s) present inthe samples. A complete standard curve must be prepared and analyzed for each target analytethat is reported quantitatively. The analytes quantitated during the MPA on-site VOC analyseswere:
Reported sample results must be within the range defined by the lowest and highestconcentration standards used in the calibration curve. Samples with concentrations higher thanthe highest standard must be diluted to bring them within the range. Samples with results belowthe lowest standard are reported as less than some reporting limit.
• Instrument tune - This involved analysis of a solution of a standard compound resulting in a massspectrum that meets very specific criteria. This ensures that subsequent mass spectra will becharacteristic of the target analytes and reproducible, allowing accurate qualitative identificationof compounds. In the case of VOC analyses (both field and fixed lab analyses), the tunecompound commonly used is bromofluorobenzene (BFB). Alternatively, the HAPSITEmanufacturer provides guidelines for a mass calibration procedure that will yield standardspectra. The use of this procedure to tune the mass spectrometer, rather then tuning using BFB,may be an acceptable alternative for some projects.
• Continuing calibration check - Once a calibration curve is established, the analyst must ensurethat the instrument response does not vary significantly over time. This is accomplished by theanalysis of a single calibration standard at a concentration near the mid-point of the calibratedrange. The continuing calibration check (CCC) is analyzed at the beginning of each analyticalshift.
Monterey Peninsula Airport
11 August 2001
CHARACTERIZATION TECHNOLOGIES (continued)
• End calibration check - Functioning much like the CCC, a calibration check sample was analyzedat the end of each analytical shift, ensuring the instrument response did not vary significantlyduring the time period over which environmental samples were being analyzed. Similar to aCCC, the end calibration check is comprised of a mid-point calibration standard. This QC checkis commonly requested as part of the QA package for USACE projects.
• Duplicates - The precision, or reproducibility, of a measurement system is evaluated bymeasuring the same variable in two samples that are expected to yield closely similar results, andthen mathematically determining how close the results are. Usually two repeat measurements arecompared (duplicates), although more than two repeat analyses are sometimes desirable (referredto as replicates). The results of duplicate analyses can sometimes be difficult to evaluate becausemany variables from both the sample collection and the sample analysis processes can beinvolved. The project planning team should carefully consider which analytical or samplingvariable(s) they want to evaluate for precision before deciding on the types and numbers ofduplicate analyses to be performed [12]. Relative percent difference (RPD) is a common meansof mathematically calculating the closeness of duplicate results.
• Method blanks - The possibility of extraneous contamination, through improper sample handlingor contaminated reagents and glassware, must be evaluated to ensure that the concentrationsreported are those occurring in the original sample. Method blanks are prepared and analyzedalong with each group of samples by carrying samples of reagent-grade water through the entireanalytical process.
• Surrogates - All samples, blanks, and standards are spiked with known concentrations ofcompounds that are chemically similar to the target analytes of interest, but are known not to bepresent in the samples. The surrogate compounds used for the MPA VOC analyses weredibromofluoromethane, deuterated toluene, and bromofluorobenzene. The recoveredconcentration of these compounds is used to evaluate the effectiveness of the analytical process.Recoveries significantly lower than 100% may mean that the sample preparation or extractionprocess used was ineffective, that samples were handled improperly, that the instrument wascalibrated improperly, or one of a myriad other problems. Recoveries significantly greater than100% may mean that the analytical method is inaccurate or imprecise for that sample matrix, thatthe instrument was calibrated incorrectly, or that the instrument response is changing over time. In any case, surrogate recoveries outside of pre-defined acceptance criteria signal an analyticalproblem that requires immediate corrective action on the part of the analyst.
Table 1 provides the QC acceptance criteria used for the analysis of VOCs for the MPA project. Boththe field analytical service provider (using the HAPSITE GC/MS) and the fixed laboratory (using purge-and-trap GC/MS) utilized the same acceptance criteria for their QC programs. Results of the field QCanalyses are provided in Tables 2 through 4. These data demonstrate stable performance that met theneeds of the project in terms of sensitivity, precision, and bias. The generation of analytical data can bemost cost-effective if the QC acceptance criteria are derived to accommodate the specific sensitivity,precision, and bias needed to meet the decision-making needs of the project. Depending on the rigor ofdata needed for a particular project, QA acceptance criteria might be chosen that are "tighter" or "looser"than those used for this particular project. This is in accordance with the guidance provided in the SW-846 manual (see section 2.0 of Chapter Two, page TWO-1) [13].
Monterey Peninsula Airport
12 August 2001
CHARACTERIZATION TECHNOLOGIES (continued)
TABLE 1. QC ACCEPTANCE CRITERIA
Quality Control Check/Frequency Acceptance Criteria
Percent Relative Standard Deviation (%RSD) of# 30%
Instrument Tune Using BFB:Once per 12-hour shift
Ion abundance criteria as described in EPAMethod 8260
Continuing Calibration Check:Beginning of each day
Difference of the expected concentration for theCCC compounds of ± 25%
End Calibration Checks:End of each day
Relative Percent Difference (RPD) from thebeginning CCC of ± 25%
Duplicates:10% of the samples
RPD of # 30% between duplicate samples
Method Blanks:After beginning of the day’s CCC
Concentrations for all calibrated compounds < Reporting Limit
Surrogates:Each sample, spike, standard, and reagent blank
Recovery for each surrogate must be between 75to 125%
TABLE 2. DUPLICATE ANALYSES
cis-1,2-Dichloroethene(µg/L)
RPD(%)
Trichloroethene(µg/L)
RPD(%)
MPA-B7-GW 10010
1606
MPA-B7-GW Duplicate 110 170
MPA-B10-GW < 5-
2517
MPA-B10-GW Duplicate < 5 21
MPA-B11-GW < 5-
49010
MPA-B11-GW Duplicate 6.8 540
MPA-B12-GW < 5 -
526
MPA-B12-GW Duplicate < 5 55
Monterey Peninsula Airport
13 August 2001
CHARACTERIZATION TECHNOLOGIES (continued)
TABLE 3. SURROGATE RECOVERIES
DBF (%) Toluene -D8 (%) BFB (%) Run Date
MPA-B7-GW 109 92.5 120 6/18/99
MPA-B7-GW Duplicate 114 96.6 127 6/18/99
MPA-B7A-GW 117 91.8 103 6/18/99
MPA-B8-GW 91.3 101 93.2 6/8/99
MPA-B9-GW 111 91.8 83 6/14/99
MPA-B10-GW 78.7 104 105 6/8/99
MPA-B10-GW Duplicate 82.2 95.3 81.3 6/8/99
MPA-B11-GW 86 93.5 80.9 6/10/99
MPA-B11-GW Duplicate 87 99.4 89.7 6/10/99
MPA-B12-GW 94.1 99 84.6 6/9/99
MPA-B12-GW Duplicate 85.2 94.1 97.7 6/9/99
MPA-B13-GW 120 95.5 112 6/15/99
MPA-B715-GW 111 97.7 112 6/16/99
MPA-B18-GW 116 94.2 118 6/16/99
TABLE 4. MATRIX SPIKE RECOVERY AND PRECISION
Trichloroethene(µg/L)
RPD Benzene(µg/L)
RPD Toluene(µg/L)
RPD
MPA-B12-MSD 164 (89.6%)1%
117 (93.6%)1%
108 (86.4%)0%
MPA-B12-MS 162 (88%) 116 (92.8%) 108 (86.4%)
PERFORMANCE EVALUATION
Sampling Results [7] Table 5 shows the analytical results for all the samples analyzed using the HAPSITE GC/MS. A total of14 samples were analyzed from on- and off-site boring locations. Eight samples were also analyzed fromeight temporary off-site monitoring wells. Of the nine on-site samples, one boring (MPA-B7) was sitedin a perched water table, so a second boring (MPA-B7A) was placed nearby and also sampled. TCE wasdetected in 8 sampling locations downgradient from Building 17 at the northeastern portion of the site,with concentrations ranging from 10 µg/L to 890 µg/L. In addition, cis-1,2-dichloroethene was
Monterey Peninsula Airport
14 August 2001
PERFORMANCE EVALUATION (continued)
detected in 6 of the on-site boring samples, at concentrations ranging from 4.5 µg/L (estimated) to 100µg/L. A single detection of tetrachloroethene was found in one on-site boring, at 4.1 µg/L. Of the 13off-site locations, TCE was detected in 7 of the 13 sampling points located along the proposed path of theTCE plume.
TABLE 5. HAPSITE GC/MS ANALYTICAL RESULTS
Sample Number and Location cis-1,2-Dichloroethene (µg/L) Trichloroethene (µg/L)
Borings (Monitoring Wells)
MPA-B7*, On-site 100 5
MPA-B7A (MPA-MW11), On-site 55 330
MPA-B8, On-site 4.5 (estimated) 10
MPA-B9, On-site 11 610
MPA-B10 (MPA-MW10), On-site < 5 25
MPA-B11, On-site < 5 490
MPA-B12 (MPA-MW9), On-site < 5 52
MPA-B13 (MPA-MW14), Off-site < 5 17
MPA-B14, Off-site < 5 29
MPA-B16, Off-site < 5 50
MPA-B17 (MPA-MW16), Off-site 7.1 170
MPA-B18 (MPA-MW12), On-site 32 890
MPA-B19 (MPA-MW13), On-site < 5 < 5
MPA-B20 (MPA-MW15), Off-site < 5 < 5
Temporary Wells
MPA-HP5, Off-site < 5 8.2
MPA-HP7, Off-site < 5 66
MPA-HP8, Off-site < 5 3.4 (estimated)
MPA-HP9, Off-site < 5 < 5
MPA-HP10, Off-site < 5 < 5
MPA-HP11, Off-site < 5 < 5
MPA-HP12, Off-site < 5 < 5
MPA-HP13, Off-site < 5 < 5
* Perched ground water HP = temporary well B = soil boring -MW = Monitoring well
Monterey Peninsula Airport
15 August 2001
PERFORMANCE EVALUATION (continued)
Technology Performance–MPA ProjectTechnology performance should be evaluated by assessing whether the analytical technology produceddata of known quality that are effective for making the intended project decisions. The preceding QualityAssurance/Quality Control section demonstrated that the HAPSITE instrument performed well withinaccepted limits for precision and bias across the sample preparation (i.e., equilibrium headspace) andanalyte determination (GC/MS) method chain. Precision for the entire sample collection and analysischain can be assessed through the comparison of separately collected duplicate samples (which rangedfrom 6 to 17% RPD; see Table 2), and through the comparison of matrix spike duplicate (MSD) to thematrix spike (MS) results (which ranged from 0 to 1% RPD; see Table 4). Potential bias introduced bythe sample matrix can be assessed through sample surrogate recoveries (which ranged between 78 and127% recovery; see Table 3), and through matrix spike/matrix spike duplicate recoveries (which rangedbetween 86 and 94% recovery; see Table 4).
The goal of the sampling and analysis program at the Monterey Peninsula Airport was to characterize aground water contaminant plume, and the on-site generated QC data established that the HAPSITEGC/MS data were of known quality entirely adequate to guide plume delineation and monitoring wellplacement. Since the field method (using SW-846 Methods 5021 and 8260) can be expected to generatedata that are directly comparable to data from the fixed laboratory (using SW-846 Methods 5030 andMethod 8260) when all other factors are equivalent, and all QC criteria for the field method were wellwithin the project’s acceptance limits, the collection of split-sample data to establish the comparability ofthe field-portable GC/MS results to fixed laboratory GC/MS results was unnecessary.
After monitoring wells were installed and fully developed in selected borings, ground water sampleswere collected from the wells for VOC analysis in a fixed laboratory. Because monitoring wellinstallation and development produces mixing of ground water within the screened interval and yieldsground water samples with a different physical nature (i.e., a different sample support) from samplesobtained from borings, variation between the boring ground water data set (generated by the HAPSITE)and the monitoring well data set (generated by the fixed laboratory) is expected. Nonetheless, there issurprising similarity between these two data sets, as shown in Table 6. Many of the paired data resultsare within 50% of each other, demonstrating that the analysis of boring-derived ground water can yielddata that are adequate for the purpose of identifying candidate locations for placement of permanentmonitoring wells intended to monitor an existing contaminant plume.
TABLE 6. COMPARISON OF BORING AND MONITORING WELL RESULTS
Figure 2 provides a graphic representation of the TCE plume, showing placement of the soil borings,monitoring wells, and temporary wells.
Monterey Peninsula Airport
17 August 2001
PERFORMANCE EVALUATION (continued)
Technology Performance–ETV Evaluation [1]In addition to the HAPSITE performance as reported here from the MPA investigation, the technology’sperformance was also evaluated through EPA’s Environmental Technology Verification (ETV) SiteCharacterization and Monitoring program. Partnering with DOE’s Sandia National Laboratory, the EPANational Exposure Research Laboratory conducted a field demonstration of the HAPSITE field-portableGC/MS in September, 1997. The demonstration was designed to assess the instrument’s ability to detectand measure chlorinated VOCs in ground water at two contaminated sites; namely, the Department ofEnergy’s Savannah River Site, near Aiken, South Carolina, and the McClellan Air Force Base, nearSacramento, California. Ground water samples from each site were supplemented with performanceevaluation (PE) samples of known composition. Both sample types were used to assess instrumentaccuracy, precision, sample throughput, and comparability to reference laboratory results. The primarytarget compounds at the Savannah River Site were trichloroethene and tetrachloroethene. At McClellanAir Force Base, the target compounds were trichloroethene, tetrachloroethene, 1,2-dichloroethane, 1,1,2-trichloroethane, 1,2-dichloropropane, and trans-1,3-dichloropropene. The full ETV Report for the 1997HAPSITE evaluation can be accessed through the ETV website [1]. The results for the ETV evaluationare summarized here:
Sample Throughput: Throughput was approximately two to three water samples per hour. This rateincludes the periodic analysis of blanks and calibration check samples.
Completeness: The HAPSITE reported results for all but one of the 166 PE and ground water samplesprovided for analysis at the two demonstration sites. Operator error (sample was dropped duringpreparation), not instrument problems, accounted for the missing sample result.
Analytical Versatility: The HAPSITE detected all of the compounds in the PE samples for which it wascalibrated. For the ETV demonstration project, the instrument was calibrated to include 84% (27 of 32)of all chlorinated and nonchlorinated volatile hydrocarbon compounds included in the PE samples usingin the demonstration. Additional compounds could have been detected had the operator elected to have a longer GC/MS run time, a wider set of calibration compounds, and a reduced sample throughput. TheHAPSITE detected all (59 of 59) of the ground water contaminants that were present in excess of 5 µg/L(as reported by the reference laboratory). [A total of 68 contaminants, at concentration levels of 1 µg/Lor higher, were detected by the reference laboratory in all ground water samples.]
Precision: Precision was determined by analyzing sets of four replicate samples from a variety of PEmixtures containing known concentrations of chlorinated VOCs. The results are reported as the relativestandard deviation (RSD) for the four replicates. The RSDs compiled for all reported PE compoundsfrom both sites had a median value of 12% and a 95th percentile value of 29%. By comparison, thecompiled RSDs from the reference laboratory had a median value of 7% and a 95th percentile value of25%. The ranges of HAPSITE RSD values for selected target compounds were as follows:
• Trichloroethene 7 to 18% • Tetrachloroethene, 6 to 22% • 1,2-Dichloroethane, 2 to 12% • 1,1,2-Trichloroethane, 8 to 28% • 1,2-Dichloropropane, 7 to 21% • trans-1,3-Dichloropropene, 7 to 17%
Monterey Peninsula Airport
18 August 2001
PERFORMANCE EVALUATION (continued)
Accuracy: Instrument accuracy was evaluated by comparing HAPSITE results with the knownconcentrations of chlorinated organic compounds in PE mixtures. Absolute percent difference (APD)values from both sites were calculated for all analytes in the PE mixtures. The APDs for all reported compounds from both sites had a median value of 8% and a 95th percentile value of 27%. Bycomparison, the compiled APDs from the reference laboratory had a median value of 7% and a 95th percentile value of 24%. The ranges of HAPSITE APD values for selected target compounds were asfollows:
• Trichloroethene, 1 to 20% • Tetrachloroethene, 6 to 33% • 1,2-Dichloroethane, 2 to 20% • 1,1,2-Trichloroethane 1 to 21% • 1,2-Dichloropropane, 3 to 21%• trans-1,3-Dichloropropene, 1 to 15%
Comparability: A comparison of HAPSITE and reference laboratory data was based on 33 ground watersamples analyzed at each site. The correlation coefficients (r) for all compounds detected by both theHAPSITE and laboratory at or below 100 µg/L concentration levels were 0.983 at Savannah River and0.978 at McClellan. The r values for compounds detected at concentration levels in excess of 100 µg/Lwere 0.996 for Savannah River and 1.000 for McClellan. These correlation coefficients reveal a highlylinear comparability relationship between HAPSITE and laboratory data. This is not surprising since thedeterminative analytical method, namely, GC/MS, is the same for both data sets. The median absolutepercent difference between ground water compounds mutually detected by the HAPSITE and referencelaboratory was 13%, with a 95th percentile value of 60%.
Deployment: The system was ready to analyze samples within 30 minutes of arrival at the ETV testsites. At both ETV demonstration sites, the instrument was transported in a minivan and was operated inits rear luggage compartment. The instrument was powered by self-contained batteries or from line acpower. The recommended training interval for routine sample processing is about 3 days for a chemistwith limited GC/MS experience. Method development and analysis of very complex samples requires ahigher level of operator training and experience in GC/MS data interpretation.
Monterey Peninsula Airport
19 August 2001
COST COMPARISON
The USACE estimated that using on-site GC/MS analyses to determine optimal placement of monitoringwells resulted in a cost savings of approximately $27,000. It also resulted in time savings since the drillteam and USACE staff spent 4 fewer days in the field. These comparisons were developed by theUSACE by assuming that samples would have to be shipped to a fixed laboratory for short-turn aroundanalysis to achieve the same project outcome if on-site analysis had not been used [4]. The analyticalservice provider, Field-Portable Analytical, Inc., charged the USACE a daily rate, which includedproviding the HAPSITE GC/MS and all consumables, as well as analytical operators. According to theUSACE, the actual combined costs for drilling and on-site analytical activities, plus USACE personnel,was approximately $75,000. This covered 17 days spent in the field with a 3-person drilling crew to
• Drill 15 borings and collect ground water samples from each boring for analysis,• Convert 8 borings into monitoring wells and develop each well,• Backfill borings not converted to monitoring wells based on analytical results,• Contain all investigation-derived waste in 55-gallon drums, and• Move all drums to designated storage on a daily basis.
Geologic conditions on-site dictated that ground water samples would be collected from open borings inorder to reduce the amount of sediment in the samples. Due to certain geological conditions (flowingsands) augers could not be removed from the borings while waiting for analytical results because theholes would collapse. If the samples were sent to a stationary laboratory for analysis on a 24-hourturnaround basis, each boring would have held a drill rig captive for at least one full day before knowingif the boring would be backfilled or converted into a monitoring well. The USACE estimated that thedrilling operations would have taken at least 21 days at a projected cost of $102,000 had they not beenable to make real-time decisions about well placement, instead of the $75,000 actually incurred. Additionally, the on-site analyses resulted in a logistically smoother project because off-site drilling wasconducted in a city park, which required tight scheduling and restricted hours.
While one could make some educated assumptions and calculate a per-sample cost for on-site GC/MSanalyses, it cannot be overstated that the value in on-site analyses may not be realized as a cost savings indollars and cents saved per sample, but rather as:
• Reducing down-time of costly equipment and services (such as a subcontracted drill rig andteam) while waiting for laboratory results,
• Fewer mobilizations back to the field to fill data gaps, and • The ability to make decisions in real-time, based on immediately available analytical results.
In addition, one must consider the enormous potential value to be gained by increasing sample density,thereby improving decision quality by controlling sampling uncertainty. Given the relatively fixed costsfor an 8-hour on-site analytical shift, one can elect to make many measurements within that time frame,greatly increasing the information value of the data set, without increasing the analytical expense.
A HAPSITE GC/MS costs $60,000, with an additional $15,000 for the headspace sampling accessory. The cost of consumable analytical supplies, such as syringes, sample vials, gloves, bottled gases,standards and surrogate compounds will vary depending on the sample medium (air/gas, water, or solids),the target analyte list, desired analytical data quality, number of samples, and sample throughput. Consumable costs may range from $50 per day to $250 per day. Analysis also requires at least one well-trained GC/MS operator, and some projects may require two operators, again depending on sampling andanalytical complexity and throughput.
Monterey Peninsula Airport
20 August 2001
OBSERVATIONS AND LESSONS LEARNED
The results of this MPA investigation and the EPA ETV demonstration show that the field-portableHAPSITE GC/MS can provide useful, cost-effective data for on-site and real-time monitoring of volatileorganic compounds. Characterizations can be done more quickly than using more conventionalapproaches, while supporting the generation of more reliable data sets because the nature of field analysissupports better management of sampling uncertainties. This, in turn, leads to more confidence in projectdecision-making. The HAPSITE instrument can be employed in a variety of applications, ranging fromproducing rapid analytical results in screening investigations (such as aidingmonitoring well placement) to producing accurate and precise data sets that are directly comparable withthose obtained from an off-site laboratory. The rigor of the QA/QC protocol should be matched to therigor of data needed to support the project’s objectives (i.e., the project DQOs).
The successful use of the HAPSITE GC/MS at the MPA to generate the definitive, high quality datarequested by the USACE emphasizes several points regarding the advantages of field measurementtechnologies. For example, the number of samples need not be the limiting cost factor to the same degreeas it is for conventional fixed laboratory analyses, particular when field laboratory operator rates arecharged on a per time (rather than per sample) basis. This permits additional sampling to generate moredata points than might otherwise be practical. Real-time results also permit better decision-makingregarding whether additional samples are even necessary. This promotes reaching the most appropriatedata density that supports defensible environmental decisions despite matrix heterogeneity.
Real-time, reliable results may also permit fewer days in the field, such as occurred at the MPA, becausemonitoring well location selection and development can occur on the same day as boring samplecollection and analysis. The project management team did not have to arrange a return of the drilling rigdays or weeks later while awaiting the receipt and evaluation of fixed laboratory results. This advantagewas particularly appreciated during the MPA investigation given that the off-site sampling locations wereperformed in city streets and a neighborhood park. Access to the park grounds was limited to periodswhen no children were present at a near-by day care facility and on the provision that all drillingactivities were to be completed within one day. These schedule limitations were accommodated throughuse of the field analytical technology.
Another benefit of field analysis is that sample handling, preservation, and storage impacts areminimized. It is well known that the greatest risk for non-representative data (i.e., results that do notaccurately reflect true site conditions) occurs during sample selection, collection, and handling. Matrixheterogeneity may cause samples to miss contamination. There are multiple opportunities for VOCanalyte loss from environmental samples through volatilization, and biological or chemical degradationas a consequence of repeated sample handling, transportation and undesirable side effects of samplepreservation. For example, although acidification is a common preservation technique to minimize lossVOCs biodegradation losses, EPA SW-846 Method 5035 warns that acidification can causeeffervescence in samples containing carbonates, resulting in severe loss of VOCs [14]. The need forpreservation and its artifacts can be avoided when samples can be analyzed immediately.
Given the above advantages, the use of field measurement technologies such as the HAPSITE GC/MS iswell-suited for instituting a dynamic work plan strategy, which relies on real-time data to guide real-timedecision-making and allow complete characterization with fewer site mobilizations than conventionalwork strategies [15]. Unexpected results can be evaluated and resolved immediately, eliminatingdifficult decisions later about whether to exclude data of questionable validity, or whether to remobilizeto the site to resolve uncertainties with additional data. Samples can be rerun or recollected immediatelyat low cost to verify unexpected results [16]. This can significantly reduce site characterization andcleanup costs, project time frames, and disputes over data reliability or completeness.
Monterey Peninsula Airport
21 August 2001
OBSERVATIONS AND LESSONS LEARNED (continued)
However, the use of field analysis is not without caveats. Trained technicians may be suitable to operateon-site analytical equipment under supervision, however, experienced analytical chemistry expertise isvital to the appropriate selection of field analytical equipment and methods and the design of a project’sstandard operating procedures (SOPs) and QC procedures. Project-specific decision goals and siteconditions (such as matrix interferences) may indicate that modification of “off-the-shelf” methods isdesirable or necessary to ensure that the data generated will match its intended use. A chemist whounderstands the project goals and the anticipated sampling design should be involved during projectplanning so he/she can use that knowledge to design an appropriate analytical program. If a technician isused to implement the analytical SOPs in the field, the chemist should be available to offer technicalsupport. Field personnel should be able to access the chemist for assistance in interpretation of the databeing generated, troubleshooting any problems that arise, and guiding site personnel regarding the properuse of the results.
Two points should be kept in mind when operating a HAPSITE GC/MS in a field situation [16]:
• When the instrument is calibrated for its standard range of compounds, it is possible to detectand quantitate unexpected analytes. For example, at the initial 1998 investigation at the MPA,the field team expected to characterize a petroleum plume, and the instrument also showed thatTCE was present. While such discoveries may not disturb a regulator, it may be initiallydisconcerting to the project team or a site owner. There is benefit, however, in making such adiscovery while the project team is in the field, because if desired the work plan can be adjustedto account for the new analytes in a cost-effective manner.
• The instrument operator, as a member of the team, should resist reporting preliminary results, ordata that may appear to be unreliable. Although a GC/MS method (e.g., SW-846 Method 8260)is highly regarded as supplying credible data, operator error can still produce inaccurate results. Fortunately, as noted above, the flexibility inherent in field measurement technologies permitsimmediate investigation of any questionable result. The operator should take advantage of thisfeature when necessary to assure only the release of trustworthy data.
REFERENCES
1. U.S. Environmental Protection Agency, National Exposure Research Laboratory, EnvironmentalTechnology Verification (ETV) Report: Field Portable Gas Chromatograph/Mass Spectrometer,Inficon, Inc., HAPSITE. EPA/600/R-98/142. November 1998. Report available on-line at:http://www.epa.gov/etv/02/inf_vr.pdf
2. U.S. Environmental Protection Agency. Test Methods for Evaluating Solid Waste,Physical/Chemical Methods (SW-846). Method 8260B: Volatile Organic Compounds by GasChromatography/Mass Spectrometry (GC/MS). Available on-line at:http://www.epa.gov/SW-846/8260b.pdf
3. U.S. Environmental Protection Agency. Test Methods for Evaluating Solid Waste,Physical/Chemical Methods (SW-846). Method 5021: Volatile Organic Compounds in Soils andOther Solid Matrices Using Equilibrium Headspace Analysis. Available on-line at: http://www.epa.gov/SW-846/5021.pdf
Monterey Peninsula Airport
22 August 2001
REFERENCES (continued)
4. Cantrell, Patricia. U.S. Army Corps of Engineers. Letter to Harry B. McCarty of SAIC. Dated12 April 2000.
5. See the Cleanup Information (CLU-IN) website for EPA documents discussing samplingvariability: http://www.cluin.org/char1_edu.cfm#stat_samp
6. U.S. Army Corps of Engineers, Environmental Design Section, Sacramento District. FieldSampling Plan: Trichloroethene Ground water Investigation, Monterey Peninsula Airport,California. March 1999.
7. U.S. Army Corps of Engineers, Environmental Design Section, Sacramento District. MontereyPeninsula Airport Trichloroethene Groundwater Investigation Final Report. September 1999.
8. Himebaugh, Grant. California Regional Water Quality Control Board. PersonalCommunication, April 30, 2001.
9. Crume, Craig. Field-Portable Analytical, Inc. Cameron Park, CA. Personal communication.
10. Field-Portable Analytical, Inc. Standard Operating Procedure for GC/MS Analysis of Water byEquilibrium Headspace. May 1999.
11. Sadowski, Chuck. INFICON, Inc., Two Technology Place, East Syracuse, NY 13057. Personalcommunication.
12. U.S. Environmental Protection Agency. A Rationale for the Assessment of Errors in theSampling of Soils. Office of Research and Development. EPA 600/4-90/013. May 1990. Available on-line at: http://cluin.org/download/stats/rationale.pdf
13. U.S. Environmental Protection Agency. Test Methods for Evaluating Solid Waste,Physical/Chemical Methods (SW-846). Chapter Two: Choosing the Correct Procedure. Available on-line at: http://www.epa.gov/SW-846/chap2.pdf
14. U.S. Environmental Protection Agency. Test Methods for Evaluating Solid Waste,Physical/Chemical Methods (SW-846). Method 5035: Closed-System Purge-and-Trap andExtraction for Volatile Organics in Soil and Waste Samples. Available on-line at:http://www.epa.gov/SW-846/5035.pdf
15. See the Cleanup Information (CLU-IN) website for EPA documents discussing dynamic workplans: http://cluin.org/char1_edu.cfm#dyna_work
16. Crume, C. The Business of Making a Lab Field-Portable: Getting the Big Picture on anEmerging Market. Environmental Testing & Analysis. November/December 2000. pp. 28-37. Available on-line at: http://cluin.org/char1_edu.cfm#usin_fiel