+ All Categories
Home > Documents > Innovative Phosphorus Control to Turn Struvite … · Innovative Phosphorus Control to Turn...

Innovative Phosphorus Control to Turn Struvite … · Innovative Phosphorus Control to Turn...

Date post: 02-Aug-2018
Category:
Upload: phungthuan
View: 237 times
Download: 0 times
Share this document with a friend
30
Innovative Phosphorus Control to Innovative Phosphorus Control to Turn Struvite Headaches into Turn Struvite Headaches into Increase Revenue Increase Revenue Peter Schauer, Rob Baur, Brett Laney PNCWA 2010
Transcript

Innovative Phosphorus Control to Innovative Phosphorus Control to Turn Struvite Headaches into Turn Struvite Headaches into

Increase RevenueIncrease Revenue

Peter Schauer, Rob Baur, Brett LaneyPNCWA 2010

2

Contents

Where does the phosphorus go in BPR?How can WASSTRIP improve recovery?Benchtop Testing…but can it be modeled?Pilot TestingWhat did we learn?

3

Phosphorus Removal in BPR Plants

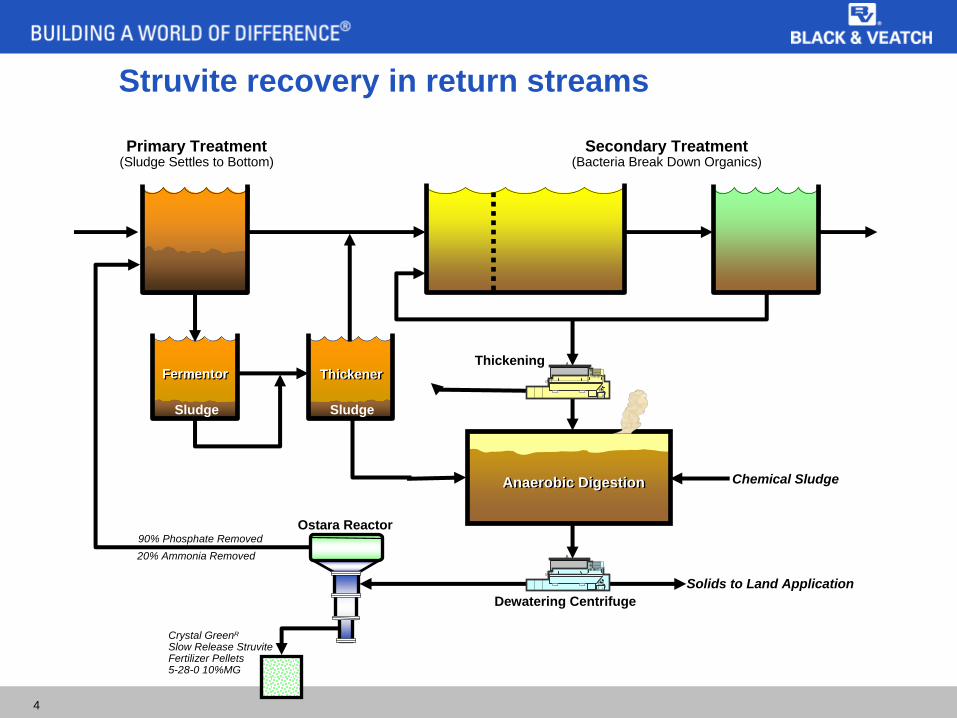
Phosphorus accumulates in the cell mass and is removed with the daily waste activated sludge Anaerobic solids processing – release of P, Mg, and N in recycle streams

Some metal phosphate precipitation in sludge Struvite precipitation in sludgeRemaining released Mg, P and ammonia in return streams

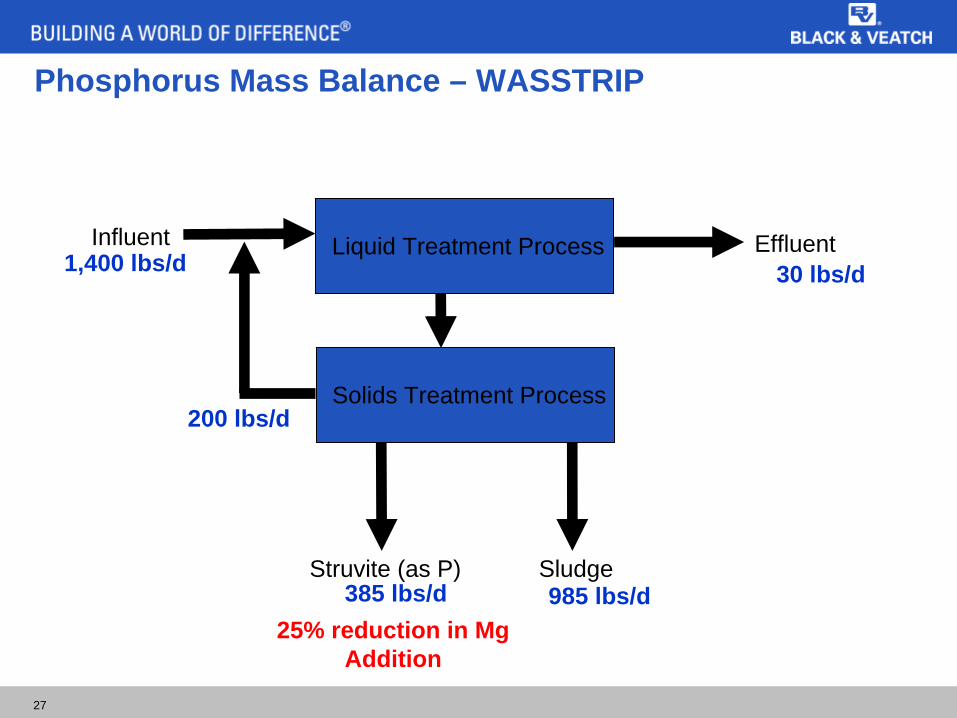
20 – 30% of the phosphorus load on the activated sludge process is in the recycle streams

4

Thickener

SludgeSludge

ThickenerFermentorFermentor

Anaerobic DigestionAnaerobic Digestion

Dewatering CentrifugeSolids to Land Application

Primary Treatment(Sludge Settles to Bottom)

90% Phosphate Removed20% Ammonia Removed

Ostara Reactor

Crystal GreenR

Slow Release Struvite Fertilizer Pellets5-28-0 10%MG

Chemical Sludge

Secondary Treatment(Bacteria Break Down Organics)

Thickening

Struvite recovery in return streams

5

WAS and VFA-rich fermentate combined in release tankDiverted to recovery process in liquid after thickeningLess favorable conditions for struvite in digesters

US patent 7,604,740 that protect the WASSTRIP system and process technological advances, and world-wide patent rights are reserved to Clean Water Services, Oregon, USA.

Patent Pending

6

What do we need to know about WASSTRIP

Design information for stripping tankHow much VFA needed to strip phosphorus?The rate of P and Mg release in the tank?Production of ammonia?Impact on downstream processes?Can it be modeled with BioWin?

7

Previous Studies

Phosphorus and Magnesium Release RatiosTruckee Meadows WWTPEmpire WWTP

8

Truckee Meadows WWTPRelease during endogenous fermentation and when adding VFA Relatively fast initial release (<16 hours)Short SRT BPR plant

020406080

100120140160

0 20 40 60 80Time, hours

Pho

spho

rus

Con

c, m

g/L

EndogenousWith Acetic Acid

0.0

0.1

0.2

0.3

0.4

0.5

0 20 40 60 80Time, hours

Rel

ease

Rat

io, M

g/P

EndogenousWith Acetic Acid

0

10

20

30

40

50

0 20 40 60 80Time, hours

Mag

nesi

um C

onc,

mg/

LEndogenousWith Acetic Acid

9

Empire WWTP

Endogenous releaseAchieved >50% releaseSteady release for 70 hours

050

100150200250300350400

0 50 100 150Time, hours

Pho

spho

rus

Con

c, m

g/L

Test 1Test 2Test 3

0%10%20%30%40%50%60%70%

0 50 100 150

Time, hours

Rel

ease

as

% o

f TP

Test 1Test 2Test 3

10

Laboratory Test

Anoxic conditions maintained using closed containersTwo tests using VFA additionOne endogenous release test

11

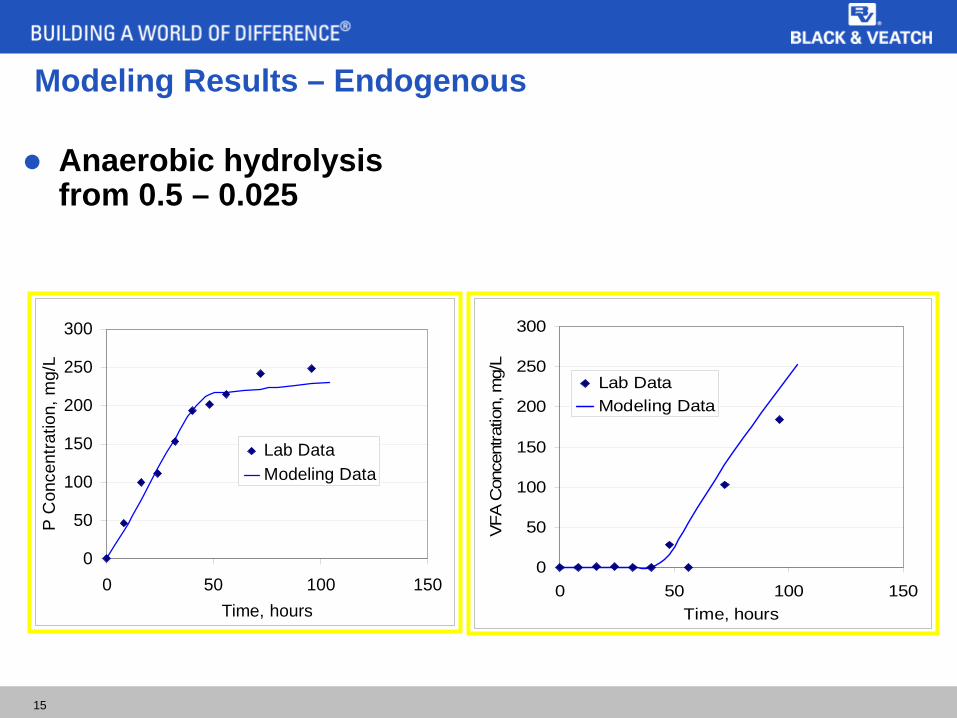
Endogenous Release Tests

Mg : P release – consistentPhosphorus release from PAO up to 48 hours 0.00

0.05

0.10

0.15

0.20

0.25

0.30

0 20 40 60 80 100 120Time, hours

Rel

ease

Rat

io, m

g M

g / m

g P

020406080

100120140160180200

0 24 48 72 96 120Time, hours

Con

cent

ratio

n, m

g/L NH3-N

VFA

0

50

100

150

200

250

0 24 48 72 96 120Time, hours

P R

elea

sed,

mg/

L o-PO4Mg

12

VFA-Enhanced Release – Round 1

Results from P were inconsistentResult from Mg showed little additional release with more VFA

05

10152025303540

0 50 100 150 200Time, min

Mg

per

L of

WA

S, m

g75 mg VFA / L RAS186 mg VFA / L RAS374 mg VFA / L RAS571 mg VFA / L RAS0

20

40

60

80

100

120

140

0 50 100 150 200Time, min

P pe

r L

of W

AS,

mg

75 mg VFA / L RAS186 mg VFA / L RAS374 mg VFA / L RAS571 mg VFA / L RAS

13

VFA-Enhanced Release – Round 2

Very little difference in release rates based on VFA addition

020406080

100120140160

0 100 200 300Time, min

Con

c, m

g O

P/L

of W

AS

119 mg VFA/L RAS185 mg VFA/L RAS278 mg VFA/L RAS417 mg VFA/L RAS

0

5

10

15

20

25

30

35

0 100 200 300Time, min

Con

c, m

g M

g/L

of W

AS119 mg VFA/L RAS185 mg VFA/L RAS278 mg VFA/L RAS417 mg VFA/L RAS

14

VFA-Enhanced Release

Summary of VFA to VSS ratios

Round 1mg VFA / mg VSS

Round 2 mg VFA / mg VSS

Test 1 0.010 0.015

Test 2 0.025 0.023

Test 3 0.051 0.035

Test 4 0.077 0.051

15

Modeling Results – Endogenous

Anaerobic hydrolysis from 0.5 – 0.025

0

50

100

150

200

250

300

0 50 100 150Time, hours

P C

once

ntra

tion,

mg/

L

Lab DataModeling Data

0

50

100

150

200

250

300

0 50 100 150Time, hours

VFA

Con

cent

ratio

n, m

g/L

Lab DataModeling Data

16

Modeling Results – VFA-EnhancedPAO Sequestration rate from 6 day-1 to 0.45 day-1

VFA sequestration half-saturation rate was changed from 5 mg/COD/L to 0.03 mg COD/L

0

20

40

60

80

100

120

0 100 200 300Time, min

Con

cent

ratio

n, m

g/L

Test #1 Model #1Test #2 Model #2Test #3 Model #3Test #4 Model #4

Phosphorus

Magnesium

17

Implications of Modeling

0.000

0.001

0.002

0.003

0.004

0.005

0.006

0.00 0.02 0.04 0.06 0.08 0.10VFA / VSS

P re

leas

e R

ate

per

VSS,

hr-1

0.0000

0.0002

0.0004

0.0006

0.0008

0.0010

0.0012

Mg

rele

ase

Rat

e pe

r VS

S, h

r-1

Phosphorus ReleaseMagnesium Release

18

Pilot Test

Complete-Mix Continuous OperationWaste Activated SludgeFermenter Thickener Overflow

19

Pilot Test – Operation

Started in April 2010Plant shifted into Nutrient Removal seasonAlum additionFermenter start-up

Adjusted FTO and WAS flow Detention TimeRatio of VFA to PAOs

20

Pilot Test – Results

Shift between bio-P and chem-PFermenter OperationGenerally release 20-30% of the TP

Reasonable detention timeAbove 0.15 mg VFA/mgVSS

21

Pilot Test – ResultsPercent Phosphorus Release versus VFA/VSS Ratio

0%

5%

10%

15%

20%

25%

30%

35%

40%

45%

0 0.02 0.04 0.06 0.08 0.1 0.12 0.14VFA/VSS Ratio, mg/mg

% P

hosp

horu

s R

elea

se

Residence Time < 8 hr Residence Time > 8 hr

22

Pilot Test – ResultsPercent Phosphorus Release verus Residence Time

0%

5%

10%

15%

20%

25%

30%

35%

40%

45%

0 2 4 6 8 10 12 14 16Residence Time, hr

% P

hosp

horu

s R

elea

se

VFA/VSS < 0.013

0.020 > VFA/VSS > 0.013

VFA/VSS > 0.02

23

Implications for Durham AWWTF

Dry Weather

Wet WeatherScenario 1 Scenario 2 Scenario 3

WAS Flow, mgd 0.34 0.42 0.42 0.42

FTO Flow, mgd 0.58 0.58 0.58 0.58

FTO VFA Concentration, mg/L 437 203 100 100

FTO used for WASSTRIP, % 25 50 100 50

HRT, hours 10.2 7.0 5.0 7.0

mg VFA / mg VSS 0.026 0.021 0.021 0.010

24

Implications for Durham AWWTF

Dry Weather Wet WeatherScenario 1 Scenario 2 Scenario 3

FTO VFA, mg/L 437 203 100 100FTO for WASSTRIP, % 25 50 100 50

Phosphorus Release, lb/d 314 334 334 147Magnesium Released,

lb/d 103 103 103 21

Potential Struvite, lb/d 1,120 1,120 1,120 224

25

Phosphorus Mass Balance – Typical Operation

Liquid Treatment Process

Solids Treatment Process

Sludge

Influent Effluent1,400 lbs/d 30 lbs/d

1,370 lbs/d

500 lbs/d

26

Phosphorus Mass Balance – Phosphorus Recovery

Liquid Treatment Process

Solids Treatment Process

SludgeStruvite (as P)

Effluent30 lbs/d

385 lbs/d 985 lbs/d

200 lbs/d

27

Phosphorus Mass Balance – WASSTRIP

Liquid Treatment Process

Solids Treatment Process

SludgeStruvite (as P)

Influent Effluent1,400 lbs/d 30 lbs/d

385 lbs/d 985 lbs/d

200 lbs/d

25% reduction in Mg Addition

28

Conclusions

Appears to be an upper limit on impact that VFAs can have on phosphorus release rates. Release rates anticipated using existing tankage will be adequate for Phosphorus and Magnesium release using WASSTRIPChem P versus Bio P has a large influence

29

Next Steps

Determine the overall impact to the treatment plant

Overall economics

Impacts from pH

Impact on Dewaterability

B&V - 30

DiscussionDiscussion


Recommended