Master thesis Influence of water vapor on silica membranes: Effect of sorption and percolation Inorganic Materials Science Inorganic Materials Science Group MESA + Research Institute Faculty of Chemical Technology Name: Chunlin Song Student No.: S0097756 Graduation committee: Prof. dr. ing. Dave H.A. Blank (Chairman) Drs. Tijana Zivkovic (Supervisor) Dr. Henny J.M. Bouwmeester Ing. Henk Kruidhof Dr. Martin van Sint Annaland Dr. ir. Arian Nijmeijer August 2005 University of Twente The Netherlands
Transcript
Master thesis
Influence of water vapor on silica membranes:
Effect of sorption and percolation
Inorganic Materials Science
Inorganic Materials Science Group MESA+ Research Institute Faculty of Chemical Technology
Name: Chunlin Song Student No.: S0097756 Graduation committee: Prof. dr. ing. Dave H.A. Blank (Chairman) Drs. Tijana Zivkovic (Supervisor) Dr. Henny J.M. Bouwmeester Ing. Henk Kruidhof Dr. Martin van Sint Annaland Dr. ir. Arian Nijmeijer
1.2.2 Multi-component transport 5 1.2.2.1 Gaseous diffusion in the macroporous materials 5 1.2.2.2 Micropore diffusion 6 1.2.2.3 Maxwell-Stefan equation 7
1.2.3 Percolation effect 8
1.3 Silica membrane 11
1.3.1 Synthesis of the silica membrane 11 1.3.2 Influence of water vapor on the gas permeance through silica membrane 12
1.4 Gas sorption 15
1.4.1 Introduction 15 1.4.2 Adsorption isotherm 16 1.4.3 Langmuir isotherm 17 1.4.4 Adsorption of water vapor on the unsupported porous silica materials 19 1.4.4.1 Active groups on the surface of silica materials 19
1.4.4.2 Adsorption on the porous silica materials 20
1.5 Sorption measurements in the thin layer by the ellipsometry 23
1.5.1 The principle of ellipsometry 23 1.5.2 Sorption of water vapor on silica layers by the ellipsometry 28
Chapter 2 Sample preparation and experiments 30
2.1 Samples 30
2.2 Experimental methods and setups 30 2.2.1 Water vapor generator 30 2.2.2 Gas permeation 32 2.2.3 Ellipsometry 34
Chapter 3 Results 37
3.1 Gas permeation in the presence of water vapor 37
3.2 Water vapor adsorption in the microporous silica layer 40
Chapter 4 Discussion 44
4.1 Influence of water vapor on gas permeation 44
4.2 water vapor adsorption in the microporous silica layer 45
4.3 Percolation effect 46
Chapter 5 Conclusions 49
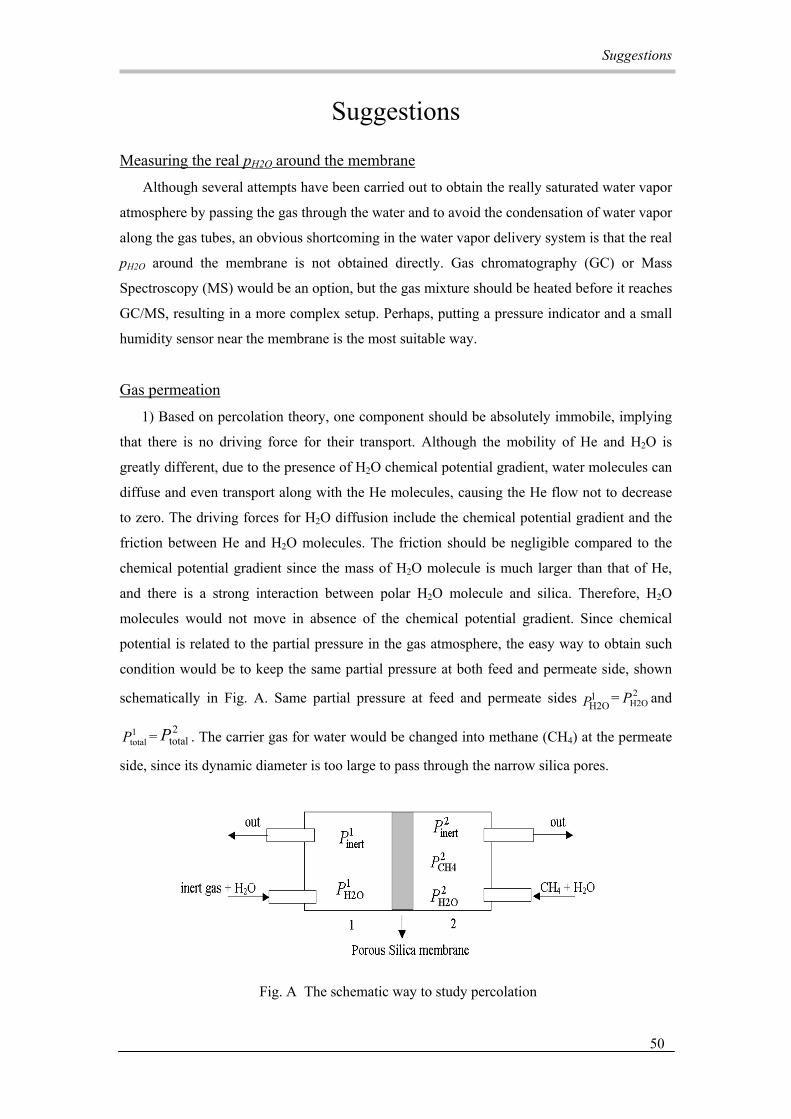
Suggestions 50
References 54
Appendix
Assignment description
1
Assignment description Hydrogen is a high-value gas with versatile applications as a chemical feedstock or as an
alternative fuel (e.g. for fuel cells). Currently, hydrogen is produced mainly from the
processes in terms of coal gasification and steam reforming of methane. Both methods
generate a mixture of H2, CO2, H2O and other gases.
Microporous silica membrane is one of the feasible means for separating H2 from this
industrial gaseous mixture in an energy-efficient and cost-saving way, compared to the
conventional separation methods (e.g. pressure swing adsorption and cryogenic separation).
At high temperatures and in the presence of water vapor, silica membrane can undergo
the rehydration or viscous sintering, resulting in the change of pore structure. However, in this
assignment, we have examined how the presence of water vapor can decrease significantly
the permeance of an inert gas through the silica membranes at low temperatures, where no
structural change is expected.
The objective of this assignment is to illustrate that the adsorption and blocking by the
immobile component (e.g. H2O at low temperature) present in the silica micropores may
decrease the permeance of the mobile one (e.g. H2, He) in a binary mixture. In the case of the
silica membrane exposed to the binary gas mixture (e.g. H2 and H2O) at low temperatures,
H2O is considered to be an immobile component, having a strong interaction with the silica
surface. As a result, the permeance of mobile component is lowered due to the adsorption and
blocking effect of water vapor being the most pronounced at the concentration near or above
the percolation threshold, i.e. the point of no flux of the mobile component due to the absence
of a connected path for the mobile component through the membrane.
In a word, this report focuses on the effect of water vapor on silica membranes in terms
of sorption and percolation.
Chapter 1 Theory
2
Chapter 1 Theory 1.1 Membranes for hydrogen separation
The need for hydrogen will increase greatly in the future as a raw material for the
chemical industry and as clean fuels in cars and electric industry (e.g. fuel cells). Currently,
hydrogen is produced mainly by the reforming of fossil fuels and coal gasification. However,
hydrogen is there mixed with large quantities of non-desired components such as light
hydrocarbons, CO and CO2 from fossil fuels [1-2]. The purification or separation of hydrogen
from these industrial gases by means of membrane has several advantages, including low
energy consumption and cost saving.
In general, membranes can be classified as organic and inorganic based on their material
composition, as porous and dense or as symmetric and asymmetric based on their structure etc.
Flux, selectivity, chemical stability and mechanical strength are the important parameters for
the membrane performance. Although organic membranes have an advantageously low price
and good scalability, they cannot be used at high temperatures or in chemically aggressive
environments containing e.g. HCl, SOx, and their poor mechanical strength hinders their high-
pressure application. Dense metal membranes, usually made of palladium or its alloys, have
very high selectivity for hydrogen (~100%) based on the solution-diffusion mechanism, but a
deadly sensitivity to CO and H2S, in terms of coal gas application [3]. Proton conductors,
such as doped BaCeO3, have a very high selectivity in the water vapor atmosphere, because
only protons can migrate through these materials. However, H2 flux through the proton-
conducting membranes is relatively low (~10-8 mol/cm2·s) [4], and their chemical stability in
the presence of certain species (e.g. CO2, H2S) is another major concern. Furthermore, energy
consumption is disadvantageous because they must be operated at high temperatures (e.g.
800-1000°C) in order to obtain high flux.
Inorganic porous membranes can be used in many industrial applications at high
temperatures (>200°C), and they have high flux and very good selectivity. Two of the most
promising porous materials for membrane are zeolite and silica: the pores in the zeolite
membrane are a part of the crystal structure, and hence have uniform dimensions. Many
zeolites are thermally stable above 500°C. Zeolite membranes are generally formed on porous
supports by hydrothermal synthesis, and hence the membranes have a lot of defects, lowering
the selectivity. The most critical barrier for zeolite applications is the difficulty in producing
in a large scale. Microporous silica membranes have high hydrogen permeance and high
selectivity and excellent capacity to scale up [5]. Hereby, silica-based membranes are
Chapter 1 Theory
3
promising candidates for hydrogen separation at elevated temperatures, although the
steam/water stability of these membranes may be an issue [2].
Generally, the porous ceramic membranes for gas separation consist of several layers
(Fig. 1.1): macroporous (dp > 50 nm) support is often several millimeters thick, giving the
mechanical strength to the system; mesoporous (2 nm < dp < 50 nm) intermediate layer of less
than 100 µm thickness is the bridge of the gap between the large pores of the support and the
small pores of the thin microporous layer (dp < 2 nm); the top layer is the actual functional
part for gas separation.
Ceramic top layer providing high hydrogen flux and selectivity is very suitable to
hydrogen separation [6]. R. de Vos [7] reported about crack-free amorphous silica layers by
dip-coating in a clean room, with high H2 permeance (2×10⁻⁶ mol/m2·s·Pa at 200°C) and
very low CO2 and CH4 permeance (10 and 50× lower, respectively, at 200°C), the details of
each layer are listed in Table 1, and they correspond to the characteristics of the membranes
described in this report.
Layer Component Thickness Sintering temperature Pore size in diameter
groups on the surface) and operating conditions (e.g. temperature, pressure). Single-
component transport is easier to analyze than the multi-component one. For the single-
component transport, Fick’s first law can be applicable; while for the multi-component
transport, even if the friction among components is neglected, Fick’s first law must be
modified. Maxell-Stefan equation is introduced to describe the multi-component transport
when the friction between the components is not negligible. Percolation phenomena should be
considered in the multi-component transport consisting of components greatly differing in
mobility.
1.2.1 Single-component transport
1.2.1.1 Viscous flow
When the mean free path of gas molecule is smaller than the mean pore diameter, the
collision of molecule-molecule is more frequent than that of molecule-wall, and viscous flow
takes place.
It is assumed that molecules lose all their momentum at the pore wall, and the flux along a
pressure gradient in the pore can be described by the modified Poisecuille equation to account
for the contribution of the pore structure [9]:
dzdP
RTPrN
ητε
8
2
−= (1.2.1)
Where N is molar flux [mol/m2·s], ε is porosity, τ is tortuosity, r is pore radius, η is gas
viscosity, P is pressure, R is gas constant, T is absolute temperature and dP/dz is pressure
gradient.
1.2.1.2 Knudsen diffusion
When the mean free path of gas molecule is larger than the mean pore diameter, the
collision of molecule-wall cannot be negligible compared to that of molecule-molecule, and
Knudsen diffusion happens.
For Knudsen diffusion, the following expression is given [9]:
MRTL
rP
NFπτ
ε 832
−=∆
= (1.2.2)
Where F is permeance in [mol/m2·s·Pa], M is molar mass of the gas and L is pore length.
Chapter 1 Theory
5
1.2.1.3 Surface diffusion
Surface diffusion plays an important role when a significant number of gas molecules are
absorbed on the pore surface by either physisorption or chemisorption, with relative strong
affinity between the gases and surface, so that the gas molecules can transport along the
surface concentration gradient. When the energy barrier between neighboring sites is smaller
than the heat of adsorption, it is easier for the gas molecules to hop to the next sites than to
desorb from the wall surface. Surface flux (Js) can be described by the Fick’s law [10]:
z
DqJ ssat
s ∂∂−
−=θρ
τε1 (1.2.3)
Where ρ is density, satq is saturated amount of adsorbates, Ds is chemical surface
diffusion coefficient and θ is coverage which indicates the covering extent.
There are two important factors: adsorption and mobility, both of which dominate the
surface diffusion. When temperature increases, the mobility of adsorbed molecules also
increases, while the amount of adsorbed molecules decreases. Therefore, the final surface
diffusion rate depends on the dominant effect induced by the temperature increase.
Furthermore, coverage θ can affect the value of Ds: at relative low θ, Ds is independent on the
coverage; while Ds decreases when θ becomes higher.
1.2.2 Multi-component transport
1.2.2.1 Gaseous diffusion in the macroporous materials
If the pore size is much larger than the mean free path of the gas molecules and more
than that of any type of species, momentum transfer from the light (fast) molecules to the
heavy (slow) ones gives rise to a non-selective mass transport mechanism. This transport
mechanism is referred to as gaseous diffusion with the binary diffusion coefficient Dij
showing a small variation with composition. For non-polar gases up to 10 bars, the binary
diffusion coefficient can be estimated from [10]:
ji
ji
jiij MM
MM
VVpT +
+×= −
23/13/1
75.12
)(10013.1D
(1.2.4)
Where T is absolute temperature, p is pressure, V is diffusion volume of a species and
M is molar mass.
Chapter 1 Theory
6
1.2.2.2 Micropore diffusion
Micropore diffusion occurs in the micropores (dp<2 nm). With respect to the pore size, the
following three cases are distinguished phenomenologically [7]:
A. When the pore size is close to the mesopore region: in the central region of the pore, the
unabsorbed molecules can move freely (Knudsen diffusion), and the absorbed ones will
diffuse along the surface (surface diffusion).
B. When the pore size is smaller than that in condition A, the molecules in the center of the
pore still can move according to the Knudsen diffusion, but are not really free. The heat of
sorption increases and the mobility of large molecules (compared to the pore size) decreases.
C. When the pore size is less than the summation of the diameters of gas X and Y, but more
than the diameter of single gas X or Y, both gases can enter the pore but can not pass
independently any more, i.e., the molecules may have a strong mutual influence on their
permeance.
The following basic assumptions can be made when the pore size is so small that the
movement of gas molecules is not continuous any longer [1]:
1. In the microporous materials, the gas molecules are surrounded by pore walls and short-
range interactions (e.g. Van der Waals forces and hydrogen bond) are considered to be
important. Consequently, gas molecules vibrate around the positions where the potential
energy is at a minimum; such a position is referred to as a vacancy. Jumps of the gas
molecules from vacancy to vacancy are possible, and the time for a jump is short compared to
the residence time of a molecule on a vacancy.
2. The microporous medium consists of a connected network of qsat energetically independent
vacancies, where only one molecule can be present at the same time. In other words, the
sorption behavior of gas molecules obeys the ideal Langmuir isotherm.
3. Molecules diffuse from one of the adsorption sites to another one under the driving force of
chemical potential only when that site is vacant, i.e. molecules cannot pass over each other.
Furthermore, the interaction of molecules is assumed to be negligible and there are no
external forces acting on the gas molecules.
When the friction between the components is negligible, the flux expression of a
component i according to Onsager’s theory of irreversible thermodynamics is given[1]:
iiii bcJ µ∇= (1.2.5)
Where iJ is flux, ic is concentration, ib is mobility, and iµ∇ is gradient in chemical
potential. ic can be expressed in terms of satq and θ.
Chapter 1 Theory
7
isat
i qc θ= (1.2.6)
When a vacancy diffusion mechanism operates, ib is related with the probability of
finding a neighboring vacancy.
)1(0lii bb θΣ−= (1.2.7)
Where 0ib is the mobility of component i in the limit of an infinitely low lattice
occupancy. ib can be related to the component diffusion coefficient iD by using Nernst-
Einstein equation.
RTbD ii = (1.2.8)
For the single-component transport
))1/(ln( iii RT θθµ −∇=∇ (1.2.9)
Eq. (1.2.5) can now be rearranged into
ii
sat
i
ii
sati DqqJ D θ
θθ
∇−−= =−
∇ ~
1 (1.2.10)
Where iD~
is so-called chemical diffusion coefficient.
For the multi-component transport, the flux expression is changed into
∑∑≠≠
∇+∇−−=il
liiil
lisat
i DqJ )θθθθ )1((~ (1.2.11)
1.2.2.3 Maxwell-Stefan equation
When the friction between the components is taken into consideration, Maxwell-Stefan
equation is introduced [11].
There are two types of forces in the multi-component mixture:
1. Forces on the individual species
2. Forces due to the interactions between the species
The first forces are known as “driving forces”; the second forces are due to the differences
in velocity between the diffusing species. The driving force on a species i in a mixture equals
the sum of the friction forces between i and the other species j:
)( jij
ijiji uuxd ∑≠
−= ζ (1.2.12)
Where id is the driving force on i, ji,ζ is the friction coefficient between i and j, jx is
the mole fraction of j and u is species velocity.
Chapter 1 Theory
8
The relation between flux J and u is
cuJ = (1.2.13)
Where c is concentration.
The Maxwell-Stefan diffusivity msD is defined as an inverse of the friction coefficient.
ij
msij
RTDζ
= (1.2.14)
For a proper description of the mass transport behavior of an n-component mixture in the
microporous materials, the mechanical interactions between the mobile components and the
solid matrix can be accounted by treating the satq vacancies as the (n+1)th component. The
Maxwell-Stefan equation can be expressed as:
∑≠= +
+−+
−=−
n
ijj
msni
niims
ij
jijii D
uuD
uud
1 1,
1θθθ (1.2.15)
Where msi
msni DD =+1, since 01 =+nu
If there are no external forces acting on the mobile species, then id can be written as
)1
ln(∑−
∇=∇=l
ii
sati
isat
i qRT
qdθ
θθµθ (1.2.16)
Combining Equations (1.2.13, 1.2.15 and 1.2.16), the Maxwell-Stefan equation for multi-
component transport can be given [1]:
∑ ∑ ∑∑ ≠ ≠
∇+∇−−
−−
=n
j il illiil
l
msi
sat
msij
jiijmsii
DqD
JJDJ )θθθθ
θθθ
)1(()1(
(1.2.17)
The first part of above equation on the right side is the contribution of the friction between
the components.
1.2.3 Percolation effect
Imagine an infinite square lattice as shown
in Fig 1.2, the cluster is defined as a group of
neighboring sites connected by bonds. Each
site (bond) of the lattice is occupied randomly
with probability p, independent on its
neighbors. Percolation theory deals with the
formed clusters, in other words, with the
groups of neighboring occupied sites (bonds)
Fig 1.2 Clusters in a 2-D square lattice
Chapter 1 Theory
9
[12]. When the sites are considered, it’s called site percolation, and its counterpart is called
bond percolation. The former is more suitable to describe the behavior of the multi-
component transport in the porous materials, especially in case of a binary mixture of mobile
and immobile components. When the pore size is so small that the continuity of gas transport
does not exist any more, gas molecules are assumed to be transported by hopping from one
site to another..
The percolation threshold pc (Table 2) is that concentration p at and above which an
infinite cluster of connected neighbors from one side of lattice to the other appears in an
infinite lattice, whereas for p<pc no such infinite cluster exists [12].
The percolation threshold can be theoretically predicted by many approaches, including
Monte Carlo (MC) simulation and effective medium approximation (EMA) model. For a 3-
dimensional single cubic lattice, the predicted threshold of site percolation is ~0.7 [12,13,14-
16], for a 2-dimensional square lattice, it is 0.32-0.40 (0.40 [12], 0.37 [16], 0.33 [17], 0.38 [18]
or 0.32 [19]).
Furthermore, percolation threshold largely depends on the connectivity of lattices, i.e. the
coordination number N [20]. The percolation threshold increases with increasing the
connectivity [21].
When the gas transport in the micropores is dominated by the basic assumptions in Section
1.2.2.2 in the case of a binary mixture of components that greatly defer in mobility,
percolation behavior may occur if the motion of the mobile component is suppressed. The
minimum value of coverage of the immobile component, above which the transport of the
mobile molecules through the pores is blocked, is also referred to as the percolation threshold
[13], with a reverse value of the ones in Table 2, i.e. 1- pc, represented by imcp in this report.
The transport behavior of a binary mixture through a zeolite membrane was investigated
where the studied gas mixture consisted of fast and weakly adsorbing hydrogen and slow and
strongly adsorbing n-butane [22-23]. The flux of weakly adsorbing H2 is reduced significantly
Lattice Site-percolation Bond-percolation
Honeycomb 0.6962 0.6527
Square 0.5927 0.5000
Triangular 0.5000 0.3473
Diamond 0.4300 0.3880
Simple cubic 0.3116 0.2488
Body Centered Cubic 0.2460 0.1803
Face Centered Cubic 0.1980 0.1190
Table 1.2 Percolation thresholds for various lattices [12]
Chapter 1 Theory
10
Fig 1.3 The dependence of diffusivity on coverage for a binary mixture of mobile components [13],
Where ji νν / is the ratio of jump frequencies between the component i and the component j
jθ is the coverage of immobile component j, app
iD~
σ is the normalized diffusivity of i
compared to its single-component flux below 100°C; while the flux of strong adsorbing n-
butane is hardly changed due to the presence of weakly adsorbing component. However, the
authors did not attribute these changes to the percolation effects.
N.E. Benes et al [13] studied multi-component lattice gas diffusion, predicting the effect
of percolation (Fig 1.3). The onset of percolation behavior was investigated by simulating the
transport of mobile component i under a fixed gradient, while slowly increasing the
occupancy of the immobile component j (i.e. with no gradient). The larger the difference of
jump frequencies between two components, the smaller the value of percolation threshold imcp . In principle, Maxwell-Stefan (MS) theory only predicts a linear relationship on the
coverage of the immobile component and the diffusivity of the mobile component, shown in
Fig. 1.3 for νi/νj=1, and thus MS theory does not incorporate the percolation effect.
Consequently, the standard mass transport descriptions used in the field of membrane
separation (e.g. Maxwell-Stefan theory) should be used with caution due to the fact that they
do not incorporate the percolation effect.
In this study, the percolation phenomenon is investigated by employing microporous
silica membrane in the case of a binary mixture containing He and water vapor at low
temperature where water molecules tend to be absorbed on the silica surface. The low
mobility of H2O molecules, compared to that of He, may induce the percolation behavior.
Chapter 1 Theory
11
1.3. Silica membrane
1.3.1 Synthesis of the silica membrane
The sol-gel process is one of the most widely used methods for the preparation of very thin
inorganic membranes [24]. Other approaches include Chemical Vapor Deposition, Chemical
Vapor Infiltration and Pulse Laser Deposition. The two main sol-gel routes are colloidal and
polymeric one. Colloidal system is a dispersion of small particles whose diameter is below
1000 nm in a liquid medium so that the effect of gravitational force is negligible and
dispersion is maintained by mutual repulsion forces between the particles. Colloidal particles
can be obtained from hydrolysis and condensation of metal salts or metal alkoxides in water.
The polymeric system is the only gel system where a true oxide network is formed by
chemical polymerization in the liquid near room temperature. Hydrolysis of the alkoxide
groups forms hydroxyl groups; condensation of the hydroxyls forms inorganic polymers and
the polymers are linked to obtain the gel. In the polymerization system, there are two different
mechanisms that dominate the hydrolysis and condensation reaction: acid-catalyzed and base-
catalyzed polymerization [25].
In general, the pore size of the materials obtained by the colloidal route is of the order of
nanometer, whereas the pores of several angstroms can be obtained by the polymeric route.
For silica synthesis, Tetra-Ethyl-Ortho-Silicate (TEOS) is one of the most widely used
precursors. State-of-the-art silica membranes with very narrow pore size and a low number of
defects can be prepared by sol-gel approach in the clean room [7].
Chapter 1 Theory
12
1.3.2 Influence of water vapor on the gas permeance through silica membrane
A good H2-separation membrane should have high hydrogen flux, high H2/CO2 selectivity,
high mechanical strength and good resistance to CO2 & CO and water vapor, necessary for
the application in coal gasification and steam reforming. The kinetic diameters of H2, CO2,
and H2O are 2.89 Å, 3.3 Å and 2.65 Å, respectively. Generally speaking, the greater the
difference between the kinetic diameters of two gas molecules, the higher the membrane
selectivity, and thus the separation of H2 and CO2 is easier than that of H2 and H2O. However,
the separation of gases from a gaseous mixture also depends on the nature of the gas-gas and
gas-surface interaction.
On the silica surface, there are three different groups: siloxane bridges (=Si-O-Si=),
hydroxyl groups (-OH) and unsaturated Si atoms. The siloxane bridges are somewhat
hydrophobic, while hydroxyl groups (-OH) and unsaturated Si atoms are absolutely
hydrophilic. At low temperature, water vapor is absorbed on the silica surface by
physisorption; at high temperature, it becomes chemisorbed by reacting with the siloxanes.
Currently there is a high interest in understanding how the permeance of H2 through silica
membrane is affected in the presence of water vapor.
Since the hydrophobicity of silica surface increases with the decreasing of the amount of
hydroxyl groups, the hydrothermal stability of silica can be improved by increasing the
sintering temperature [7] or by modifying with some organic [26-28] or inorganic [29] groups
to substitute the hydroxyl groups. However, the organic groups on the silica surface
themselves are not very stable at elevated temperatures.
Some general conclusions about the thermal and hydrothermal stability of silica
membrane were represented by R. de Vos [7]:
Thermal stability:
1. The thermal stability up to 300ºC is higher for membranes calcined at higher
temperature.
2. Exposure of silica membrane calcined at 400ºC to a dry atmosphere at 350ºC for 200
hours results in a slight densification of the porous structure
Hydrothermal stability:
1. The influence of water vapor pressure on the membrane deterioration is larger than
that of temperature.
2. For silica membranes calcined at 600ºC, hydrothermal exposure at 350ºC and 475ºC
causes the formation of 200-300 µm holes
Chapter 1 Theory
13
3. Although silica membrane calcined at higher temperatures has less hydroxyl groups,
the decrease of hydroxyl group concentration does not increase the hydrothermal
stability due to the fact that the pore size is reduced with high calcining temperature.
Q. Wei et al [30-31] studied the effect of a low water vapor pressure (pH2O=3.6× 10³ Pa)
on the hydrogen permeance at 200ºC for 120 hours in the case of Silica (400) and methyl-
modified Silica (400) membranes made by sol-gel approach. The H2 permeance of pure Silica
(400) is continually decreasing during 120 hours; however, that of methyl-modified Silica
(400) becomes stable after 50 hours, only dropping about 6% compared with the initial
permeance without the existence of water vapor (Fig. 1.4). This phenomenon indicates that
methyl-modified Silica (400) membrane is more stable than the pure Silica (400). The initial
permeance of modified Silica (400) is higher than that of Silica (400), implying the pore size
of modified Silica (400) is larger, probably due to the addition of methyl groups in the
original sol.
It can be concluded that the permeance through the silica membrane, even the organic-
modified one, is decreased in presence of water vapor. At high temperatures, the interaction
between water vapor and silica surface causes the densification or damage of pore structure,
while at low temperatures, the permeance decreases significantly due to the presence of water
vapor, even without destroying the pore structure [30-31]. The decrease in H2 permeance
could be attributed to the adsorption of water vapor and blocking of silica micropores. This
phenomenon should be more significant at lower temperature where the mobility of H2O
molecules decrease, while the amount of adsorbed H2O molecules increase due to the stronger
interaction.
Chapter 1 Theory
14
0 20 40 60 80 100 1201.8x10-7
1.9x10⁻⁷
2.0x10⁻⁷
2.1x10⁻⁷
2.2x10⁻⁷
2.3x10⁻⁷
2.4x10⁻⁷
2.5x10⁻⁷
H2 p
erm
eanc
e/m
olm
-2Pa
-1s-1
Aging time/hrs
0 20 40 60 80 100 120
PH2O=3.6 X 10³ Pa T=200OC
0 20 40 60 80 100 1201.8x10-7
1.9x10⁻⁷
2.0x10⁻⁷
2.1x10⁻⁷
2.2x10⁻⁷
2.3x10⁻⁷
2.4x10⁻⁷
2.5x10⁻⁷
H2 p
erm
eanc
e/m
olm
-2Pa
-1s-1
Aging time/hrs
0 20 40 60 80 100 120
PH2O=3.6 X 10³ Pa T=200OC
15%15%
(a)
0 20 40 60 80 1004.5x10-7
4.8x10⁻⁷
5.1x10⁻⁷
5.4x10⁻⁷
5.7x10⁻⁷
6.0x10⁻⁷
6.3x10⁻⁷
H2 p
erm
eanc
e/m
olm
-2s-1
Pa-1
Aging time/hrs
0 20 40 60 80 100
PH2O=3.6 X 10³ Pa T=200OC
0 20 40 60 80 1004.5x10-7
4.8x10⁻⁷
5.1x10⁻⁷
5.4x10⁻⁷
5.7x10⁻⁷
6.0x10⁻⁷
6.3x10⁻⁷
H2 p
erm
eanc
e/m
olm
-2s-1
Pa-1
Aging time/hrs
0 20 40 60 80 100
PH2O=3.6 X 10³ Pa T=200OC
0 20 40 60 80 1004.5x10-7
4.8x10⁻⁷
5.1x10⁻⁷
5.4x10⁻⁷
5.7x10⁻⁷
6.0x10⁻⁷
6.3x10⁻⁷
H2 p
erm
eanc
e/m
olm
-2s-1
Pa-1
Aging time/hrs
0 20 40 60 80 100
PH2O=3.6 X 10³ Pa T=200OC
6%6%
(b)
Fig. 1.4 H2 permeance during the water vapor exposure
Yamamoto Rehydroxylation of dehydrated silica surfaces by water vapor adsorption
Advanced Powder Technol. Vol. 12 No. 3 (2001) pp. 331-342
[41] Vera Bolis, Bice Fubini, Leonardo Marchese, Gianmario Martra and Doninique Costa
Hydrophilic and hydrophobic sites on dehydrated crystalline and amorphous silicas J.
Chem. Soc. Faraday Trans., 1991, 87(3) pp. 497-505
[42] V.V. Turov and I.F. Mironyuk Adsorption layers of water on the surface of hydrophilic,
hydrophobic and mixed silicas Colloids and Surfaces A: Physicochemical and
Engineering Aspects 134 (1998) pp. 257-263
[43] Tatsuo Ishikawa, Mitsuhiko Matsuda, Akemi Yasukawa etc Surface silanol groups of
mesoporous silica FSM-16 J. Chem. Soc., Faraday Trans., 1996, 92(11) pp. 1985-1989
[44] Puibasset and R. J.-M. pellenq A grand canonical Monte Carlo simulation study of water
adsorption in a Vycor-like disordered mesoporous materials at 300K Studies in Surface
Science and Catalysis, 144, 2002, Elsevier pp. 371-377
References
57
[45] J. Alcaniz-Monge and D. Lozano-Castello Water adsorption on micro and mesoporous
silicas Studies in Surface Science and Catalysis, 144, 2002 Elsevier pp. 291-298
[46] SHINJI INAGAKI YOSHIAKI FUKUSHIMA KAZUO KURODA and KAZUYUKI
KURODA Adsorption Isotherm of Water Vapor and Its Large Hysteresis on Highly
Ordered Mesoporous Silica JOURNAL OF COLLOID AND INTERFACE SCIENCE
180, ( 1996) pp. 623–624
[47] S. Inagaki and Y. Fukushima adsorption of water vapor and hydrophobicity of ordered
mesoporous silica, FSM-16 Microporous and Mesoporous Materials 21 (1998) pp. 667-
672
[48] A. GORBACH, M. STEGMAIER AND G. EIGENBERGER Measurement and
Modeling of Water Vapor Adsorption on Zeolite 4A—Equilibria and Kinetics Adsorption
10, 2004 pp. 29–46
[49] Trevor E. Clark, Harry W. Deckman, Donald M. Cox and Ronald R. Chance In situ
determination of the adsorption characteristics of a zeolite membrane Journal of
Membrane Science 230 (2004) pp. 91–98
[50] Herland G. Tompkins A user’s Guide to Ellipsometry Academic Press, INC San Diego
1993
[51] A.Bourgeois, A.Brunet Bruneau, V.Jousseaume, N.Rochat, S.Fisson, B.Demarets and
J.Rivory Description of the porosity of inhomogeneous porous low-k films using solvent
adsorption studied by spectroscopic ellipsometry in the visible range Thin Solid Films
455 –456 (2004 ) pp. 366 –369
[52] N. E. Benes, G. Spijksma and H. Verweij etc CO2 Sorption of a Thin Silica Layer Determined by Spectroscopic Ellipsometry AIChE Journal 2001 Vol.47 No.5 pp. 1212-1218
[53] C. Wongmanerod, S. Zangooie and H. Arwin Determination of pore size distribution and
surface area of thin porous silicon layers by spectroscopic ellipsometry Applied Surface
Science 172 (2001) pp. 117-125
[54] A. Bourgeois, A. Brunet Bruneau and S. Fisson etc Determination of pore size
distribution in thin organized mesoporous silica films by spectroscopic ellipsometry in the
visible and infrared range Thin Solid Films (2004) 447–448 pp. 46 –50
[55] F. N. Dultsev and M. R. Baklanov Nondestructive Determination of Pore Size
Distribution in Thin Films Deposited on Solid Substrates Electrochemical and Solid-State
Letters, 2 (4) (1999) pp.192-194
[56] E. S. Kooij, H. Wormeester, A. C. Galcac and B. Poelsema Optical Anisotropy and
Porosity of Anodic Aluminum Oxide Characterized by Spectroscopic Ellipsometry
Electrochemical and Solid-State Letters, 6 (11) (2001) B52-B54
References
58
[57] C. NEGORO, N. HATA, K. YAMADA and T. KIKKAWA Nondestructive
Characterization of a Series of Periodic Porous Silica Films by in situ Spectroscopic
Ellipsometry in a Vapor Cell Japanese Journal of Applied Physics Vol.43, No.4 A,
2004, pp.1327 –1329
[58] A. Alvarez-Herrero, A.J. Fort, H. Guerrero and E. Bernabeu Ellipsometric
characterization and influence of relative humidity on TiO2 layers optical properties
Thin Solid Films 349 (1999) pp. 212-219
[59] R. Denoyel Microcalorimetry and ellipsometry in surfactant adsorption studies Colloids
and Surfaces A: Physicochemical and Engineering Aspects 205 (2002) pp. 61–71
[60] M.A. Fardad, E.M. Yearman, E.J.C. Dawnay, Mino Green and F. Horowitz Effects of
H2O on structure of acid-catalysed SiO2 sol-gel films Journal of Non-crystalline Solids
183 (1995) pp. 260-267
[61] A. Alvarez-Herrero, G. Ramos, F. Monte, E. Bernabeu and D. Levy Water adsorption in
porous TiO2–SiO2 sol –gel films analyzed by spectroscopic ellipsometry Thin Solid Films
455–456 (2004 ) pp. 356 –360
[62] A. Alvarez-Herrero, R. L. Heredero, E. Bernabeu and D. Levy Adsorption of water on