Iron complexes of tris(pyrazolyl)ethane ligands methylated in the 3-, 4-, and 5-positions Margaret A. Goodman a , Michael J. DeMarco b , Steven E. Tarasek b , Alexander Y. Nazarenko c , William Brennessel d , M. Scott Goodman c,⇑ a Department of Math and Natural Sciences, D’Youville College, Buffalo, NY 14201, USA b Department of Physics, SUNY Buffalo State, Buffalo, NY 14222, USA c Department of Chemistry, SUNY Buffalo State, Buffalo, NY 14222, USA d Department of Chemistry, University of Rochester, Rochester, NY 14627, USA article info Article history: Received 2 June 2014 Received in revised form 12 August 2014 Accepted 16 August 2014 Available online 6 September 2014 Keywords: Tris(pyrazolyl)ethane Tris(pyrazolyl)methane Spin crossover Iron complexes Mössbauer spectroscopy abstract Four tris(pyrazolyl)ethane (tpe) ligands were synthesized from tris(pyrazolyl)methane (tpm) starting materials. The new tpe ligands differ only in the placement of methyl groups on the pyrazole rings. For each tpe ligand, the 2:1 complex with Fe(II) was readily synthesized and the structures were deter- mined by X-ray crystallography and characterized more completely by 57 Fe Mössbauer spectroscopy, 1 H NMR, and UV–Vis spectroscopy. The complexes all contain Fe(II) in the low spin (LS) state at low temper- atures, but differ in Fe–N bond lengths and spectroscopic parameters. Methyl groups in the 5-position of the pyrazoles of the tpe ligand close the bite of the ligand, strengthening the ligand field and shifting the visible absorbance band of the complex to higher energies. Methyls in the 4-position had almost no effect on the ligand, making the iron(II) complex almost indistinguishable from that of the parent tpe ligand. Methyl groups in the 3-position of the tpe ligand cause an opening of the bite of the ligand, which is evi- denced by increased Fe–N bond lengths in the complex and a shift of the visible absorbance to lower energies. The complex with methyls in the 3-position also starts to display spin crossover behavior near room temperature, whereas the other tpe complexes do not. Ó 2014 Elsevier B.V. All rights reserved. 1. Introduction The tris(pyrazolyl)borates (tp) and tris(pyrazolyl)methanes (tpm) are tripodal, nitrogen-donor ligands that readily form com- plexes with numerous metal ions [1,2]. These ligands, sometimes also referred to as ‘‘scorpionates’’, consist of a central atom, either boron (tp) or carbon (tpm), bonded to each of three pyrazole moi- eties through one nitrogen atom of the pyrazole rings, which leaves the second nitrogen of each pyrazole available for chelating to a metal ion (Fig. 1). With metal ions such as Fe(II), these ligands gen- erally form pseudo-octahedral complexes containing two ligands, provided that the substituents in the 3-position of the pyrazoles (R 1 in Fig. 1) are not so bulky as to prevent inter-digitation of these groups in the complex [2d]. Since Fe(II) has a 3d 6 electronic configuration, octahedral com- plexes of Fe(II) can have either a high-spin (HS, S = 2) or a low-spin (LS, S = 0) ground-state electronic configuration. The ligand field strength of tpm ligand is poised so that Fe(II) complexes can some- times exhibit temperature-dependent spin crossover (SCO) behav- ior induced by temperature, irradiation, or pressure in the solid state or in solution [2,3]. In the case of temperature-induced SCO transitions, the change between the diamagnetic LS state and the paramagnetic HS state can occur gradually or abruptly, with the transition temperature being dependent on the nature of the sub- stituents on the N-donor heterocycles [4]. Chemical modification of the central carbon atom of tpm and related ligands can be achieved by deprotonation with a strong base followed by treatment with an electrophile [5]. Perhaps the simplest modification of the central carbon is the introduction of a methyl group to afford a 1,1,1-tris(pyrazolyl)ethane ligand (tpe) (Fig. 1). A few examples of metal complexes containing the unsub- stituted tpe ligand have been reported previously [5b,6]. More elaborate functionalization of the tpm carbon has been employed by Reger for the creation of a number of functionalized tpm ligands that form fascinating supramolecular structures when complexed to metal ions [7]. As a result of our interest in the chemistry of tpm complexes that exhibit spin-state transitions near room temperature [8], we undertook the synthesis and study of a simple series of tpe ligands http://dx.doi.org/10.1016/j.ica.2014.08.046 0020-1693/Ó 2014 Elsevier B.V. All rights reserved. ⇑ Corresponding author. Tel.: +1 (716) 878 5204. E-mail address: [email protected](M.S. Goodman). Inorganica Chimica Acta 423 (2014) 358–368 Contents lists available at ScienceDirect Inorganica Chimica Acta journal homepage: www.elsevier.com/locate/ica
Transcript
Inorganica Chimica Acta 423 (2014) 358–368
Contents lists available at ScienceDirect
Inorganica Chimica Acta
journal homepage: www.elsevier .com/locate / ica
Iron complexes of tris(pyrazolyl)ethane ligands methylated in the 3-, 4-,and 5-positions
http://dx.doi.org/10.1016/j.ica.2014.08.0460020-1693/� 2014 Elsevier B.V. All rights reserved.
Margaret A. Goodman a, Michael J. DeMarco b, Steven E. Tarasek b, Alexander Y. Nazarenko c,William Brennessel d, M. Scott Goodman c,⇑a Department of Math and Natural Sciences, D’Youville College, Buffalo, NY 14201, USAb Department of Physics, SUNY Buffalo State, Buffalo, NY 14222, USAc Department of Chemistry, SUNY Buffalo State, Buffalo, NY 14222, USAd Department of Chemistry, University of Rochester, Rochester, NY 14627, USA
a r t i c l e i n f o a b s t r a c t
Article history:Received 2 June 2014Received in revised form 12 August 2014Accepted 16 August 2014Available online 6 September 2014
Four tris(pyrazolyl)ethane (tpe) ligands were synthesized from tris(pyrazolyl)methane (tpm) startingmaterials. The new tpe ligands differ only in the placement of methyl groups on the pyrazole rings.For each tpe ligand, the 2:1 complex with Fe(II) was readily synthesized and the structures were deter-mined by X-ray crystallography and characterized more completely by 57Fe Mössbauer spectroscopy, 1HNMR, and UV–Vis spectroscopy. The complexes all contain Fe(II) in the low spin (LS) state at low temper-atures, but differ in Fe–N bond lengths and spectroscopic parameters. Methyl groups in the 5-position ofthe pyrazoles of the tpe ligand close the bite of the ligand, strengthening the ligand field and shifting thevisible absorbance band of the complex to higher energies. Methyls in the 4-position had almost no effecton the ligand, making the iron(II) complex almost indistinguishable from that of the parent tpe ligand.Methyl groups in the 3-position of the tpe ligand cause an opening of the bite of the ligand, which is evi-denced by increased Fe–N bond lengths in the complex and a shift of the visible absorbance to lowerenergies. The complex with methyls in the 3-position also starts to display spin crossover behavior nearroom temperature, whereas the other tpe complexes do not.
� 2014 Elsevier B.V. All rights reserved.
1. Introduction
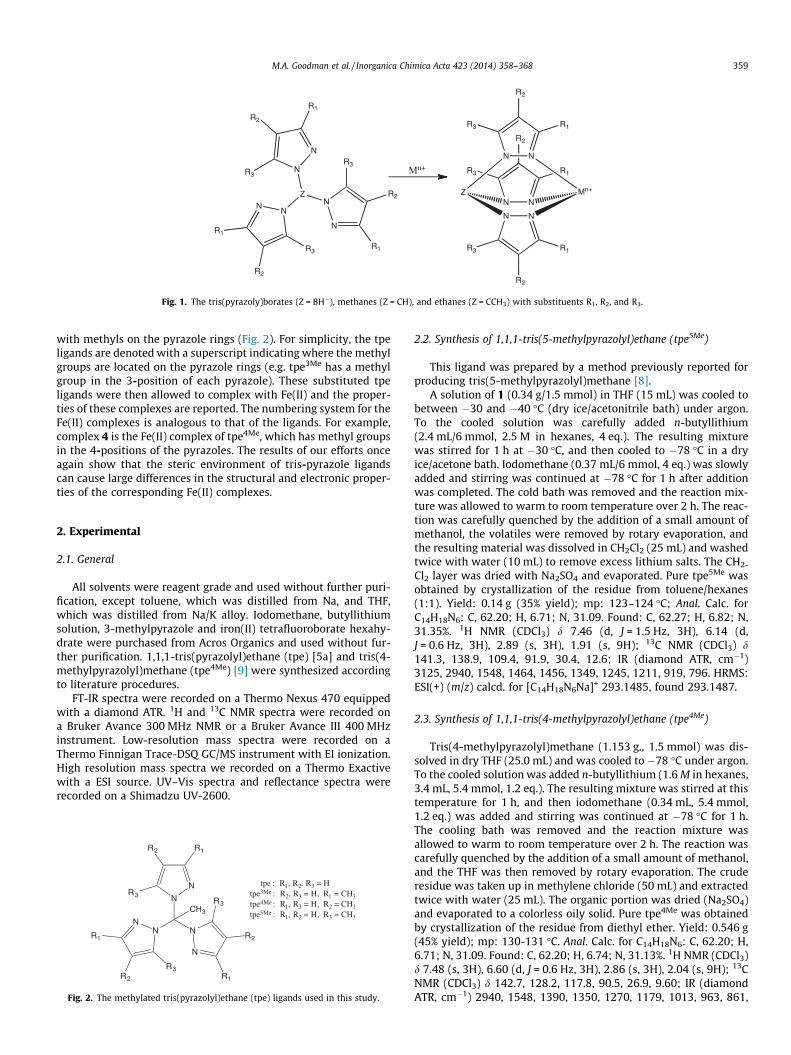
The tris(pyrazolyl)borates (tp) and tris(pyrazolyl)methanes(tpm) are tripodal, nitrogen-donor ligands that readily form com-plexes with numerous metal ions [1,2]. These ligands, sometimesalso referred to as ‘‘scorpionates’’, consist of a central atom, eitherboron (tp) or carbon (tpm), bonded to each of three pyrazole moi-eties through one nitrogen atom of the pyrazole rings, which leavesthe second nitrogen of each pyrazole available for chelating to ametal ion (Fig. 1). With metal ions such as Fe(II), these ligands gen-erally form pseudo-octahedral complexes containing two ligands,provided that the substituents in the 3-position of the pyrazoles(R1 in Fig. 1) are not so bulky as to prevent inter-digitation of thesegroups in the complex [2d].
Since Fe(II) has a 3d6 electronic configuration, octahedral com-plexes of Fe(II) can have either a high-spin (HS, S = 2) or a low-spin(LS, S = 0) ground-state electronic configuration. The ligand fieldstrength of tpm ligand is poised so that Fe(II) complexes can some-
times exhibit temperature-dependent spin crossover (SCO) behav-ior induced by temperature, irradiation, or pressure in the solidstate or in solution [2,3]. In the case of temperature-induced SCOtransitions, the change between the diamagnetic LS state and theparamagnetic HS state can occur gradually or abruptly, with thetransition temperature being dependent on the nature of the sub-stituents on the N-donor heterocycles [4].
Chemical modification of the central carbon atom of tpm andrelated ligands can be achieved by deprotonation with a strongbase followed by treatment with an electrophile [5]. Perhaps thesimplest modification of the central carbon is the introduction ofa methyl group to afford a 1,1,1-tris(pyrazolyl)ethane ligand (tpe)(Fig. 1). A few examples of metal complexes containing the unsub-stituted tpe ligand have been reported previously [5b,6]. Moreelaborate functionalization of the tpm carbon has been employedby Reger for the creation of a number of functionalized tpm ligandsthat form fascinating supramolecular structures when complexedto metal ions [7].
As a result of our interest in the chemistry of tpm complexesthat exhibit spin-state transitions near room temperature [8], weundertook the synthesis and study of a simple series of tpe ligands
Fig. 1. The tris(pyrazoly)borates (Z = BH�), methanes (Z = CH), and ethanes (Z = CCH3) with substituents R1, R2, and R3.
M.A. Goodman et al. / Inorganica Chimica Acta 423 (2014) 358–368 359
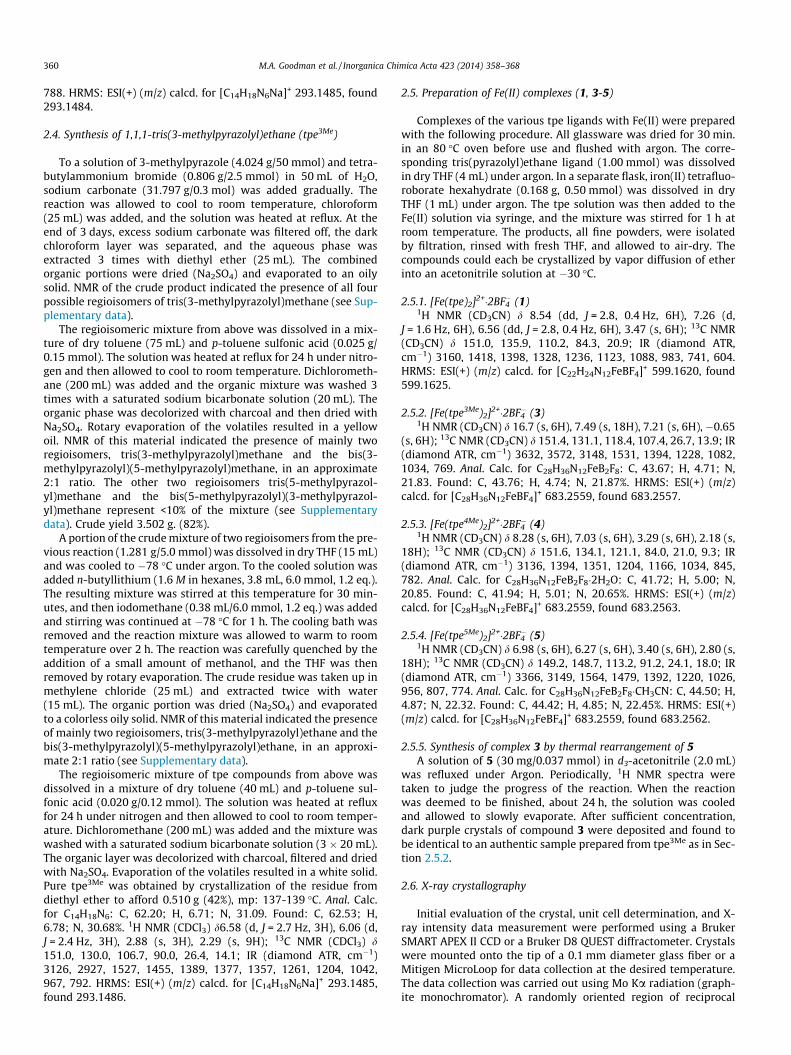
with methyls on the pyrazole rings (Fig. 2). For simplicity, the tpeligands are denoted with a superscript indicating where the methylgroups are located on the pyrazole rings (e.g. tpe3Me has a methylgroup in the 3-position of each pyrazole). These substituted tpeligands were then allowed to complex with Fe(II) and the proper-ties of these complexes are reported. The numbering system for theFe(II) complexes is analogous to that of the ligands. For example,complex 4 is the Fe(II) complex of tpe4Me, which has methyl groupsin the 4-positions of the pyrazoles. The results of our efforts onceagain show that the steric environment of tris-pyrazole ligandscan cause large differences in the structural and electronic proper-ties of the corresponding Fe(II) complexes.
2. Experimental
2.1. General
All solvents were reagent grade and used without further puri-fication, except toluene, which was distilled from Na, and THF,which was distilled from Na/K alloy. Iodomethane, butyllithiumsolution, 3-methylpyrazole and iron(II) tetrafluoroborate hexahy-drate were purchased from Acros Organics and used without fur-ther purification. 1,1,1-tris(pyrazolyl)ethane (tpe) [5a] and tris(4-methylpyrazolyl)methane (tpe4Me) [9] were synthesized accordingto literature procedures.
FT-IR spectra were recorded on a Thermo Nexus 470 equippedwith a diamond ATR. 1H and 13C NMR spectra were recorded ona Bruker Avance 300 MHz NMR or a Bruker Avance III 400 MHzinstrument. Low-resolution mass spectra were recorded on aThermo Finnigan Trace-DSQ GC/MS instrument with EI ionization.High resolution mass spectra we recorded on a Thermo Exactivewith a ESI source. UV–Vis spectra and reflectance spectra wererecorded on a Shimadzu UV-2600.
Fig. 2. The methylated tris(pyrazolyl)ethane (tpe) ligands used in this study.
2.2. Synthesis of 1,1,1-tris(5-methylpyrazolyl)ethane (tpe5Me)
This ligand was prepared by a method previously reported forproducing tris(5-methylpyrazolyl)methane [8].
A solution of 1 (0.34 g/1.5 mmol) in THF (15 mL) was cooled tobetween �30 and �40 �C (dry ice/acetonitrile bath) under argon.To the cooled solution was carefully added n-butyllithium(2.4 mL/6 mmol, 2.5 M in hexanes, 4 eq.). The resulting mixturewas stirred for 1 h at �30 �C, and then cooled to �78 �C in a dryice/acetone bath. Iodomethane (0.37 mL/6 mmol, 4 eq.) was slowlyadded and stirring was continued at �78 �C for 1 h after additionwas completed. The cold bath was removed and the reaction mix-ture was allowed to warm to room temperature over 2 h. The reac-tion was carefully quenched by the addition of a small amount ofmethanol, the volatiles were removed by rotary evaporation, andthe resulting material was dissolved in CH2Cl2 (25 mL) and washedtwice with water (10 mL) to remove excess lithium salts. The CH2-
Cl2 layer was dried with Na2SO4 and evaporated. Pure tpe5Me wasobtained by crystallization of the residue from toluene/hexanes(1:1). Yield: 0.14 g (35% yield); mp: 123–124 �C; Anal. Calc. forC14H18N6: C, 62.20; H, 6.71; N, 31.09. Found: C, 62.27; H, 6.82; N,31.35%. 1H NMR (CDCl3) d 7.46 (d, J = 1.5 Hz, 3H), 6.14 (d,J = 0.6 Hz, 3H), 2.89 (s, 3H), 1.91 (s, 9H); 13C NMR (CDCl3) d141.3, 138.9, 109.4, 91.9, 30.4, 12.6; IR (diamond ATR, cm�1)3125, 2940, 1548, 1464, 1456, 1349, 1245, 1211, 919, 796. HRMS:ESI(+) (m/z) calcd. for [C14H18N6Na]+ 293.1485, found 293.1487.
2.3. Synthesis of 1,1,1-tris(4-methylpyrazolyl)ethane (tpe4Me)
Tris(4-methylpyrazolyl)methane (1.153 g., 1.5 mmol) was dis-solved in dry THF (25.0 mL) and was cooled to �78 �C under argon.To the cooled solution was added n-butyllithium (1.6 M in hexanes,3.4 mL, 5.4 mmol, 1.2 eq.). The resulting mixture was stirred at thistemperature for 1 h, and then iodomethane (0.34 mL, 5.4 mmol,1.2 eq.) was added and stirring was continued at �78 �C for 1 h.The cooling bath was removed and the reaction mixture wasallowed to warm to room temperature over 2 h. The reaction wascarefully quenched by the addition of a small amount of methanol,and the THF was then removed by rotary evaporation. The cruderesidue was taken up in methylene chloride (50 mL) and extractedtwice with water (25 mL). The organic portion was dried (Na2SO4)and evaporated to a colorless oily solid. Pure tpe4Me was obtainedby crystallization of the residue from diethyl ether. Yield: 0.546 g(45% yield); mp: 130-131 �C. Anal. Calc. for C14H18N6: C, 62.20; H,6.71; N, 31.09. Found: C, 62.20; H, 6.74; N, 31.13%. 1H NMR (CDCl3)d 7.48 (s, 3H), 6.60 (d, J = 0.6 Hz, 3H), 2.86 (s, 3H), 2.04 (s, 9H); 13CNMR (CDCl3) d 142.7, 128.2, 117.8, 90.5, 26.9, 9.60; IR (diamondATR, cm�1) 2940, 1548, 1390, 1350, 1270, 1179, 1013, 963, 861,
360 M.A. Goodman et al. / Inorganica Chimica Acta 423 (2014) 358–368
788. HRMS: ESI(+) (m/z) calcd. for [C14H18N6Na]+ 293.1485, found293.1484.
2.4. Synthesis of 1,1,1-tris(3-methylpyrazolyl)ethane (tpe3Me)
To a solution of 3-methylpyrazole (4.024 g/50 mmol) and tetra-butylammonium bromide (0.806 g/2.5 mmol) in 50 mL of H2O,sodium carbonate (31.797 g/0.3 mol) was added gradually. Thereaction was allowed to cool to room temperature, chloroform(25 mL) was added, and the solution was heated at reflux. At theend of 3 days, excess sodium carbonate was filtered off, the darkchloroform layer was separated, and the aqueous phase wasextracted 3 times with diethyl ether (25 mL). The combinedorganic portions were dried (Na2SO4) and evaporated to an oilysolid. NMR of the crude product indicated the presence of all fourpossible regioisomers of tris(3-methylpyrazolyl)methane (see Sup-plementary data).
The regioisomeric mixture from above was dissolved in a mix-ture of dry toluene (75 mL) and p-toluene sulfonic acid (0.025 g/0.15 mmol). The solution was heated at reflux for 24 h under nitro-gen and then allowed to cool to room temperature. Dichlorometh-ane (200 mL) was added and the organic mixture was washed 3times with a saturated sodium bicarbonate solution (20 mL). Theorganic phase was decolorized with charcoal and then dried withNa2SO4. Rotary evaporation of the volatiles resulted in a yellowoil. NMR of this material indicated the presence of mainly tworegioisomers, tris(3-methylpyrazolyl)methane and the bis(3-methylpyrazolyl)(5-methylpyrazolyl)methane, in an approximate2:1 ratio. The other two regioisomers tris(5-methylpyrazol-yl)methane and the bis(5-methylpyrazolyl)(3-methylpyrazol-yl)methane represent <10% of the mixture (see Supplementarydata). Crude yield 3.502 g. (82%).
A portion of the crude mixture of two regioisomers from the pre-vious reaction (1.281 g/5.0 mmol) was dissolved in dry THF (15 mL)and was cooled to �78 �C under argon. To the cooled solution wasadded n-butyllithium (1.6 M in hexanes, 3.8 mL, 6.0 mmol, 1.2 eq.).The resulting mixture was stirred at this temperature for 30 min-utes, and then iodomethane (0.38 mL/6.0 mmol, 1.2 eq.) was addedand stirring was continued at �78 �C for 1 h. The cooling bath wasremoved and the reaction mixture was allowed to warm to roomtemperature over 2 h. The reaction was carefully quenched by theaddition of a small amount of methanol, and the THF was thenremoved by rotary evaporation. The crude residue was taken up inmethylene chloride (25 mL) and extracted twice with water(15 mL). The organic portion was dried (Na2SO4) and evaporatedto a colorless oily solid. NMR of this material indicated the presenceof mainly two regioisomers, tris(3-methylpyrazolyl)ethane and thebis(3-methylpyrazolyl)(5-methylpyrazolyl)ethane, in an approxi-mate 2:1 ratio (see Supplementary data).
The regioisomeric mixture of tpe compounds from above wasdissolved in a mixture of dry toluene (40 mL) and p-toluene sul-fonic acid (0.020 g/0.12 mmol). The solution was heated at refluxfor 24 h under nitrogen and then allowed to cool to room temper-ature. Dichloromethane (200 mL) was added and the mixture waswashed with a saturated sodium bicarbonate solution (3 � 20 mL).The organic layer was decolorized with charcoal, filtered and driedwith Na2SO4. Evaporation of the volatiles resulted in a white solid.Pure tpe3Me was obtained by crystallization of the residue fromdiethyl ether to afford 0.510 g (42%), mp: 137-139 �C. Anal. Calc.for C14H18N6: C, 62.20; H, 6.71; N, 31.09. Found: C, 62.53; H,6.78; N, 30.68%. 1H NMR (CDCl3) d6.58 (d, J = 2.7 Hz, 3H), 6.06 (d,J = 2.4 Hz, 3H), 2.88 (s, 3H), 2.29 (s, 9H); 13C NMR (CDCl3) d151.0, 130.0, 106.7, 90.0, 26.4, 14.1; IR (diamond ATR, cm�1)3126, 2927, 1527, 1455, 1389, 1377, 1357, 1261, 1204, 1042,967, 792. HRMS: ESI(+) (m/z) calcd. for [C14H18N6Na]+ 293.1485,found 293.1486.
2.5. Preparation of Fe(II) complexes (1, 3-5)
Complexes of the various tpe ligands with Fe(II) were preparedwith the following procedure. All glassware was dried for 30 min.in an 80 �C oven before use and flushed with argon. The corre-sponding tris(pyrazolyl)ethane ligand (1.00 mmol) was dissolvedin dry THF (4 mL) under argon. In a separate flask, iron(II) tetrafluo-roborate hexahydrate (0.168 g, 0.50 mmol) was dissolved in dryTHF (1 mL) under argon. The tpe solution was then added to theFe(II) solution via syringe, and the mixture was stirred for 1 h atroom temperature. The products, all fine powders, were isolatedby filtration, rinsed with fresh THF, and allowed to air-dry. Thecompounds could each be crystallized by vapor diffusion of etherinto an acetonitrile solution at �30 �C.
1H NMR (CD3CN) d 16.7 (s, 6H), 7.49 (s, 18H), 7.21 (s, 6H), �0.65(s, 6H); 13C NMR (CD3CN) d 151.4, 131.1, 118.4, 107.4, 26.7, 13.9; IR(diamond ATR, cm�1) 3632, 3572, 3148, 1531, 1394, 1228, 1082,1034, 769. Anal. Calc. for C28H36N12FeB2F8: C, 43.67; H, 4.71; N,21.83. Found: C, 43.76; H, 4.74; N, 21.87%. HRMS: ESI(+) (m/z)calcd. for [C28H36N12FeBF4]+ 683.2559, found 683.2557.
2.5.3. [Fe(tpe4Me)2]2+�2BF4� (4)
1H NMR (CD3CN) d 8.28 (s, 6H), 7.03 (s, 6H), 3.29 (s, 6H), 2.18 (s,18H); 13C NMR (CD3CN) d 151.6, 134.1, 121.1, 84.0, 21.0, 9.3; IR(diamond ATR, cm�1) 3136, 1394, 1351, 1204, 1166, 1034, 845,782. Anal. Calc. for C28H36N12FeB2F8�2H2O: C, 41.72; H, 5.00; N,20.85. Found: C, 41.94; H, 5.01; N, 20.65%. HRMS: ESI(+) (m/z)calcd. for [C28H36N12FeBF4]+ 683.2559, found 683.2563.
2.5.4. [Fe(tpe5Me)2]2+�2BF4� (5)
1H NMR (CD3CN) d 6.98 (s, 6H), 6.27 (s, 6H), 3.40 (s, 6H), 2.80 (s,18H); 13C NMR (CD3CN) d 149.2, 148.7, 113.2, 91.2, 24.1, 18.0; IR(diamond ATR, cm�1) 3366, 3149, 1564, 1479, 1392, 1220, 1026,956, 807, 774. Anal. Calc. for C28H36N12FeB2F8�CH3CN: C, 44.50; H,4.87; N, 22.32. Found: C, 44.42; H, 4.85; N, 22.45%. HRMS: ESI(+)(m/z) calcd. for [C28H36N12FeBF4]+ 683.2559, found 683.2562.
2.5.5. Synthesis of complex 3 by thermal rearrangement of 5A solution of 5 (30 mg/0.037 mmol) in d3-acetonitrile (2.0 mL)
was refluxed under Argon. Periodically, 1H NMR spectra weretaken to judge the progress of the reaction. When the reactionwas deemed to be finished, about 24 h, the solution was cooledand allowed to slowly evaporate. After sufficient concentration,dark purple crystals of compound 3 were deposited and found tobe identical to an authentic sample prepared from tpe3Me as in Sec-tion 2.5.2.
2.6. X-ray crystallography
Initial evaluation of the crystal, unit cell determination, and X-ray intensity data measurement were performed using a BrukerSMART APEX II CCD or a Bruker D8 QUEST diffractometer. Crystalswere mounted onto the tip of a 0.1 mm diameter glass fiber or aMitigen MicroLoop for data collection at the desired temperature.The data collection was carried out using Mo Ka radiation (graph-ite monochromator). A randomly oriented region of reciprocal
M.A. Goodman et al. / Inorganica Chimica Acta 423 (2014) 358–368 361
space was surveyed: three major sections of frames were collectedwith 0.50� steps in x at three different u settings and a detectorposition of �38� in 2h. The intensity data were corrected forabsorption [10]. Space groups were determined based on system-atic absences and intensity statistics and the structures weresolved using SIR97 [11] (or SHELXT [12]) and refined using SHELXL-97[12]. A direct-methods solution was calculated, which providedmost non-hydrogen atoms from the E-map. Full-matrix leastsquares/difference Fourier cycles were then performed, whichlocated the remaining non-hydrogen atoms. All non-hydrogenatoms were refined with anisotropic displacement parameters.All hydrogen atoms were placed in ideal positions and refined asriding atoms with relative isotropic displacement parameters.
2.7. Mössbauer spectroscopy
The Mössbauer experiments on the Fe(II) complexes 1 and 3-5were performed in vertical transmission geometry. The velocitycalibration was performed with an a-Fe foil and isomer shifts arereferenced to the foil for both of the experimental arrangements.The delrin sample holder contained less than 0.2 mg/cm2 of 57Fefor all the samples measured. Experiments at 298 K and belowwere performed inside the sample chamber of a Janis cryostat withthe source, 57Co(Rh), 1 cm above the sample holder, which wereboth held at the same temperature in an air bath [13]. At 78 Kthe air bath was at a pressure lower than 40 � 10�2 mbar. TheMössbauer c-ray was detected by a proportional counter placedbelow the cryostat mylar window. Data for each sample was firstcollected at 78 K and then warmed to room temperature, 298 K,for data collection at this temperature. Experiments at tempera-tures higher than 298 K (complex 3 only) were performed in airoutside the cryostat using the same vertical geometry. In this case
Fig. 3. Crystal structure of 1 at 100 K. Solvent molecules are not
Fig. 4. The synthesis of 1,1,1-tris(5-m
the Mössbauer drive system with the sample a centimeter belowthe source was hung above the proportional counter detector.The sample was heated in air by a heater wire attached to the brassholder that in turn held the delrin sample holder. The sample plussource were allowed to reach thermal equilibrium before theexperiments were commenced. The temperature was controlledby a Lakeshore temperature controller (300 series).
3. Results
3.1. Synthesis and structures
3.1.1. The Fe(II) complex of tpe (1)Although the unsubstituted tpe ligand is known, the Fe(II) com-
plex has not been previously described in detail. When two equiv-alents of tpe are added to one equivalent of Fe(BF4)2�6H2O in THF,the rose-colored Fe(II) complex, [Fe(tpe)2]2+�2BF4
� (1) precipitatesalmost instantly. It is well-known that LS Fe(II) complexes of tpmligands are colored, typically violet, and HS complexes are color-less, thus the rose color of the solid complex immediately suggestsa LS electronic structure. 1H NMR spectra support this finding, asthe signals are sharp and not significantly shifted from theirexpected frequencies.
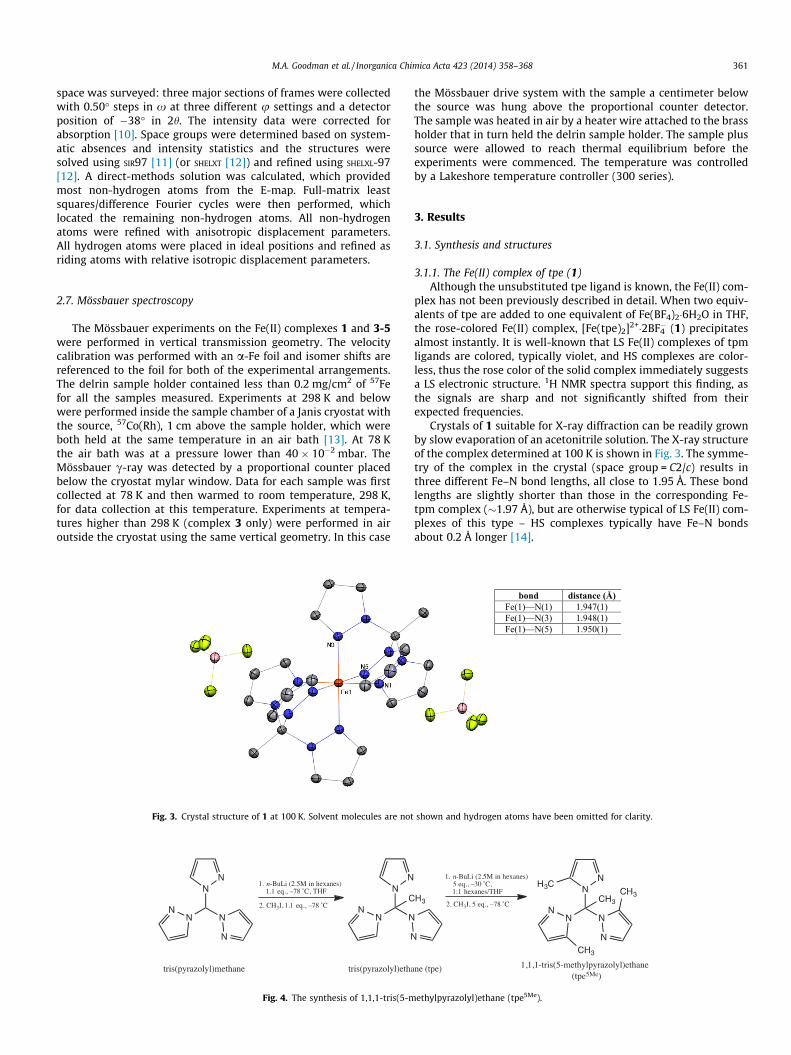
Crystals of 1 suitable for X-ray diffraction can be readily grownby slow evaporation of an acetonitrile solution. The X-ray structureof the complex determined at 100 K is shown in Fig. 3. The symme-try of the complex in the crystal (space group = C2/c) results inthree different Fe–N bond lengths, all close to 1.95 Å. These bondlengths are slightly shorter than those in the corresponding Fe-tpm complex (�1.97 Å), but are otherwise typical of LS Fe(II) com-plexes of this type – HS complexes typically have Fe–N bondsabout 0.2 Å longer [14].
bond distance (Å) Fe(1)—N(1) 1.947(1) Fe(1)—N(3) 1.948(1) Fe(1)—N(5) 1.950(1)
shown and hydrogen atoms have been omitted for clarity.
ethylpyrazolyl)ethane (tpe5Me).
362 M.A. Goodman et al. / Inorganica Chimica Acta 423 (2014) 358–368
3.1.2. 1,1,1-tris(5-methylpyrazolyl)ethane (tpe5Me) and its Fe(II)complex (5)
In a previous study [5a], Reger surmised that substituents onthe 5-position of the pyrazole rings of tpm ligands render thedeprotonated methine carbon unreactive towards electrophiles,other than a proton, due to steric hindrance. Our attempts at directmethylation of the methine carbon of the previously reportedtris(5-methylpyrazolyl)methane [8] support that conclusion, asdo the studies of Breher on the anion of tris(3,5-dimethylpyrazol-yl)methane [15]. Therefore, an alternative synthetic approach toligand 5 had to be devised, wherein the order of the methylationsteps was simply reversed. Methylation of the methine carbon ofthe unsubstituted tris(pyrazolyl)methane was carried out first toproduce tpe, followed by methylation in the three 5-positions toafford 1,1,1-tris(5-methylpyrazolyl)ethane (tpe5Me) (Fig. 4).
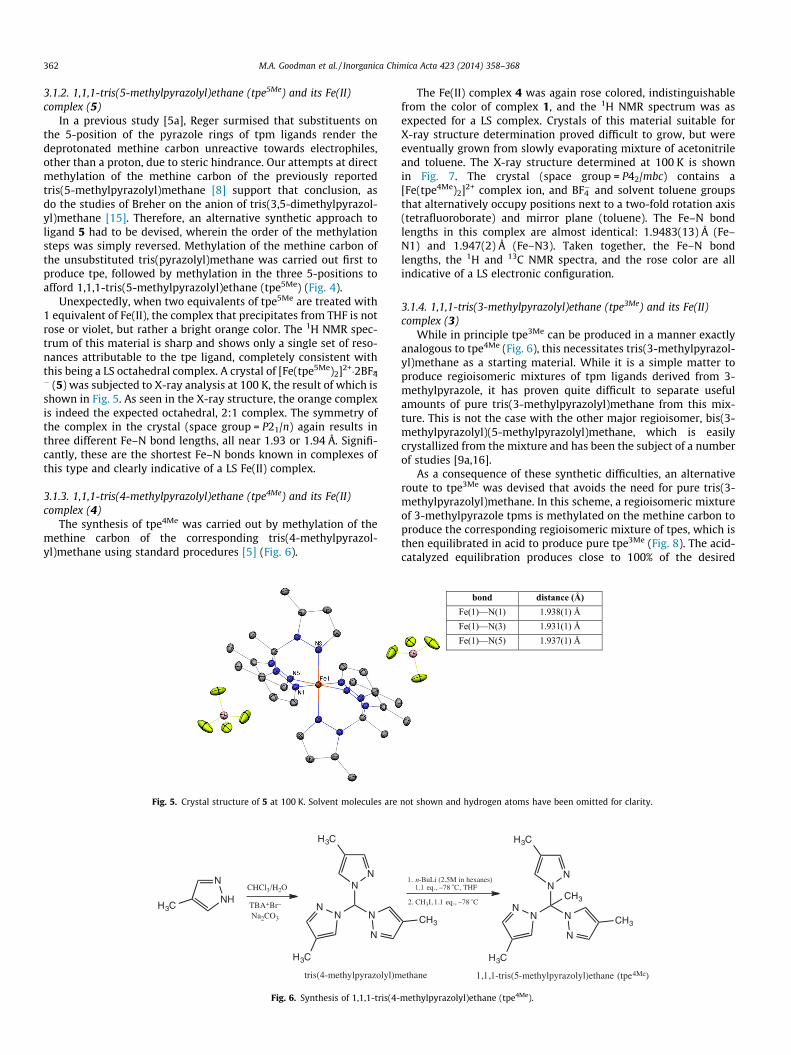
Unexpectedly, when two equivalents of tpe5Me are treated with1 equivalent of Fe(II), the complex that precipitates from THF is notrose or violet, but rather a bright orange color. The 1H NMR spec-trum of this material is sharp and shows only a single set of reso-nances attributable to the tpe ligand, completely consistent withthis being a LS octahedral complex. A crystal of [Fe(tpe5Me)2]2+�2BF4-� (5) was subjected to X-ray analysis at 100 K, the result of which isshown in Fig. 5. As seen in the X-ray structure, the orange complexis indeed the expected octahedral, 2:1 complex. The symmetry ofthe complex in the crystal (space group = P21/n) again results inthree different Fe–N bond lengths, all near 1.93 or 1.94 Å. Signifi-cantly, these are the shortest Fe–N bonds known in complexes ofthis type and clearly indicative of a LS Fe(II) complex.
3.1.3. 1,1,1-tris(4-methylpyrazolyl)ethane (tpe4Me) and its Fe(II)complex (4)
The synthesis of tpe4Me was carried out by methylation of themethine carbon of the corresponding tris(4-methylpyrazol-yl)methane using standard procedures [5] (Fig. 6).
bond distance (Å) Fe(1)—N(1) 1.938(1) Å Fe(1)—N(3) 1.931(1) Å Fe(1)—N(5) 1.937(1) Å
Fig. 5. Crystal structure of 5 at 100 K. Solvent molecules are not shown and hydrogen atoms have been omitted for clarity.
Fig. 6. Synthesis of 1,1,1-tris(4-methylpyrazolyl)ethane (tpe4Me).
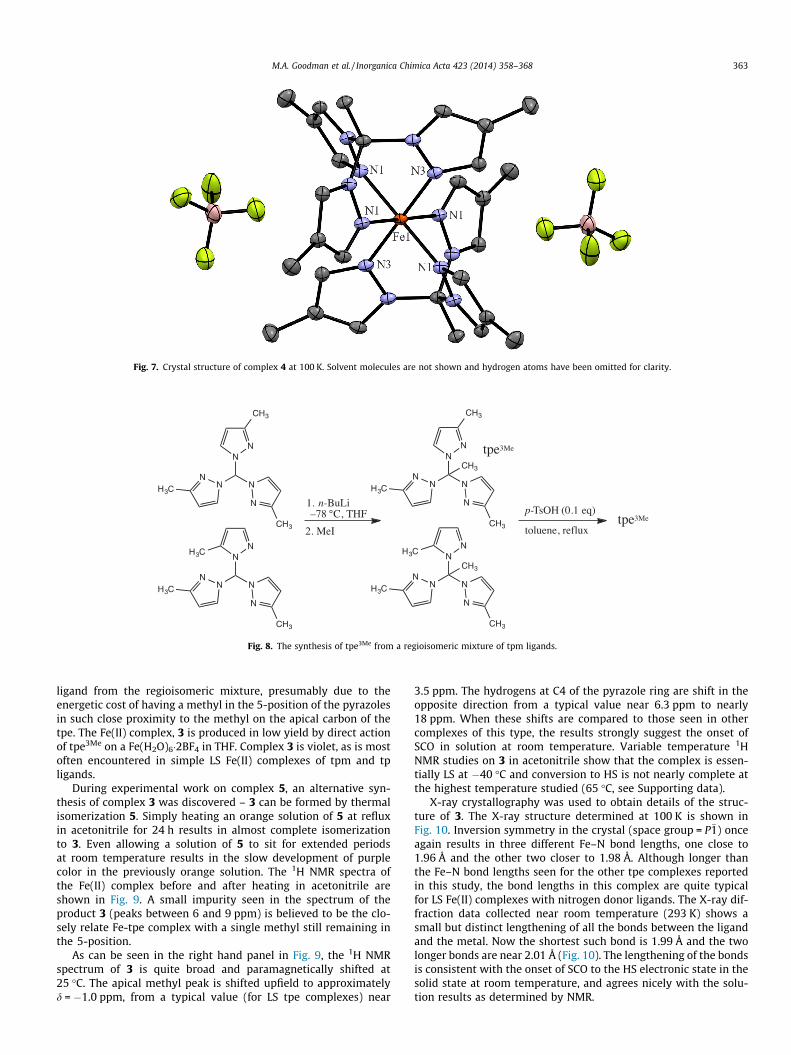
The Fe(II) complex 4 was again rose colored, indistinguishablefrom the color of complex 1, and the 1H NMR spectrum was asexpected for a LS complex. Crystals of this material suitable forX-ray structure determination proved difficult to grow, but wereeventually grown from slowly evaporating mixture of acetonitrileand toluene. The X-ray structure determined at 100 K is shownin Fig. 7. The crystal (space group = P42/mbc) contains a[Fe(tpe4Me)2]2+ complex ion, and BF4
� and solvent toluene groupsthat alternatively occupy positions next to a two-fold rotation axis(tetrafluoroborate) and mirror plane (toluene). The Fe–N bondlengths in this complex are almost identical: 1.9483(13) Å (Fe–N1) and 1.947(2) Å (Fe–N3). Taken together, the Fe–N bondlengths, the 1H and 13C NMR spectra, and the rose color are allindicative of a LS electronic configuration.
3.1.4. 1,1,1-tris(3-methylpyrazolyl)ethane (tpe3Me) and its Fe(II)complex (3)
While in principle tpe3Me can be produced in a manner exactlyanalogous to tpe4Me (Fig. 6), this necessitates tris(3-methylpyrazol-yl)methane as a starting material. While it is a simple matter toproduce regioisomeric mixtures of tpm ligands derived from 3-methylpyrazole, it has proven quite difficult to separate usefulamounts of pure tris(3-methylpyrazolyl)methane from this mix-ture. This is not the case with the other major regioisomer, bis(3-methylpyrazolyl)(5-methylpyrazolyl)methane, which is easilycrystallized from the mixture and has been the subject of a numberof studies [9a,16].
As a consequence of these synthetic difficulties, an alternativeroute to tpe3Me was devised that avoids the need for pure tris(3-methylpyrazolyl)methane. In this scheme, a regioisomeric mixtureof 3-methylpyrazole tpms is methylated on the methine carbon toproduce the corresponding regioisomeric mixture of tpes, which isthen equilibrated in acid to produce pure tpe3Me (Fig. 8). The acid-catalyzed equilibration produces close to 100% of the desired
Fig. 7. Crystal structure of complex 4 at 100 K. Solvent molecules are not shown and hydrogen atoms have been omitted for clarity.
Fig. 8. The synthesis of tpe3Me from a regioisomeric mixture of tpm ligands.
M.A. Goodman et al. / Inorganica Chimica Acta 423 (2014) 358–368 363
ligand from the regioisomeric mixture, presumably due to theenergetic cost of having a methyl in the 5-position of the pyrazolesin such close proximity to the methyl on the apical carbon of thetpe. The Fe(II) complex, 3 is produced in low yield by direct actionof tpe3Me on a Fe(H2O)6�2BF4 in THF. Complex 3 is violet, as is mostoften encountered in simple LS Fe(II) complexes of tpm and tpligands.
During experimental work on complex 5, an alternative syn-thesis of complex 3 was discovered – 3 can be formed by thermalisomerization 5. Simply heating an orange solution of 5 at refluxin acetonitrile for 24 h results in almost complete isomerizationto 3. Even allowing a solution of 5 to sit for extended periodsat room temperature results in the slow development of purplecolor in the previously orange solution. The 1H NMR spectra ofthe Fe(II) complex before and after heating in acetonitrile areshown in Fig. 9. A small impurity seen in the spectrum of theproduct 3 (peaks between 6 and 9 ppm) is believed to be the clo-sely relate Fe-tpe complex with a single methyl still remaining inthe 5-position.
As can be seen in the right hand panel in Fig. 9, the 1H NMRspectrum of 3 is quite broad and paramagnetically shifted at25 �C. The apical methyl peak is shifted upfield to approximatelyd = �1.0 ppm, from a typical value (for LS tpe complexes) near
3.5 ppm. The hydrogens at C4 of the pyrazole ring are shift in theopposite direction from a typical value near 6.3 ppm to nearly18 ppm. When these shifts are compared to those seen in othercomplexes of this type, the results strongly suggest the onset ofSCO in solution at room temperature. Variable temperature 1HNMR studies on 3 in acetonitrile show that the complex is essen-tially LS at �40 �C and conversion to HS is not nearly complete atthe highest temperature studied (65 �C, see Supporting data).
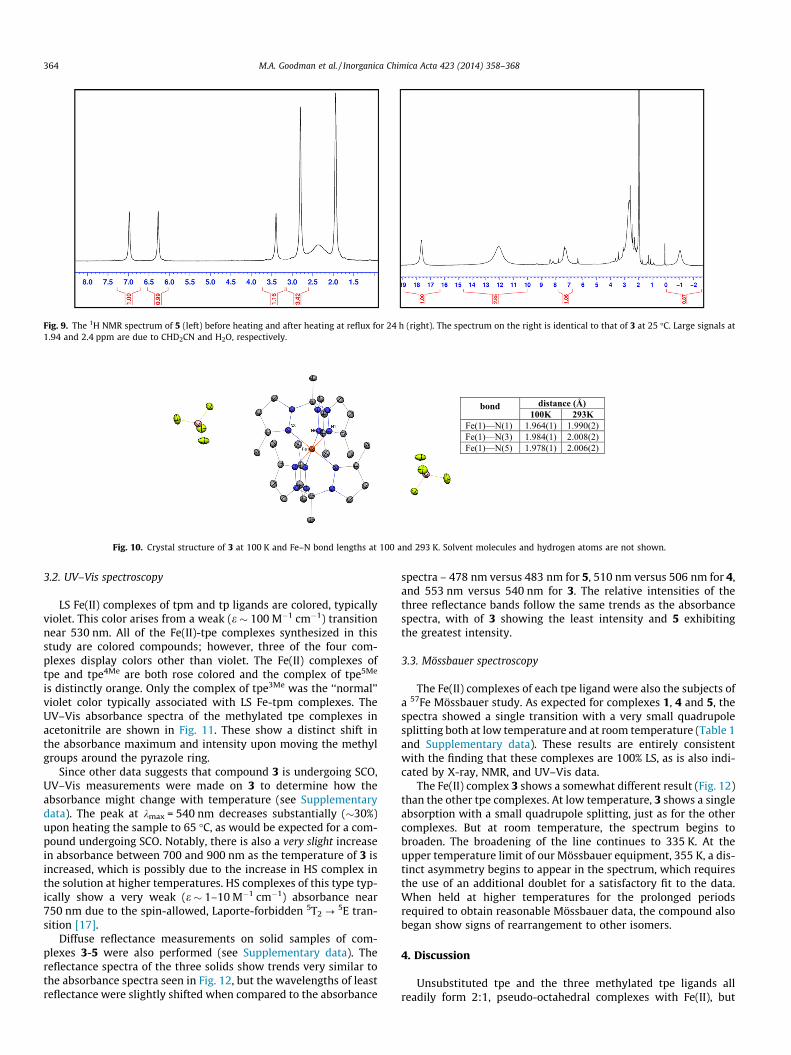
X-ray crystallography was used to obtain details of the struc-ture of 3. The X-ray structure determined at 100 K is shown inFig. 10. Inversion symmetry in the crystal (space group = P�1) onceagain results in three different Fe–N bond lengths, one close to1.96 Å and the other two closer to 1.98 Å. Although longer thanthe Fe–N bond lengths seen for the other tpe complexes reportedin this study, the bond lengths in this complex are quite typicalfor LS Fe(II) complexes with nitrogen donor ligands. The X-ray dif-fraction data collected near room temperature (293 K) shows asmall but distinct lengthening of all the bonds between the ligandand the metal. Now the shortest such bond is 1.99 Å and the twolonger bonds are near 2.01 Å (Fig. 10). The lengthening of the bondsis consistent with the onset of SCO to the HS electronic state in thesolid state at room temperature, and agrees nicely with the solu-tion results as determined by NMR.
Fig. 9. The 1H NMR spectrum of 5 (left) before heating and after heating at reflux for 24 h (right). The spectrum on the right is identical to that of 3 at 25 �C. Large signals at1.94 and 2.4 ppm are due to CHD2CN and H2O, respectively.
Fig. 10. Crystal structure of 3 at 100 K and Fe–N bond lengths at 100 and 293 K. Solvent molecules and hydrogen atoms are not shown.
364 M.A. Goodman et al. / Inorganica Chimica Acta 423 (2014) 358–368
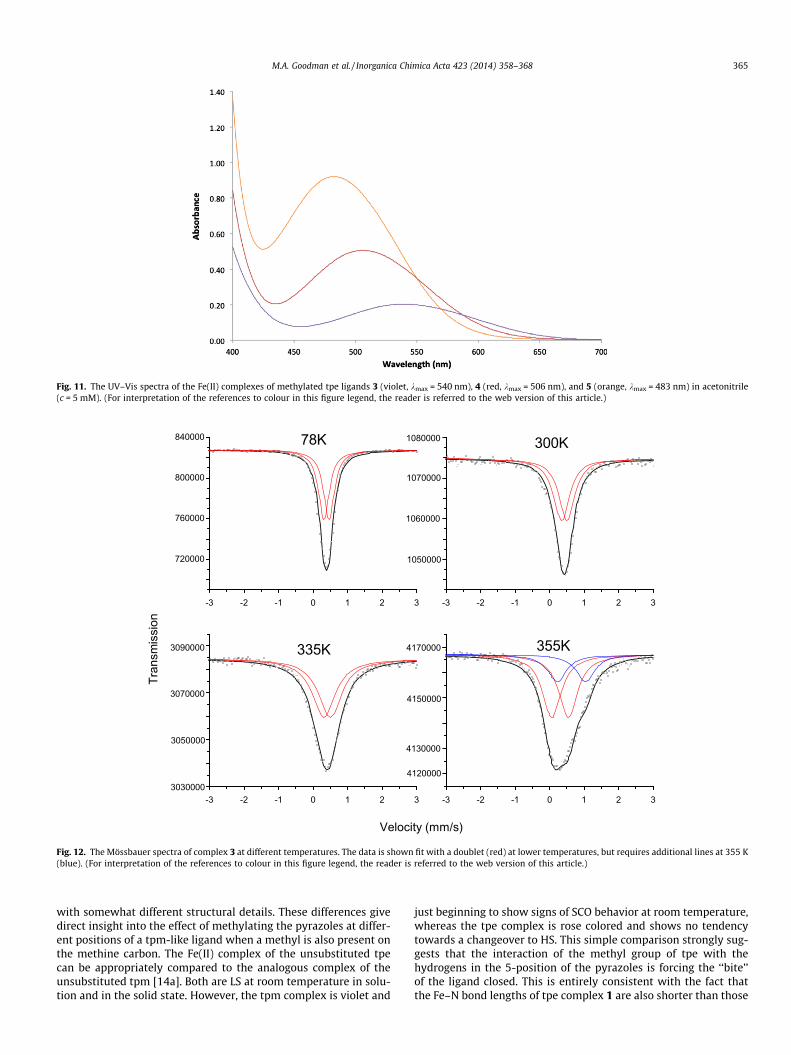
3.2. UV–Vis spectroscopy
LS Fe(II) complexes of tpm and tp ligands are colored, typicallyviolet. This color arises from a weak (e � 100 M�1 cm�1) transitionnear 530 nm. All of the Fe(II)-tpe complexes synthesized in thisstudy are colored compounds; however, three of the four com-plexes display colors other than violet. The Fe(II) complexes oftpe and tpe4Me are both rose colored and the complex of tpe5Me
is distinctly orange. Only the complex of tpe3Me was the ‘‘normal’’violet color typically associated with LS Fe-tpm complexes. TheUV–Vis absorbance spectra of the methylated tpe complexes inacetonitrile are shown in Fig. 11. These show a distinct shift inthe absorbance maximum and intensity upon moving the methylgroups around the pyrazole ring.
Since other data suggests that compound 3 is undergoing SCO,UV–Vis measurements were made on 3 to determine how theabsorbance might change with temperature (see Supplementarydata). The peak at kmax = 540 nm decreases substantially (�30%)upon heating the sample to 65 �C, as would be expected for a com-pound undergoing SCO. Notably, there is also a very slight increasein absorbance between 700 and 900 nm as the temperature of 3 isincreased, which is possibly due to the increase in HS complex inthe solution at higher temperatures. HS complexes of this type typ-ically show a very weak (e � 1–10 M�1 cm�1) absorbance near750 nm due to the spin-allowed, Laporte-forbidden 5T2 ?
5E tran-sition [17].
Diffuse reflectance measurements on solid samples of com-plexes 3-5 were also performed (see Supplementary data). Thereflectance spectra of the three solids show trends very similar tothe absorbance spectra seen in Fig. 12, but the wavelengths of leastreflectance were slightly shifted when compared to the absorbance
spectra – 478 nm versus 483 nm for 5, 510 nm versus 506 nm for 4,and 553 nm versus 540 nm for 3. The relative intensities of thethree reflectance bands follow the same trends as the absorbancespectra, with of 3 showing the least intensity and 5 exhibitingthe greatest intensity.
3.3. Mössbauer spectroscopy
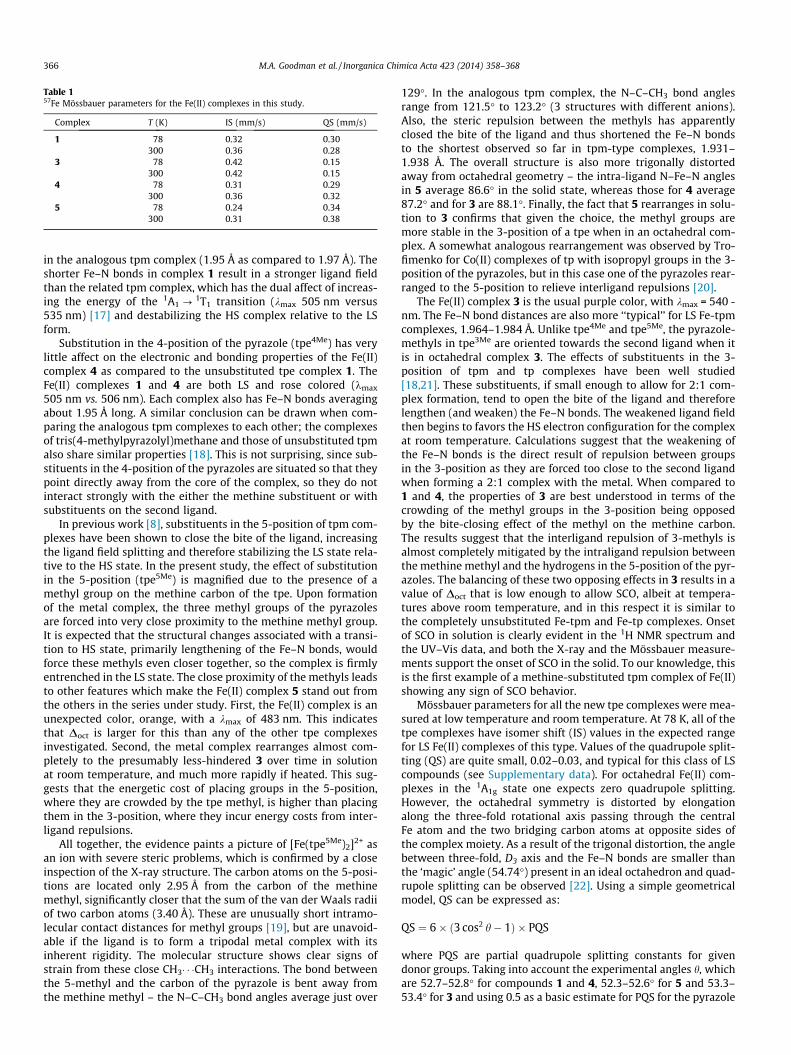
The Fe(II) complexes of each tpe ligand were also the subjects ofa 57Fe Mössbauer study. As expected for complexes 1, 4 and 5, thespectra showed a single transition with a very small quadrupolesplitting both at low temperature and at room temperature (Table 1and Supplementary data). These results are entirely consistentwith the finding that these complexes are 100% LS, as is also indi-cated by X-ray, NMR, and UV–Vis data.
The Fe(II) complex 3 shows a somewhat different result (Fig. 12)than the other tpe complexes. At low temperature, 3 shows a singleabsorption with a small quadrupole splitting, just as for the othercomplexes. But at room temperature, the spectrum begins tobroaden. The broadening of the line continues to 335 K. At theupper temperature limit of our Mössbauer equipment, 355 K, a dis-tinct asymmetry begins to appear in the spectrum, which requiresthe use of an additional doublet for a satisfactory fit to the data.When held at higher temperatures for the prolonged periodsrequired to obtain reasonable Mössbauer data, the compound alsobegan show signs of rearrangement to other isomers.
4. Discussion
Unsubstituted tpe and the three methylated tpe ligands allreadily form 2:1, pseudo-octahedral complexes with Fe(II), but
Fig. 11. The UV–Vis spectra of the Fe(II) complexes of methylated tpe ligands 3 (violet, kmax = 540 nm), 4 (red, kmax = 506 nm), and 5 (orange, kmax = 483 nm) in acetonitrile(c = 5 mM). (For interpretation of the references to colour in this figure legend, the reader is referred to the web version of this article.)
-3 -2 -1 0 1 2 3 -3 -2 -1 0 1 2 3
-3 -2 -1 0 1 2 3 -3 -2 -1 0 1 2 3
720000
760000
800000
840000 78K
1050000
1060000
4170000
300K
1070000
1080000
335K 355K
Velocity (mm/s)
Tran
smis
sion
4150000
4130000
4120000
3050000
3030000
3070000
3090000
Fig. 12. The Mössbauer spectra of complex 3 at different temperatures. The data is shown fit with a doublet (red) at lower temperatures, but requires additional lines at 355 K(blue). (For interpretation of the references to colour in this figure legend, the reader is referred to the web version of this article.)
M.A. Goodman et al. / Inorganica Chimica Acta 423 (2014) 358–368 365
with somewhat different structural details. These differences givedirect insight into the effect of methylating the pyrazoles at differ-ent positions of a tpm-like ligand when a methyl is also present onthe methine carbon. The Fe(II) complex of the unsubstituted tpecan be appropriately compared to the analogous complex of theunsubstituted tpm [14a]. Both are LS at room temperature in solu-tion and in the solid state. However, the tpm complex is violet and
just beginning to show signs of SCO behavior at room temperature,whereas the tpe complex is rose colored and shows no tendencytowards a changeover to HS. This simple comparison strongly sug-gests that the interaction of the methyl group of tpe with thehydrogens in the 5-position of the pyrazoles is forcing the ‘‘bite’’of the ligand closed. This is entirely consistent with the fact thatthe Fe–N bond lengths of tpe complex 1 are also shorter than those
Table 157Fe Mössbauer parameters for the Fe(II) complexes in this study.
Complex T (K) IS (mm/s) QS (mm/s)
1 78 0.32 0.30300 0.36 0.28
3 78 0.42 0.15300 0.42 0.15
4 78 0.31 0.29300 0.36 0.32
5 78 0.24 0.34300 0.31 0.38
366 M.A. Goodman et al. / Inorganica Chimica Acta 423 (2014) 358–368
in the analogous tpm complex (1.95 Å as compared to 1.97 Å). Theshorter Fe–N bonds in complex 1 result in a stronger ligand fieldthan the related tpm complex, which has the dual affect of increas-ing the energy of the 1A1 ? 1T1 transition (kmax 505 nm versus535 nm) [17] and destabilizing the HS complex relative to the LSform.
Substitution in the 4-position of the pyrazole (tpe4Me) has verylittle affect on the electronic and bonding properties of the Fe(II)complex 4 as compared to the unsubstituted tpe complex 1. TheFe(II) complexes 1 and 4 are both LS and rose colored (kmax
505 nm vs. 506 nm). Each complex also has Fe–N bonds averagingabout 1.95 Å long. A similar conclusion can be drawn when com-paring the analogous tpm complexes to each other; the complexesof tris(4-methylpyrazolyl)methane and those of unsubstituted tpmalso share similar properties [18]. This is not surprising, since sub-stituents in the 4-position of the pyrazoles are situated so that theypoint directly away from the core of the complex, so they do notinteract strongly with the either the methine substituent or withsubstituents on the second ligand.
In previous work [8], substituents in the 5-position of tpm com-plexes have been shown to close the bite of the ligand, increasingthe ligand field splitting and therefore stabilizing the LS state rela-tive to the HS state. In the present study, the effect of substitutionin the 5-position (tpe5Me) is magnified due to the presence of amethyl group on the methine carbon of the tpe. Upon formationof the metal complex, the three methyl groups of the pyrazolesare forced into very close proximity to the methine methyl group.It is expected that the structural changes associated with a transi-tion to HS state, primarily lengthening of the Fe–N bonds, wouldforce these methyls even closer together, so the complex is firmlyentrenched in the LS state. The close proximity of the methyls leadsto other features which make the Fe(II) complex 5 stand out fromthe others in the series under study. First, the Fe(II) complex is anunexpected color, orange, with a kmax of 483 nm. This indicatesthat Doct is larger for this than any of the other tpe complexesinvestigated. Second, the metal complex rearranges almost com-pletely to the presumably less-hindered 3 over time in solutionat room temperature, and much more rapidly if heated. This sug-gests that the energetic cost of placing groups in the 5-position,where they are crowded by the tpe methyl, is higher than placingthem in the 3-position, where they incur energy costs from inter-ligand repulsions.
All together, the evidence paints a picture of [Fe(tpe5Me)2]2+ asan ion with severe steric problems, which is confirmed by a closeinspection of the X-ray structure. The carbon atoms on the 5-posi-tions are located only 2.95 Å from the carbon of the methinemethyl, significantly closer that the sum of the van der Waals radiiof two carbon atoms (3.40 Å). These are unusually short intramo-lecular contact distances for methyl groups [19], but are unavoid-able if the ligand is to form a tripodal metal complex with itsinherent rigidity. The molecular structure shows clear signs ofstrain from these close CH3� � �CH3 interactions. The bond betweenthe 5-methyl and the carbon of the pyrazole is bent away fromthe methine methyl – the N–C–CH3 bond angles average just over
129�. In the analogous tpm complex, the N–C–CH3 bond anglesrange from 121.5� to 123.2� (3 structures with different anions).Also, the steric repulsion between the methyls has apparentlyclosed the bite of the ligand and thus shortened the Fe–N bondsto the shortest observed so far in tpm-type complexes, 1.931–1.938 Å. The overall structure is also more trigonally distortedaway from octahedral geometry – the intra-ligand N–Fe–N anglesin 5 average 86.6� in the solid state, whereas those for 4 average87.2� and for 3 are 88.1�. Finally, the fact that 5 rearranges in solu-tion to 3 confirms that given the choice, the methyl groups aremore stable in the 3-position of a tpe when in an octahedral com-plex. A somewhat analogous rearrangement was observed by Tro-fimenko for Co(II) complexes of tp with isopropyl groups in the 3-position of the pyrazoles, but in this case one of the pyrazoles rear-ranged to the 5-position to relieve interligand repulsions [20].
The Fe(II) complex 3 is the usual purple color, with kmax = 540 -nm. The Fe–N bond distances are also more ‘‘typical’’ for LS Fe-tpmcomplexes, 1.964–1.984 Å. Unlike tpe4Me and tpe5Me, the pyrazole-methyls in tpe3Me are oriented towards the second ligand when itis in octahedral complex 3. The effects of substituents in the 3-position of tpm and tp complexes have been well studied[18,21]. These substituents, if small enough to allow for 2:1 com-plex formation, tend to open the bite of the ligand and thereforelengthen (and weaken) the Fe–N bonds. The weakened ligand fieldthen begins to favors the HS electron configuration for the complexat room temperature. Calculations suggest that the weakening ofthe Fe–N bonds is the direct result of repulsion between groupsin the 3-position as they are forced too close to the second ligandwhen forming a 2:1 complex with the metal. When compared to1 and 4, the properties of 3 are best understood in terms of thecrowding of the methyl groups in the 3-position being opposedby the bite-closing effect of the methyl on the methine carbon.The results suggest that the interligand repulsion of 3-methyls isalmost completely mitigated by the intraligand repulsion betweenthe methine methyl and the hydrogens in the 5-position of the pyr-azoles. The balancing of these two opposing effects in 3 results in avalue of Doct that is low enough to allow SCO, albeit at tempera-tures above room temperature, and in this respect it is similar tothe completely unsubstituted Fe-tpm and Fe-tp complexes. Onsetof SCO in solution is clearly evident in the 1H NMR spectrum andthe UV–Vis data, and both the X-ray and the Mössbauer measure-ments support the onset of SCO in the solid. To our knowledge, thisis the first example of a methine-substituted tpm complex of Fe(II)showing any sign of SCO behavior.
Mössbauer parameters for all the new tpe complexes were mea-sured at low temperature and room temperature. At 78 K, all of thetpe complexes have isomer shift (IS) values in the expected rangefor LS Fe(II) complexes of this type. Values of the quadrupole split-ting (QS) are quite small, 0.02–0.03, and typical for this class of LScompounds (see Supplementary data). For octahedral Fe(II) com-plexes in the 1A1g state one expects zero quadrupole splitting.However, the octahedral symmetry is distorted by elongationalong the three-fold rotational axis passing through the centralFe atom and the two bridging carbon atoms at opposite sides ofthe complex moiety. As a result of the trigonal distortion, the anglebetween three-fold, D3 axis and the Fe–N bonds are smaller thanthe ‘magic’ angle (54.74�) present in an ideal octahedron and quad-rupole splitting can be observed [22]. Using a simple geometricalmodel, QS can be expressed as:
QS ¼ 6� ð3 cos2 h� 1Þ � PQS
where PQS are partial quadrupole splitting constants for givendonor groups. Taking into account the experimental angles h, whichare 52.7–52.8� for compounds 1 and 4, 52.3–52.6� for 5 and 53.3–53.4� for 3 and using 0.5 as a basic estimate for PQS for the pyrazole
M.A. Goodman et al. / Inorganica Chimica Acta 423 (2014) 358–368 367
donors in the tpe ligands (values for various ligands with aromaticN-donor atoms vary from 0.4 to 0.6 [22b]), QS can be estimated tobe 0.27 for 1 and 4, 0.32 for 5 and 0.19 for 3. These values are in rea-sonable qualitative agreement with the experimental data (seeSupplementary).
Both the IS and QS values of 1, 4, and 5 undergo only smallchanges with temperature from 78 to 300 K, and the peak widthsalso change only slightly. In contrast, complex 3 displays differentbehavior. In this case, while the 78 K spectrum is similar to theother tpe complexes, a slight but noticeable broadening occursby 300 K. The broadening of the line continues as the temperatureis raised to 335 K. At the highest temperature investigated, 355 K,the spectrum of 3 becomes distinctly asymmetric with a slightshoulder beginning to appear near an IS of 1.0 mm/s. The onsetof broadening in the Mossbauer spectrum of 3 at 300 K corre-sponds with lengthening of the Fe–N bonds in the X-ray structureand the broadening and shifting of 1H NMR signals in solution,which suggests that this effect is due to the onset of SCO. Similarfeatures in the Mössbauer spectra of [Fe(tpm)2](BF4)2 and[Fe(tpm)2](PF6)2 have been interpreted as the result of a dynamicLS/HS spin-equilibrium occurring on the timescale of theMössbauer measurement [14a,23]. The lack of a clearly distinctset of new lines with a much larger splitting as the temperatureis raised, which might be expected for the HS form of 3, is thereforedue to the low activation energy and rapid rate of the spin equilib-rium being observed. While it is not possible to quantitate the SCOprocess using the data we obtained, qualitatively the result dem-onstrates that complex 3 is undergoing SCO in the solid state atroom temperature.
The Fe(II)-tpe complexes all display a weak, spin-allowed (butLaporte-forbidden) d–d transition in the visible spectrum, whichis the origin of their various colors [17]. Two similar transitionsare expected for LS octahedral d6 complexes, but only one is actu-ally observed in the present complexes. The observed transition isprobably the lower energy transition (1A1g ?
1T1g), with the unob-served higher energy transition (1A1?
1T2) likely obscured by aMLCT band near 330 nm. The absorbance spectra combined withthe Fe–N bond lengths of the various Fe-tpe complexes show thatthe location of the methyl group on the periphery of the pyrazoledirectly affects the strength of the ligand field on the metal andtherefore the transition energies between d orbitals of the iron.Moreover, the energy of this transition can give some insight intothe energy required for a given SCO transition in Fe-tris(pyrazolyl)complexes. As is evident from the Tanabe–Sugano diagram for d6
octahedral complexes, the energy difference between the 1A1
ground state (LS) and the 5T2 excited state (HS) increases more rap-idly than the energy of the 1A1 ? 1T1 transition as the ligand fieldstrength (Doct) is increased. Thus, it is reasonable to comment onthe likelihood of a SCO transition in a LS Fe-tpm complex simplyby measuring the UV–Vis spectrum of the complex, or even by justnoting its color. To date, only those complexes with kmax near530 nm, which are violet, have shown any tendency to undergo aspin transition. This value of kmax suggests that Doct is smallenough to also allow for the possibility of a thermal transitionbetween the 1A1 and the 5T2 state (SCO). Assuming that the RacahB parameters for all Fe-tpm and -tp complexes are relatively sim-ilar, those complexes that display spectroscopic transitions atwavelengths significantly below 530 nm and therefore appear roseor even orange colored, have little chance of having an observablespin transition up to room temperature, or even well above roomtemperature, as their ligand fields are simply too strong and theenergy differences between the LS and HS state is too great to beaccessed thermally. Solid-state spectra measured by diffuse reflec-tance can also be used to make this qualitative judgment.
Finally, it is noted that the strength of the visible absorptionband decreases noticeably on going from 3 (e = 40 cm�1 M�1)to 4
(e = 100 cm�1 M�1) to 5 (e = 200 cm�1 M�1). While some of theweakness in the measured [Fe(tpe3Me)2]2+ band can be attributedto the gradual changeover to HS that has already begun in solutionat room temperature, the NMR and X-ray evidence suggests thatSCO in 3 is only 10–20% complete at room temperature, which isclearly insufficient to account for the intensity of the band. SCOalso explains nothing in regards to the relative magnitude of thevisible band of complex 4 when compared to complex 5, sincethese are both 100% LS in solution at room temperature. The bestexplanation for the observed trend is therefore probably intensityborrowing [17], whereby Laporte-forbidden d–d bands are gener-ally more intense as their energy nears allowed transitions involv-ing orbitals with p-character (ungerade). In the present case, thereis a large (e � 7000 cm�1 M�1) MLCT band near 330–340 nm ineach LS tpe complex, the tail end of which is visible in Fig. 11,which provides the necessary conditions for this phenomenon.The closer the d–d transition is to the energy of this band, the morestrongly the bands are coupled and the more intense the d-d tran-sition becomes.
5. Conclusion
Four tris(pyrazolyl)ethane (tpe) ligands (tpe, tpe3Me, tpe4Me, andtpe5Me), differing only in placement of methyl groups on the pyra-zole rings have been successfully synthesized and characterized. Ineach case the 2:1 complex with Fe(II) was readily synthesized. Thecomplexes were all low spin, but differed in Fe–N bond lengths andcolor. Methyls in the 5-position of the tpe (tpe5Me) closed the biteof the ligand, strengthening the ligand field and shifting the visibleabsorbance band to higher energies. Methyls in the 4-position(tpe4Me) had almost no effect on the ligand, making it quite compa-rable to the unsubstituted tpe ligand. Methyls in the 3-position(tpe3Me) cause an opening of the bite of the ligand, which is evi-denced by increased Fe–N bond lengths and a shift of the visibleabsorbance to lower energies. This explains why the Fe(II) complexof tpe3Me is beginning to display spin crossover behavior near roomtemperature.
Acknowledgements
Financial support for this project was provided by FacultyResearch Council, D’Youville College. M.J.D. and S.E.T. gratefullyacknowledge the U.S. DOE Grant, No. DEFG02-03ER46064 for sup-port of their Mössbauer work. M.J.D. also appreciatively thanksProf. Gary Pettibone for his persistent commentary and critiques.M.S.G. thanks Prof. William S. Durfee for helpful discussionsrelated to the writing of portions of this manuscript.
Appendix A. Supplementary material
CCDC 1005976–1005980 contains the supplementary crystallo-graphic data for this paper. These data can be obtained free ofcharge from The Cambridge Crystallographic Data Centre viawww.ccdc.cam.ac.uk/data_request/cif. Supplementary data associ-ated with this article can be found, in the online version, at http://dx.doi.org/10.1016/j.ica.2014.08.046.
References
[1] (a) J.P. Jesson, S. Trofimenko, D.R. Eaton, J. Am. Chem. Soc. 89 (3148) (1967)1970, http://dx.doi.org/10.1021/ja00989a014;(b) S. Trofimenko, J. Am. Chem. Soc 92 (1970) 5118, http://dx.doi.org/10.1021/ja00720a021.
[2] (a) C. Santini, M. Pellei, G.G. Lobbia, G. Papini, Mini-Rev. Org. Chem. 7 (2)(2010) 84, http://dx.doi.org/10.2174/157019310791065519;(b) H.R. Bigmore, S.C. Lawrence, P. Mountford, C.S. Tredget, Dalton Trans. 4(2005) 635, http://dx.doi.org/10.1039/B413121E;
368 M.A. Goodman et al. / Inorganica Chimica Acta 423 (2014) 358–368
(c) S. Trofimenko, Scorpionates: The Coordination Chemistry ofPolypyrazolylborate Ligands, Imperial College Press, River Edge, NJ, 1999;(d) D.L. Reger, Comments Inorg. Chem. 21 (1–3) (1999) 1, http://dx.doi.org/10.1080/02603599908020413;(e) C. Pettinari, R. Pettinari, Coord. Chem. Rev. 249 (2005) 525, http://dx.doi.org/10.1016/j.ccr.2004.05.010;(f) C. Pettinari, Scorpionates II: Chelating Borate Ligands, Imperial CollegePress, London, 2008;(g) G.J. Long, F. Grandjean, D.L. Reger, in: P. Gütlich, H.A. Goodwin (Eds.), SpinCrossover in Transition Metal Compounds, Part I. Topics in Current Chemistry,vol. 233, Springer-Verlag, Berlin, 2004, p. 91, http://dx.doi.org/10.1007/b13530.
[3] (a) O. Kahn, C.J. Martinez, Science 279 (44) (1998) 1994, http://dx.doi.org/10.1126/science.279.5347.44;(b) P. Gutlich, A. Hauser, H. Spiering, Angew. Chem., Int. Ed. Engl. 33 (2003)2024, http://dx.doi.org/10.1002/anie.199420241.
[4] (a) J. Kröber, E. Codjovi, O. Kahn, F. Grolière, C. Jay, J. Am. Chem. Soc. 115 (9810)(1993) 1994, http://dx.doi.org/10.1021/ja00074a062;(b) J. Kröber, J.-P. Audière, E. Codjovi, O. Kahn, J.G. Haasnoot, F. Grolière, C. Jay,A. Bousseksou, J. Linarès, F. Varret, A. Gonthier-Vassal, Chem. Mater 6 (1994)1404, http://dx.doi.org/10.1021/cm00044a044;(c) Y. Garcia, P.J. van Koningsbruggen, R. Lapouyade, L. Fournès, L. Rabardel, O.Kahn, V. Ksenofontov, G. Levchenko, P. Gütlich, Chem. Mater. 10 (1998) 2426,http://dx.doi.org/10.1021/cm980107;(d) O. Roubeau, J.M. Alcazar Gomez, E. Balskus, J.J.A. Kolnaar, J.G. Haasnoot, J.Reedijk, J. New Chem. 25 (2001) 144, http://dx.doi.org/10.1039/B007094G.
[5] (a) D.L. Reger, T.C. Grattan, Synthesis 3 (350) (2003) 1989, http://dx.doi.org/10.1055/s-2003-37339;(b) M.A. Esteruelas, L.A. Oro, R.M. Claramunt, C. Lopez, J.L. Lavandera, J. Elguero,J. Organomet. Chem 366 (1989) 245, http://dx.doi.org/10.1016/0022-328X(89)87330-9;(c) A.R. Katritzky, A.E. Abdel-Rahman, D.E. Leahy, O.A. Schwarz, Tetrahedron 39(1983) 4133, http://dx.doi.org/10.1016/S0040-4020(01)88633-6;(d) E. Diez-Barra, A. de la Hoz, A. Sanchez-Migallon, J. Tejada, J. Chem. Soc.,Perkin Trans. 1 (1993) 1079, http://dx.doi.org/10.1039/P19930001079;(e) R. Wanke, P. Smolenski, M.F.C.G. da Silva, Inorg. Chem. 47 (2008) 10158,http://dx.doi.org/10.1021/ic801254b;(f) P.K. Byers, A.J. Canty, R.T. Honeyman, R.M. Claramunt, C. Lopez, J.L.Lavandera, J. Elguero, Gazz. Chim. Ital. 122 (1992) 344.
[6] I. Garcia-Orozco, R. Quijada, K. Vera, M. Valderrama, J. Mol. Catal. A: Chem. 260(1–2) (2006) 70, http://dx.doi.org/10.1016/j.molcata.2006.06.048.
[8] M.A. Goodman, A.Y. Nazarenko, B.J. Casavant, Z. Li, W.W. Brennessel, M.J.DeMarco, G. Long, M.S. Goodman, Inorg. Chem. 51 (2) (2012) 1084, http://dx.doi.org/10.1021/ic2022038.
[9] (a) C. Pettinari, M. Pellei, A. Cingolani, D. Martini, A. Drozdov, S. Troyanov, W.Panzeri, A. Mele, Inorg. Chem. 38 (5777) (1999) 2000, http://dx.doi.org/
[10] G.M. Sheldrick, SADABS, Version 2007/4, University of Göttingen, Göttingen,Germany, 2007.
[11] A. Altomare, M.C. Burla, M. Camalli, G.L. Cascarano, C. Giacovazzo, A.Guagliardi, A.G.G. Moliterni, G. Polidori, R. Spagna, SIR97: A New Program forSolving and Refining Crystal Structures, Istituto di Cristallografia, CNR, Bari,Italy, 1999.
[13] G. Long, M. DeMarco, M. Chudyk, J. Steiner, D. Coffey, H. Zeng, Y.K. Li, G.H. Cao,Z.A. Xu, Phys. Rev. B 84 (2011) 064423, http://dx.doi.org/10.1103/PhysRevB.84.064423.
[14] (a) D.L. Reger, C.A. Little, A.L. Rheingold, M. Lam, L.M. Liable-Sands, B. Rhagitan,T. Concolino, A. Mohan, G.J. Long, V. Briois, F. Grandjean, Inorg. Chem. 40(1508) (2001) 2001, http://dx.doi.org/10.1021/ic001102t;(b) V. Briois, P. Sainctavit, G.J. Long, F. Grandjean, Inorg. Chem 40 (2001) 912,http://dx.doi.org/10.1021/ic0007153.
[15] (a) M.G. Cushion, J. Meyer, A. Heath, A.D. Schwarz, I. Fern, F. Breher, P.Mountford, Organometallics 29 (1174) (2010) 2009, http://dx.doi.org/10.1021/om901013b;(b) I. Fernandez, P.O. Burgos, F. Armbruster, I. Krummenacher, F. Breher, Chem.Commun. 18 (2009) 2586, http://dx.doi.org/10.1039/b902053e;(c) H.R. Bigmore, J. Meter, I. Krummenacher, H. Ruegger, E. Clot, P. Mountford,F. Breher, Chem. Eur. J. 14 (19) (2008) 5918, http://dx.doi.org/10.1002/chem.200800181.
[16] (a) D. Martini, M. Pellei, C. Pettinari, B.W. Skelton, A.H. White, Inorg. Chim. Acta333 (72) (2002) 2009, http://dx.doi.org/10.1016/S0020-1693(02)00772-7;(b) D.L. Reger, J.D. Elgin, E.A. Foley, M.D. Smith, F. Grandjean, G. Long, J. Inorg.Chem. 48 (2009) 9393, http://dx.doi.org/10.1021/ic901259e.
[17] J.P. Jesson, S. Trofimenko, D.R. Eaton, J. Am. Chem. Soc. 89 (1967) 3158, http://dx.doi.org/10.1021/ja00989a015.
[18] H. Paulsen, L. Duelund, A. Zimmermann, F. Averseng, M. Gerdan, H. Winkler, H.Toftlund, A.X. Trautwein, Monatsh. Chem. 134 (2003) 295, http://dx.doi.org/10.1007/s00706-002-0522-7.
[19] R. Taylor, J. Chem. Inf. Model. 51 (2011) 897, http://dx.doi.org/10.1021/ci100466h.


![Pyrazole-oxadiazole Conjugates: Synthesis, …Pyrazole-oxadiazole Conjugates: Synthesis, Antiproliferative Activity and Inhibition of Tubulin Polymerization Ahmed Kamal, *[a,d] Anver](https://static.documents.pub/doc/80x56/5e8c65afba3d737ddc66773e/pyrazole-oxadiazole-conjugates-synthesis-pyrazole-oxadiazole-conjugates-synthesis.jpg)


![Inorganica Chimica Acta - iris.unina.it · Inorganica Chimica Acta 453 (2016) 330–338 Contents lists available at ScienceDirect Inorganica Chimica Acta ... [10,11]. In addition,](https://static.documents.pub/doc/80x56/5c65ec8509d3f230488b5a47/inorganica-chimica-acta-irisuninait-inorganica-chimica-acta-453-2016-330338.jpg)