28
Corporate Presentation November 2019 TSX : IPO OTCQX : IPOOF

Corporate Presentation
November 2019
TSX : IPO
OTCQX : IPOOF
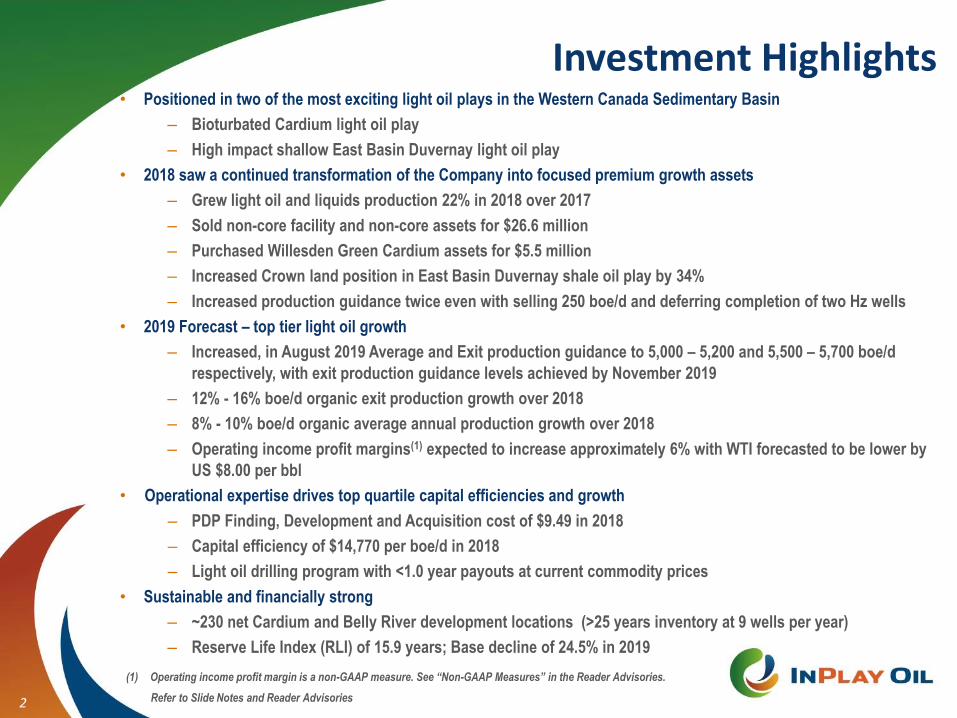
Investment Highlights• Positioned in two of the most exciting light oil plays in the Western Canada Sedimentary Basin
– Bioturbated Cardium light oil play
– High impact shallow East Basin Duvernay light oil play
• 2018 saw a continued transformation of the Company into focused premium growth assets
– Grew light oil and liquids production 22% in 2018 over 2017
– Sold non-core facility and non-core assets for $26.6 million
– Purchased Willesden Green Cardium assets for $5.5 million
– Increased Crown land position in East Basin Duvernay shale oil play by 34%
– Increased production guidance twice even with selling 250 boe/d and deferring completion of two Hz wells
• 2019 Forecast – top tier light oil growth
– Increased, in August 2019 Average and Exit production guidance to 5,000 – 5,200 and 5,500 – 5,700 boe/d
respectively, with exit production guidance levels achieved by November 2019
– 12% - 16% boe/d organic exit production growth over 2018
– 8% - 10% boe/d organic average annual production growth over 2018
– Operating income profit margins(1) expected to increase approximately 6% with WTI forecasted to be lower by
US $8.00 per bbl
• Operational expertise drives top quartile capital efficiencies and growth
– PDP Finding, Development and Acquisition cost of $9.49 in 2018
– Capital efficiency of $14,770 per boe/d in 2018
– Light oil drilling program with <1.0 year payouts at current commodity prices
• Sustainable and financially strong
– ~230 net Cardium and Belly River development locations (>25 years inventory at 9 wells per year)
– Reserve Life Index (RLI) of 15.9 years; Base decline of 24.5% in 2019
2 Refer to Slide Notes and Reader Advisories
(1) Operating income profit margin is a non-GAAP measure. See “Non-GAAP Measures” in the Reader Advisories.
Financial Highlights
3
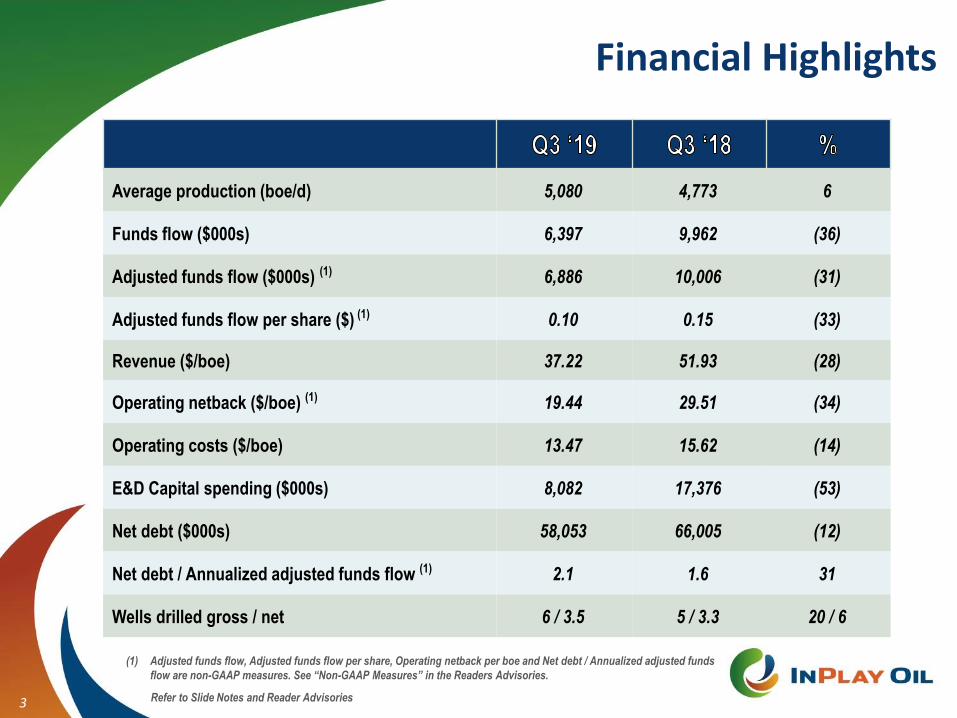
Average production (boe/d) 5,080 4,773 6
Funds flow ($000s) 6,397 9,962 (36)
Adjusted funds flow ($000s) (1) 6,886 10,006 (31)
Adjusted funds flow per share ($) (1) 0.10 0.15 (33)
Revenue ($/boe) 37.22 51.93 (28)
Operating netback ($/boe) (1) 19.44 29.51 (34)
Operating costs ($/boe) 13.47 15.62 (14)
E&D Capital spending ($000s) 8,082 17,376 (53)
Net debt ($000s) 58,053 66,005 (12)
Net debt / Annualized adjusted funds flow (1) 2.1 1.6 31
Wells drilled gross / net 6 / 3.5 5 / 3.3 20 / 6
Refer to Slide Notes and Reader Advisories
(1) Adjusted funds flow, Adjusted funds flow per share, Operating netback per boe and Net debt / Annualized adjusted funds
flow are non-GAAP measures. See “Non-GAAP Measures” in the Readers Advisories.
Corporate Overview
4
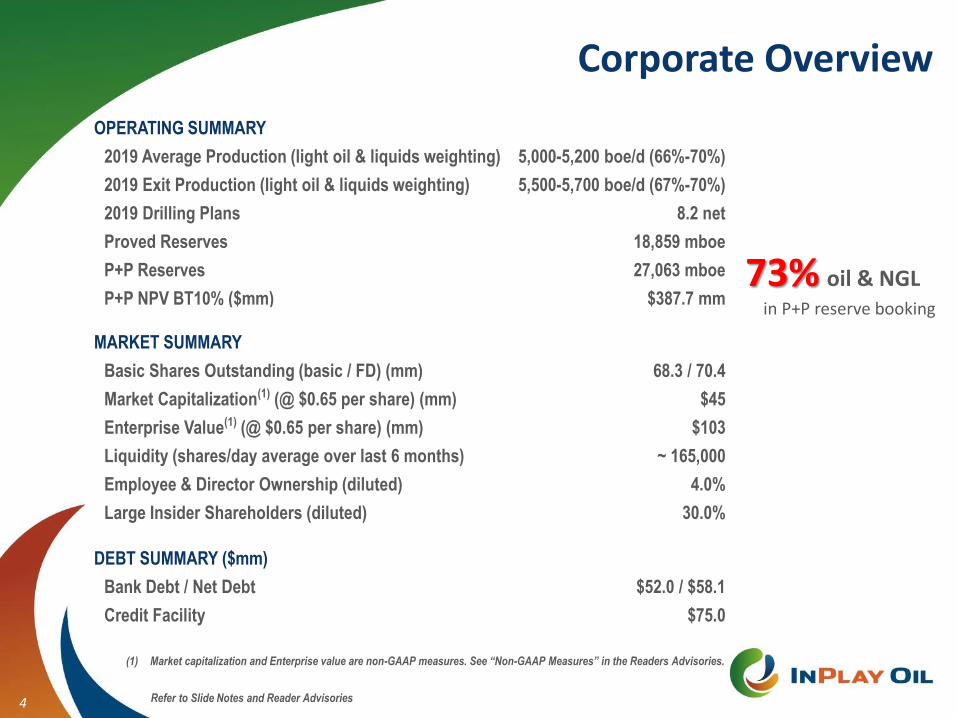
OPERATING SUMMARY
2019 Average Production (light oil & liquids weighting) 5,000-5,200 boe/d (66%-70%)
2019 Exit Production (light oil & liquids weighting) 5,500-5,700 boe/d (67%-70%)
2019 Drilling Plans 8.2 net
Proved Reserves 18,859 mboe
P+P Reserves 27,063 mboe
P+P NPV BT10% ($mm) $387.7 mm73% oil & NGL
in P+P reserve booking
MARKET SUMMARY
Basic Shares Outstanding (basic / FD) (mm) 68.3 / 70.4
Market Capitalization(1) (@ $0.65 per share) (mm) $45
Enterprise Value(1) (@ $0.65 per share) (mm) $103
Liquidity (shares/day average over last 6 months) ~ 165,000
Employee & Director Ownership (diluted) 4.0%
Large Insider Shareholders (diluted) 30.0%
DEBT SUMMARY ($mm)
Bank Debt / Net Debt $52.0 / $58.1
Credit Facility $75.0
Refer to Slide Notes and Reader Advisories
(1) Market capitalization and Enterprise value are non-GAAP measures. See “Non-GAAP Measures” in the Readers Advisories.
2018 Year End Reserves & EfficiencyHighlights
5
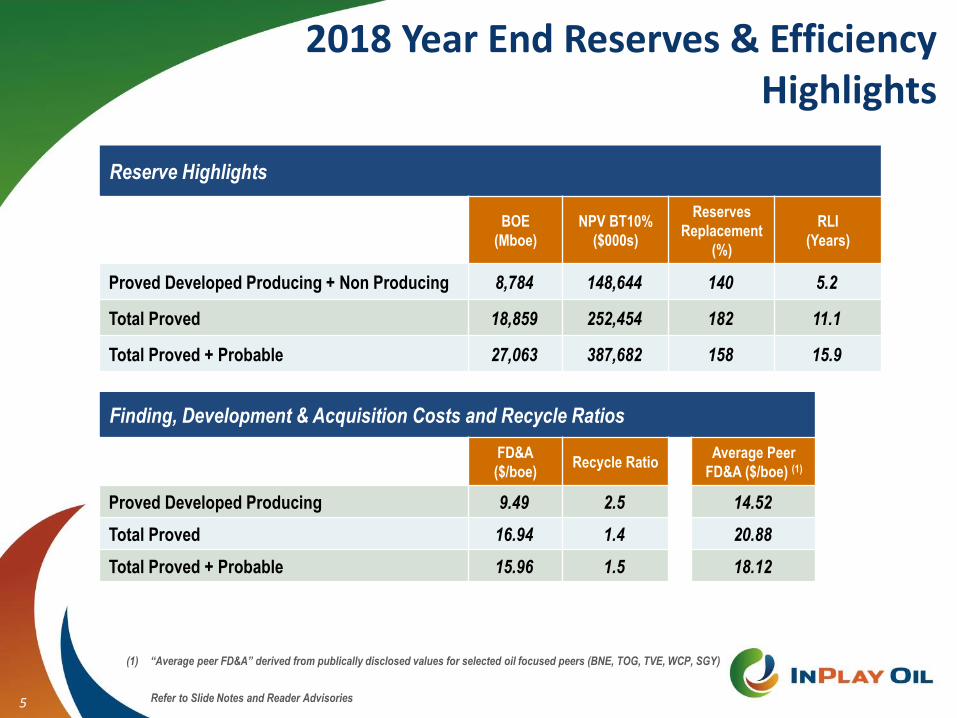
Reserve Highlights
BOE
(Mboe)
NPV BT10%
($000s)
Reserves
Replacement
(%)
RLI
(Years)
Proved Developed Producing + Non Producing 8,784 148,644 140 5.2
Total Proved 18,859 252,454 182 11.1
Total Proved + Probable 27,063 387,682 158 15.9
Finding, Development & Acquisition Costs and Recycle Ratios
FD&A
($/boe)Recycle Ratio
Average Peer
FD&A ($/boe) (1)
Proved Developed Producing 9.49 2.5 14.52
Total Proved 16.94 1.4 20.88
Total Proved + Probable 15.96 1.5 18.12
Refer to Slide Notes and Reader Advisories
(1) “Average peer FD&A” derived from publically disclosed values for selected oil focused peers (BNE, TOG, TVE, WCP, SGY)
Consistent Top Tier Organic Light Oil Growth
6
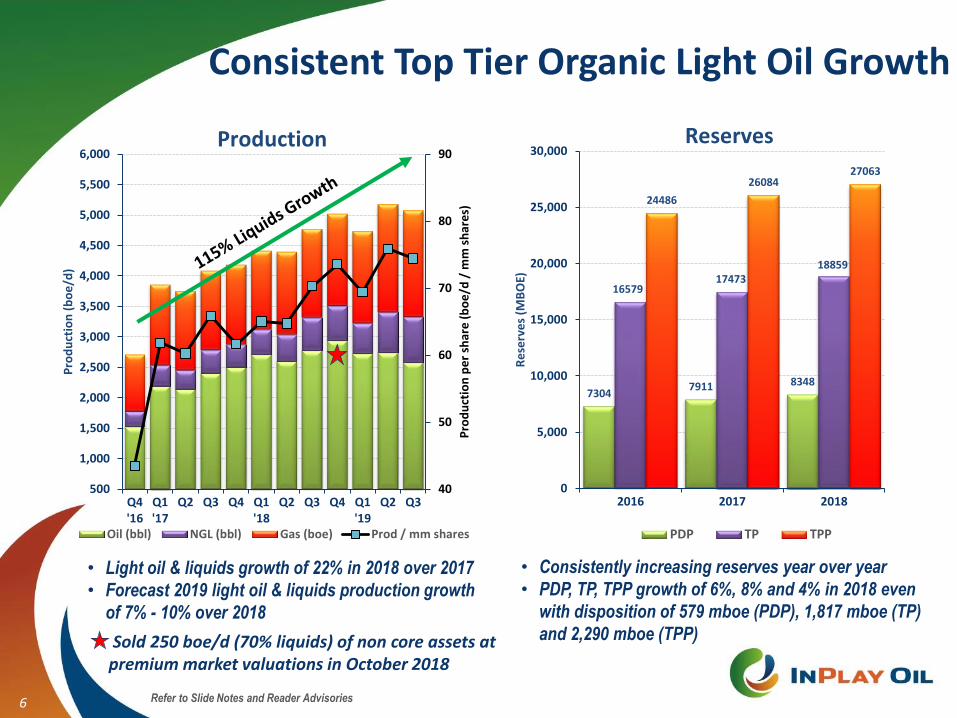
• Light oil & liquids growth of 22% in 2018 over 2017
• Forecast 2019 light oil & liquids production growth
of 7% - 10% over 2018
• Consistently increasing reserves year over year
• PDP, TP, TPP growth of 6%, 8% and 4% in 2018 even
with disposition of 579 mboe (PDP), 1,817 mboe (TP)
and 2,290 mboe (TPP)
40
50
60
70
80
90
Q4'16
Q1'17
Q2 Q3 Q4 Q1'18
Q2 Q3 Q4 Q1'19
Q2 Q3500
1,000
1,500
2,000
2,500
3,000
3,500
4,000
4,500
5,000
5,500
6,000
Pro
du
ctio
n p
er
shar
e (
bo
e/d
/ m
m s
har
es)
Pro
du
ctio
n (
bo
e/d
)
Oil (bbl) NGL (bbl) Gas (boe) Prod / mm shares
Production
73047911 8348
1657917473
18859
24486
2608427063
2016 2017 20180
5,000
10,000
15,000
20,000
25,000
30,000
Re
serv
es
(MB
OE)
PDP TP TPP
Reserves
Sold 250 boe/d (70% liquids) of non core assets atpremium market valuations in October 2018
Refer to Slide Notes and Reader Advisories

Management and Directors
7
Management
Strong Technically and Value Creators
Doug Bartole, P. Eng., ICD.D
President and CEO, Director
Kevin Yakiwchuk, MSc., P. Geol.
Vice President Exploration
Gordon Reese, BSc. Geol.
Vice President Business Development
Thane Jensen, P. Eng.
Vice President Operations
Darren Dittmer, CPA, CMA
CFO
Directors
Experienced Industry Board
Doug Bartole, P. Eng., ICD.D
Jackie Bentley CPA, CA
Craig Golinowski CFA, MBA
Dennis Nerland, LLB, ICD.D
Steve Nikiforuk, CPA, CA, ICD.D
Dale Shwed
Please see appendix for additional details on Management and Directors
8
Production
(boe/d)Liquids
Net Drilling
InventoryFormations
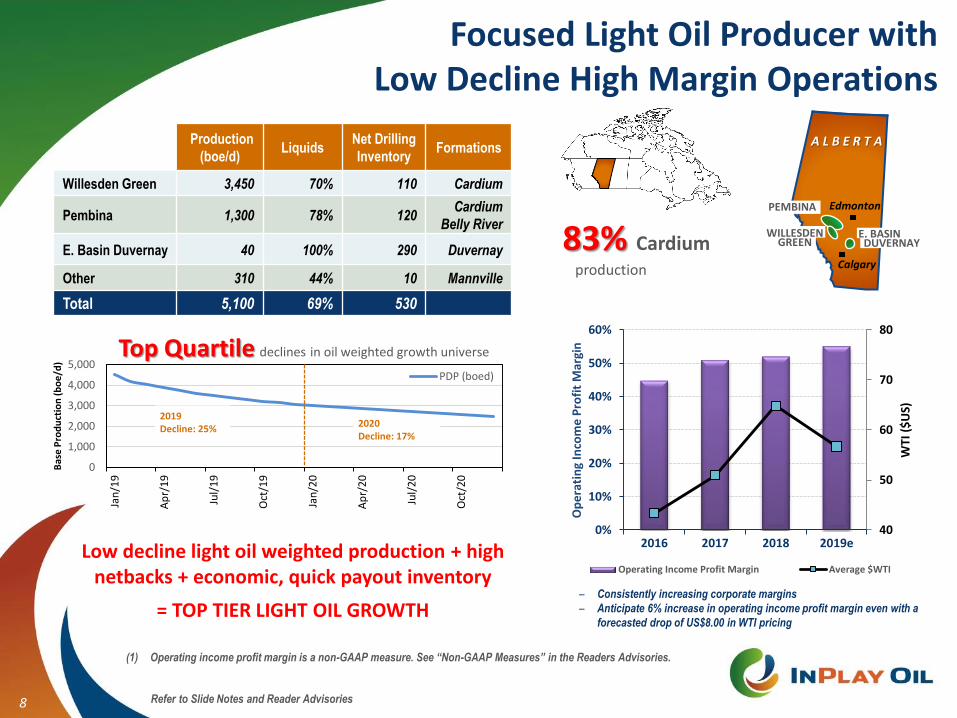
Willesden Green 3,450 70% 110 Cardium
Pembina 1,300 78% 120Cardium
Belly River
E. Basin Duvernay 40 100% 290 Duvernay
Other 310 44% 10 Mannville
Total 5,100 69% 530
0
1,000
2,000
3,000
4,000
5,000
Jan
/19
Ap
r/1
9
Jul/
19
Oct
/19
Jan
/20
Ap
r/2
0
Jul/
20
Oct
/20
Bas
e P
rod
uct
ion
(b
oe
/d)
PDP (boed)
2019Decline: 25%
2020Decline: 17%
Top Quartile declines in oil weighted growth universe
83% Cardiumproduction Calgary
Edmonton
A L B E R T A
PEMBINA
WILLESDEN GREEN
E. BASINDUVERNAY
40
50
60
70
80
2016 2017 2018 2019e0%
10%
20%
30%
40%
50%
60%
WTI
($
US)
Op
era
tin
g In
com
e P
rofi
t M
argi
nOperating Income Profit Margin Average $WTI
– Consistently increasing corporate margins
– Anticipate 6% increase in operating income profit margin even with a
forecasted drop of US$8.00 in WTI pricing
Focused Light Oil Producer with Low Decline High Margin Operations
Low decline light oil weighted production + high netbacks + economic, quick payout inventory
= TOP TIER LIGHT OIL GROWTH
Refer to Slide Notes and Reader Advisories
(1) Operating income profit margin is a non-GAAP measure. See “Non-GAAP Measures” in the Readers Advisories.
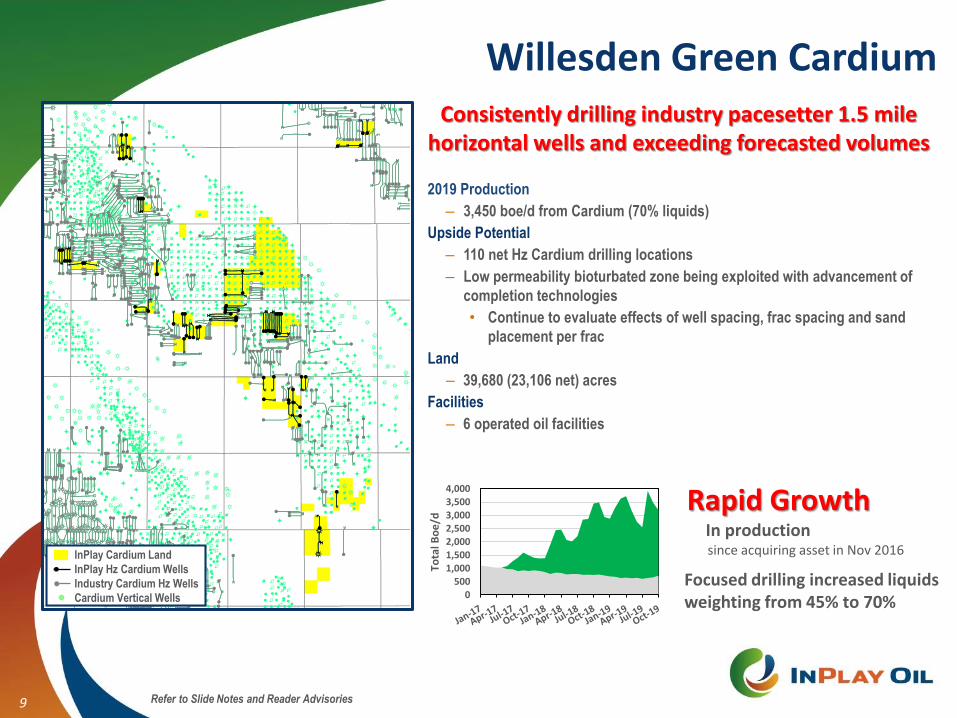
Consistently drilling industry pacesetter 1.5 mile horizontal wells and exceeding forecasted volumes
Willesden Green Cardium
9
2019 Production
– 3,450 boe/d from Cardium (70% liquids)
Upside Potential
– 110 net Hz Cardium drilling locations
– Low permeability bioturbated zone being exploited with advancement of
completion technologies
• Continue to evaluate effects of well spacing, frac spacing and sand
placement per frac
Land
– 39,680 (23,106 net) acres
Facilities
– 6 operated oil facilities
InPlay Cardium Land
InPlay Hz Cardium Wells
Industry Cardium Hz Wells
Cardium Vertical Wells 0500
1,0001,5002,0002,5003,0003,5004,000
Tota
l Bo
e/d
Rapid GrowthIn productionsince acquiring asset in Nov 2016
Focused drilling increased liquids weighting from 45% to 70%
Refer to Slide Notes and Reader Advisories
0
100
200
300
400
500
600
0 3 6 9 12
Cal
end
ar D
aily
Oil
(bb
l/d)
Month
1.0 Mile 1.5 Mile
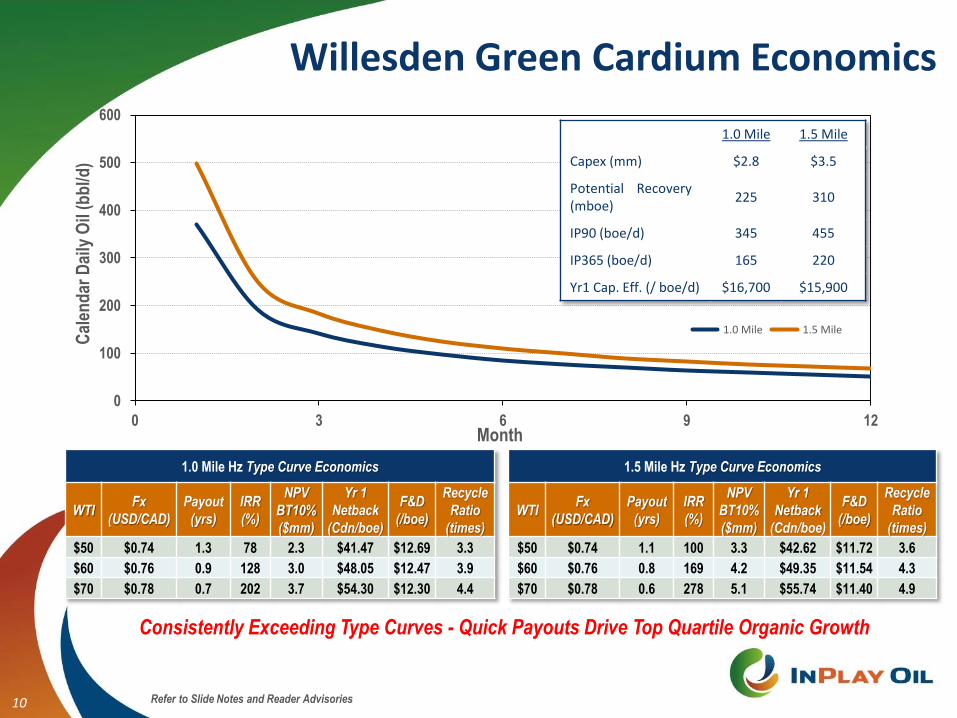
Willesden Green Cardium Economics
10
1.0 Mile 1.5 Mile
Capex (mm) $2.8 $3.5
Potential Recovery (mboe)
225 310
IP90 (boe/d) 345 455
IP365 (boe/d) 165 220
Yr1 Cap. Eff. (/ boe/d) $16,700 $15,900
1.5 Mile Hz Type Curve Economics
WTIFx
(USD/CAD)
Payout
(yrs)
IRR
(%)
NPV
BT10%
($mm)
Yr 1
Netback
(Cdn/boe)
F&D
(/boe)
Recycle
Ratio
(times)
$50 $0.74 1.1 100 3.3 $42.62 $11.72 3.6
$60 $0.76 0.8 169 4.2 $49.35 $11.54 4.3
$70 $0.78 0.6 278 5.1 $55.74 $11.40 4.9
1.0 Mile Hz Type Curve Economics
WTIFx
(USD/CAD)
Payout
(yrs)
IRR
(%)
NPV
BT10%
($mm)
Yr 1
Netback
(Cdn/boe)
F&D
(/boe)
Recycle
Ratio
(times)
$50 $0.74 1.3 78 2.3 $41.47 $12.69 3.3
$60 $0.76 0.9 128 3.0 $48.05 $12.47 3.9
$70 $0.78 0.7 202 3.7 $54.30 $12.30 4.4
Consistently Exceeding Type Curves - Quick Payouts Drive Top Quartile Organic Growth
Refer to Slide Notes and Reader Advisories
Pembina 1.0 mile Hz Type Curve Economics
WTIFx
(USD/CAD)
Payout
(yrs)
IRR
(%)
NPV 10
($mm)
Yr 1
Netback
(Cdn/boe)
F&D
(/boe)
Recycle
ratio
(times)
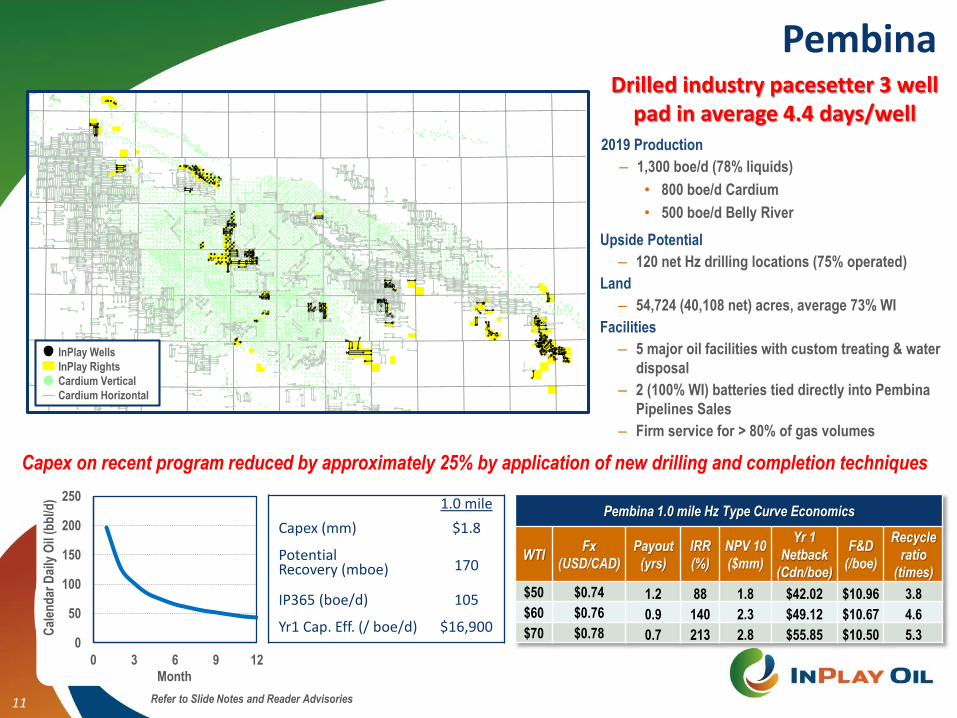
$50 $0.74 1.2 88 1.8 $42.02 $10.96 3.8
$60 $0.76 0.9 140 2.3 $49.12 $10.67 4.6
$70 $0.78 0.7 213 2.8 $55.85 $10.50 5.3
11
Pembina
InPlay Wells
InPlay Rights
Cardium Vertical
Cardium Horizontal
0
50
100
150
200
250
0 3 6 9 12
Cal
end
ar D
aily
Oil
(bb
l/d)
Month
1.0 mile
Capex (mm) $1.8
Potential Recovery (mboe) 170
IP365 (boe/d) 105
Yr1 Cap. Eff. (/ boe/d) $16,900
Refer to Slide Notes and Reader Advisories
2019 Production
– 1,300 boe/d (78% liquids)
• 800 boe/d Cardium
• 500 boe/d Belly River
Upside Potential
– 120 net Hz drilling locations (75% operated)
Land
– 54,724 (40,108 net) acres, average 73% WI
Facilities
– 5 major oil facilities with custom treating & water
disposal
– 2 (100% WI) batteries tied directly into Pembina
Pipelines Sales
– Firm service for > 80% of gas volumes
Capex on recent program reduced by approximately 25% by application of new drilling and completion techniques
Drilled industry pacesetter 3 well pad in average 4.4 days/well

12
Significant Light Oil Resource (high quality oil - premium price to Edmonton Light)
Upside Potential
– Potential recovery of 250 mbbl to >500 mbbl per well
– 290 net drilling locations (at 6 wells / section) only targeting uppermost shale
– Estimate pad-development well costs at ~$5.5 mm (1.5 mile)
Reservoir
– Well control indicates thick high quality shales across InPlay lands
– Up to 3 pay zones present – industry focusing on upper zone at this point
although operators have started drilling the lower zones(1)
– Reservoir is over-pressured (30-60%)
– Depths between 2000m – 2400m
East Basin Duvernay Shale Emerging Light Oil Play
48.4 Crown Sections in the Huxley Area (30,960 acres)
– Independent land evaluator values land at $49.6mm (avg. $1,619 / acre)
• Average InPlay land cost to date has been $545 / acre
– Crown lands provide 5% royalties for 4-6 years @ $60-$70 WTI
– Extensive activity directly offsetting InPlay’s land
• 50 Hz wells drilled to date at Huxley with another 30+ expected in 2019
• Long land tenure allows InPlay a measured pace of development as
others prove up the play around us
Joffre
HuxleyInPlay Duvernay Rights
Leduc Reef
Duvernay Depth (m)
Duvernay Wells
“The East Shale Basin Duvernay Continues to Gain Momentum and is Quickly Evolving
its Position to Become One of the Premier Oil Resource Plays in North America”
“World-class rock characteristics combined with a massive resource in-place”
BMO Capital MarketsMarch, 2019 Report
(1) See Appendix for a cross section displaying reservoir correlation from Joffre to Huxley
Refer to Slide Notes and Reader Advisories

Evolving Completion Technology
13
Improving completion technology is leading to better rates and recoveries1-11-34-24W4 : First Duvernay Hz that was drilled in the Huxley area
• >275mbbl potential recovery for 1.0 mile Hz well even with early stage completion technology used in 20152-26-34-24W4 : Closest producing Hz to InPlay’s well using recent completion technology
• >600mbbl potential recovery for ~1.7 mile Hz well
0
100
200
300
400
500
600
Cal
end
ar D
aily
Oil
(bb
l) 2-26-34-24W4
1-11-34-24W4
Hz Offsets:2-26-34-24W41-11-34-24W4
01,0002,0003,0004,0005,0006,0007,0008,000
Pro
du
ctio
n (
bo
e/d
)
Huxley Area Industry Production
Duvernay Wells
InPlay Rights
InPlay’s Duvernay Hz
InPlay’s Duvernay Vt
Refer to Slide Notes and Reader Advisories

0
100
200
300
400
500
600
700
0 3 6 9 12
Cal
end
ar D
aily
Oil
(bb
l/d)
Month
250 Mbbl 315 Mbbl 400 Mbbl 500 Mbbl
Potential Duvernay Development Economics
14
US$60 WTI Oil Price (NPV 10% / IRR)
EUR vs. CAPEX$4.5mm
(1 mile)
$5.5mm
(1.5 mile)
$6.5mm
(2 mile)
250 mbbl $4.1mm / 51% $3.2mm / 32% $2.2mm / 22%
315 mbbl $5.9mm / 86% $5.3mm / 54% $4.4mm / 37%
400 mbbl $8.5mm / 173% $8.0mm / 101% $7.3mm / 67%
500 mbbl $11.6mm / 396% $11.1mm / 205% $10.6mm / 127%
• Technology improvements (e.g. frac optimization) will continue to enhance play economics (as experienced in most N. American shale plays)
• >170 wells drilled by industry to date; anticipate an additional 60 wells drilled over next 12 months
• Crown land is >50% more economic than Freehold land (InPlay is 100% Crown)
• Well costs reflect pad development scenario; single delineation wells currently estimated to cost 30%-40% more
US$70 WTI Oil Price (NPV 10% / IRR)
EUR vs. CAPEX$4.5mm
(1 mile)
$5.5mm
(1.5 mile)
$6.5mm
(2 mile)
250 mbbl $4.9mm / 64% $4.1mm / 40% $3.1mm / 27%
315 mbbl $6.8mm / 110% $6.3mm / 68% $5.5mm / 46%
400 mbbl $9.6mm / 232% $9.1mm / 131% $8.6mm / 85%
500 mbbl $12.9mm / 576% $12.5mm / 280% $12.1mm / 167%
US$80 WTI Oil Price (NPV 10% / IRR)
EUR vs. CAPEX$4.5mm
(1 mile)
$5.5mm
(1.5 mile)
$6.5mm
(2 mile)
250 mbbl $5.5mm / 78% $4.9mm / 49% $4.0mm / 33%
315 mbbl $7.6mm / 136% $7.1mm / 83% $6.5mm / 56%
400 mbbl $10.5mm / 299% $10.1mm / 164% $9.6mm / 105%
500 mbbl $14.0mm / 814% $13.7mm / 369% $13.3mm / 213%
Refer to Slide Notes and Reader Advisories
2019 Forecast
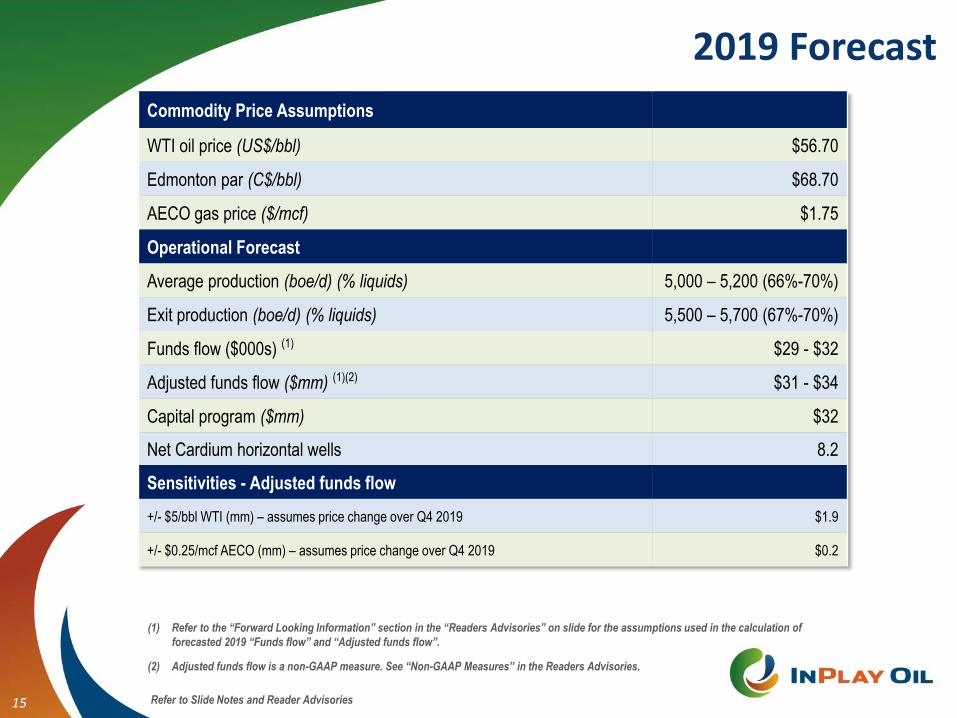
Commodity Price Assumptions
WTI oil price (US$/bbl) $56.70
Edmonton par (C$/bbl) $68.70
AECO gas price ($/mcf) $1.75
Operational Forecast
Average production (boe/d) (% liquids) 5,000 – 5,200 (66%-70%)
Exit production (boe/d) (% liquids) 5,500 – 5,700 (67%-70%)
Funds flow ($000s) (1) $29 - $32
Adjusted funds flow ($mm) (1)(2) $31 - $34
Capital program ($mm) $32
Net Cardium horizontal wells 8.2
Sensitivities - Adjusted funds flow
+/- $5/bbl WTI (mm) – assumes price change over Q4 2019 $1.9
+/- $0.25/mcf AECO (mm) – assumes price change over Q4 2019 $0.2
15 Refer to Slide Notes and Reader Advisories
(1) Refer to the “Forward Looking Information” section in the “Readers Advisories” on slide for the assumptions used in the calculation of
forecasted 2019 “Funds flow” and “Adjusted funds flow”.
(2) Adjusted funds flow is a non-GAAP measure. See “Non-GAAP Measures” in the Readers Advisories.
2018 Year End Net Asset Value
16
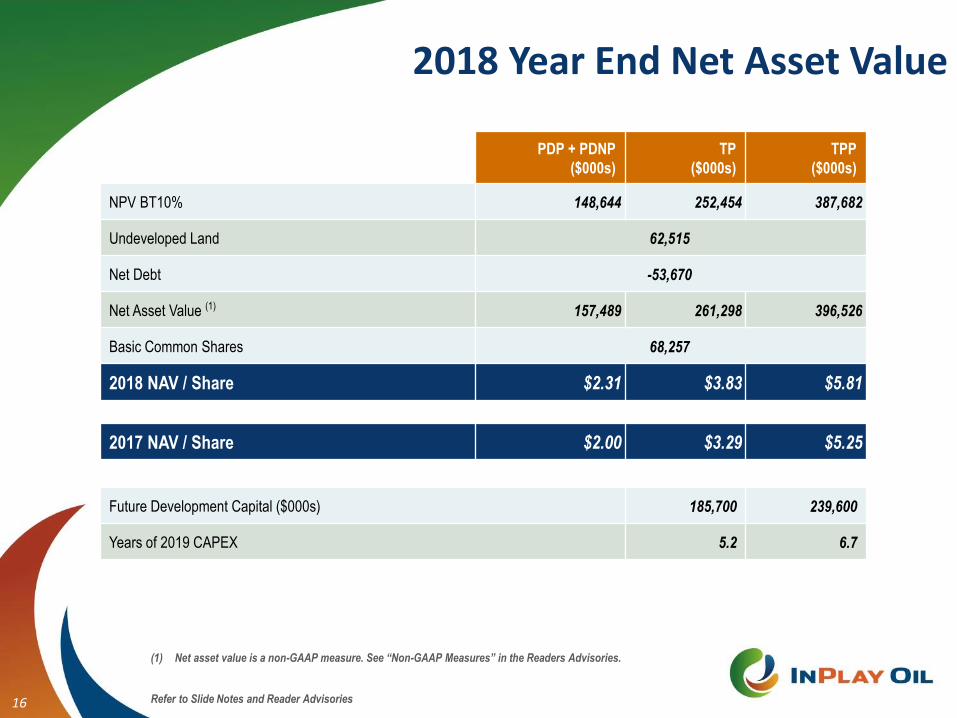
PDP + PDNP
($000s)
TP
($000s)
TPP
($000s)
NPV BT10% 148,644 252,454 387,682
Undeveloped Land 62,515
Net Debt -53,670
Net Asset Value (1) 157,489 261,298 396,526
Basic Common Shares 68,257
2018 NAV / Share $2.31 $3.83 $5.81
2017 NAV / Share $2.00 $3.29 $5.25
Future Development Capital ($000s) 185,700 239,600
Years of 2019 CAPEX 5.2 6.7
Refer to Slide Notes and Reader Advisories
(1) Net asset value is a non-GAAP measure. See “Non-GAAP Measures” in the Readers Advisories.
Summary
• Top tier organic per share light oil production growth
• Technically strong, efficient, Cardium focused light oil producer
• Emphasis on cost reductions is continually increasing margins
• Dedicated to maintaining financial flexibility
• Positioned for value based tuck-ins
• Built for sustainability in a volatile commodity price environment
– Strong balance sheet, high netback, low decline, economic inventory
• High impact Duvernay provides long term potential for material upside
• High torque to upside with oil pricing
17
18
Appendix

InPlay TeamStrong Technically and Value Creators
Doug Bartole, President and CEO and Director, P. Eng., ICD.D (over 25 years)
• Founder, President and CEO of Vero Energy; VP Operations of True Energy; Management and Engineering roles at HuskyEnergy, Renaissance Energy and PanCanadian Petroleum
• Director of Invicta Energy (founder of Royal Acquisition Corp. which was the public RTO vehicle for Invicta)
• Member of APEGA, Institute of Corporate Directors, and a Governor of CAPP (Canadian Association of Petroleum Producers)
Kevin Yakiwchuk, Vice President Exploration, MSc, P. Geol. (over 24 years)
• Founder and VP Exploration at Vero Energy; VP Exploration at True Energy; Geologist at Crestar Energy, RenaissanceEnergy and Shell Canada
Gordon Reese, BSc. Geol., Vice President Business Development (over 33 years)
• Founder, President and CEO of Invicta Energy; President and CEO at Cipher Energy, VP Exploration at True Energy andvarious prospect generation and management roles at CS Resources and Gulf Canada.
Thane Jensen, Vice President Operations, P. Eng. (over 25 years)
• Sr. V.P. Operations, Exploration and Development, and prior VP Engineering at Penn West Exploration
• Reservoir Engineer, Exploitation Engineer, and Drilling and Completions Engineer at PanCanadian Petroleum Ltd.
Darren Dittmer, CFO, CPA, CMA (over 23 years)
• CFO of Barrick Energy Inc. from September 2008 until sale of all assets in July 2013
• Controller and CFO of Cadence Energy and prior Controller of Kereco Energy, Ketch Resources and Upton Resources
19

InPlay Team Strong and Experienced Board
20
Doug Bartole, P. Eng., ICD.D
• President and CEO of InPlay Oil
Jackie Bentley, CPA, CA
• Vice President and Controller at JOG Capital Corp.
Craig Golinowski, CFA, MBA
• President of JOG Capital Corp.
• Currently sits on the board of a number of private and public oil and gas companies within JOG’s portfolio
Dennis Nerland, LLB, ICD.D
• Partner of Nerland Lindsey LLP.
• Current Director of Crew Energy, CriticalControl Solutions. Previously a director of Baytex Energy, Boulder Energy, Granite Oil, Reliable
Energy, Savannah Energy and Invicta Energy
• Member of the Law Society of Alberta, the Canadian Tax Foundation, the Canadian Bar Association, the Society of Trust and Estate
Practitioners, and the Institute of Corporate Directors.
Steve Nikiforuk, CPA, CA, ICD.D
• Private business man with excellent management and executive experience in a CFO role for public and private companies
• Chair of the Audit Committee for Whitecap Resources; board member of several public and private companies
Dale Shwed
• President and CEO of Crew Energy Inc. (spin-out of Baytex in 2003)
• Former Founder, President and CEO of Baytex Energy Ltd. (grew production to over 40,000 boe/d)
• Currently sits on the board of a number of private and public oil and gas companies
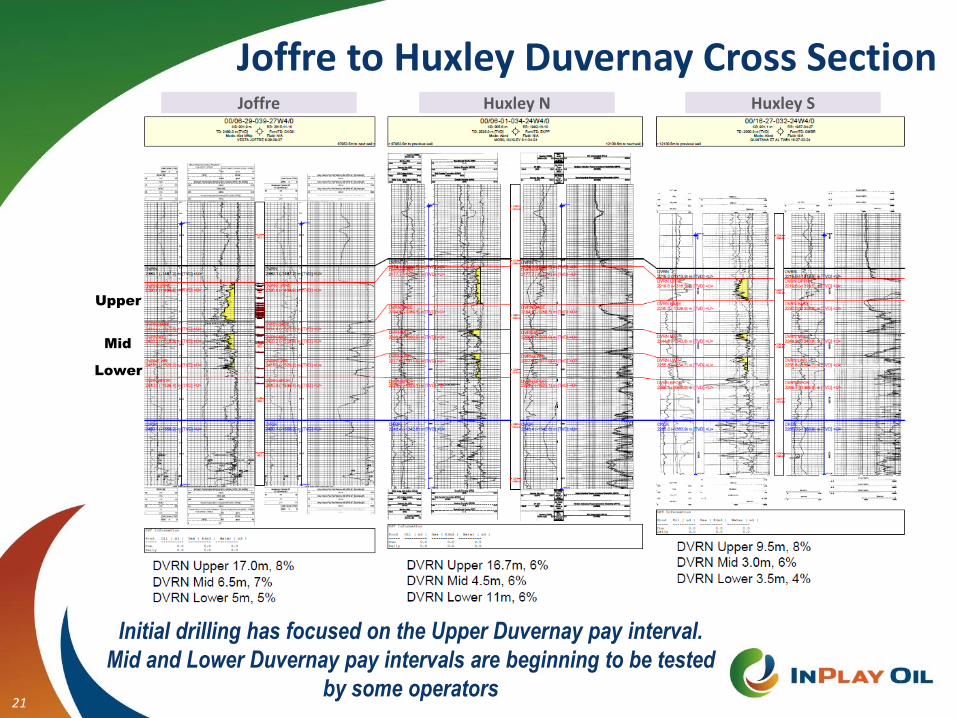
Joffre to Huxley Duvernay Cross Section
21
Joffre Huxley N Huxley S
Upper
Mid
Lower
Initial drilling has focused on the Upper Duvernay pay interval.
Mid and Lower Duvernay pay intervals are beginning to be tested
by some operators

Slide Notes
22
Slide 21. Production and operating income profit margin growth rates are based on the forecast as outlined in slide titled “2019 Forecast”. See “Forward Looking Information and Statements” in the Reader Advisories.
2. See “Drilling Locations” within “Oil and Gas Advisories” in the Reader Advisories.
3. Refer to press release dated March 20, 2019 for details of 2018 Capital efficiency, PDP Finding, Development and Acquisition (“FD&A”) cost and Reserve life index.
4. Base decline based on PDP from InPlay’s independent reserve evaluation effective December 31, 2018; assumes no additional drilling. See “Reserves” within “Oil and Gas Advisories” in the Reader Advisories.
Slide 31. Funds flow is a GAAP measure from the cash flow statement which includes impacts of decommissioning obligation expenditures and is presented as it is the closest GAAP measure to Adjusted funds flow.
Slide 41. Production rates and 2019 drilling plans are based on current forecast as outlined in slide titled “2019 Forecast”. See “Forward Looking Information and Statements” in the Reader Advisories.
2. Reserves and NPV are derived from InPlay’s independent reserve evaluation effective December 31, 2018, see “Reserves” and “Net Present Value Estimates” within “Oil and Gas Advisories” in the Reader
Advisories.
3. Shares (basic and fully dilutive) outstanding at the date of this presentation
4. Market capitalization and Enterprise value based on current share price. Bank debt and Net debt as of September 30, 2019
5. Exit production forecast of 5,500 – 5,700 boe/d has been achieved by November 2019.
Slide 51. Reserves and NPV are derived from InPlay’s independent reserve evaluation effective December 31, 2018, see “Reserves” and “Net Present Value Estimates” within “Oil and Gas Advisories” in the Reader
Advisories.
2. Inclusive of Q4 2018 disposition of 579 mboe (PDP), 1817 mboe (TP) and 2290 mboe (TPP). Refer to press release dated March 20, 2019 for additional details.
3. Refer to notes in InPlay’s press release dated March 20, 2019 for details of 2018 Reserves replacement, Reserve life index (“RLI”), FD&A and Recycle ratio calculations.
4. Includes the proved developed non-producing reserves and associated net present values from the 2 wells which were drilled in 2018 but not completed until January 2019 due to low commodity prices seen in
November and December
5. “Average peer FD&A” derived from publically disclosed values for selected oil focused peers (BNE, TOG, TVE, WCP, SGY)
Slide 61. 2019 annual average production rates are based on current forecast and related assumptions as outlined in slide titled “2019 Forecast”. See “Forward Looking Information and Statements” in the Reader
Advisories.
2. See “Reserves” within “Oil and Gas Advisories” in the Reader Advisories.
3. Refer to InPlay’s press release dated March 20, 2019 for additional details of reserves disposed in 2018.
Slide 81. Reflects 2019 average production and liquids weighting based on current forecast and related assumptions as outlined in slide titled “2019 Forecast”. See “Forward Looking Information and Statements” in the
Reader Advisories.
2. See “Drilling Locations” under “Oil and Gas Advisories” in the Reader Advisories.
3. Decline based on PDP from InPlay’s independent reserve evaluation effective December 31, 2018; assumes no additional drilling . See “Reserves” under “Oil and Gas Advisories” in the Reader Advisories.
4. See “Forward Looking Information and Statements” in the Reader Advisories for material assumptions used to forecast Operating income profit margin for 2019.
Slide 91. Reflects 2019 average production and liquids weighting based on current forecast and related assumptions as outlined in slide titled “2019 Forecast”. See “Forward Looking Information and Statements” in the
Reader Advisories.
2. See “Drilling Locations” within “Oil and Gas Advisories” in the Reader Advisories.
3. Upside potential Cardium locations identified as 1 mile equivalents at maximum of 6 wells per section.
Slide 101. See “Type Curves and Potential Recovery Estimates” under “Oil and Gas Advisories” in the Reader Advisories.
2. New well economics are based on: WTI/Edmonton Par light oil differential of negative $2.50 / $4.00 / $5.50 respectively over indicated WTI pricing range, AECO $2.00/GJ
3. Based on half cycle costs, “Recycle Ratio” based on first year netbacks
Slide Notes (continued)
23
Slide 111. Reflects 2019 average production and liquids weighting based on forecast as outlined in slide titled “2019 Forecast”. See “Forward Looking Information and Statements” in the Reader Advisories.
2. A decrease in program drill, complete and equipping capital expenditures from $2.4 million to $1.8 million as a result of technological improvements, combined with risked potential recovery assumptions due
to changes in well design have resulted in improved Pembina economics compared to the previous presentation.
3. See “Type Curves and Potential Recovery Estimates” and “Drilling Locations” within “Oil and Gas Advisories” in the Reader Advisories.
4. New well economics are based on: WTI/Edmonton Par light oil differential of negative $2.50 / $4.00 / $5.50 respectively over indicated WTI pricing range, AECO $2.00/GJ
5. Based on half cycle costs, “Recycle Ratio” based on first year netbacks
Slide 121. Seaton-Jordan evaluation valued InPlay’s undeveloped land in the Duvernay area at $49.6MM ($1,619 per acre for 30,640 acres) as at Dec 31, 2018
2. See “Drilling Locations” within “Oil and Gas Advisories” in the Reader Advisories.
3. Potential recovery estimates for the area are internal estimates made by comparing industry historical well results surrounding InPlay’s land base in the area to the type curve library noted in the “Type Curves
and Potential Recovery Estimates” section in “Oil and Gas Advisories” to identify the most applicable type curve and associated recovery. The referenced estimates are meant to closely approximate Proved
Plus Probable Undeveloped reserves as defined by COGE. Given the process described above however, these estimates are considered internally generated recovery estimates prepared by InPlay’s technical
team and are not reserve of resource estimates prepared in accordance with the requirements of COGE.
4. Quotes are from BMO Capital Markets “East of the Reef – Duvernay Oil Play” analysis, Spring 2019
Slide 131. See “Type Curves and Potential Recovery Estimates” within “Oil and Gas Advisories” in the Reader Advisories.
2. Potential recovery estimates for the two wells highlighted are internal estimates made by comparing the historical well results to the type curve library noted in the “Type Curves and Potential Recovery
Estimates” section in “Oil and Gas Advisories” to identify the most applicable type curve and associated recovery. The referenced estimates are meant to closely approximate Proved Plus Probable
Undeveloped reserves as defined by COGE. Given the process described above however, these estimates are considered internally generated recovery estimates by InPlay’s technical team and are not reserve
of resource estimates prepared in accordance with the requirements of COGE.
Slide 141. Economics are based on: WTI/Edmonton Par light oil differential of negative $2.50 / $4.00 / $5.50 respectively over indicated WTI pricing range, AECO $2.00/GJ
2. See “Type Curves and Potential Recovery Estimates” within “Oil and Gas Advisories” in the Reader Advisories.
3. Economics assume Crown land for royalties payable on produced volumes (InPlay’s Duvernay lands are 100% Crown)
4. See “Estimated Ultimate Recovery” within “Oil and Gas Advisories” in the Reader Advisories.
Slide 151. Exit production forecast of 5,500 – 5,700 boe/d has been achieved by November 2019.
2. Funds flow is a GAAP measure which includes impacts of decommissioning obligation expenditures and is presented as it is the closest GAAP measure to Adjusted funds flow.
3. Includes completion capital for 2 (2.0 net) Cardium wells drilled in Q4 2018
4. Sensitivities indicated are only applicable for the fourth quarter of 2019.
5. Forecasted full year 2019 commodity price reductions including a USD $0.50/bbl decrease in WTI and $4.00/boe decrease in realized NGL prices are the main factors causing a $2 million decrease in 2019 funds
flow and adjusted funds flow from that previously forecasted.
Slide 161. Reserves and associated reserve values are derived from InPlay’s independent reserve evaluation effective December 31, 2018. Includes the proved developed non-producing (PDNP) reserves and value from
the two wells drilled in 2018 but with completions delayed until January 2019 due to the low commodity prices seen in November and December
2. See “Reserves” and “Net Present Value Estimates” under under “Oil and Gas Advisories”. Changes in 2018 NAV from 2017 NAV include, but are not limited to, 2018 disposition with BTPV10% value of $12mm
(PDP), $24.5mm (TP) and 34.4mm (TPP) and impact of Sproule AECO natural gas price deck dropping 37%, 33% and 21% in years 1, 2 and 3 respectively and 18% for the remaining years thereafter with respect
to the Sproule Dec 31, 2017 reserve book.
3. Seaton-Jordan evaluation valued InPlay’s undeveloped land in the Duvernay area at $49.6MM ($1,619 per acre for 30,640 acres) as at Dec 31, 2018, remaining undeveloped land value is $12.9MM ($256 per acre
for 50,522 acres) as estimated internally by management.
4. Net debt and basic shares outstanding as at December 31, 2018.
24
All amounts in this presentation are stated in Canadian dollars unless otherwise specified. Throughout this presentation, the terms Boe (barrels of oil equivalent) and Mmboe (millions of barrels of oil equivalent) are used. Such termswhen used in isolation, may be misleading. In accordance with Canadian practice, production volumes and revenues are reported on a company gross basis, before deduction of Crown and other royalties and without including anyroyalty interest, unless otherwise stated. Unless otherwise specified, all reserves volumes in this presentation (and all information derived therefrom) are based on "company gross reserves" using forecast prices and costs. Completedisclosure of our oil and gas reserves and other oil and gas information in accordance with NI 51-101 is available on our SEDAR profile at www.sedar.com. The recovery and reserve estimates contained herein are estimates onlyand there is no guarantee that the estimated reserves will be recovered. In relation to the disclosure of estimates for individual properties, such estimates may not reflect the same confidence level as estimates of reserves and futurenet revenue for all properties, due to the effects of aggregation. The Company's belief that it will establish additional reserves over time with conversion of probable undeveloped reserves into proved reserves is a forward-lookingstatement and is based on certain assumptions and is subject to certain risks, as discussed previously under the heading "Forward-Looking Information and Statements".
The information contained in this corporate presentation does not purport to be all-inclusive or to contain all information that a prospective investor may require. Prospective investors are encouraged to conduct their own analysisand reviews of InPlay and of the information contained in this corporate presentation. Without limitation, prospective investors should consider the advice of their financial, legal, accounting, tax and other advisors and such otherfactors they consider appropriate in investigating and analyzing InPlay.
Oil and Gas Advisories
The recovery and reserve estimates of InPlay's reserves provided herein are estimates only and there is no guarantee that the estimated reserves with be recovered. Throughout this presentation various references are made to"potential" and "targeted" resource and recoveries which have been prepared by management of InPlay and are not estimates of reserves or resources. Accordingly, undue reliance should not be placed on same. Such informationhas been prepared by management for the purposes of making capital investment decisions and for internal budget preparation only. In addition, forward-looking statements or information are based on a number of material factors,expectations or assumptions of InPlay which have been used to develop such statements and information but which may prove to be incorrect. Although InPlay believes that the expectations reflected in such forward-lookingstatements or information are reasonable, undue reliance should not be placed on forward-looking statements because InPlay can give no assurance that such expectations will prove to be correct. In addition to other factors andassumptions which may be identified herein, assumptions have been made regarding, among other things: the impact of increasing competition; the general stability of the economic and political environment in which InPlayoperates; the timely receipt of any required regulatory approvals; the ability of InPlay to obtain qualified staff, equipment and services in a timely and cost efficient manner; the ability of InPlay to add production and reserves throughacquisition, development and exploration activities; drilling results; the ability of the operator of the projects in which InPlay has an interest in to operate the field in a safe, efficient and effective manner; field production rates anddecline rates; the ability to replace and expand oil and natural gas reserves through acquisition, development and exploration; risks associated with the degree of certainty in resource assessments; the timing and cost of pipeline,storage and facility construction and expansion and the ability of InPlay to secure adequate product transportation; future commodity prices; currency, exchange and interest rates; regulatory framework regarding royalties, taxes andenvironmental matters in the jurisdictions in which InPlay operates; and the ability of InPlay to successfully market its oil and natural gas products.
Certain information in this document may constitute "analogous information" as defined in National Instrument 51-101 – Standards of Disclosure for Oil and Gas Activities ("NI-51-101"), including but not limited to, information relatingto the areas in geographical proximity to lands that are or may be held by InPlay. Such information has been obtained from government sources, regulatory agencies or other industry participants. InPlay believes the information isrelevant as it helps to define the reservoir characteristics in which InPlay may hold an interest. InPlay is unable to confirm that the analogous information was prepared by a qualified reserves evaluator or auditor. Such information isnot an estimate of the reserves or resources attributable to lands held or potentially to be held by InPlay and there is no certainty that the reservoir data and economics information for the lands held or potentially to be held by InPlaywill be similar to the information presented herein. The reader is cautioned that the data relied upon by InPlay may be in error and/or may not be analogous to such lands to be held by InPlay.
Any references in this presentation to initial, early and/or test or production/performance rates are useful in confirming the presence of hydrocarbons, however, such rates are not determinate of the rates at which such wells willproduce or continue production and to decline thereafter. Additionally, such rates may also include recovered "load oil" fluid used in well completion stimulation. Readers are cautioned not to place reliance on such rates incalculating the aggregate production for InPlay. The initial production rate may be estimated based on other third-party estimates or limited data available at this time. In all cases in this presentation, initial production or tests are notnecessarily indicative of long-term performance of the relevant well or fields or of ultimate recovery of hydrocarbons.
Reserves – All reserves disclosed in this presentation are derived from InPlay’s independent reserve evaluation effective December 31, 2018, complete details of which can be found within our Annual Information form filed onSEDAR. Reserves are estimated remaining quantities of oil and natural gas and related substances anticipated to be recoverable from known accumulations, as of a given date, based on the analysis of drilling, geological,geophysical and engineering data; the use of established technology; and specified economic conditions, which are generally accepted as being reasonable. Reserves are classified according to the degree of certainty associatedwith the estimates as follows:
Proved Reserves are those reserves that can be estimated with a high degree of certainty to be recoverable. It is likely that the actual remaining quantities recovered will exceed the estimated proved reserves.
Proved Developed Producing Reserves are those proved reserves that are expected to be recovered from completion intervals open at the time of the estimate. These reserves may be currently producing or,if shut in, they must have previously been on production, and the date of resumption of production must be known with reasonable certainty.
Proved Developed Producing Reserves are those proved reserves that either have not been on production, or have previously been on production but are shut in and the date of resumption of production isunknown.
Probable Reserves are those additional reserves that are less certain to be recovered than proved reserves. It is equally likely that the actual remaining quantities recovered will be greater or less than the sum of theestimated proved plus probable reserves.
Test Results and Initial Production Rates - A pressure transient analysis or well-test interpretation has not been carried out and thus certain of the test results provided herein should be considered to be preliminary until suchanalysis or interpretation has been completed. Test results and initial production rates disclosed herein may not necessarily be indicative of long term performance or of ultimate recovery. Initial Production “IP”) rates indicate theaverage daily production over the indicated daily period.
BOE equivalent - Barrel of oil equivalents or BOEs may be misleading, particularly if used in isolation. A BOE conversion ratio of 6 mcf: 1 bbl is based on an energy equivalency conversion method primarily applicable at the burnertip and does not represent a value equivalency at the wellhead. Given that the value ratio based on the current price of crude oil as compared to natural gas is significantly different than the energy equivalency of 6:1, utilizing a 6:1conversion basis may be misleading as an indication of value.
Estimated Ultimate Recovery – Estimated Ultimate Recovery (“EUR”) is an approximation of the quantity of oil or gas that is potentially recoverable or has already been recovered from a reserve or well. EUR is not a defined termwithin the COGE Handbook and therefore any reference to EUR in this presentation is not deemed to be reported under the requirements of NI 51-101. Readers are cautioned that there is no certainty that the Company willultimately recover the estimated quantity of oil or gas from such reserves or wells.
Net Present Value Estimates - It should not be assumed that the net present value of the estimated future net revenues of the reserves of InPlay included in this presentation represent the fair market value of the reserves. There isno assurance that the forecast prices and cost assumptions will be attained and variances could be material.
Reader Advisories

25
Reader Advisories (continued)Oil and Gas Advisories (cont’d)
Type Curves and Potential Recovery Estimates - The type curves presented herein reflect a selection from a type curves library provided by InPlay’s independent reserve evaluator. In each case the type curve presented is thatwhich in management’s assessment feels best represents the expected average drilling results based upon InPlay producing wells in the area as well as non-InPlay wells determined by management to be analogous for purposes ofthe type curve assignments. Type curves presented incorporate the most recent data from actual well results and would only be representative of the specific drilled locations. There is no guarantee that InPlay will achieve theestimated or similar results derived therefrom. The referenced potential recovery estimates are meant to approximate Proved Plus Probable Undeveloped reserves as defined by COGE. The potential recovery estimates have beengenerated using the relevant oil type curve noted above and incorporating management assumptions relating to gas and NGL amounts which are based on historical results. These estimates are considered internally generatedrecovery targets developed by InPlay’s technical team and are not reserve or resource estimates prepared in accordance with the requirements of COGE. Accordingly, undue reliance should not be placed on the same. Suchinformation has been prepared by management for the purposes of making capital investment decisions and for internal budget preparation only.
Drilling Locations - This presentation discloses drilling locations in two categories: (i) booked locations; and (ii) unbooked locations. Booked locations are proved locations and probable locations derived from the InPlay’sindependent reserves evaluation effective December 31, 2018 and account for drilling locations that have associated proved and/or probable reserves, as applicable. Of the 530 drilling locations identified herein, 88.1 are booked asproved plus probable locations, 25.4 are booked as probable locations and 417.1 are unbooked locations. Unbooked locations are management estimates based on prospective acreage and an assumption as to the number of wellsthat can be drilled per section based on industry practice and internal review. Unbooked locations do not have attributed reserves or resources. Unbooked locations have been identified by management as an estimation of theCompany's potential multi-year drilling activities based on evaluation of applicable geologic, seismic, engineering, production and reserves information. There is no certainty that the InPlay will drill all unbooked drilling locations and ifdrilled there is no certainty that such locations will result in additional oil and gas reserves, resources or production. The drilling locations on which InPlay actually drills wells will depend upon the availability of capital, regulatoryapprovals, seasonal natural gas prices, costs, actual drilling results, additional reservoir information that is obtained and other factors. While certain of the unbooked drilling locations have been derisked by either InPlay restrictions,oil and other industry participants drilling existing wells in relative close proximity to such unbooked drilling locations, certain unbooked drilling locations are farther away from existing wells where management has less informationabout the characteristics of the reservoir. Therefore, there is uncertainty whether wells will be drilled in such unbooked locations and if drilled there is more uncertainty that such wells will result in additional oil and gas reserves,resources or production.
Oil & Gas Metrics - This presentation may contain metrics commonly used in the oil and natural gas industry, such as "finding and development costs", "finding and development recycle ratio", "finding, development and acquisitioncosts", "finding, development and acquisition recycle ratio", “payout”, "RLI" and "IRR". These terms do not have standardized meanings or standardized methods of calculation and therefore may not be comparable to similarmeasures presented by other companies, and therefore should not be used to make such comparisons. Management uses oil and gas metrics for its own performance measurements and to provide shareholders with measures tocompare InPlay's operations over time. Readers are cautioned that the information provided by these metrics, or that can be derived from the metrics presented in this presentation, should not be unduly relied upon.
Finding and development costs ("F&D costs") are calculated on a per boe basis by dividing the aggregate of the change in future development costs from the prior year for the particular reserve category and the costsincurred on exploration and development activities in the year by the change in reserves from the prior year for the reserve category.
F&D recycle ratio is calculated by dividing the operating netback per boe for the period by the F&D costs per boe for the particular reserve category.
Finding, development and acquisition costs ("FD&A costs") are calculated on a per boe basis by dividing the aggregate of the change in future development costs from the prior year for the particular reserve categoryand the costs incurred on exploration and development activities and property acquisitions (net of dispositions) in the year by the change in reserves from the year for the reserve category.
FD&A recycle ratio is calculated by dividing the operating netback per boe for the period by the FD&A costs per boe for the particular reserve category.
Payout refers to the time required to pay back the capital expenditures (on a before tax basis) of a project.
Reserve Life Index (“RLI”) is calculated by dividing the quantity of a particular reserve category of reserves by the forecast of the first year's production for the corresponding reserve category.
Internal Rate of Return (“IRR”) refers to the discount rate that makes the net present value of all cash flows of a project equal zero.
Total Locations Proved Locations Probable Locations Unbooked Locations
Willesden Green Cardium 110.1 36% 17% 18%
Pembina Cardium 64.1 35% 29% 6%
Pembina Belly River 56.4 28% 42% 5%
Duvernay 290 1% 4% 69%
Other 10 0% 8% 2%
Total 530.6 100% 100% 100%
26
Reader Advisories (continued)Forward Looking Information and Statements
This presentation contains forward-looking statements and forward-looking information within the meaning of applicable securities laws. The use of any of the words "expect", "anticipate", "continue", "estimate", "objective","ongoing", "may", "will", "project", "should", "believe", "plans", "intends" and similar expressions are intended to identify forward-looking information or statements. More particularly and without limitation, this presentation includesforward-looking information and statements about our strategy, plans and focus, forecast annual growth rates, planned capital expenditures and the source of funding of our capital program, expected future production and productmix, the quantity and estimated value of reserves, forecast operating and financial results including funds flow, adjusted funds flow, operating income profit margin, drilling inventories and drilling plans, anticipated debt levels,forecasted commodity prices and differentials, forecasted exchange rates, anticipated production costs and capital efficiencies.
This corporate presentation contains future-oriented financial information and financial outlook information (collectively, "FOFI") about InPlay's prospective results of operations, funds flow, adjusted funds flow, and componentsthereof, all of which are subject to the same assumptions, risk factors, limitations, and qualifications as set forth in the above paragraphs. FOFI contained in this corporate presentation was made as of the date of this corporatepresentation and was provided for the purpose of providing further information about InPlay's future business operations, InPlay disclaims any intention or obligation to update or revise any FOFI contained in this corporatepresentation, whether as a result of new information, future events or otherwise, unless required pursuant to applicable cautioned that the FOFI contained in this corporate presentation should not be used for purposes other than forwhich it is disclosed herein.
Additionally, readers are advised that historical results, growth and transactions described in this presentation may not be reflective of future results, growth and transactions with respect to InPlay.
The forward-looking statements and information are based on certain key expectations and assumptions made by InPlay and its management, including expectations and assumptions concerning general economic conditions inCanada, the United States and elsewhere, and oil and gas industry conditions, including applicable royalty rates and environmental and tax laws and regulations. Although InPlay believes that the expectations and assumptions onwhich such forward-looking statements and information are based are reasonable as of the date hereof, undue reliance should not be placed on the forward-looking statements and information because InPlay can give no assurancethat they will prove to be correct.
Since forward-looking statements and information address future events and conditions, by their very nature they involve inherent risks and uncertainties. Actual results could differ materially from those currently anticipated due to anumber of factors and risks including, but not limited to the risks associated with the oil and gas industry in general. Readers are cautioned that the foregoing list of factors is not exhaustive. The forward-looking statements andinformation contained in this presentation are made as of the date hereof and InPlay undertakes no obligation to update publicly or revise any forward-looking statements or information, whether as a result of new information, futureevents or otherwise, unless so required by applicable securities laws.
In addition, this presentation contains certain forward-looking information relating to economics for drilling opportunities in the areas that InPlay has an interest. Such information includes, but is not limited to, anticipated payoutrates, rates of return, profit to investment ratios and recycle ratios which are based on additional various forward looking information such as production rates, anticipated well performance and type curves, the estimated net presentvalue of the anticipated future net revenue associated with the wells, anticipated reserves, anticipated capital costs, anticipated finding and development costs, estimated ultimate recoverable volumes, anticipated future royalties,operating expenses, and transportation expenses.
Forward Looking Information Assumptions
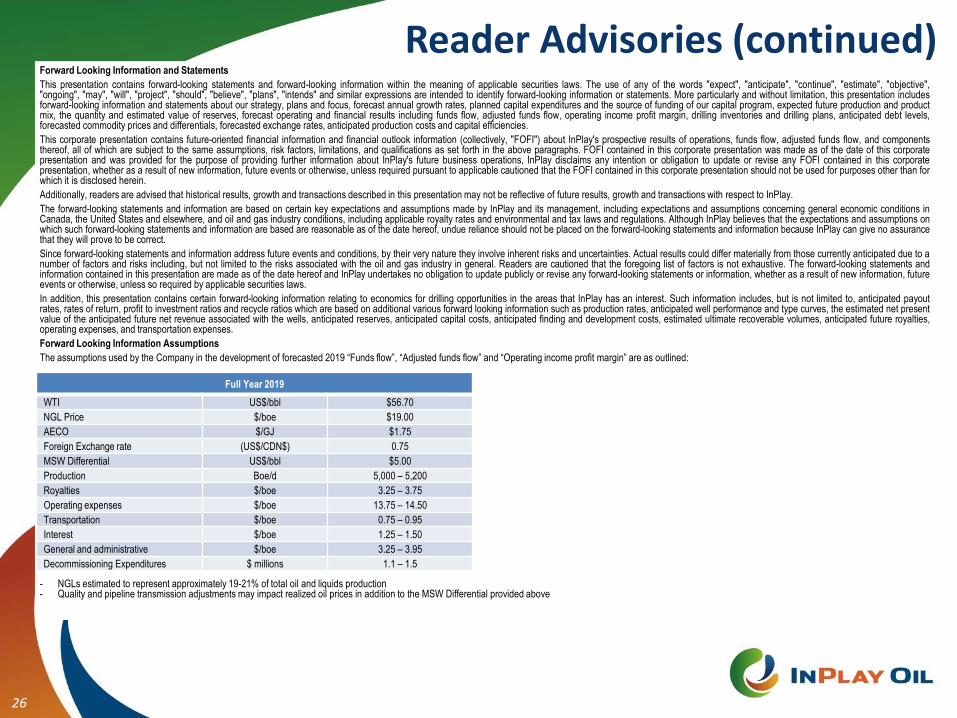
The assumptions used by the Company in the development of forecasted 2019 “Funds flow”, “Adjusted funds flow” and “Operating income profit margin” are as outlined:
- NGLs estimated to represent approximately 19-21% of total oil and liquids production- Quality and pipeline transmission adjustments may impact realized oil prices in addition to the MSW Differential provided above
Full Year 2019
WTI US$/bbl $56.70
NGL Price $/boe $19.00
AECO $/GJ $1.75
Foreign Exchange rate (US$/CDN$) 0.75
MSW Differential US$/bbl $5.00
Production Boe/d 5,000 – 5,200
Royalties $/boe 3.25 – 3.75
Operating expenses $/boe 13.75 – 14.50
Transportation $/boe 0.75 – 0.95
Interest $/boe 1.25 – 1.50
General and administrative $/boe 3.25 – 3.95
Decommissioning Expenditures $ millions 1.1 – 1.5
27
Reader Advisories (continued)Non-GAAP Measures
Included in this document are references to the terms “adjusted funds flow”, “adjusted funds flow per share, basic and diluted”, “operating netback per boe”, “operating income profit margin”, “net debt/annualized adjusted fundsflow”, “net asset value” and “market capitalization” and “enterprise value”. Management believes these measures are helpful supplementary measures of financial and operating performance and provide users with similar, butpotentially not comparable, information that is commonly used by other oil and natural gas companies. These terms do not have any standardized meaning prescribed by GAAP and should not be considered an alternative to, ormore meaningful than, “funds flow”, “profit (loss) before taxes”, “profit (loss) and comprehensive income (loss)” or assets and liabilities as determined in accordance with GAAP as a measure of the Company’s performance andfinancial position. InPlay’s determination of these Non-GAAP measures may not be comparable to those reported by other companies. For a reconciliation to the nearest GAAP figure, where applicable, for adjusted funds flow,adjusted funds flow per share, basic and diluted, operating netback per boe, operating income profit margin and net debt/annualized adjusted funds flow, refer to the section “Non-GAAP Measures” in the Company’s September 30,2019 MD&A filed on SEDAR.
Adjusted Funds Flow - Management considers adjusted funds flow to be an important measure of InPlay’s ability to generate the funds necessary to finance capital expenditures. Adjusted funds flow is calculated as funds flowadjusting for the impact of decommissioning expenditures. This item is adjusted from funds flow as decommissioning expenditures are incurred on a discretionary and irregular basis and are primarily incurred on previous operatingassets, making the exclusion of this item relevant in Management’s view to the reader in the evaluation of InPlay’s operating performance.
Adjusted Funds Flow per Share, Basic and Diluted - Management considers adjusted funds flow per share, basic and diluted an important measure to evaluate its operational performance as it demonstrates its recurringoperating cash flow generated attributable to each share. Adjusted funds flow per share, basic and diluted is calculated by the Company as adjusted funds flow divided by the weighted average number of common sharesoutstanding for the respective period.
Operating Netback per BOE - Management considers operating netback per boe an important measure to evaluate its operational performance as it demonstrates its field level profitability per unit of production. Operating netbackper boe is calculated by the Company as operating income (of which is calculated as oil and natural gas sales less royalties, operating expenses and transportation expenses) divided by average production for the respective period.
Operating Income Profit Margin - Management considers operating income profit margin an important measure to evaluate its operational performance as it demonstrates how efficient the Company is in generating field levelprofits from its sales revenue. Operating income profit margin is calculated by the Company as operating income (of which is calculated as oil and natural gas sales less royalties, operating expenses and transportation expenses)as a percentage of oil and natural gas sales.
Net debt/Annualized adjusted funds flow - Management considers net debt/annualized adjusted funds flow to be an important measure of InPlay’s liquidity and ability to generate funds necessary to repay upcoming obligations.Net debt/annualized adjusted funds flow is calculated by the Company as net debt divided by adjusted funds flow for the current quarter multiplied by four to reflect a full annual period.
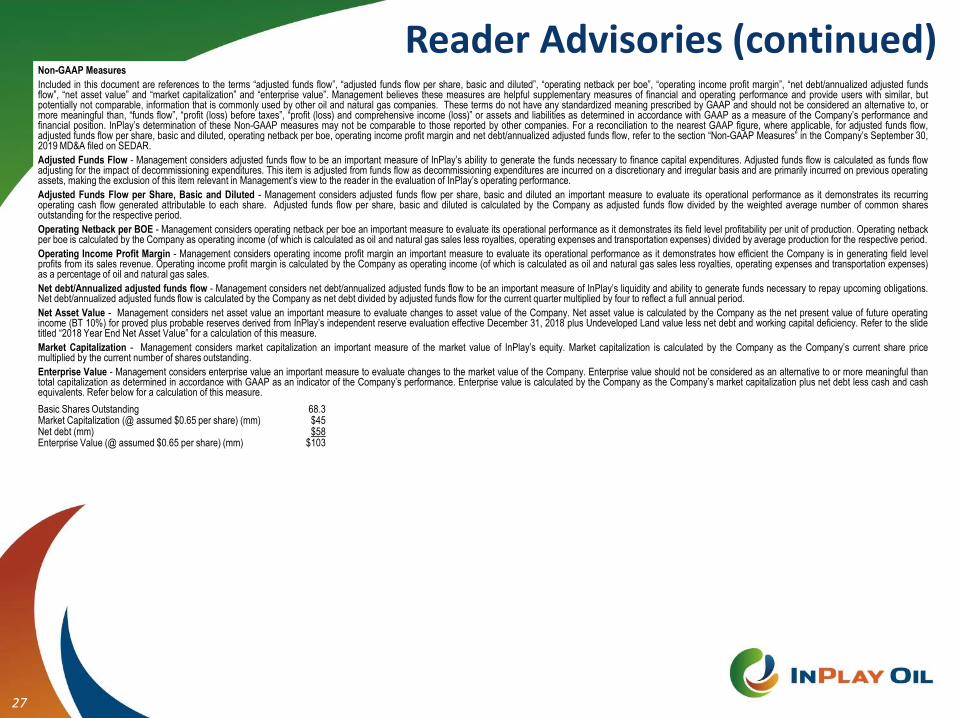
Net Asset Value - Management considers net asset value an important measure to evaluate changes to asset value of the Company. Net asset value is calculated by the Company as the net present value of future operatingincome (BT 10%) for proved plus probable reserves derived from InPlay’s independent reserve evaluation effective December 31, 2018 plus Undeveloped Land value less net debt and working capital deficiency. Refer to the slidetitled “2018 Year End Net Asset Value” for a calculation of this measure.
Market Capitalization - Management considers market capitalization an important measure of the market value of InPlay’s equity. Market capitalization is calculated by the Company as the Company’s current share pricemultiplied by the current number of shares outstanding.
Enterprise Value - Management considers enterprise value an important measure to evaluate changes to the market value of the Company. Enterprise value should not be considered as an alternative to or more meaningful thantotal capitalization as determined in accordance with GAAP as an indicator of the Company’s performance. Enterprise value is calculated by the Company as the Company’s market capitalization plus net debt less cash and cashequivalents. Refer below for a calculation of this measure.
Basic Shares Outstanding 68.3Market Capitalization (@ assumed $0.65 per share) (mm) $45Net debt (mm) $58Enterprise Value (@ assumed $0.65 per share) (mm) $103
Contact Us
Doug Bartole
President and CEO
587.955.0632
28
#920, 640 – 5th Avenue SW
Calgary, AB T2P 3G4
www.inplayoil.com


