1 Abstract—Land surface deformation associated with groundwater overexploitation is a serious challenge for plain aquifers of Iran, particularly in semiarid and arid region. In the Greater Tehran area, the capital of Iran with a population of 14 million people, ground-water discharge has exceeded natural recharge over the last decades, causing significant drawdown of groundwater level and land subsidence. In this study we use 46 Envisat ASAR data acquired in descending (Track 378& 419) and ascending orbits (Track 414) between 2003 and 2007 to examine in detail the spatio-temporal pattern of land subsidence in Tehran. Index Terms—Envisat ASAR, Land Subsidence. I. INTRODUCTION and surface deformation induced by over extraction of underground water from aquifer systems has been documented in the literatures for various areas in the world (e.g., [1-4]). In recent years, with the growing population of metropolitan areas, there has been an increased demand for water supplies in order to meet municipal, industrial or irrigational needs. In confined aquifer systems, if continued groundwater discharge exceeds natural recharge, land subsidence may occur as a result of compaction of fine- grained materials [5]. The resulting land subsidence and associated earth fissuring may lead to significant economic loss and widespread damage for buildings, roads and infrastructures. Knowledge of spatial and temporal extent of land settlement affecting groundwater basins provides important information needed to establish effective measures to mitigate losses from ground subsidence hazard. Motagh et. al. (2008), using a few interferograms, presented a primarily analysis of the main features of land subsidence associated with extensive ground water depletion in the Tehran area [6]. Our objective here is to derive the temporal Manuscript received December 11, 2008. This work was supported in part by…… S. Alipour and M. Sharifi are with the Department of Surveying and Geomatics Engineering, University of Tehran, Iran (e-mail: alipour@gfz- potsdam.de; [email protected] ). M. Motagh and T.R. Walter are with German Research Centre for Geosciences (GFZ), Germany (email: [email protected]; twalter@gfz- potsdam.de). evolution of the subsidence area in Tehran using additional SAR data. For this we take the lead from previous studies, apply the interferometric technique for a dataset of 46 Envisat ASAR images in ascending and descending orbits (Fig. 1), make a network of suitable interferograms and generate deformation time-series using the least squares inversion approach. II. INSAR ANALYSIS Radar images of the study area are acquired by the European Space Agency Envisat spacecraft. The dataset includes 16 images from the ascending track 414, spanning the period between August 2004 and August 2007, 13 images from the descending track 378 for the time periods of October 2003 to November 2005, and 17 images from the descending track 314 covering July 2003 until August 2005. Fig. 1. Topography map of the area. Black boxes show satellite trajectories of radar images for ascending (track 414) and descending (tracks 378 and 419) orbits. Inset shows the location of the capital city of Tehran within Iran. Interferometric combinations of the images were carried out with the consideration of their spatial and temporal baselines. InSAR Time Series investigation of Land Subsidence due to Groundwater Overexploitation in Tehran, Iran S. Alipour, M. Motagh, M. Sharifi, and T. R. Walter L
Transcript
1
Abstract—Land surface deformation associated with
groundwater overexploitation is a serious challenge for plain aquifers of Iran, particularly in semiarid and arid region. In the Greater Tehran area, the capital of Iran with a population of 14 million people, ground-water discharge has exceeded natural recharge over the last decades, causing significant drawdown of groundwater level and land subsidence. In this study we use 46 Envisat ASAR data acquired in descending (Track 378& 419) and ascending orbits (Track 414) between 2003 and 2007 to examine in detail the spatio-temporal pattern of land subsidence in Tehran. Index Terms—Envisat ASAR, Land Subsidence.
I. INTRODUCTION and surface deformation induced by over extraction of underground water from aquifer systems has been
documented in the literatures for various areas in the world (e.g., [1-4]). In recent years, with the growing population of metropolitan areas, there has been an increased demand for water supplies in order to meet municipal, industrial or irrigational needs. In confined aquifer systems, if continued groundwater discharge exceeds natural recharge, land subsidence may occur as a result of compaction of fine-grained materials [5].
The resulting land subsidence and associated earth fissuring may lead to significant economic loss and widespread damage for buildings, roads and infrastructures.
Knowledge of spatial and temporal extent of land settlement affecting groundwater basins provides important information needed to establish effective measures to mitigate losses from ground subsidence hazard.
Motagh et. al. (2008), using a few interferograms, presented a primarily analysis of the main features of land subsidence associated with extensive ground water depletion in the Tehran area [6]. Our objective here is to derive the temporal
Manuscript received December 11, 2008. This work was supported in part by…… S. Alipour and M. Sharifi are with the Department of Surveying and Geomatics Engineering, University of Tehran, Iran (e-mail: [email protected]; [email protected] ).
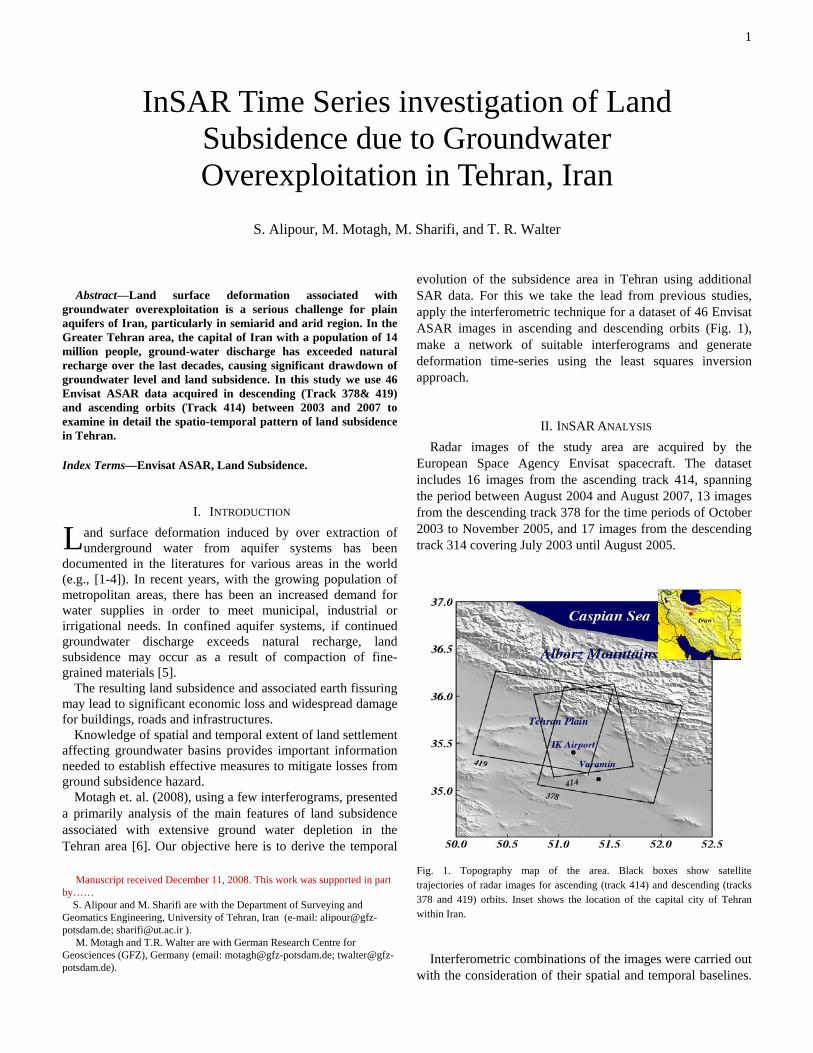
evolution of the subsidence area in Tehran using additional SAR data. For this we take the lead from previous studies, apply the interferometric technique for a dataset of 46 Envisat ASAR images in ascending and descending orbits (Fig. 1), make a network of suitable interferograms and generate deformation time-series using the least squares inversion approach.
II. INSAR ANALYSIS Radar images of the study area are acquired by the
European Space Agency Envisat spacecraft. The dataset includes 16 images from the ascending track 414, spanning the period between August 2004 and August 2007, 13 images from the descending track 378 for the time periods of October 2003 to November 2005, and 17 images from the descending track 314 covering July 2003 until August 2005.
Fig. 1. Topography map of the area. Black boxes show satellite trajectories of radar images for ascending (track 414) and descending (tracks 378 and 419) orbits. Inset shows the location of the capital city of Tehran within Iran.
Interferometric combinations of the images were carried out
with the consideration of their spatial and temporal baselines.
InSAR Time Series investigation of Land Subsidence due to Groundwater Overexploitation in Tehran, Iran
S. Alipour, M. Motagh, M. Sharifi, and T. R. Walter
L
2
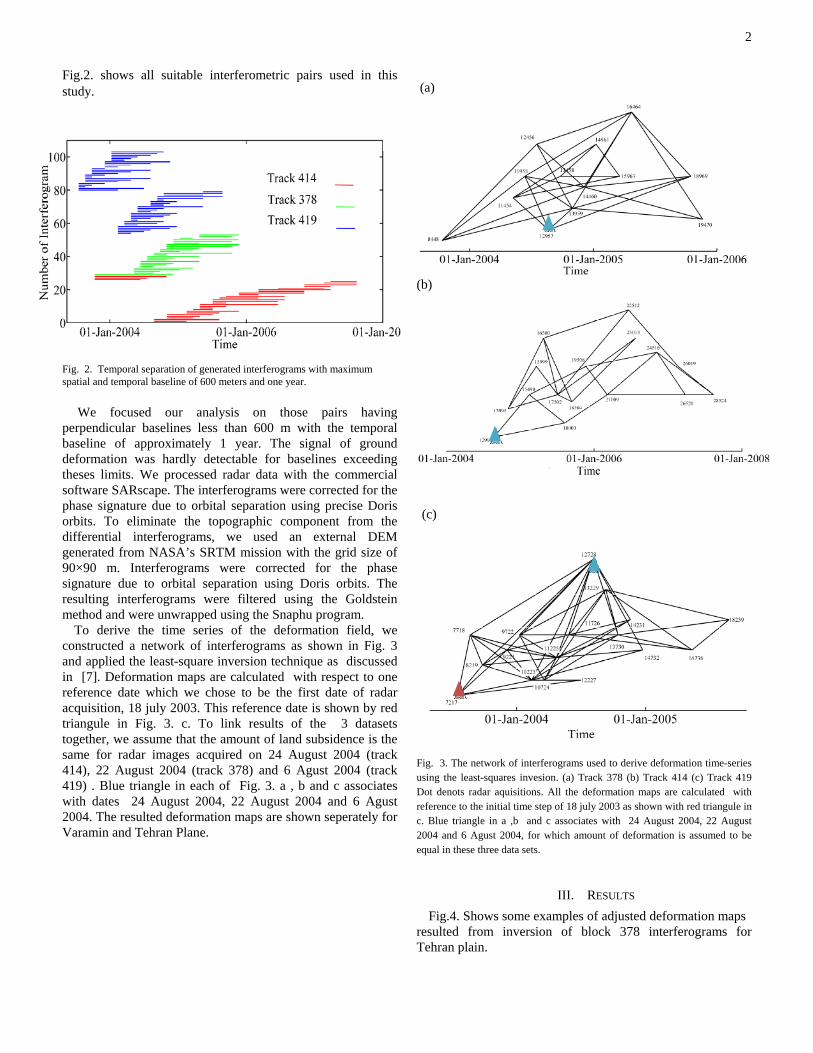
Fig.2. shows all suitable interferometric pairs used in this study.
Fig. 2. Temporal separation of generated interferograms with maximum spatial and temporal baseline of 600 meters and one year.
We focused our analysis on those pairs having perpendicular baselines less than 600 m with the temporal baseline of approximately 1 year. The signal of ground deformation was hardly detectable for baselines exceeding theses limits. We processed radar data with the commercial software SARscape. The interferograms were corrected for the phase signature due to orbital separation using precise Doris orbits. To eliminate the topographic component from the differential interferograms, we used an external DEM generated from NASA’s SRTM mission with the grid size of 90×90 m. Interferograms were corrected for the phase signature due to orbital separation using Doris orbits. The resulting interferograms were filtered using the Goldstein method and were unwrapped using the Snaphu program.
To derive the time series of the deformation field, we constructed a network of interferograms as shown in Fig. 3 and applied the least-square inversion technique as discussed in [7]. Deformation maps are calculated with respect to one reference date which we chose to be the first date of radar acquisition, 18 july 2003. This reference date is shown by red triangule in Fig. 3. c. To link results of the 3 datasets together, we assume that the amount of land subsidence is the same for radar images acquired on 24 August 2004 (track 414), 22 August 2004 (track 378) and 6 Agust 2004 (track 419) . Blue triangle in each of Fig. 3. a , b and c associates with dates 24 August 2004, 22 August 2004 and 6 Agust 2004. The resulted deformation maps are shown seperately for Varamin and Tehran Plane.
(a)
(b)
(c)
Fig. 3. The network of interferograms used to derive deformation time-series using the least-squares invesion. (a) Track 378 (b) Track 414 (c) Track 419 Dot denots radar aquisitions. All the deformation maps are calculated with reference to the initial time step of 18 july 2003 as shown with red triangule in c. Blue triangle in a ,b and c associates with 24 August 2004, 22 August 2004 and 6 Agust 2004, for which amount of deformation is assumed to be equal in these three data sets.
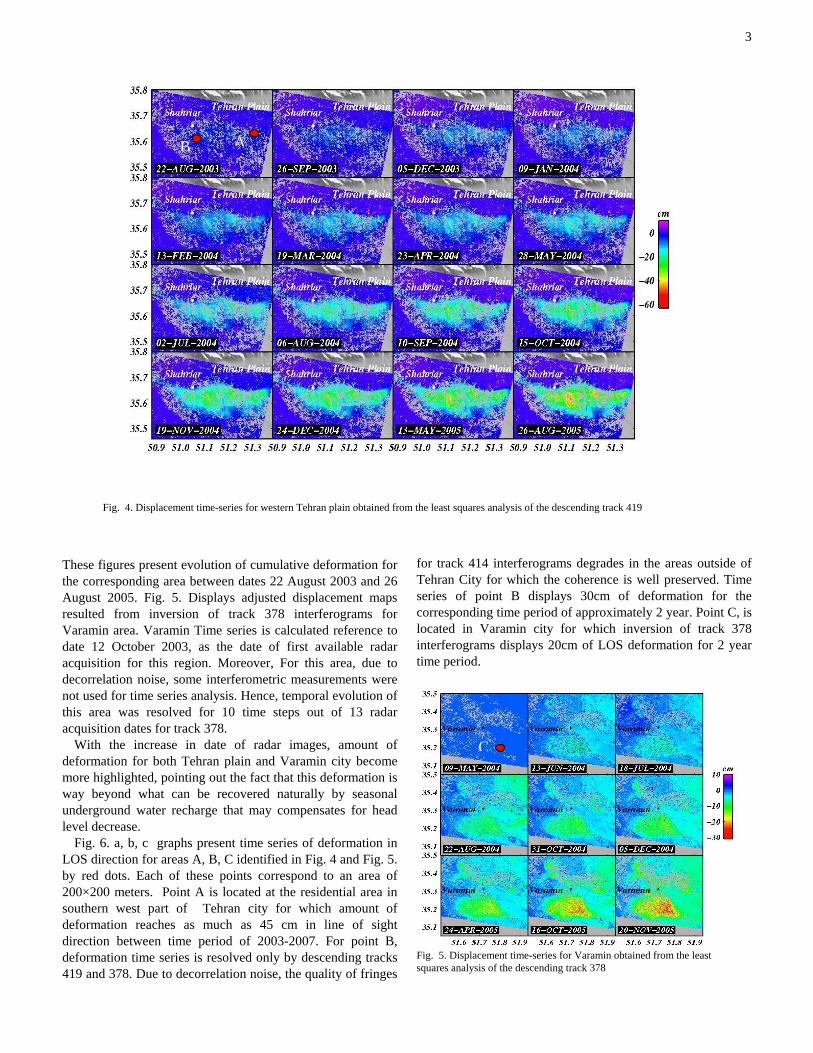
III. RESULTS Fig.4. Shows some examples of adjusted deformation maps
resulted from inversion of block 378 interferograms for Tehran plain.
3
These figures present evolution of cumulative deformation for the corresponding area between dates 22 August 2003 and 26 August 2005. Fig. 5. Displays adjusted displacement maps resulted from inversion of track 378 interferograms for Varamin area. Varamin Time series is calculated reference to date 12 October 2003, as the date of first available radar acquisition for this region. Moreover, For this area, due to decorrelation noise, some interferometric measurements were not used for time series analysis. Hence, temporal evolution of this area was resolved for 10 time steps out of 13 radar acquisition dates for track 378.
With the increase in date of radar images, amount of deformation for both Tehran plain and Varamin city become more highlighted, pointing out the fact that this deformation is way beyond what can be recovered naturally by seasonal underground water recharge that may compensates for head level decrease.
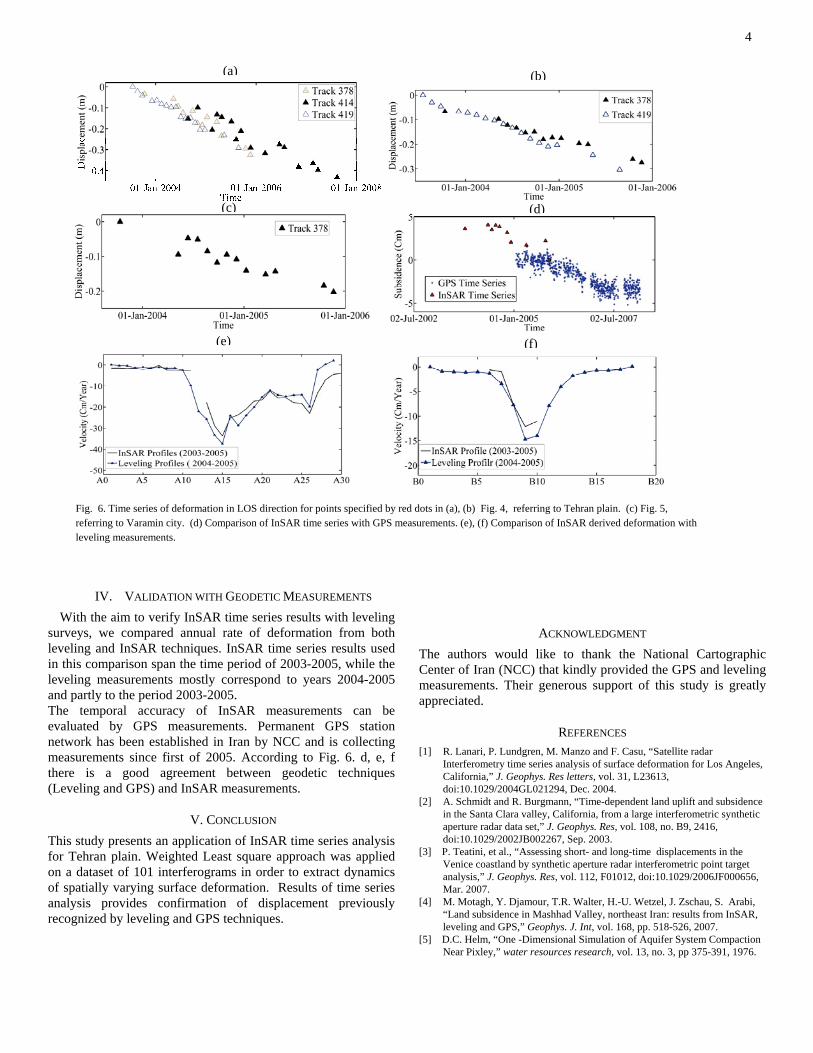
Fig. 6. a, b, c graphs present time series of deformation in LOS direction for areas A, B, C identified in Fig. 4 and Fig. 5. by red dots. Each of these points correspond to an area of 200×200 meters. Point A is located at the residential area in southern west part of Tehran city for which amount of deformation reaches as much as 45 cm in line of sight direction between time period of 2003-2007. For point B, deformation time series is resolved only by descending tracks 419 and 378. Due to decorrelation noise, the quality of fringes
for track 414 interferograms degrades in the areas outside of Tehran City for which the coherence is well preserved. Time series of point B displays 30cm of deformation for the corresponding time period of approximately 2 year. Point C, is located in Varamin city for which inversion of track 378 interferograms displays 20cm of LOS deformation for 2 year time period.
Fig. 5. Displacement time-series for Varamin obtained from the least squares analysis of the descending track 378
Fig. 4. Displacement time-series for western Tehran plain obtained from the least squares analysis of the descending track 419
B A
C
4
IV. VALIDATION WITH GEODETIC MEASUREMENTS With the aim to verify InSAR time series results with leveling
surveys, we compared annual rate of deformation from both leveling and InSAR techniques. InSAR time series results used in this comparison span the time period of 2003-2005, while the leveling measurements mostly correspond to years 2004-2005 and partly to the period 2003-2005. The temporal accuracy of InSAR measurements can be evaluated by GPS measurements. Permanent GPS station network has been established in Iran by NCC and is collecting measurements since first of 2005. According to Fig. 6. d, e, f there is a good agreement between geodetic techniques (Leveling and GPS) and InSAR measurements.
V. CONCLUSION This study presents an application of InSAR time series analysis for Tehran plain. Weighted Least square approach was applied on a dataset of 101 interferograms in order to extract dynamics of spatially varying surface deformation. Results of time series analysis provides confirmation of displacement previously recognized by leveling and GPS techniques.
ACKNOWLEDGMENT The authors would like to thank the National Cartographic Center of Iran (NCC) that kindly provided the GPS and leveling measurements. Their generous support of this study is greatly appreciated.
REFERENCES [1] R. Lanari, P. Lundgren, M. Manzo and F. Casu, “Satellite radar
Interferometry time series analysis of surface deformation for Los Angeles, California,” J. Geophys. Res letters, vol. 31, L23613, doi:10.1029/2004GL021294, Dec. 2004.
[2] A. Schmidt and R. Burgmann, “Time-dependent land uplift and subsidence in the Santa Clara valley, California, from a large interferometric synthetic aperture radar data set,” J. Geophys. Res, vol. 108, no. B9, 2416, doi:10.1029/2002JB002267, Sep. 2003.
[3] P. Teatini, et al., “Assessing short- and long-time displacements in the Venice coastland by synthetic aperture radar interferometric point target analysis,” J. Geophys. Res, vol. 112, F01012, doi:10.1029/2006JF000656, Mar. 2007.
[4] M. Motagh, Y. Djamour, T.R. Walter, H.-U. Wetzel, J. Zschau, S. Arabi, “Land subsidence in Mashhad Valley, northeast Iran: results from InSAR, leveling and GPS,” Geophys. J. Int, vol. 168, pp. 518-526, 2007.
[5] D.C. Helm, “One -Dimensional Simulation of Aquifer System Compaction Near Pixley,” water resources research, vol. 13, no. 3, pp 375-391, 1976.
Fig. 6. Time series of deformation in LOS direction for points specified by red dots in (a), (b) Fig. 4, referring to Tehran plain. (c) Fig. 5, referring to Varamin city. (d) Comparison of InSAR time series with GPS measurements. (e), (f) Comparison of InSAR derived deformation with leveling measurements.
(a) (b)
(c) (d)
(f)(e)
5[6] M. Motagh, et al., “Land subsidence in Iran caused by widespread water
reservoir overexploitation,” J. Geophys. Res letters, vol. 35, L16403, doi:10.1029/2008GL033814, 2008.
[7] Usai. S, “A least squares database approach for SAR interferometric data,” IEEE Trans. Geosciences and Remote Sensing, vol. 41, pp. 753-760, no. 4, April. 2003.