31
Insecticides India Ltd(IIL) -Inlicensing initiativesto drive growth
Insecticides India Ltd(IIL) -Inlicensing initiativesto drive growth

Content Index
•Insecticides India Limited – Investment Snapshot :- Slide #3
•Agrochemical Industry – An Overview:- Slide #5
•Investment Arguments :- Slide #16
•P&L - Slide #29
•Concerns & Reasoning :- Slide #30
Insecticides India– Investment Snapshot (as on Feb 15, 2016)
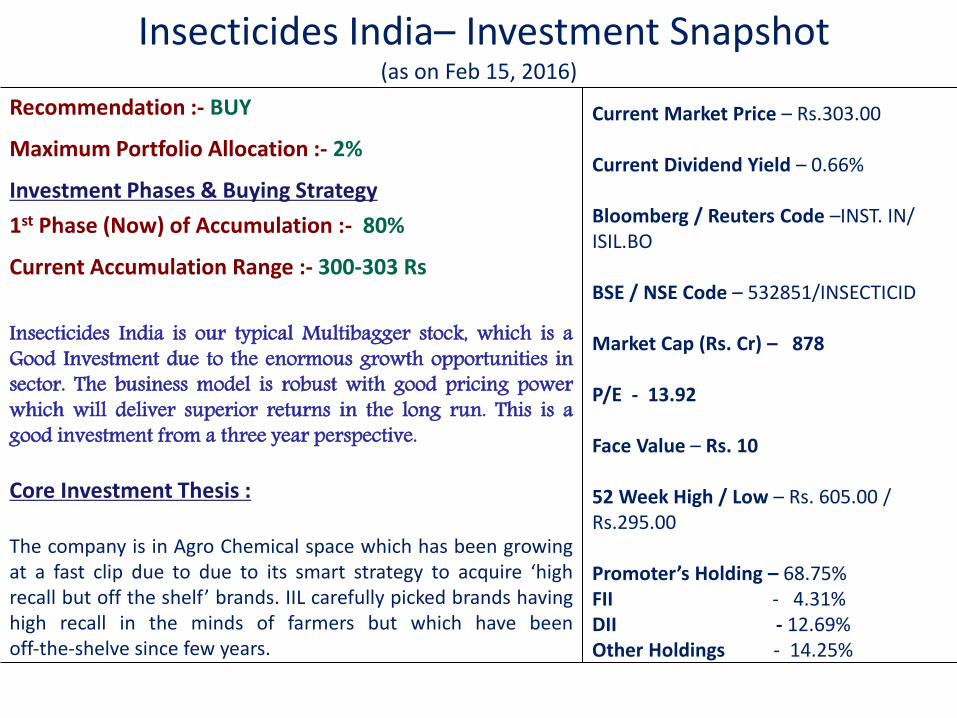
Recommendation :- BUY
Maximum Portfolio Allocation :- 2%
Investment Phases & Buying Strategy
1st Phase (Now) of Accumulation :- 80%
Current Accumulation Range :- 300-303 Rs
Insecticides India is our typical Multibagger stock, which is a
Good Investment due to the enormous growth opportunities in
sector. The business model is robust with good pricing power
which will deliver superior returns in the long run. This is a
good investment from a three year perspective.
Core Investment Thesis :
The company is in Agro Chemical space which has been growing
at a fast clip due to due to its smart strategy to acquire high
recall but off the shelf brands. IIL carefully picked brands having
high recall in the minds of farmers but which have been
off‐the‐shel e since few years.
Current Market Price – Rs.303.00
Current Dividend Yield – 0.66%
Bloomberg / Reuters Code –INST. IN/
ISIL.BO
BSE / NSE Code – 532851/INSECTICID
Market Cap (Rs. Cr) – 878
P/E - 13.92
Face Value – Rs. 10
52 Week High / Low – Rs. 605.00 /
Rs.295.00
Pro oter’s Holdi g – 68.75%
FII - 4.31%
DII - 12.69%
Other Holdings - 14.25%
Key Investment Highlights
1.) Presence in a growing segment :- Company caters to the Agrochemical Industry which has been growing
rapidly which provides immense opportunities to the companies in the sector.
2)New Products to drive growth- Company is all set to launch new products in FY16 and FY17 which will
enable the company to drive growth.
3.) Strong Pricing Power :- Company has strong pricing power which will increase is realizations and
profitability
4.) Growing Utilizations:- The companies utilizations has been around 51% which is likely to improve in FY16
and FY17 thereby improving its top-line and bottom-line.
5) Established Brands :- The company has picked brands having high recall in the minds of farmers but which
ha e een off‐the‐shel e sin e fe years.
6.) In-house Manufacturing :- Company has an in-house manufacturing facility which manufactures the
products of the company.
7.) Strong Distribution Network- Company has strong distribution network which comprises of over 5,000
distributors with pan-India
8) Increase in Disposable Income:- The company is likely to benefit from rising disposable income due to
increase in minimum support prices which will increase the spend on agrochemicals.
9.) Management/ Corporate Governance :- The company has a good management and adhere to strong
corporate governance norms. The company is run professionally by a team of professionals who have a
strong understanding of the business and have a strong vision about its business.
10.) Valuations :- In spite of so many advantages, the company is quoting at reasonable valuations for the
which has a strong operating performance and provides revenue visibility.

Industry Opportunity & Potential
- An Overview
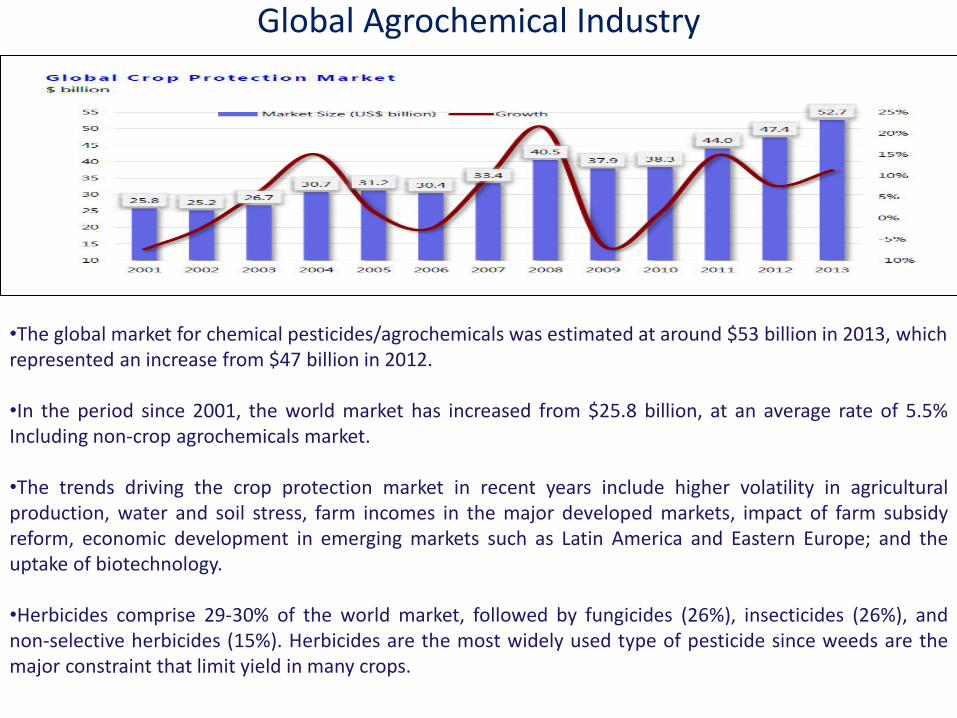
Global Agrochemical Industry
•The global market for chemical pesticides/agrochemicals was estimated at around $53 billion in 2013, which
represented an increase from $47 billion in 2012.
•In the period since 2001, the world market has increased from $25.8 billion, at an average rate of 5.5%
Including non-crop agrochemicals market.
•The trends driving the crop protection market in recent years include higher volatility in agricultural
production, water and soil stress, farm incomes in the major developed markets, impact of farm subsidy
reform, economic development in emerging markets such as Latin America and Eastern Europe; and the
uptake of biotechnology.
•Herbicides comprise 29-30% of the world market, followed by fungicides (26%), insecticides (26%), and
non-selective herbicides (15%). Herbicides are the most widely used type of pesticide since weeds are the
major constraint that limit yield in many crops.
Indian Agrochemical Industry
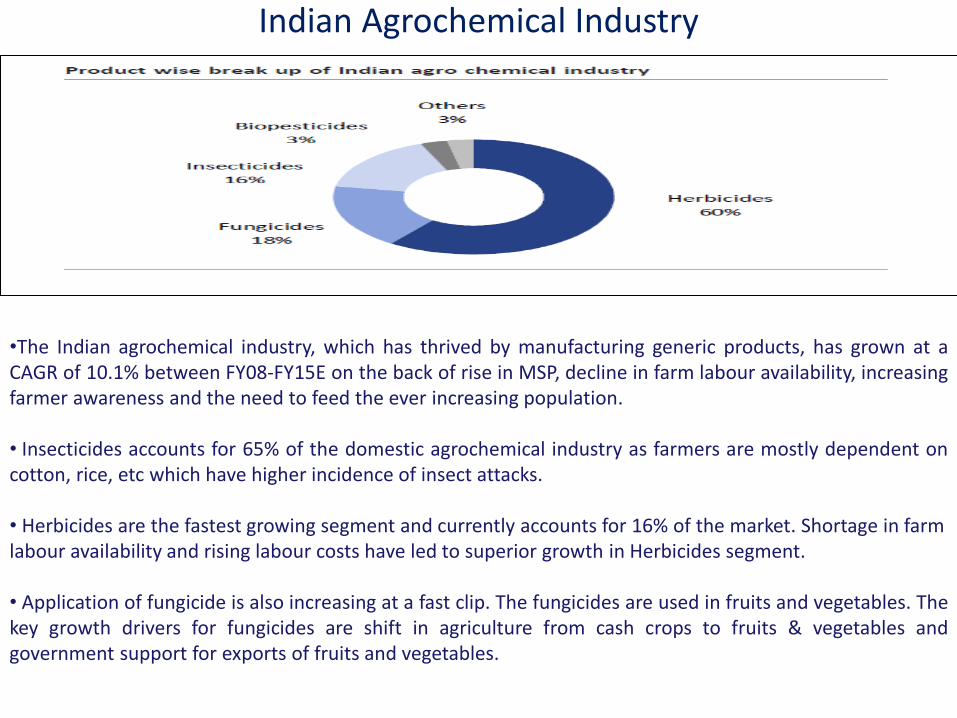
•The Indian agrochemical industry, which has thrived by manufacturing generic products, has grown at a
CAGR of 10.1% between FY08-FY15E on the back of rise in MSP, decline in farm labour availability, increasing
farmer awareness and the need to feed the ever increasing population.
• Insecticides accounts for 65% of the domestic agrochemical industry as farmers are mostly dependent on
cotton, rice, etc which have higher incidence of insect attacks.
• Herbicides are the fastest growing segment and currently accounts for 16% of the market. Shortage in farm
labour availability and rising labour costs have led to superior growth in Herbicides segment.
• Application of fungicide is also increasing at a fast clip. The fungicides are used in fruits and vegetables. The
key growth drivers for fungicides are shift in agriculture from cash crops to fruits & vegetables and
government support for exports of fruits and vegetables.

Product Wise Break Up - Global Market
• The agrochemical market globally is dominated by generic products which account for ~50-60% of the
market. Rest of the market is divided between Proprietary and Proprietary Off-Patent molecules in the ratio
of 55:45.
•In terms of value , generic companies make ~32% of total sales whereas patented and proprietary off-
patent products make up 23% and 45% of total industry sales respectively.
•Herbicides are the most widely used agrochemical products globally, followed by insecticides and
fungicides. Fungicides are the highest growing segments as apart from increasing yields, it also improves
quality and helps in seed treatment.
•Insecticides are more prevalent in Asian countries due to higher growth of cotton, cereal, fruits and
vegetables in these regions which have higher incidence of insect attacks.
Product Wise Break Up - Indian Market
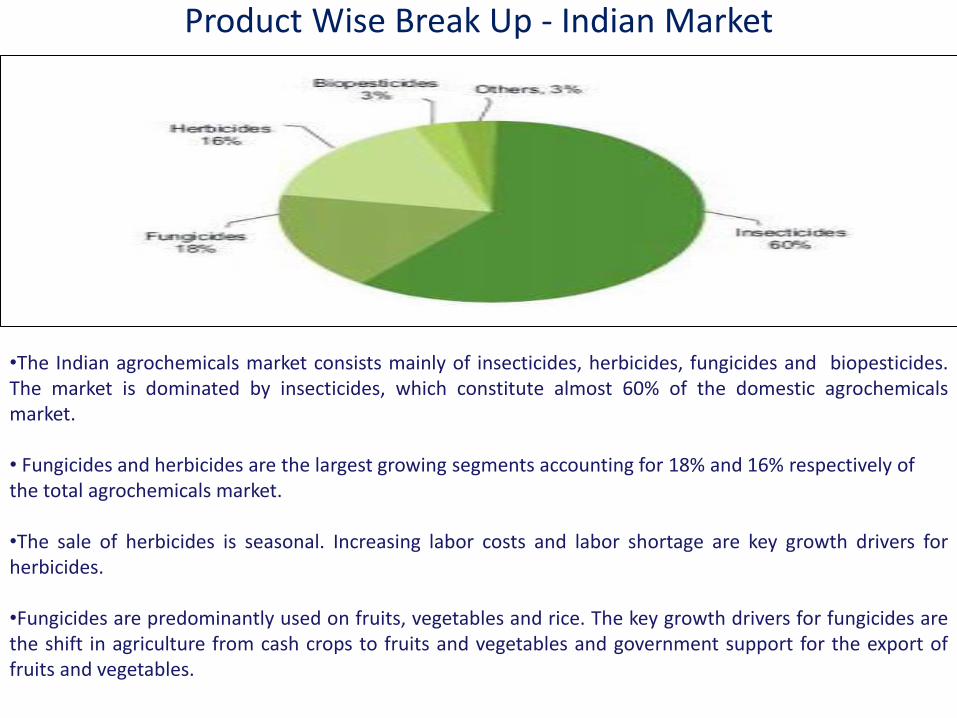
•The Indian agrochemicals market consists mainly of insecticides, herbicides, fungicides and biopesticides.
The market is dominated by insecticides, which constitute almost 60% of the domestic agrochemicals
market.
• Fungicides and herbicides are the largest growing segments accounting for 18% and 16% respectively of
the total agrochemicals market.
•The sale of herbicides is seasonal. Increasing labor costs and labor shortage are key growth drivers for
herbicides.
•Fungicides are predominantly used on fruits, vegetables and rice. The key growth drivers for fungicides are
the shift in agriculture from cash crops to fruits and vegetables and government support for the export of
fruits and vegetables.
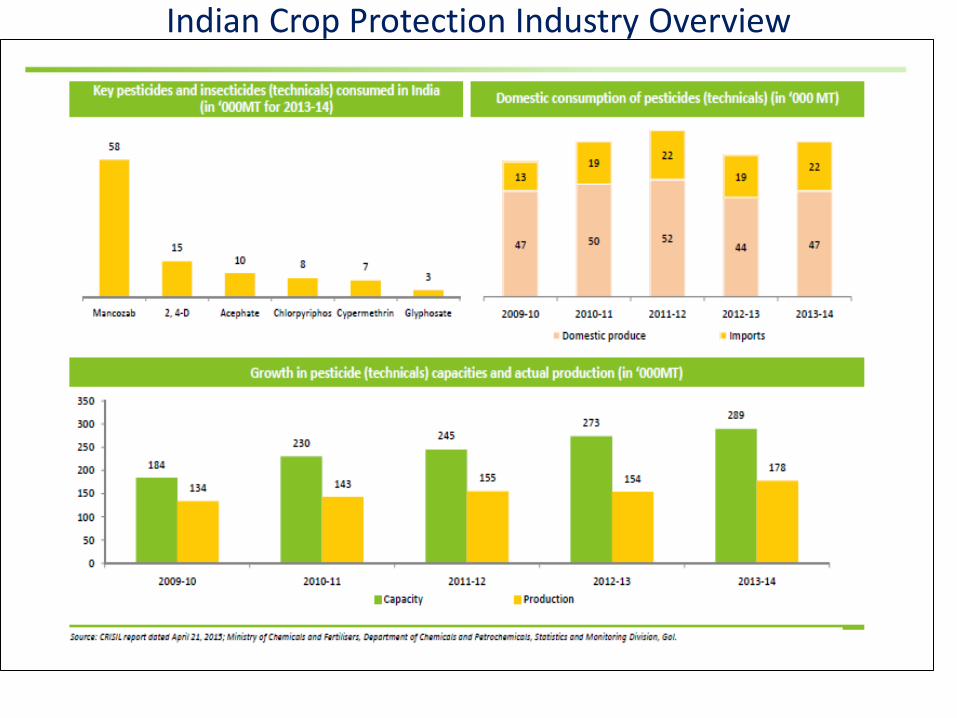
Indian Crop Protection Industry Overview

Industry Value Chain
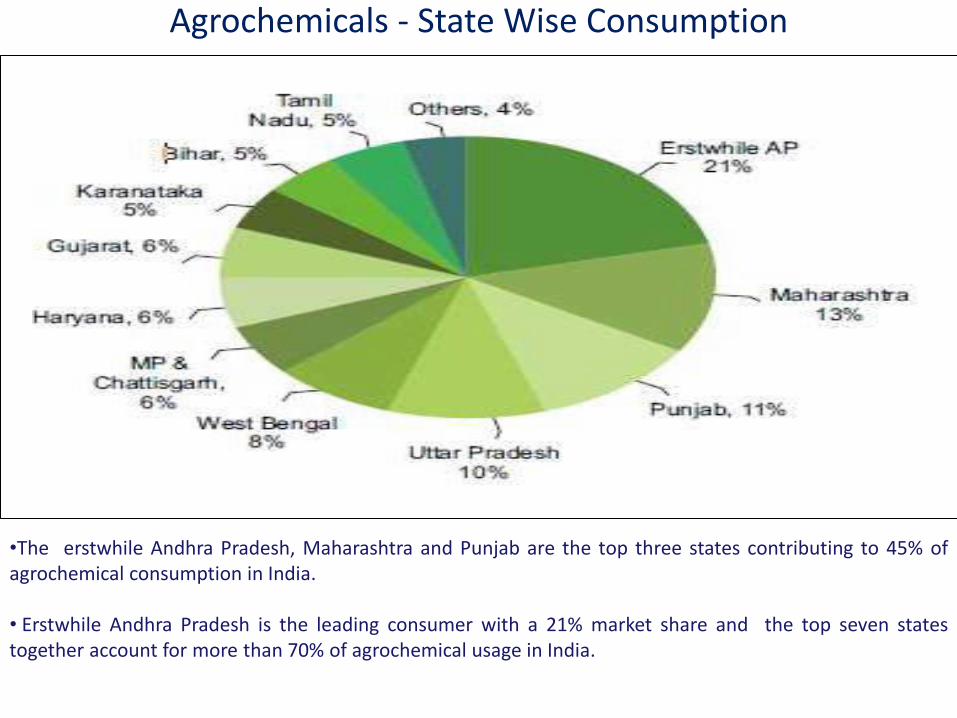
Agrochemicals - State Wise Consumption
•The erstwhile Andhra Pradesh, Maharashtra and Punjab are the top three states contributing to 45% of
agrochemical consumption in India.
• Erstwhile Andhra Pradesh is the leading consumer with a 21% market share and the top seven states
together account for more than 70% of agrochemical usage in India.
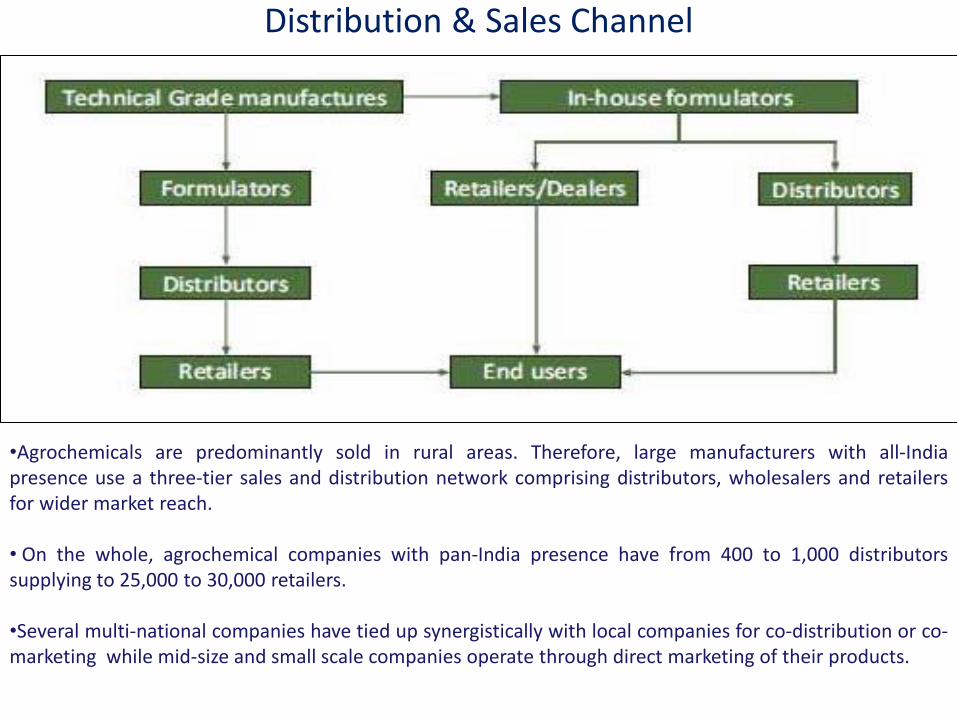
Distribution & Sales Channel
•Agrochemicals are predominantly sold in rural areas. Therefore, large manufacturers with all-India
presence use a three-tier sales and distribution network comprising distributors, wholesalers and retailers
for wider market reach.
• On the whole, agrochemical companies with pan-India presence have from 400 to 1,000 distributors
supplying to 25,000 to 30,000 retailers.
•Several multi-national companies have tied up synergistically with local companies for co-distribution or co-
marketing while mid-size and small scale companies operate through direct marketing of their products.

Global Off-Patent Opportunity
•The global Agrochemicals worth $ 9.3 bn are expected to go off-patent by 2020 which provides immense
opportunities for generic players.
•Globally, percentage share of generic products have increased from 33% in 2000 to 52% in 2013. The
patented products share has reduced from 30% to 22% in the same period while the rest (26%) is
constituted by proprietary off-patent products.
•The decrease in the share of patented products significant opportunity to Indian companies as
manufacturing is likely to move to emerging markets like India and Indian companies can roll out off patent
products both in the domestic and export markets.
•Global MNCs are also looking to forge alliances with Indian companies as India provides adequate IP
protection, huge untapped market and low cost manufacturing.

Export Opportunities
•The export of agrochemicals from India has seen a strong growth over the last few years with India being
the thirteenth largest exporter of agrochemicals.
•The key growth drivers are India's capability in low cost manufacturing, availability of technically trained
manpower, seasonal domestic demand, overcapacity, better price realization globally and strong presence in
generic agrochemical manufacturing.
•Exports are expected to grow at approximately 10% in the medium term due to better intellectual property
protection for products and improved cost structure.
•In order to build a strong export base, companies will be required to set up marketing offices in association
with domestic players in export geographies.

IIL – Investment Arguments
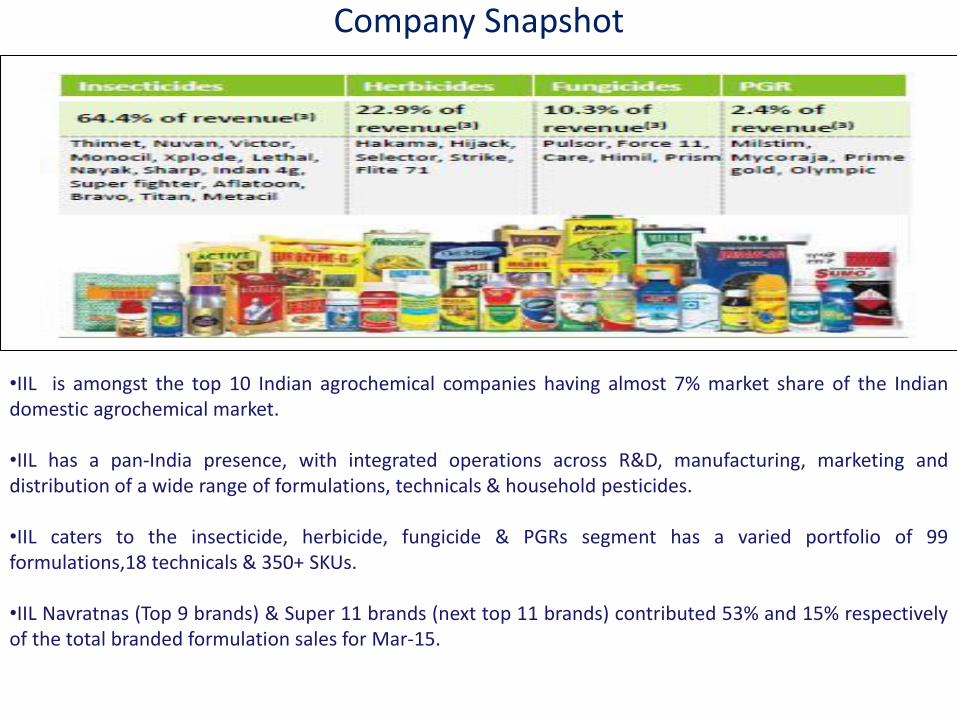
Company Snapshot
•IIL is amongst the top 10 Indian agrochemical companies having almost 7% market share of the Indian
domestic agrochemical market.
•IIL has a pan-India presence, with integrated operations across R&D, manufacturing, marketing and
distribution of a wide range of formulations, technicals & household pesticides.
•IIL caters to the insecticide, herbicide, fungicide & PGRs segment has a varied portfolio of 99
formulations,18 technicals & 350+ SKUs.
•IIL Navratnas (Top 9 brands) & Super 11 brands (next top 11 brands) contributed 53% and 15% respectively
of the total branded formulation sales for Mar-15.
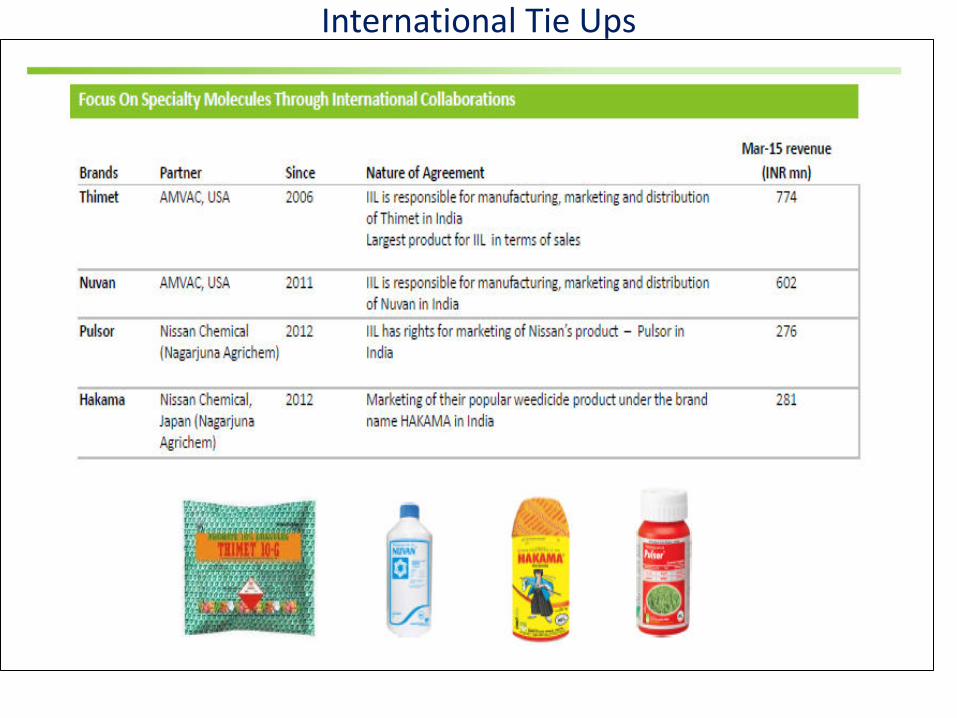
International Tie Ups

Established Brands
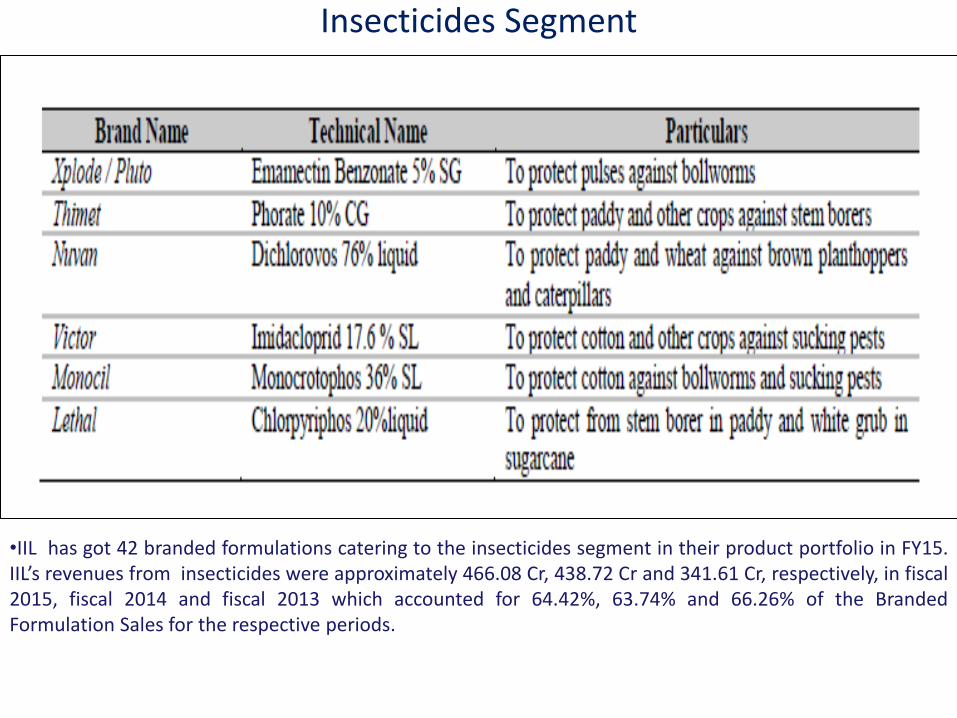
Insecticides Segment
•IIL has got 42 branded formulations catering to the insecticides segment in their product portfolio in FY15.
IIL s revenues from insecticides were approximately 466.08 Cr, 438.72 Cr and 341.61 Cr, respectively, in fiscal
2015, fiscal 2014 and fiscal 2013 which accounted for 64.42%, 63.74% and 66.26% of the Branded
Formulation Sales for the respective periods.

Herbicides Segment
•IIL has got 24 branded formulations catering to the herbicides segment in their product portfolio. The net
revenue from herbicides were approximately ` 165.74.Cr, ` 170.38 Cr and ` 115.48 Cr, respectively, in fiscal
2015, fiscal 2014 and fiscal 2013, which was 22.91%, 24.75% and 22.40% of the Branded Formulation Sales
for the respective periods.
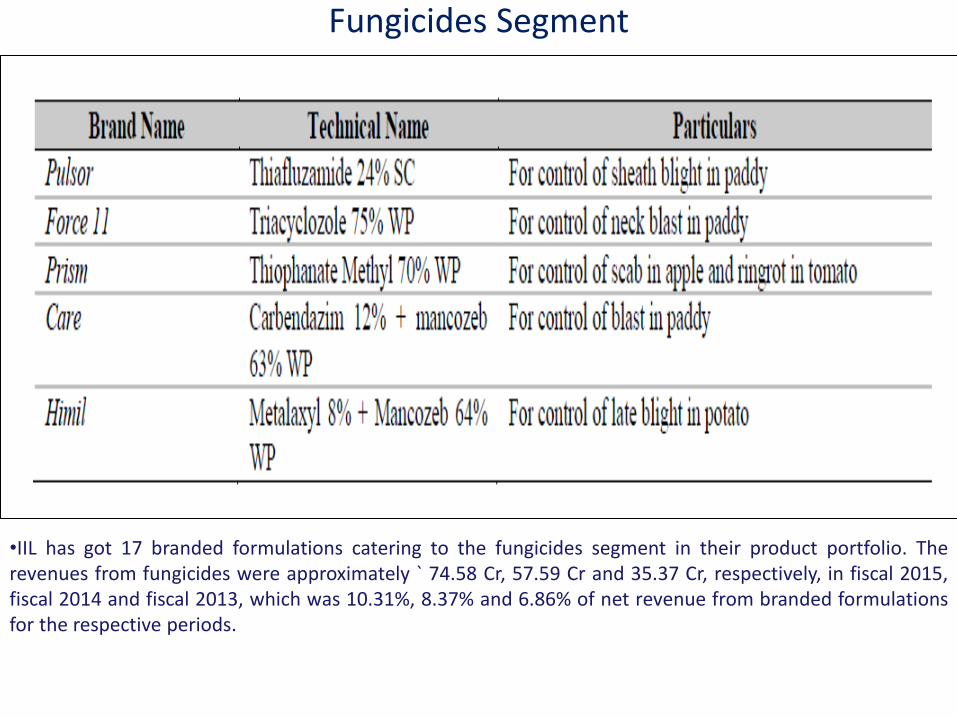
Fungicides Segment
•IIL has got 17 branded formulations catering to the fungicides segment in their product portfolio. The
revenues from fungicides were approximately ` 74.58 Cr, 57.59 Cr and 35.37 Cr, respectively, in fiscal 2015,
fiscal 2014 and fiscal 2013, which was 10.31%, 8.37% and 6.86% of net revenue from branded formulations
for the respective periods.
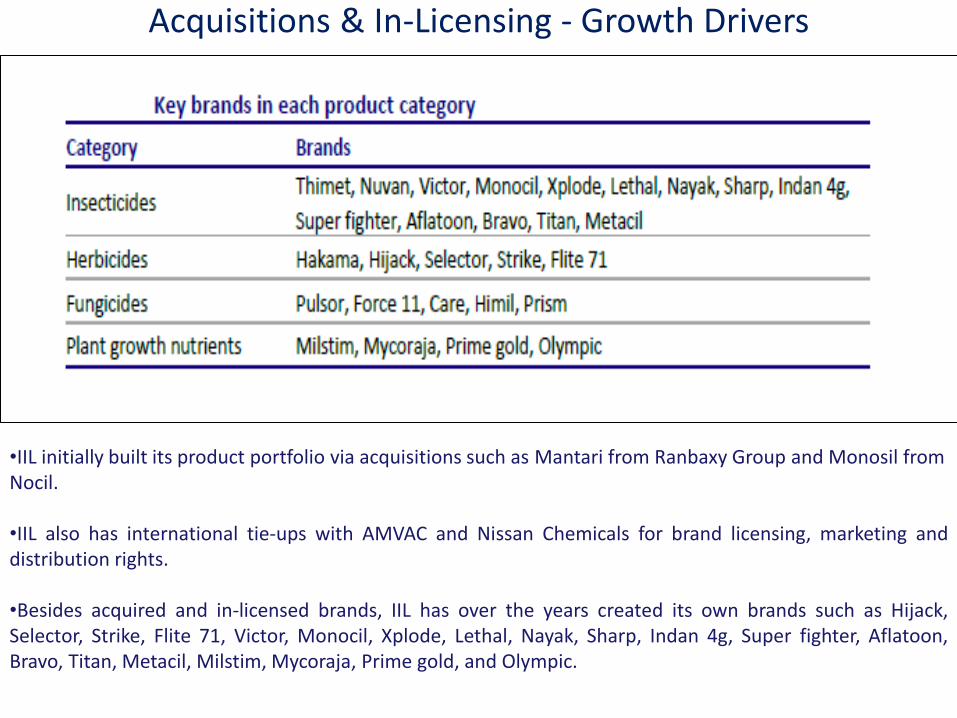
Acquisitions & In-Licensing - Growth Drivers
•IIL initially built its product portfolio via acquisitions such as Mantari from Ranbaxy Group and Monosil from
Nocil.
•IIL also has international tie-ups with AMVAC and Nissan Chemicals for brand licensing, marketing and
distribution rights.
•Besides acquired and in-licensed brands, IIL has over the years created its own brands such as Hijack,
Selector, Strike, Flite 71, Victor, Monocil, Xplode, Lethal, Nayak, Sharp, Indan 4g, Super fighter, Aflatoon,
Bravo, Titan, Metacil, Milstim, Mycoraja, Prime gold, and Olympic.
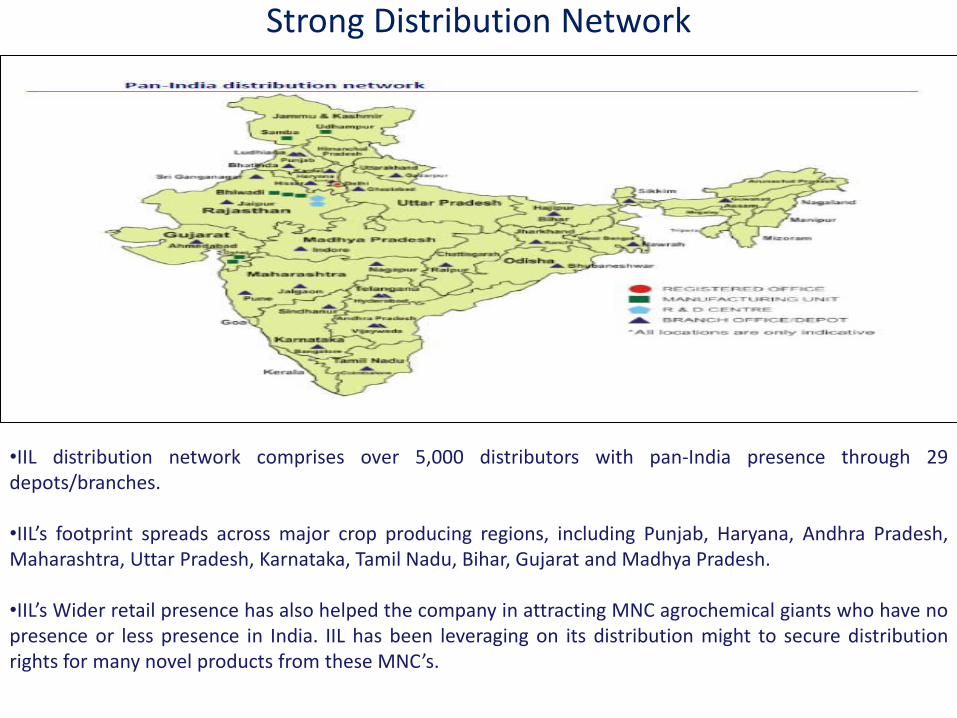
Strong Distribution Network
•IIL distribution network comprises over 5,000 distributors with pan-India presence through 29
depots/branches.
•IIL s footprint spreads across major crop producing regions, including Punjab, Haryana, Andhra Pradesh,
Maharashtra, Uttar Pradesh, Karnataka, Tamil Nadu, Bihar, Gujarat and Madhya Pradesh.
•IIL s Wider retail presence has also helped the company in attracting MNC agrochemical giants who have no
presence or less presence in India. IIL has been leveraging on its distribution might to secure distribution
rights for many novel products from these MNC s.

Focus - Navratna & Super-11
•ILL s Navratnas (the top 9 brands) and Super 11 (the next top 11 brands) contribute 53% and 15%,
respectively, to revenues of the total branded formulation sales.
• To better focus on larger brands, ILL has been phasing out smaller brands and has reduced its portfolio by
21 over the last three years.
•ILL currently has a portfolio of 99 brands under branded formulations. With this, the revenue share of the
top 20 brands (Navratna + Super 11) has improved from 50.8% to 68.6% over FY12-15.
•ILL s management plans to reduce the number of brands to 75 over the next 2 years, thus improving the
revenue contribution from the top 20 brands to ~78.7%.

Increasing Capacity Utilizations
•ILL forayed into technicals business to reduce dependence on imported raw materials, capitalize on earning
margins in technicals value chain as well, and for backward integration of its formulations business.
• IIL commissioned INR2.5b capex over FY11-15, adding 10,000 MTPA technical capacity and 14,500 MTPA
formulations capacity at Dahej, adding 20,000 MTPA formulations capacity at Chopanki (Rajasthan) in FY15
and adding 2600 MTPA formulations unit at Udhampur (Jammu and Kashmir).
•ILL faced teething problems with the Dahej technical facility, which impacted margins in FY14. However,
INST overcame those problems and ensured higher utilization of 51% in FY15 at the facility.
•ILL is currently utilizing capacities at 65%, which will suffice to cater growth till FY18/19 thus entailing
minimal capex.

Strong R&D
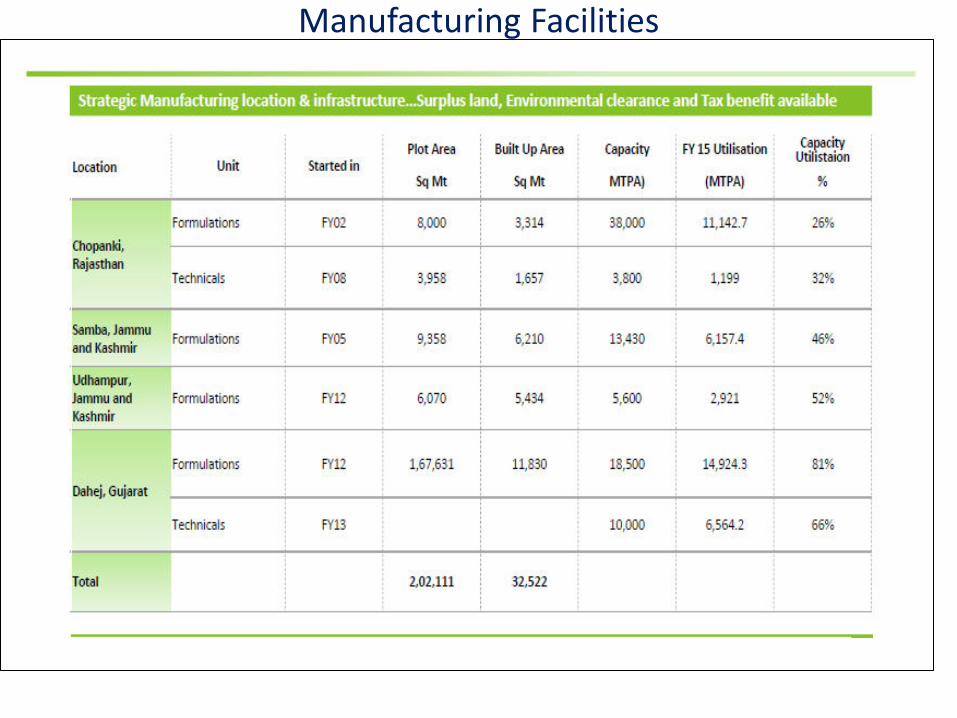
Manufacturing Facilities
Earnings Projection – P&L Account
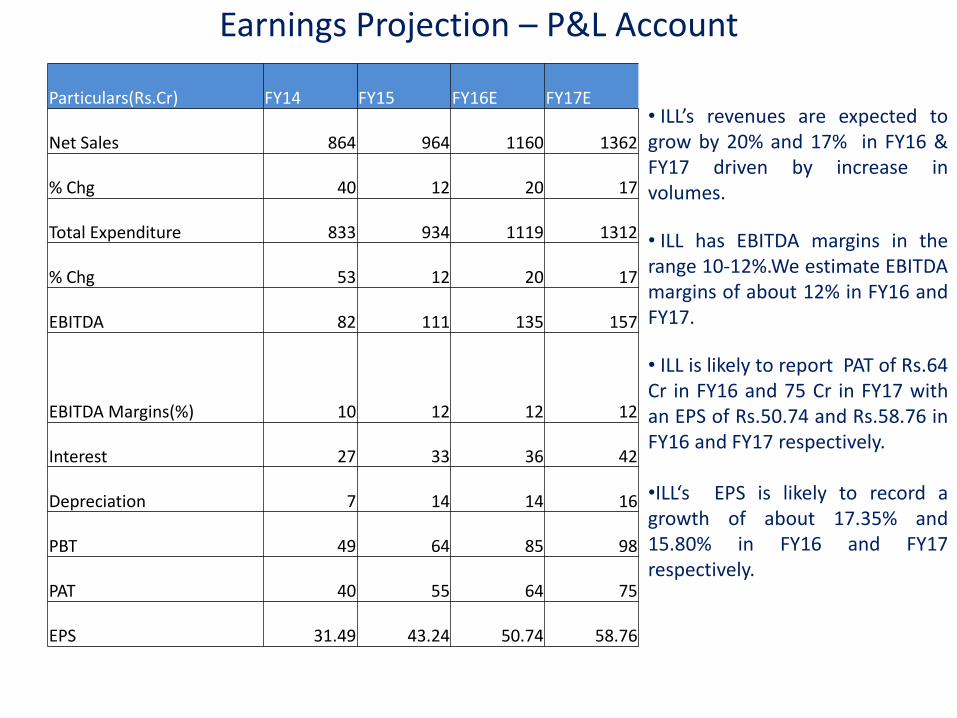
• ILL s revenues are expected to
grow by 20% and 17% in FY16 &
FY17 driven by increase in
volumes.
• ILL has EBITDA margins in the
range 10-12%.We estimate EBITDA
margins of about 12% in FY16 and
FY17.
• ILL is likely to report PAT of Rs.64
Cr in FY16 and 75 Cr in FY17 with
an EPS of Rs.50.74 and Rs.58.76 in
FY16 and FY17 respectively.
•ILL s EPS is likely to record a
growth of about 17.35% and
15.80% in FY16 and FY17
respectively.
Particulars(Rs.Cr) FY14 FY15 FY16E FY17E
Net Sales 864 964 1160 1362
% Chg 40 12 20 17
Total Expenditure 833 934 1119 1312
% Chg 53 12 20 17
EBITDA 82 111 135 157
EBITDA Margins(%) 10 12 12 12
Interest 27 33 36 42
Depreciation 7 14 14 16
PBT 49 64 85 98
PAT 40 55 64 75
EPS 31.49 43.24 50.74 58.76
Concerns & Reasoning
1.) Monsoon Failure :
Unfavorable monsoon is the biggest risk for the domestic agrochemical sector. Delayed or deficient rainfall
results in sales return and, thus, negatively impacts growth. Similarly, unseasonal rainfall can damage
standing crops, resulting in income loss for farmers.
2.) Lower prices of agricultural produce :
With Decline in prices of agricultural commodities or lower minimum support price can reduce farm incomes
and, consequently, demand for agri-inputs. Unlike fertilizers, prices of agrochemicals are not subsidized and
farmers may choose to decrease their purchase of agrochemicals to lower their production cost.
3.) Delay in getting new product approvals:
Registration of pesticides is a time-consuming process in India. It can take 2‐4 years to launch a new
molecule. Delay in getting approvals could lead to loss of potential profit opportunity in that product.
4.) Forex Risk :
Imported raw materials constitute 30% of the total raw materials, thus exposing it to fluctuations in foreign
exchange. The management plans to increase exports, which will act as a natural hedge.

THANK YOU


