Page 1
Copyright © 2011 Rockwell Automation, Inc. All rights reserved.
Insert Photo Here
Rockwell Automation
Process Solutions User Group (PSUG)
November 14-15, 2011
Chicago, IL – McCormick Place West
Robert Rice
Vice President, Engineering
Performance Monitoring FundamentalsDemystifying PID Controller Performance Assessment Techniques
Page 2
Outline
• General Information - Industry Challenges and Opportunities
• Breakdown of Control Loop Performance Methods
• Typical Performance Metrics Related to
– Controller Response
– Mechanical Issues
– Process/Interaction Issues
• Available Tools
– Case Study Using PlantESP™
Page 3
United States
national
policy to implement
Cap-and-Trade
program for CO2
emissions
Increased Regulation
Under-Performing Investments
Dwindling Resources
Increased Costs
Increased Regulation
� Governmental bodies
legislating higher levels of
control through reduced
emissions on other
production-related waste
restrictions
� Documentation of process
performance and adherence
to production specifications
increasing across the
process industries
� Tighter regulatory controls
resulting in higher and more
frequent fines for
manufacturers
General InformationIndustry Challenges and Opportunities
Page 4
“If 30% of the loops
are operating
inefficiently in
automatic, the annual
opportunity cost
would be $350,000.”
Increased Regulation
Under-Performing Investments
Dwindling Resources
Increased Costs
Underperforming
Investments1
� 70% of PID controllers are
typically operating in
automatic mode
� 85% of those controllers are
operating inefficiently
� 65% of controllers are poorly
tuned or de-tuned to mask
control-related problems
� 20% of control systems are
not properly configured to
meet the control system
objectives
1 Mark Schneider and Andrea Wirth, “Light at the End of the Tunnel”
General InformationIndustry Challenges and Opportunities
Page 5
Statistics from the
U.S. Department of
Labor for 2000-2003
shows a 23% decrease
in production workers
across all segments
of the process
industries.
Increased Regulation
Under-Performing Investments
Dwindling Resources
Increased Costs
Dwindling Resources
� Economic and technological factors demand that plants become increasingly efficient through the use of automation
� The average factory operates PID control loops that number in the 100s
� The time to tune PID controllers ranges from minutes to days depending on the engineer’s experience and the associated loop’s complexity
� Process control has been relegated to reactive maintenance
General InformationIndustry Challenges and Opportunities
Page 6
Energy represents a
significant portion of
total production cost.
At $78 per barrel in
July 2007, the cost of
crude was 240% higher
than January 2004.
Increased Regulation
Under-Performing Investments
Dwindling Resources
Increased Costs
1 Mark Schneider and Andrea Wirth, “Light at the End of the Tunnel”
General InformationIndustry Challenges and Opportunities
Rising Costs1
� Volatile energy costs and
rising labor costs are
hastening the need for
increased efficiency
� Increased competition
combined with customer
demand for quality, speed,
product performance and
lower costs are putting an
ever greater burden on
manufacturing
� Products need to be
launched faster than ever in
order to remain ahead of the
competition
Page 7
Increased Regulation
Under-Performing Investments
Dwindling Resources
Increased Costs
Economic Benefits of Improving
Regulatory Control
� Regular tuning of a plant’s PID
controllers is proven to dramatically
improve process performance and
increase overall plant profitability in the
following manner:
• Increase production throughput
• 2% - 5%
• Increase production yield
• 5% - 10%
• Reduce energy consumption
• 5% - 15%
• Reduce production-related defects
• 25% - 50%
General InformationIndustry Challenges and Opportunities
Page 8
Breakdown of Control Loop Performance Methods
Control Loop Performance
Controller
MechanicalProcess / Interaction
Break Techniques Into 3
Categories
• Controller Related
• -Tuning Issues
• -Cannot Track Set-Point
• -Running in the Correct Mode
• Mechanical Related
• -Incorrectly Sized Equipment
• -Sticky Valves/Dampers
• Process / Interaction
• -Throughput Changes
• -Outside Influences
It’s the Blame Game!
Page 9
Review of Performance Metrics
Average Absolute
Error
Output Travel
Output Reversals
Output
Distribution Controller SpeedControl Element
Health
Mode Changes
Percent of Time
in Normal
Spectral Analysis
There are over 50 different
performance metrics out there,
which should you choose?
Page 10
Review of Performance Metrics
Keep Things Simple and Easy to Understand
cartoon by Heath Robinson OXO® Good Grips® Swivel Peeler
Page 11
Control Loop Performance
Controller
MechanicalProcess / Interaction
Breakdown of Control Loop Performance Methods
Metrics help categorize
control loop problems
Average Absolute
ErrorOutput Travel
Output Reversals
Output
Distribution
Controller Speed
Control Element
Health
Mode Changes
Percent of Time
in Normal
Spectral Analysis
Page 12
Typical Performance Metrics Related to Controller Response
The AAE is a measure of difference between the Set-Point
and the Measured Process Variable. The larger the AAE,
the further away from the Set-Point we are. Each Loop
has a particular constraint (or benchmark).
AAE is around 10 GPM at 1AM,
then slowly increases up to around
15-16 GPM by 10AM.
Control Has Gotten Worse!
Average Absolute
Error
Process Data
Average Absolute Error
Page 13
Performance Metrics Related to Controller Response
• AAE – Why Has the Error Increased?
– Increased Disturbances / Interactions
– Increased Set-Point Changes
– Operator Switched Out of Automatic/Cascade Mode
– Controlling in Different Operating Range (i.e. non-linear)
– Mechanical Issues
– Changes to the Historian Exception/Compression Settings
Page 14
Track Number of
Mode ChangesTrack Percent of
Time in Normal
4 Mode Changes (or Operator
Interventions)
20% of the Time the Controller
was operating in Normal
(Automatic)
Performance Metrics Related to Controller Response
• Controllers are there to maintain process at a desired set-point.
• When controllers are disabled, the process must now rely on the over-burdened operator to maintain targets.
Automatic
ManualMode Change
Mode ChangesPercent of Time in
Normal
Page 15
Performance Metrics Related to Controller Response
• Causes for Controller Coming out of Normal Mode
– Poor Controller Tuning (Oscillations, etc.)
– Operator Behavior
– Sensors Reading Bad/Inconsistent Values
– Incorrect “Remote” Set-Point Values
– Poor Mechanics on Final Control Element leading to high variability
Page 16
Typical Performance Metrics Related to Controller Response
Measures the damping response of the closed-loop
performance of a control loops.
• Aggressively tuned loops
oscillate and cause
excessive wear and tear on
the final control element.
• Conservatively tuned
Control Loops may not
recover quickly enough
from disturbances.
Controller Speed
Based upon the Relative
Damping Index Method
Page 17
Detecting the Disturbance Rejection Patterns
17#
Time (min)
0 5 10 15 20 25 30 35
AC
F
-1.0
-0.5
0.0
0.5
1.0
Time (min)
0 5 10 15 20 25 30 35
AC
F +
Dis
turb
ance D
ata
-1.0
-0.5
0.0
0.5
1.0
1. Collect Process Data
2. Compute the ACF 3. Determine Damping Factor, ζ
WARNING
MATH AHEAD
Page 18
Autocorrelation Function (ACF)
• Box and Jenkins
– Used the ACF for choosing ARMA model lengths
– Introduced the relationship to the process transfer function
– Extracts response patterns
18#
( )1
2
[( ( ) )( ( ) )]1
( )
N k
iyy
y i y y i k y
r kN k σ
−
=
− + −
=−
∑
ryy(k) = ACF coefficient at delay k N = total number of samples
k = delay between observations in samples σ2 = variance
y(i) = process variable data = average of datay
WARNING
MATH
Page 19
Proposed Method for Automating the ACF
• Control based pattern recognition tool
• Second Order Under-Damped Model
• Crop the ACF length to 10 τn
19#
ξ > 1 Exponential decay (Slow Response)
ξ = 1 Fastest exponential decay (Fast with No Overshoot)
0< ξ < 1 Oscillations and Exp. Decay (Overshoot)
ξ = 0 Pure oscillation
ξ < 0 Unstable, contains positive exponential
2 2( ) ( )
2 1n n
KY s D s
s sτ τ ξ=
+ +
WARNING
MATH
Page 20
Values of Damping Factor Based on Response
• The model parameters, τn and ξ ,provide a means to describe the
controllers response
20#
Non-Integrating Integrating
Page 21
Relative Damping Index (RDI)
• Performance Index based on ξ
21#
act agg
slug act
RDIξ ξ
ξ ξ
−=
−
RDI Sign RDI Value Interpretation
+ Any ξ is in range, Process running well
– <1 ξ is out of range, Control action is too aggressive
– >1 ξ is out of range, Control action is too sluggish
WARNING
MATH AHEAD
Page 22
Typical Performance Metrics Related to Controller Response
Measures the damping response of the closed-loop
performance of a control loops.
• Aggressively tuned loops
oscillate and cause
excessive wear and tear on
the final control element.
Controller Speed
Based upon the Relative
Damping Index Method
Existing
Recommended
Page 23
Typical Performance Metrics Related to Controller Response
• Why Controller Speed Could Change
– Change in Operating State (i.e. Non-Linear Behavior)
– Replacement of Final Control Element / Sensors
– Someone changed the tunings
– Worsening Valve/Damper Dynamics
– VFD Configuration Changes (i.e. Ramp Speed)
Copyright © 2011 Rockwell Automation, Inc. All rights reserved. 23
Page 24
Typical Performance Metrics Related to Controller Response
The Output Travel is defined as the total movement in the
output signal. The travel gives us insight into how much
effort is required on the controller output to maintain
control.
The Valve Moved 0.28%
Over 30 Seconds
Or
8 Full Strokes Every Day
Output Travel
0.02%
0.1%
0.01%0.005%
0.05%
0.09%30 secs
Page 25
Typical Performance Metrics Related to Controller Response
The Output Travel is defined as the total movement in the
output signal. The travel gives us insight into how much
effort is required on the controller output to maintain
control.
As the operating range changes,
the amount of controller effort
required to maintain set-point
increases.
Output Travel increases by
40%!!
Output Travel
Process Data
Output Travel
Page 26
Typical Performance Metrics Related to Controller Response
• Why Output Travel Could Increase
– Non-Linear Processes
– Controller Going Unstable
– Final Control Element Mechanical Issues
– Large Disturbance Pushing the Controller
– Changes to Data Historian Compression / Exception Values
Copyright © 2011 Rockwell Automation, Inc. All rights reserved. 26
Page 27
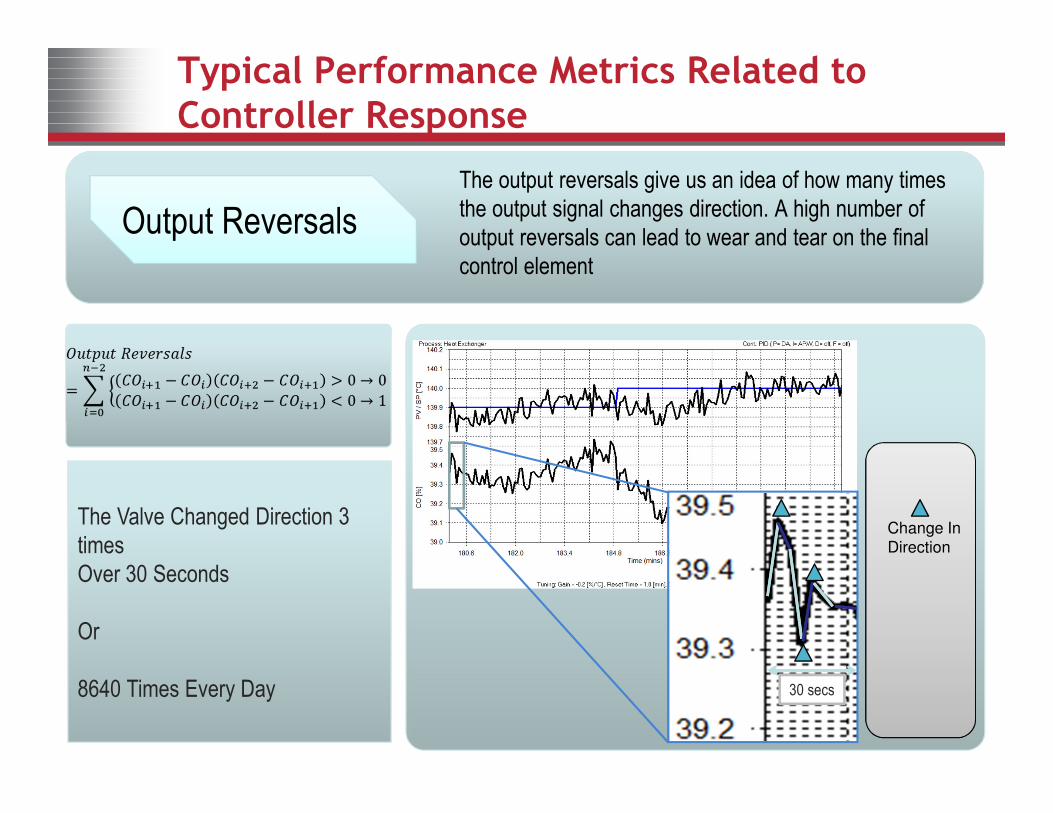
Typical Performance Metrics Related to Controller Response
The output reversals give us an idea of how many times
the output signal changes direction. A high number of
output reversals can lead to wear and tear on the final
control element
The Valve Changed Direction 3
times
Over 30 Seconds
Or
8640 Times Every Day
Output Reversals
30 secs
Change In
Direction
Page 28
Typical Performance Metrics Related to Controller Response
The output reversals give us an idea of how many times
the output signal changes direction. A high number of
output reversals can lead to wear and tear on the final
control element
The Output Reversals increased
by 20%
Performance Has Started to
Degrade
Output Reversals
Process Data
Output Reversals
Page 29
Typical Performance Metrics Related to Controller Response
• Why Output Travel Could Increase?
– Non-Linear Processes
– Controller Going Unstable
– Final Control Element Mechanical Issues
– Changes to Data Historian Compression / Exception Values
Copyright © 2011 Rockwell Automation, Inc. All rights reserved. 29
Page 30
Typical Performance Metrics Related to Controller Response
The output distribution outlines the areas in which the final
control element is spending its time. This allows us to
understand if the control element is saturated (sitting at the
extreme upper or lower operating range).
The Controller Output Spent most
of its time fully closed.
Output Distribution
Page 31
Typical Performance Metrics Related to Controller Response
• What would cause an output to Saturate?
– Non-Linear Processes
– Incorrectly Sized Final Control Element
Copyright © 2011 Rockwell Automation, Inc. All rights reserved. 31
Page 32
Typical Performance Metrics Related to Controller Response
The mechanical elements associated with moving a valve
or damper can wear over time. As these linkages or other
parts start to wear down, there ability to consistently move
the valve stem or damper degrades.
For Flow, Temperature and
Pressure Look For Saw-Tooth
Style Patterns in the Process Data
Valve Health
Page 33
Typical Performance Metrics Related to Controller Response
• Why Valve Health Decrease?
– “Slop” in the Linkages
– Valve Packing too Tight
– Over Zealous Maintenance Technicians
Copyright © 2011 Rockwell Automation, Inc. All rights reserved. 33
Page 34
Typical Performance Metrics Related to Controller Response
• Measures frequency and magnitude of change in a signal
• Especially good for identifying oscillating behavior
• Different signals may have something in common if spectrum
peaks coincide
• Think of it as a Disturbance Fingerprint
Power Spectrum (Spectral
Density) Clearly Connects
Disturbance (D) to PV Behavior
Spectral Density
Power Spectrum /
Spectral Density
WARNING
SERIOUS MATH
Page 35
• Measures frequency and magnitude of change in a signal
• Especially good for identifying oscillating behavior
• Different signals may have something in common if spectrum
peaks coincide
• Think of it as a Disturbance Fingerprint
Spectral Density
Power Spectrum /
Spectral Density
LC
SeveralProcessUnits
Drum
Level Control Performance
PC
TC
Pressure Control Performance
Temperature Control Performance
Furnace
Power SpectrumExample
Page 36
Power SpectrumExample
• Measures frequency and magnitude of change in a signal
• Especially good for identifying oscillating behavior
• Different signals may have something in common if spectrum
peaks coincide
• Think of it as a Disturbance Fingerprint
Power Spectrum (Spectral
Density) Connects The
Temperature, Pressure and Level
Controllers at a Frequency of ~ 68
minutes
Spectral Density
Power Spectrum /
Spectral Density
WARNING
SERIOUS MATH
Page 37
Controller Monitoring and Process Optimization
1900 MW Operating Station
� Staff logs into PlantESP and identifies oscillations in a key production area that directly effects the plant’s Heat Rate Index – a key metric of plant profitability
� PlantESP’s customizable and multi-layered views present the user with information that simplifies the isolation of the specific control loop’s performance data
� PlantESP’s easy-to-read gauges and trends provide important diagnostics related to Process, Mechanical, and Tuning
� PlantESP’s analysis clearly indicates issues associated with Controller Speed, Output Travel, and Average Error
� PlantESP’s recommend retuning the PID control loops as the appropriate corrective action
Page 38
1900 MW Operating Station
� The loop is oscillatory and staff perform a modest closed-loop bump-test in the middle of a transition
� Data from the damper is uploaded into Loop-Pro for analysis, modeling, and tuning
� Loop-Pro’s Non-Steady State (NSS) modeling capability permits the user to accurately model the data in spite of its challenging dynamics, and it provides visual confirmation of the model fit
� Loop-Pro’s simulated performance indicates how the controller will perform using various PID configurations
� Descriptive statistics and stability analysis provided by Loop-Pro equip staff with additional information , facilitating the decision-making process and assuring safe and efficient controller performance
Controller Monitoring and Process Optimization
Page 39
1900 MW Operating Station
� Loop-Pro’s automated reports provide staff with a valuable record of their analysis and tuning exercise
� Comparative Before-vs.-After data readily demonstrates the improvement in control and supports the determination of economic gain
� PlantESP metrics - Average Absolute Error, Output Travel, etc. – provide staff with details of the changes to loop performance
Before: Meters show poor performance across key
indices
After: Performance improved across all KPIs
Before After
Controller Monitoring and Process Optimization
Page 40
1900 MW Operating Station
� PlantESP’s interaction analysis
capabilities – a map of loop
frequencies – equipped users
with the means for evaluating the
Power Spectrum of all loops
within the plant’s production
environment
� Like a DNA graphic, PlantESP
maps the frequencies of all PID
control loops and shows
dominant frequencies in
increasingly bold color
� Staff review the frequency peaks
of the control loop after tuning
and note the elimination of an
“event” that reoccurred at 3
minute intervals
Before: Recurring “event” at ~3 minute interval
After: “Event” eliminated after controller tuning
Controller Monitoring and Process Optimization
Page 41
41
Questions?
Bob [email protected]
866-872-2920 EXT1601
Page 42
42
Please remember to tidy up your work area for the next session.
We want your feedback! Please complete the session survey!
Thank you for participating!