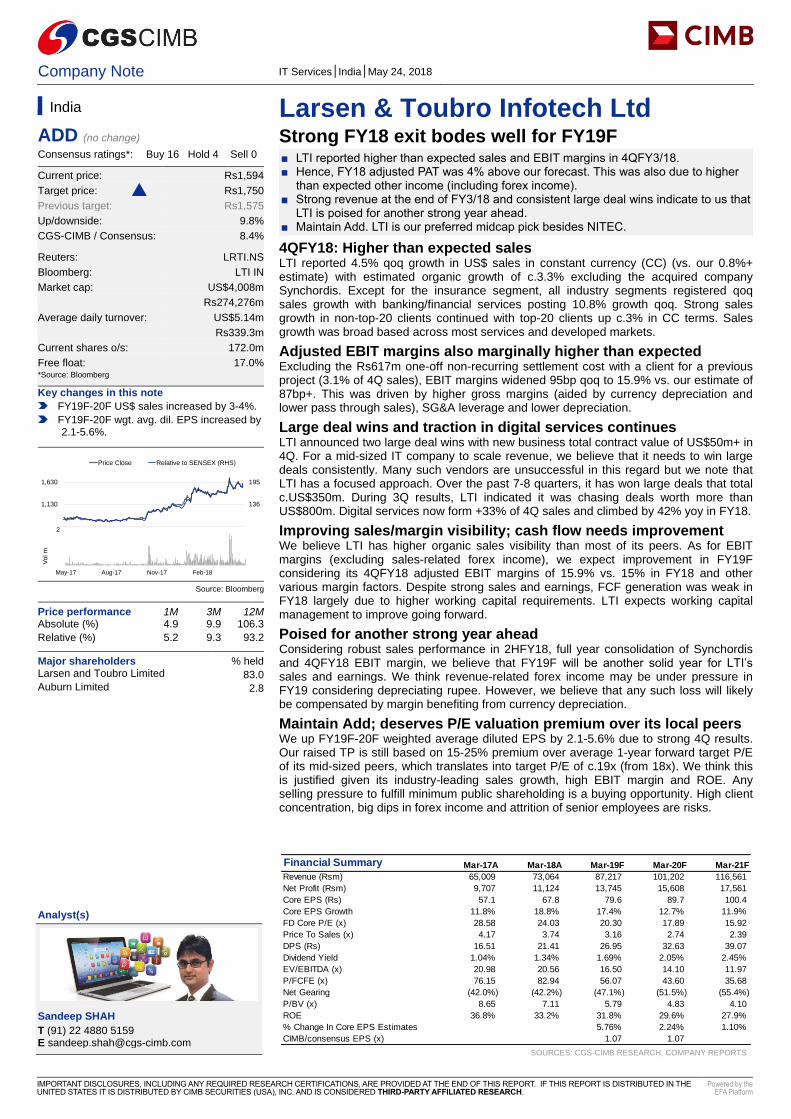
Company Note IT Services│India│May 24, 2018 IMPORTANT DISCLOSURES, INCLUDING ANY REQUIRED RESEARCH CERTIFICATIONS, ARE PROVIDED AT THE END OF THIS REPORT. IF THIS REPORT IS DISTRIBUTED IN THE UNITED STATES IT IS DISTRIBUTED BY CIMB SECURITIES (USA), INC. AND IS CONSIDERED THIRD-PARTY AFFILIATED RESEARCH. Powered by the EFA Platform Insert Insert Larsen & Toubro Infotech Ltd Strong FY18 exit bodes well for FY19F ■ LTI reported higher than expected sales and EBIT margins in 4QFY3/18. ■ Hence, FY18 adjusted PAT was 4% above our forecast. This was also due to higher than expected other income (including forex income). ■ Strong revenue at the end of FY3/18 and consistent large deal wins indicate to us that LTI is poised for another strong year ahead. ■ Maintain Add. LTI is our preferred midcap pick besides NITEC. 4QFY18: Higher than expected sales LTI reported 4.5% qoq growth in US$ sales in constant currency (CC) (vs. our 0.8%+ estimate) with estimated organic growth of c.3.3% excluding the acquired company Synchordis. Except for the insurance segment, all industry segments registered qoq sales growth with banking/financial services posting 10.8% growth qoq. Strong sales growth in non-top-20 clients continued with top-20 clients up c.3% in CC terms. Sales growth was broad based across most services and developed markets. Adjusted EBIT margins also marginally higher than expected Excluding the Rs617m one-off non-recurring settlement cost with a client for a previous project (3.1% of 4Q sales), EBIT margins widened 95bp qoq to 15.9% vs. our estimate of 87bp+. This was driven by higher gross margins (aided by currency depreciation and lower pass through sales), SG&A leverage and lower depreciation. Large deal wins and traction in digital services continues LTI announced two large deal wins with new business total contract value of US$50m+ in 4Q. For a mid-sized IT company to scale revenue, we believe that it needs to win large deals consistently. Many such vendors are unsuccessful in this regard but we note that LTI has a focused approach. Over the past 7-8 quarters, it has won large deals that total c.US$350m. During 3Q results, LTI indicated it was chasing deals worth more than US$800m. Digital services now form +33% of 4Q sales and climbed by 42% yoy in FY18. Improving sales/margin visibility; cash flow needs improvement We believe LTI has higher organic sales visibility than most of its peers. As for EBIT margins (excluding sales-related forex income), we expect improvement in FY19F considering its 4QFY18 adjusted EBIT margins of 15.9% vs. 15% in FY18 and other various margin factors. Despite strong sales and earnings, FCF generation was weak in FY18 largely due to higher working capital requirements. LTI expects working capital management to improve going forward. Poised for another strong year ahead Considering robust sales performance in 2HFY18, full year consolidation of Synchordis and 4QFY18 EBIT margin, we believe that FY19F will be another solid year for LTI’s sales and earnings. We think revenue-related forex income may be under pressure in FY19 considering depreciating rupee. However, we believe that any such loss will likely be compensated by margin benefiting from currency depreciation. Maintain Add; deserves P/E valuation premium over its local peers We up FY19F-20F weighted average diluted EPS by 2.1-5.6% due to strong 4Q results. Our raised TP is still based on 15-25% premium over average 1-year forward target P/E of its mid-sized peers, which translates into target P/E of c.19x (from 18x). We think this is justified given its industry-leading sales growth, high EBIT margin and ROE. Any selling pressure to fulfill minimum public shareholding is a buying opportunity. High client concentration, big dips in forex income and attrition of senior employees are risks. SOURCES: CGS-CIMB RESEARCH, COMPANY REPORTS India ADD (no change) Consensus ratings*: Buy 16 Hold 4 Sell 0 Current price: Rs1,594 Target price: Rs1,750 Previous target: Rs1,575 Up/downside: 9.8% CGS-CIMB / Consensus: 8.4% Reuters: LRTI.NS Bloomberg: LTI IN Market cap: US$4,008m Rs274,276m Average daily turnover: US$5.14m Rs339.3m Current shares o/s: 172.0m Free float: 17.0% *Source: Bloomberg Key changes in this note FY19F-20F US$ sales increased by 3-4%. FY19F-20F wgt. avg. dil. EPS increased by 2.1-5.6%. Source: Bloomberg Price performance 1M 3M 12M Absolute (%) 4.9 9.9 106.3 Relative (%) 5.2 9.3 93.2 Major shareholders % held Larsen and Toubro Limited 83.0 Auburn Limited 2.8 Insert Analyst(s) Sandeep SHAH T (91) 22 4880 5159 E [email protected]Financial Summary Mar-17A Mar-18A Mar-19F Mar-20F Mar-21F Revenue (Rsm) 65,009 73,064 87,217 101,202 116,561 Net Profit (Rsm) 9,707 11,124 13,745 15,608 17,561 Core EPS (Rs) 57.1 67.8 79.6 89.7 100.4 Core EPS Growth 11.8% 18.8% 17.4% 12.7% 11.9% FD Core P/E (x) 28.58 24.03 20.30 17.89 15.92 Price To Sales (x) 4.17 3.74 3.16 2.74 2.39 DPS (Rs) 16.51 21.41 26.95 32.63 39.07 Dividend Yield 1.04% 1.34% 1.69% 2.05% 2.45% EV/EBITDA (x) 20.98 20.56 16.50 14.10 11.97 P/FCFE (x) 76.15 82.94 56.07 43.60 35.68 Net Gearing (42.0%) (42.2%) (47.1%) (51.5%) (55.4%) P/BV (x) 8.65 7.11 5.79 4.83 4.10 ROE 36.8% 33.2% 31.8% 29.6% 27.9% % Change In Core EPS Estimates 5.76% 2.24% 1.10% CIMB/consensus EPS (x) 1.07 1.07 78 136 195 630 1,130 1,630 Price Close Relative to SENSEX (RHS) 1 1 2 May-17 Aug-17 Nov-17 Feb-18 Vol m
Transcript
Company Note IT Services│India│May 24, 2018
IMPORTANT DISCLOSURES, INCLUDING ANY REQUIRED RESEARCH CERTIFICATIONS, ARE PROVIDED AT THE END OF THIS REPORT. IF THIS REPORT IS DISTRIBUTED IN THE UNITED STATES IT IS DISTRIBUTED BY CIMB SECURITIES (USA), INC. AND IS CONSIDERED THIRD-PARTY AFFILIATED RESEARCH.
Powered by the EFA Platform
Insert Insert
Larsen & Toubro Infotech Ltd Strong FY18 exit bodes well for FY19F ■ LTI reported higher than expected sales and EBIT margins in 4QFY3/18. ■ Hence, FY18 adjusted PAT was 4% above our forecast. This was also due to higher
than expected other income (including forex income). ■ Strong revenue at the end of FY3/18 and consistent large deal wins indicate to us that
LTI is poised for another strong year ahead. ■ Maintain Add. LTI is our preferred midcap pick besides NITEC.
4QFY18: Higher than expected sales LTI reported 4.5% qoq growth in US$ sales in constant currency (CC) (vs. our 0.8%+ estimate) with estimated organic growth of c.3.3% excluding the acquired company Synchordis. Except for the insurance segment, all industry segments registered qoq sales growth with banking/financial services posting 10.8% growth qoq. Strong sales growth in non-top-20 clients continued with top-20 clients up c.3% in CC terms. Sales growth was broad based across most services and developed markets.
Adjusted EBIT margins also marginally higher than expected Excluding the Rs617m one-off non-recurring settlement cost with a client for a previous project (3.1% of 4Q sales), EBIT margins widened 95bp qoq to 15.9% vs. our estimate of 87bp+. This was driven by higher gross margins (aided by currency depreciation and lower pass through sales), SG&A leverage and lower depreciation.
Large deal wins and traction in digital services continues LTI announced two large deal wins with new business total contract value of US$50m+ in 4Q. For a mid-sized IT company to scale revenue, we believe that it needs to win large deals consistently. Many such vendors are unsuccessful in this regard but we note that LTI has a focused approach. Over the past 7-8 quarters, it has won large deals that total c.US$350m. During 3Q results, LTI indicated it was chasing deals worth more than US$800m. Digital services now form +33% of 4Q sales and climbed by 42% yoy in FY18.
Improving sales/margin visibility; cash flow needs improvement We believe LTI has higher organic sales visibility than most of its peers. As for EBIT margins (excluding sales-related forex income), we expect improvement in FY19F considering its 4QFY18 adjusted EBIT margins of 15.9% vs. 15% in FY18 and other various margin factors. Despite strong sales and earnings, FCF generation was weak in FY18 largely due to higher working capital requirements. LTI expects working capital management to improve going forward.
Poised for another strong year ahead Considering robust sales performance in 2HFY18, full year consolidation of Synchordis and 4QFY18 EBIT margin, we believe that FY19F will be another solid year for LTI’s sales and earnings. We think revenue-related forex income may be under pressure in FY19 considering depreciating rupee. However, we believe that any such loss will likely be compensated by margin benefiting from currency depreciation.
Maintain Add; deserves P/E valuation premium over its local peers We up FY19F-20F weighted average diluted EPS by 2.1-5.6% due to strong 4Q results. Our raised TP is still based on 15-25% premium over average 1-year forward target P/E of its mid-sized peers, which translates into target P/E of c.19x (from 18x). We think this is justified given its industry-leading sales growth, high EBIT margin and ROE. Any selling pressure to fulfill minimum public shareholding is a buying opportunity. High client concentration, big dips in forex income and attrition of senior employees are risks.
SOURCES: CGS-CIMB RESEARCH, COMPANY REPORTS
India
ADD (no change) Consensus ratings*: Buy 16 Hold 4 Sell 0
Current price: Rs1,594
Target price: Rs1,750
Previous target: Rs1,575
Up/downside: 9.8%
CGS-CIMB / Consensus: 8.4%
Reuters: LRTI.NS
Bloomberg: LTI IN
Market cap: US$4,008m
Rs274,276m
Average daily turnover: US$5.14m
Rs339.3m
Current shares o/s: 172.0m
Free float: 17.0% *Source: Bloomberg
Key changes in this note
FY19F-20F US$ sales increased by 3-4%.
FY19F-20F wgt. avg. dil. EPS increased by 2.1-5.6%.
Platform based solution 3.7 2.3 1.1 (8.5) 13.3 (0.1) (7.1)
LTI reported 5.3% qoq growth in US$ sales with estimated cross currency tailwinds of 80bp qoq in 4QFY18. LTI declared final dividend per share of Rs13.5 for FY18. This brings total DPS to Rs21.5 for FY18 (payout ratio of 38% of recurring PAT including dividend tax), up from payout ratio of 35% in FY17.
LTI continues to remain optimistic regarding growth prospects in banking and financial services (BFS), consumer packaged goods (CPG), retail and pharma. LTI also expects growth in insurance segment to turn around in future quarters. It also sounds optimistic regarding demand prospects in manufacturing and energy & utility.
Total employees Net employee adds Utilisation (inc. trainees) - RHS
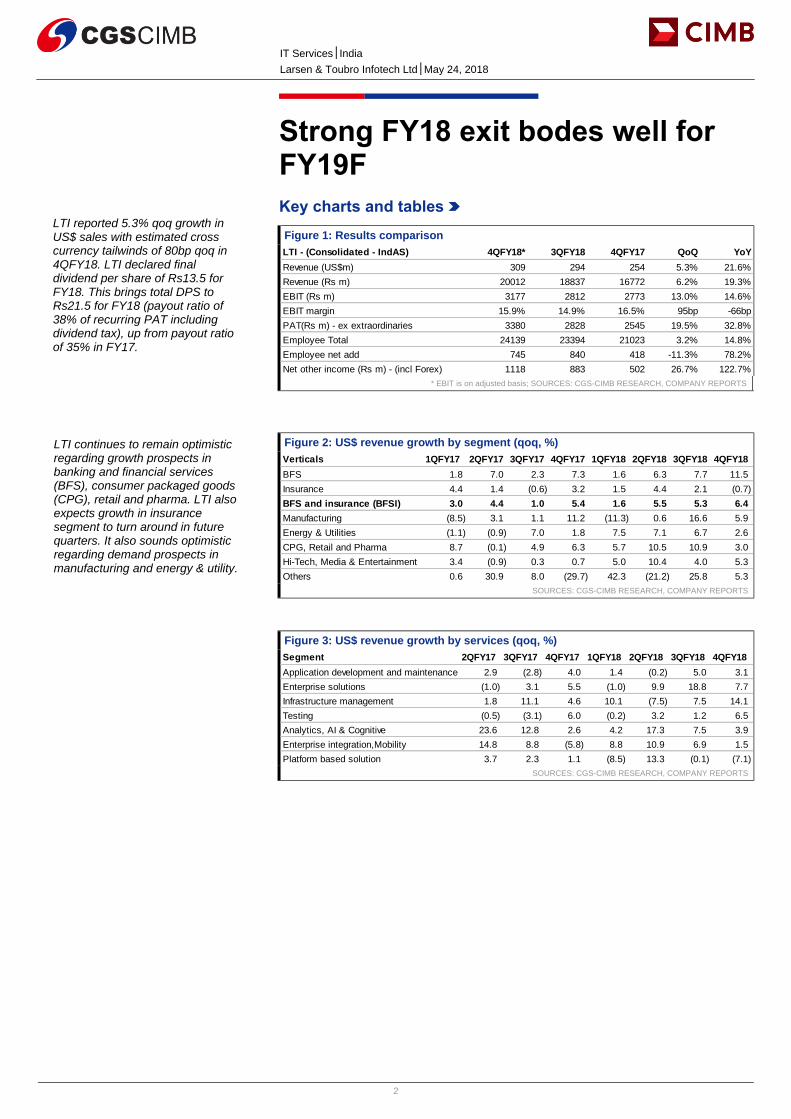
Digital revenues grew 42% yoy in FY18 and accounted for more than 33% of LTI’s revenue in 4QFY18.
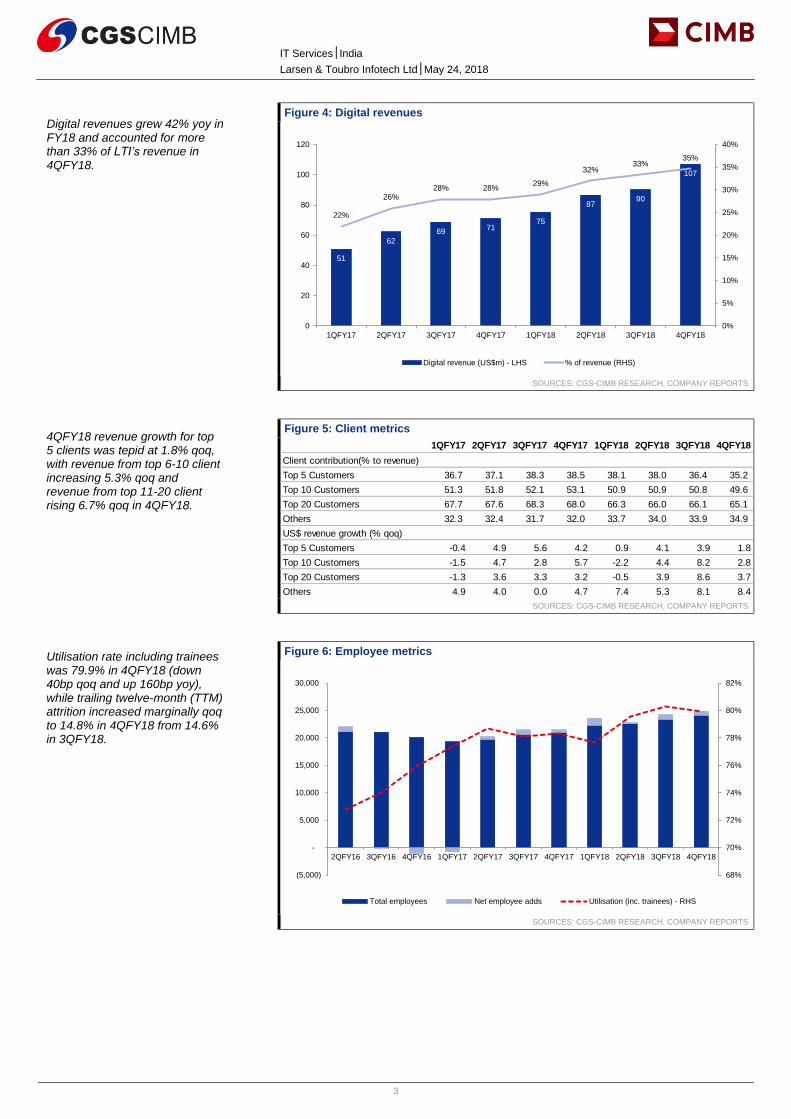
4QFY18 revenue growth for top 5 clients was tepid at 1.8% qoq, with revenue from top 6-10 client increasing 5.3% qoq and revenue from top 11-20 client rising 6.7% qoq in 4QFY18.
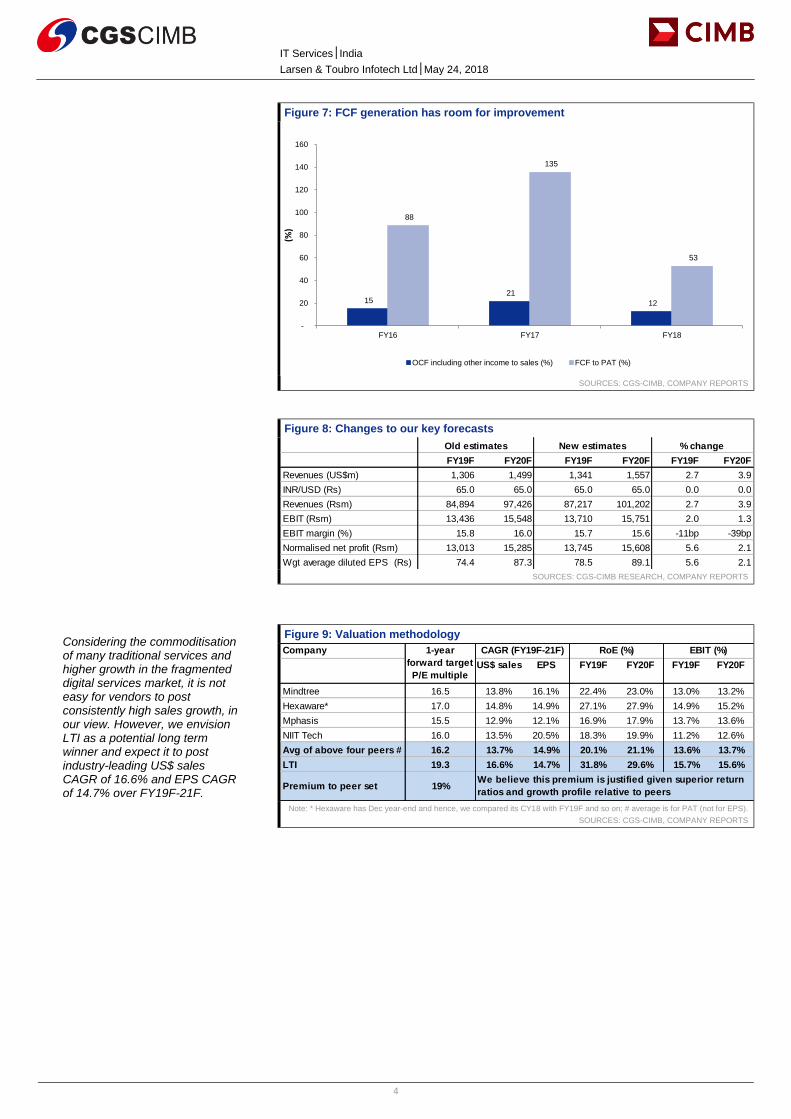
Utilisation rate including trainees was 79.9% in 4QFY18 (down 40bp qoq and up 160bp yoy), while trailing twelve-month (TTM) attrition increased marginally qoq to 14.8% in 4QFY18 from 14.6% in 3QFY18.
4
IT Services│India
Larsen & Toubro Infotech Ltd│May 24, 2018
Figure 7: FCF generation has room for improvement
SOURCES: CGS-CIMB, COMPANY REPORTS
Figure 8: Changes to our key forecasts
SOURCES: CGS-CIMB RESEARCH, COMPANY REPORTS
Figure 9: Valuation methodology
Note: * Hexaware has Dec year-end and hence, we compared its CY18 with FY19F and so on; # average is for PAT (not for EPS).
SOURCES: CGS-CIMB, COMPANY REPORTS
15 21
12
88
135
53
-
20
40
60
80
100
120
140
160
FY16 FY17 FY18
(%)
OCF including other income to sales (%) FCF to PAT (%)
Avg of above four peers # 16.2 13.7% 14.9% 20.1% 21.1% 13.6% 13.7%
LTI 19.3 16.6% 14.7% 31.8% 29.6% 15.7% 15.6%
Premium to peer set 19%We believe this premium is justified given superior return
ratios and growth profile relative to peers
CAGR (FY19F-21F) RoE (%) EBIT (%)1-year
forward target
P/E multiple
Considering the commoditisation of many traditional services and higher growth in the fragmented digital services market, it is not easy for vendors to post consistently high sales growth, in our view. However, we envision LTI as a potential long term winner and expect it to post industry-leading US$ sales CAGR of 16.6% and EPS CAGR of 14.7% over FY19F-21F.
5
IT Services│India
Larsen & Toubro Infotech Ltd│May 24, 2018
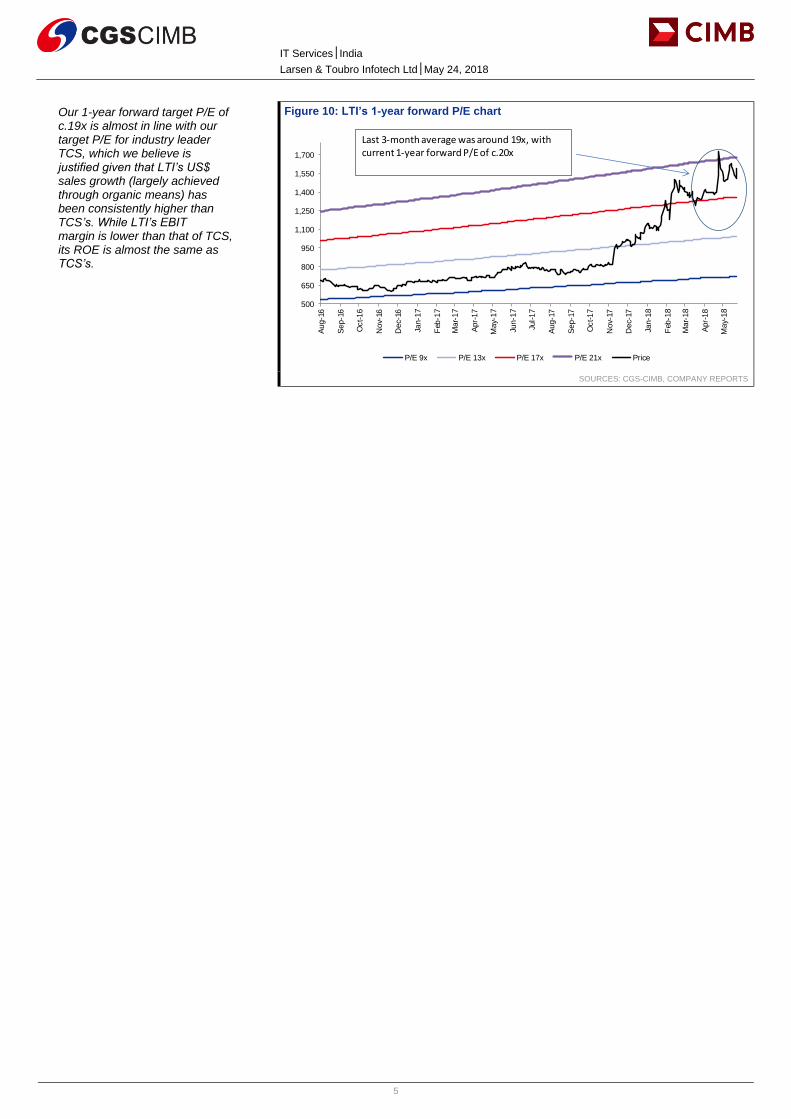
Figure 10: LTI’s 1-year forward P/E chart
SOURCES: CGS-CIMB, COMPANY REPORTS
Title:
Source:
Please fill in the values above to have them entered in your report
500
650
800
950
1,100
1,250
1,400
1,550
1,700
Aug-1
6
Sep-1
6
Oct-16
Nov-
16
Dec-
16
Jan-1
7
Feb
-17
Mar-
17
Apr-
17
May-
17
Jun-1
7
Jul-17
Aug-1
7
Sep-1
7
Oct-17
Nov-
17
Dec-
17
Jan-1
8
Feb
-18
Mar-
18
Apr-
18
May-
18
P/E 9x P/E 13x P/E 17x P/E 21x Price
Last 3-month average was around 19x, with current 1-year forward P/E of c.20x
Our 1-year forward target P/E of c.19x is almost in line with our target P/E for industry leader TCS, which we believe is justified given that LTI’s US$ sales growth (largely achieved through organic means) has been consistently higher than TCS’s. While LTI’s EBIT margin is lower than that of TCS, its ROE is almost the same as TCS’s.
6
IT Services│India
Larsen & Toubro Infotech Ltd│May 24, 2018
BY THE NUMBERS
SOURCES: CGS-CIMB RESEARCH, COMPANY REPORTS
26.0%
28.3%
30.5%
32.8%
35.0%
37.3%
39.5%
41.8%
44.0%
3.40
3.90
4.40
4.90
5.40
5.90
6.40
6.90
7.40
Jan-15A Jan-16A Jan-17A Jan-18A Jan-19F Jan-20F
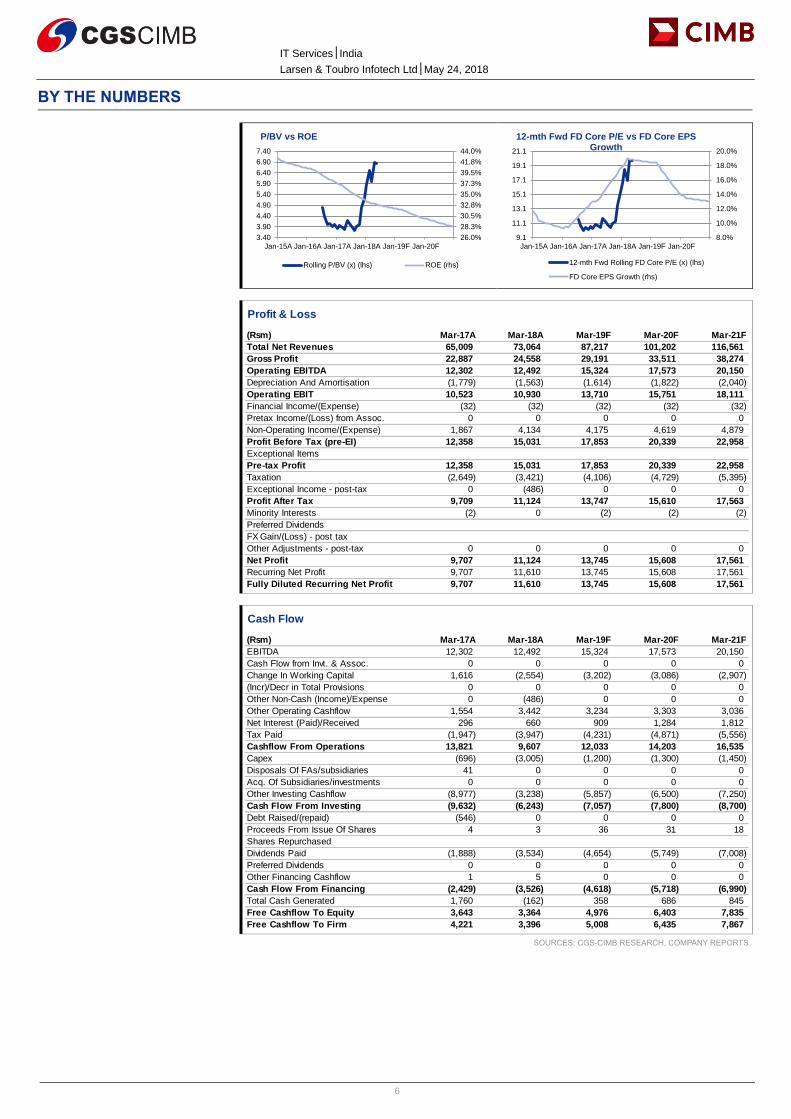
P/BV vs ROE
Rolling P/BV (x) (lhs) ROE (rhs)
8.0%
10.0%
12.0%
14.0%
16.0%
18.0%
20.0%
9.1
11.1
13.1
15.1
17.1
19.1
21.1
Jan-15A Jan-16A Jan-17A Jan-18A Jan-19F Jan-20F
12-mth Fwd FD Core P/E vs FD Core EPS Growth
12-mth Fwd Rolling FD Core P/E (x) (lhs)
FD Core EPS Growth (rhs)
Profit & Loss
(Rsm) Mar-17A Mar-18A Mar-19F Mar-20F Mar-21F
Total Net Revenues 65,009 73,064 87,217 101,202 116,561
No. Of Lines (secondary Product) N/A N/A N/A N/A N/A
Rev per line (US$, 2ndary prod) N/A N/A N/A N/A N/A
8
IT Services│India
Larsen & Toubro Infotech Ltd│May 24, 2018
DISCLAIMER The content of this report (including the views and opinions expressed therein, and the information comprised therein) has been prepared by and belongs to CGS-CIMB or CIMB Investment Bank Berhad (“CIMB”), as the case may be. Reports relating to a specific geographical area are produced and distributed by the corresponding CGS-CIMB entity as listed in the table below. Reports relating to Malaysia are produced and distributed by CIMB.
This report is not directed to, or intended for distribution to or use by, any person or entity who is a citizen or resident of or located in any locality, state, country or other jurisdiction where such distribution, publication, availability or use would be contrary to law or regulation.
By accepting this report, the recipient hereof represents and warrants that he is entitled to receive such report in accordance with the restrictions set forth below and agrees to be bound by the limitations contained herein (including the “Restrictions on Distributions” set out below). Any failure to comply with these limitations may constitute a violation of law. This publication is being supplied to you strictly on the basis that it will remain confidential. No part of this report may be (i) copied, photocopied, duplicated, stored or reproduced in any form by any means or (ii) redistributed or passed on, directly or indirectly, to any other person in whole or in part, for any purpose without the prior written consent of CGS-CIMB or CIMB, as the case may be.
The information contained in this research report is prepared from data believed to be correct and reliable at the time of issue of this report. CGS-CIMB or CIMB, as the case may be, may or may not issue regular reports on the subject matter of this report at any frequency and may cease to do so or change the periodicity of reports at any time. Neither CGS-CIMB nor CIMB has an obligation to update this report in the event of a material change to the information contained in this report. Neither CGS-CIMB nor CIMB accepts any, obligation to (i) check or ensure that the contents of this report remain current, reliable or relevant, (ii) ensure that the content of this report constitutes all the information a prospective investor may require, (iii) ensure the adequacy, accuracy, completeness, reliability or fairness of any views, opinions and information, and accordingly, CGS-CIMB and CIMB, their respective affiliates and related persons including China Galaxy International Financial Holdings Limited (“CGIFHL”) and CIMB Group Sdn. Bhd. (“CIMBG”) and their respective related corporations (and their respective directors, associates, connected persons and/or employees) shall not be liable in any manner whatsoever for any consequences (including but not limited to any direct, indirect or consequential losses, loss of profits and damages) of any reliance thereon or usage thereof. In particular, CGS-CIMB and CIMB disclaim all responsibility and liability for the views and opinions set out in this report.
Unless otherwise specified, this report is based upon sources which CGS-CIMB or CIMB, as the case may be, considers to be reasonable. Such sources will, unless otherwise specified, for market data, be market data and prices available from the main stock exchange or market where the relevant security is listed, or, where appropriate, any other market. Information on the accounts and business of company(ies) will generally be based on published statements of the company(ies), information disseminated by regulatory information services, other publicly available information and information resulting from our research.
Whilst every effort is made to ensure that statements of facts made in this report are accurate, all estimates, projections, forecasts, expressions of opinion and other subjective judgments contained in this report are based on assumptions considered to be reasonable as of the date of the document in which they are contained and must not be construed as a representation that the matters referred to therein will occur. Past performance is not a reliable indicator of future performance. The value of investments may go down as well as up and those investing may, depending on the investments in question, lose more than the initial investment. No report shall constitute an offer or an invitation by or on behalf of CGS-CIMB or CIMB, as the case may be, or any of their respective affiliates (including CGIFHL, CIMBG and their respective related corporations) to any person to buy or sell any investments.
CGS-CIMB, CIMB, their respective affiliates and related corporations (including CGIFHL, CIMBG and their respective related corporations) and/or their respective directors, associates, connected parties and/or employees may own or have positions in securities of the company(ies) covered in this research report or any securities related thereto and may from time to time add to or dispose of, or may be materially interested in, any such securities. Further, CGS-CIMB, CIMB, their respective affiliates and their respective related corporations (including CGIFHL, CIMBG and their respective related corporations) do and seek to do business with the company(ies) covered in this research report and may from time to time act as market maker or have assumed an underwriting commitment in securities of such company(ies), may sell them to or buy them from customers on a principal basis and may also perform or seek to perform significant investment banking, advisory, underwriting or placement services for or relating to such company(ies) as well as solicit such investment, advisory or other services from any entity mentioned in this report.
CGS-CIMB, CIMB or their respective affiliates (including CGIFHL, CIMBG and their respective related corporations) may enter into an agreement with the company(ies) covered in this report relating to the production of research reports. CGS-CIMB or CIMB, as the case may be, may disclose the contents of this report to the company(ies) covered by it and may have amended the contents of this report following such disclosure.
The analyst responsible for the production of this report hereby certifies that the views expressed herein accurately and exclusively reflect his or her personal views and opinions about any and all of the issuers or securities analysed in this report and were prepared independently and autonomously. No part of the compensation of the analyst(s) was, is, or will be directly or indirectly related to the inclusion of specific recommendations(s) or view(s) in this report. The analyst(s) who prepared this research report is prohibited from receiving any compensation, incentive or bonus based on specific investment banking transactions or for providing a specific recommendation for, or view of, a particular company. Information barriers and other arrangements may be established where necessary to prevent conflicts of interests arising. However, the analyst(s) may receive compensation that is based on his/their coverage of company(ies) in the performance of his/their duties or the performance of his/their recommendations and the research personnel involved in the preparation of this report may also participate in the solicitation of the businesses as described above. In reviewing this research report, an investor should be aware that any or all of the foregoing, among other things, may give rise to real or potential conflicts of interest. Additional information is, subject to the duties of confidentiality, available on request.
Reports relating to a specific geographical area are produced by the corresponding CGS-CIMB entity as listed in the table below. The term “CGS-CIMB” shall denote, where appropriate, the relevant entity distributing or disseminating the report in the particular jurisdiction referenced below, or, in every other case except as otherwise stated herein, CGS-CIMB Securities International Pte. Ltd. and its affiliates, subsidiaries and related corporations.
9
IT Services│India
Larsen & Toubro Infotech Ltd│May 24, 2018
Country CGS-CIMB Entity Regulated by
Hong Kong CGS-CIMB Securities (Hong Kong) Limited Securities and Futures Commission Hong Kong
India CGS-CIMB Securities (India) Private Limited Securities and Exchange Board of India (SEBI)
Indonesia PT CGS-CIMB Sekuritas Indonesia Financial Services Authority of Indonesia
Singapore CGS-CIMB Research Pte. Ltd. Monetary Authority of Singapore
South Korea CGS-CIMB Securities (Hong Kong) Limited, Korea Branch Financial Services Commission and Financial Supervisory Service
Reports relating to Malaysia are produced by CIMB as listed in the table below:
Country CIMB Entity Regulated by
Malaysia CIMB Investment Bank Berhad Securities Commission Malaysia
Other Significant Financial Interests:
(i) As of May 23, 2018 CIMB has a proprietary position in the securities (which may include but not limited to shares, warrants, call warrants and/or any other derivatives) in the following company or companies covered or recommended in this report:
(a) -
(ii) Analyst Disclosure: As of May 24, 2018, the analyst(s) who prepared this report, and the associate(s), has / have an interest in the securities (which may include but not limited to shares, warrants, call warrants and/or any other derivatives) in the following company or companies covered or recommended in this report:
(a) -
This report does not purport to contain all the information that a prospective investor may require. Neither CGS-CIMB or CIMB, as the case may be, nor any of their respective affiliates (including CGIFHL, CIMBG and their related corporations) make any guarantee, representation or warranty, express or implied, as to the adequacy, accuracy, completeness, reliability or fairness of any such information and opinion contained in this report. Neither CGS-CIMB or CIMB, as the case may be, nor any of their respective affiliates nor their related persons (including CGIFHL, CIMBG and their related corporations) shall be liable in any manner whatsoever for any consequences (including but not limited to any direct, indirect or consequential losses, loss of profits and damages) of any reliance thereon or usage thereof.
This report is general in nature and has been prepared for information purposes only. It is intended for circulation amongst CGS-CIMB’s or CIMB’s (as the case may be) clients generally and does not have regard to the specific investment objectives, financial situation and the particular needs of any specific person who may receive this report. The information and opinions in this report are not and should not be construed or considered as an offer, recommendation or solicitation to buy or sell the subject securities, related investments or other financial instruments or any derivative instrument, or any rights pertaining thereto.
Investors are advised to make their own independent evaluation of the information contained in this research report, consider their own individual investment objectives, financial situation and particular needs and consult their own professional and financial advisers as to the legal, business, financial, tax and other aspects before participating in any transaction in respect of the securities of company(ies) covered in this research report.
The securities of such company(ies) may not be eligible for sale in all jurisdictions or to all categories of investors.
Australia: Despite anything in this report to the contrary, this research is provided in Australia by CGS-CIMB Securities (Singapore) Pte. Ltd. and CGS-CIMB Securities (Hong Kong) Limited. This research is only available in Australia to persons who are “wholesale clients” (within the meaning of the Corporations Act 2001 (Cth) and is supplied solely for the use of such wholesale clients and shall not be distributed or passed on to any other person. You represent and warrant that if you are in Australia, you are a “wholesale client”. This research is of a general nature only and has been prepared without taking into account the objectives, financial situation or needs of the individual recipient. CGS-CIMB Securities (Singapore) Pte. Ltd. and CGS-CIMB Securities (Hong Kong) Limited do not hold, and are not required to hold an Australian financial services license. CGS-CIMB Securities (Singapore) Pte. Ltd. and CGS-CIMB Securities (Hong Kong) Limited rely on “passporting” exemptions for entities appropriately licensed by the Monetary Authority of Singapore (under ASIC Class Order 03/1102) and the Securities and Futures Commission in Hong Kong (under ASIC Class Order 03/1103).
Canada: This research report has not been prepared in accordance with the disclosure requirements of Dealer Member Rule 3400 – Research Restrictions and Disclosure Requirements of the Investment Industry Regulatory Organization of Canada. For any research report distributed by CIBC, further disclosures related to CIBC conflicts of interest can be found at https://researchcentral.cibcwm.com .
China: For the purpose of this report, the People’s Republic of China (“PRC”) does not include the Hong Kong Special Administrative Region, the Macau Special Administrative Region or Taiwan. The distributor of this report has not been approved or licensed by the China Securities Regulatory Commission or any other relevant regulatory authority or governmental agency in the PRC. This report contains only marketing information. The distribution of this report is not an offer to buy or sell to any person within or outside PRC or a solicitation to any person within or outside of PRC to buy or sell any instruments described herein. This report is being issued outside the PRC to a limited number of institutional investors and may not be provided to any person other than the original recipient and may not be reproduced or used for any other purpose.
France: Only qualified investors within the meaning of French law shall have access to this report. This report shall not be considered as an offer to subscribe to, or used in connection with, any offer for subscription or sale or marketing or direct or indirect distribution of financial instruments and it is not intended as a solicitation for the purchase of any financial instrument.
Germany: This report is only directed at persons who are professional investors as defined in sec 31a(2) of the German Securities Trading Act (WpHG). This publication constitutes research of a non-binding nature on the market situation and the investment instruments cited here at the time of the publication of the information.
The current prices/yields in this issue are based upon closing prices from Bloomberg as of the day preceding publication. Please note that neither the German Federal Financial Supervisory Agency (BaFin), nor any other supervisory authority exercises any control over the content of this report.
Hong Kong: This report is issued and distributed in Hong Kong by CGS-CIMB Securities (Hong Kong) Limited (“CHK”) which is licensed in Hong Kong by the Securities and Futures Commission for Type 1 (dealing in securities), Type 4 (advising on securities) and Type 6 (advising on corporate finance) activities. Any investors wishing to purchase or otherwise deal in the securities covered in this report should contact the Head of Sales at
10
IT Services│India
Larsen & Toubro Infotech Ltd│May 24, 2018
CGS-CIMB Securities (Hong Kong) Limited. The views and opinions in this research report are our own as of the date hereof and are subject to change. If the Financial Services and Markets Act of the United Kingdom or the rules of the Financial Conduct Authority apply to a recipient, our obligations owed to such recipient therein are unaffected. CHK has no obligation to update its opinion or the information in this research report.
This publication is strictly confidential and is for private circulation only to clients of CHK.
CHK does not make a market on other securities mentioned in the report.
India: This report is issued and distributed in India by CGS-CIMB Securities (India) Private Limited (“CGS-CIMB India”) which is registered with the National Stock Exchange of India Limited and BSE Limited as a trading and clearing member under the Securities and Exchange Board of India (Stock Brokers and Sub-Brokers) Regulations, 1992. In accordance with the provisions of Regulation 4(g) of the Securities and Exchange Board of India (Investment Advisers) Regulations, 2013, CGS-CIMB India is not required to seek registration with the Securities and Exchange Board of India (“SEBI”) as an Investment Adviser. CGS-CIMB India is registered with SEBI as a Research Analyst pursuant to the SEBI (Research Analysts) Regulations, 2014 ("Regulations").
This report does not take into account the particular investment objectives, financial situations, or needs of the recipients. It is not intended for and does not deal with prohibitions on investment due to law/jurisdiction issues etc. which may exist for certain persons/entities. Recipients should rely on their own investigations and take their own professional advice before investment.
The report is not a “prospectus” as defined under Indian Law, including the Companies Act, 2013, and is not, and shall not be, approved by, or filed or registered with, any Indian regulator, including any Registrar of Companies in India, SEBI, any Indian stock exchange, or the Reserve Bank of India. No offer, or invitation to offer, or solicitation of subscription with respect to any such securities listed or proposed to be listed in India is being made, or intended to be made, to the public, or to any member or section of the public in India, through or pursuant to this report.
The research analysts, strategists or economists principally responsible for the preparation of this research report are segregated from the other activities of CGS-CIMB India and they have received compensation based upon various factors, including quality, accuracy and value of research, firm profitability or revenues, client feedback and competitive factors. Research analysts', strategists' or economists' compensation is not linked to investment banking or capital markets transactions performed or proposed to be performed by CGS-CIMB India or its affiliates.
The analyst's, strategists' or economists' or his/her relative Research Analyst's, strategists' or economists' has not received any investment banking related compensation from the companies mentioned in the report in the past 12 months.
The analyst's, strategists' or economists' or his/her relative Research Analyst's, strategists' or economists' has not received any compensation from the companies mentioned in the report in the past 12 months.
None of the analyst, strategist, or economist has served as an officer, director or employee of the companies mentioned in the report.
The analyst(s) has(have) not had any serious disciplinary action taken against him/her(them).
The analyst, strategist, or economist does not have any material conflict of interest at the time of publication of this report.
CGS-CIMB India has not received any investment banking related compensation from the companies mentioned in the report in the past 12 months.
CGS-CIMB India has not received any compensation from the companies mentioned in the report in the past 12 months.
Indonesia: This report is issued and distributed by PT CGS-CIMB Sekuritas Indonesia (“CGS-CIMB Indonesia”). The views and opinions in this research report are our own as of the date hereof and are subject to change. CGS-CIMB Indonesia has no obligation to update its opinion or the information in this research report. Neither this report nor any copy hereof may be distributed in Indonesia or to any Indonesian citizens wherever they are domiciled or to Indonesian residents except in compliance with applicable Indonesian capital market laws and regulations.
This research report is not an offer of securities in Indonesia. The securities referred to in this research report have not been registered with the Financial Services Authority (Otoritas Jasa Keuangan) pursuant to relevant capital market laws and regulations, and may not be offered or sold within the territory of the Republic of Indonesia or to Indonesian citizens through a public offering or in circumstances which constitute an offer within the meaning of the Indonesian capital market law and regulations.
Ireland: CGS-CIMB is not an investment firm authorised in the Republic of Ireland and no part of this document should be construed as CGS-CIMB acting as, or otherwise claiming or representing to be, an investment firm authorised in the Republic of Ireland.
Malaysia: This report is distributed by CIMB solely for the benefit of and for the exclusive use of our clients. CIMB has no obligation to update, revise or reaffirm its opinion or the information in this research reports after the date of this report.
New Zealand: In New Zealand, this report is for distribution only to persons who are wholesale clients pursuant to section 5C of the Financial Advisers Act 2008.
Singapore: This report is issued and distributed by CGS-CIMB Research Pte Ltd (“CGS-CIMBR”). CGS-CIMBR is a financial adviser licensed under the Financial Advisers Act, Cap 110 (“FAA”) for advising on investment products, by issuing or promulgating research analyses or research reports, whether in electronic, print or other form. Accordingly CGS-CIMBR is a subject to the applicable rules under the FAA unless it is able to avail itself to any prescribed exemptions.
Recipients of this report are to contact CGS-CIMB Research Pte Ltd, 50 Raffles Place, #16-02 Singapore Land Tower, Singapore in respect of any matters arising from, or in connection with this report. CGS-CIMBR has no obligation to update its opinion or the information in this research report. This publication is strictly confidential and is for private circulation only. If you have not been sent this report by CGS-CIMBR directly, you may not rely, use or disclose to anyone else this report or its contents.
If the recipient of this research report is not an accredited investor, expert investor or institutional investor, CGS-CIMBR accepts legal responsibility for the contents of the report without any disclaimer limiting or otherwise curtailing such legal responsibility. If the recipient is an accredited investor, expert investor or institutional investor, the recipient is deemed to acknowledge that CGS-CIMBR is exempt from certain requirements under the FAA and its attendant regulations, and as such, is exempt from complying with the following : (a) Section 25 of the FAA (obligation to disclose product information); (b) Section 27 (duty not to make recommendation with respect to any investment product without having a reasonable basis where you may be reasonably expected to rely on the recommendation) of the FAA; (c) MAS Notice on Information to Clients and Product Information Disclosure [Notice No. FAA-N03]; (d) MAS Notice on Recommendation on Investment Products [Notice No. FAA-N16];
11
IT Services│India
Larsen & Toubro Infotech Ltd│May 24, 2018
(e) Section 36 (obligation on disclosure of interest in securities), and (f) any other laws, regulations, notices, directive, guidelines, circulars and practice notes which are relates to the above, to the extent permitted by applicable laws, as may be amended from time to time, and any other laws, regulations, notices, directive, guidelines, circulars, and practice notes as we may notify you from time to time. In addition, the recipient who is an accredited investor, expert investor or institutional investor acknowledges that a CGS-CIMBR is exempt from Section 27 of the FAA, the recipient will also not be able to file a civil claim against CGS-CIMBR for any loss or damage arising from the recipient’s reliance on any recommendation made by CGS-CIMBR which would otherwise be a right that is available to the recipient under Section 27 of the FAA, the recipient will also not be able to file a civil claim against CGS-CIMBR for any loss or damage arising from the recipient’s reliance on any recommendation made by CGS-CIMBR which would otherwise be a right that is available to the recipient under Section 27 of the FAA.
CGS-CIMBR, its affiliates and related corporations, their directors, associates, connected parties and/or employees may own or have positions in securities of the company(ies) covered in this research report or any securities related thereto and may from time to time add to or dispose of, or may be materially interested in, any such securities. Further, CGS-CIMBR, its affiliates and its related corporations do and seek to do business with the company(ies) covered in this research report and may from time to time act as market maker or have assumed an underwriting commitment in securities of such company(ies), may sell them to or buy them from customers on a principal basis and may also perform or seek to perform significant investment banking, advisory, underwriting or placement services for or relating to such company(ies) as well as solicit such investment, advisory or other services from any entity mentioned in this report.
As of May 23, 2018, CGS-CIMBR does not have a proprietary position in the recommended securities in this report.
CGS-CIMBR does not make a market on the securities mentioned in the report.
South Korea: This report is issued and distributed in South Korea by CGS-CIMB Securities (Hong Kong) Limited, Korea Branch (“CGS-CIMB Korea”) which is licensed as a cash equity broker, and regulated by the Financial Services Commission and Financial Supervisory Service of Korea. In South Korea, this report is for distribution only to professional investors under Article 9(5) of the Financial Investment Services and Capital Market Act of Korea (“FSCMA”).
Spain: This document is a research report and it is addressed to institutional investors only. The research report is of a general nature and not personalised and does not constitute investment advice so, as the case may be, the recipient must seek proper advice before adopting any investment decision. This document does not constitute a public offering of securities.
CGS-CIMB is not registered with the Spanish Comision Nacional del Mercado de Valores to provide investment services.
Sweden: This report contains only marketing information and has not been approved by the Swedish Financial Supervisory Authority. The distribution of this report is not an offer to sell to any person in Sweden or a solicitation to any person in Sweden to buy any instruments described herein and may not be forwarded to the public in Sweden.
Switzerland: This report has not been prepared in accordance with the recognized self-regulatory minimal standards for research reports of banks issued by the Swiss Bankers’ Association (Directives on the Independence of Financial Research).
Thailand: This report is issued and distributed by CGS-CIMB Securities (Thailand) Co. Ltd. (“CGS-CIMB Thailand”) based upon sources believed to be reliable (but their accuracy, completeness or correctness is not guaranteed). The statements or expressions of opinion herein were arrived at after due and careful consideration for use as information for investment. Such opinions are subject to change without notice and CGS-CIMB Thailand has no obligation to update its opinion or the information in this research report.
CGS-CIMB Thailand may act or acts as Market Maker, and issuer and offerer of Derivative Warrants and Structured Note which may have the following securities as its underlying securities. Investors should carefully read and study the details of the derivative warrants in the prospectus before making investment decisions.
The disclosure of the survey result of the Thai Institute of Directors Association (“IOD”) regarding corporate governance is made pursuant to the policy of the Office of the Securities and Exchange Commission. The survey of the IOD is based on the information of a company listed on the Stock Exchange of Thailand and the Market for Alternative Investment disclosed to the public and able to be accessed by a general public investor. The result, therefore, is from the perspective of a third party. It is not an evaluation of operation and is not based on inside information.
The survey result is as of the date appearing in the Corporate Governance Report of Thai Listed Companies. As a result, the survey result may be changed after that date. CGS-CIMB Thailand does not confirm nor certify the accuracy of such survey result.
Score Range: 90 - 100 80 – 89 70 - 79 Below 70 or No Survey Result
Description: Excellent Very Good Good N/A
United Arab Emirates: The distributor of this report has not been approved or licensed by the UAE Central Bank or any other relevant licensing authorities or governmental agencies in the United Arab Emirates. This report is strictly private and confidential and has not been reviewed by, deposited or registered with UAE Central Bank or any other licensing authority or governmental agencies in the United Arab Emirates. This report is being issued outside the United Arab Emirates to a limited number of institutional investors and must not be provided to any person other than the original recipient and may not be reproduced or used for any other purpose. Further, the information contained in this report is not intended to lead to the sale of investments under any subscription agreement or the conclusion of any other contract of whatsoever nature within the territory of the United Arab Emirates.
United Kingdom and European Economic Area (EEA): In the United Kingdom and European Economic Area, this material is also being distributed by CGS-CIMB Securities (UK) Limited (“CGS-CIMB UK”). CGS-CIMB UK is authorized and regulated by the Financial Conduct Authority and its registered office is at 27 Knightsbridge, London, SW1X7YB. The material distributed by CGS-CIMB UK has been prepared in accordance
12
IT Services│India
Larsen & Toubro Infotech Ltd│May 24, 2018
with CGS-CIMB’s policies for managing conflicts of interest arising as a result of publication and distribution of this material. This material is for distribution only to, and is solely directed at, selected persons on the basis that those persons: (a) are eligible counterparties and professional clients of CGS-CIMB UK; (b) have professional experience in matters relating to investments falling within Article 19(5) of the Financial Services and Markets Act 2000 (Financial Promotion) Order 2005 (as amended, the “Order”), (c) fall within Article 49(2)(a) to (d) (“high net worth companies, unincorporated associations etc”) of the Order; (d) are outside the United Kingdom subject to relevant regulation in each jurisdiction, material(all such persons together being referred to as “relevant persons”). This material is directed only at relevant persons and must not be acted on or relied on by persons who are not relevant persons. Any investment or investment activity to which this material relates is available only to relevant persons and will be engaged in only with relevant persons.
Where this material is labelled as non-independent, it does not provide an impartial or objective assessment of the subject matter and does not constitute independent “research” (cannot remove research from here under the applicable rules of the Financial Conduct Authority in the UK. Consequently, any such non-independent material will not have been prepared in accordance with legal requirements designed to promote the independence of research (cannot remove research from here) and will not subject to any prohibition on dealing ahead of the dissemination of research. Any such non-independent material must be considered as a marketing communication.
United States: This research report is distributed in the United States of America by CGS-CIMB Securities (USA) Inc, a U.S. registered broker-dealer and a related company of CGS-CIMB Research Pte Ltd, PT CGS-CIMB Sekuritas Indonesia, CGS-CIMB Securities (Thailand) Co. Ltd, CGS-CIMB Securities (Hong Kong) Limited, CGS-CIMB Securities (India) Private Limited, and is distributed solely to persons who qualify as “U.S. Institutional Investors” as defined in Rule 15a-6 under the Securities and Exchange Act of 1934. This communication is only for Institutional Investors whose ordinary business activities involve investing in shares, bonds, and associated securities and/or derivative securities and who have professional experience in such investments. Any person who is not a U.S. Institutional Investor or Major Institutional Investor must not rely on this communication. The delivery of this research report to any person in the United States of America is not a recommendation to effect any transactions in the securities discussed herein, or an endorsement of any opinion expressed herein. CGS-CIMB Securities (USA) Inc, is a FINRA/SIPC member and takes responsibility for the content of this report. For further information or to place an order in any of the above-mentioned securities please contact a registered representative of CGS-CIMB Securities (USA) Inc.
CIMB Securities (USA) Inc. does not make a market on other securities mentioned in the report.
CGS-CIMB Securities (USA) Inc. has not managed or co-managed a public offering of any of the securities mentioned in the past 12 months.
CGS-CIMB Securities (USA) Inc. has not received compensation for investment banking services from any of the company mentioned in the past 12 months.
CGS-CIMB Securities (USA) Inc. neither expects to receive nor intends to seek compensation for investment banking services from any of the company mentioned within the next 3 months.
Other jurisdictions: In any other jurisdictions, except if otherwise restricted by laws or regulations, this report is only for distribution to professional, institutional or sophisticated investors as defined in the laws and regulations of such jurisdictions.
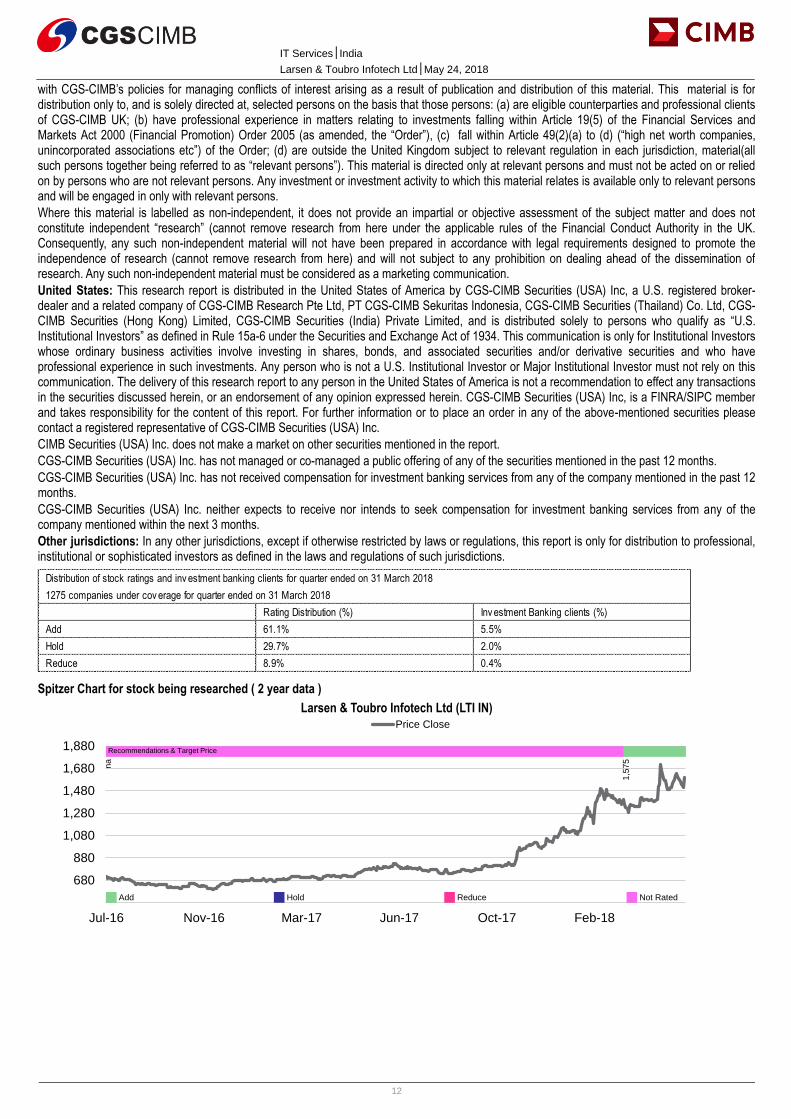
Spitzer Chart for stock being researched ( 2 year data )
Larsen & Toubro Infotech Ltd (LTI IN)
Rating Distribution (%) Inv estment Banking clients (%)
Add 61.1% 5.5%
Hold 29.7% 2.0%
Reduce 8.9% 0.4%
Distribution of stock ratings and inv estment banking clients for quarter ended on 31 March 2018
1275 companies under cov erage for quarter ended on 31 March 2018
480
680
880
1,080
1,280
1,480
1,680
1,880
Jul-16 Nov-16 Mar-17 Jun-17 Oct-17 Feb-18
Price Close
na
1,5
75
Recommendations & Target Price
Add Hold Reduce Not Rated
13
IT Services│India
Larsen & Toubro Infotech Ltd│May 24, 2018
Corporate Governance Report of Thai Listed Companies (CGR). CG Rating by the Thai Institute of Directors Association (Thai IOD) in 2017, Anti-Corruption 2017
AAV – Very Good, n/a, ADVANC – Excellent, Certified, AEONTS – Good, n/a, AMATA – Very Good, n/a, ANAN – Excellent, n/a, AOT – Excellent, Declared, AP – Excellent, Declared, ASK – Very Good, Declared, ASP – Very Good, Certified, BANPU – Excellent, Certified, BAY – Excellent, Certified, BBL – Very Good, Certified, BCH – Good, Declared, BCP - Excellent, Certified, BCPG – Very Good, n/a, BEM – Very Good, n/a, BDMS – Very Good, n/a, BEAUTY – Good, n/a, BEC – Very Good, n/a, , BGRIM – not available, n/a, BH - Good, n/a, BJC – Very Good, Declared, BJCHI – Very Good, Declared, BLA – Very Good, Certified, BPP – Good, n/a, BR - Good, Declared, BTS - Excellent, Certified, CBG – Good, n/a, CCET – Good, n/a, CENTEL – Very Good, Certified, CHG – Very Good, Declared, CK – Excellent, n/a, COL – Very Good, Declared, CPALL – not available, Declared, CPF – Excellent, Declared, CPN - Excellent, Certified, DELTA - Excellent, n/a, DEMCO – Excellent, Certified, DIF – not available, n/a, DTAC – Excellent, Certified, EA – Very Good, n/a, ECL – Very Good, Certified, EGCO - Excellent, Certified, EPG – Very Good, n/a, GFPT - Excellent, Declared, GGC – not available, Declared, GLOBAL – Very Good, Declared, GLOW – Very Good, Certified, GPSC – Excellent, Declared, GRAMMY - Excellent, n/a, GUNKUL – Excellent, Declared, HANA - Excellent, Certified, HMPRO - Excellent, Certified, ICHI – Excellent, n/a, III – not available, n/a, INTUCH - Excellent, Certified, IRPC – Excellent, Certified, ITD – Very Good, n/a, IVL - Excellent, Certified, JAS – not available, Declared, JASIF – not available, n/a, JUBILE – Good, Declared, KAMART – not available, n/a, KBANK - Excellent, Certified, KCE - Excellent, Certified, KGI – Very Good, Certified, KKP – Excellent, Certified, KSL – Very Good, Certified, KTB - Excellent, Certified, KTC – Excellent, Certified, LH - Very Good, n/a, LPN – Excellent, Certified, M – Very Good, n/a, MACO – Very Good, n/a, MAJOR – Very Good, n/a, MAKRO – Very Good, Declared, MALEE – Very Good, n/a, MBKET – Very Good, Certified, MC – Very Good, Declared, MCOT – Excellent, Certified, MEGA – Very Good, n/a, MINT - Excellent, Certified, MTLS – Very Good, Declared, NYT – Excellent, n/a, OISHI – Very Good, n/a, PLANB – Excellent, Declared, PLAT – Very Good, Certified, PSH – Excellent, Certified, PSL - Excellent, Certified, PTT - Excellent, Certified, PTTEP - Excellent, Certified, PTTGC - Excellent, Certified, QH – Excellent, Certified, RATCH – Excellent, Certified, ROBINS – Excellent, Certified, RS – Very Good, n/a, SAMART - Excellent, n/a, SAPPE - Good, n/a, SAT – Excellent, Certified, SAWAD – Very Good, n/a, SC – Excellent, Declared, SCB - Excellent, Certified, SCBLIF – not available, n/a, SCC – Excellent, Certified, SCN – Very Good, Declared, SCCC - Excellent, Declared, SIM - Excellent, n/a, SIRI – Very Good, Declared, SPA - Good, n/a, SPALI - Excellent, n/a, SPRC – Excellent, Declared, STA – Very Good, Declared, STEC – Excellent, n/a, SVI – Excellent, Certified, TASCO – Very Good, n/a, TCAP – Excellent, Certified, THAI – Very Good, n/a, THANI – Very Good, Certified, THCOM – Excellent, Certified, THRE – Very Good, Certified, THREL – Excellent, Certified, TICON – Very Good, Declared, TIPCO – Very Good, Certified, TISCO - Excellent, Certified, TK – Very Good, n/a, TKN – Very Good, Declared, TMB - Excellent, Certified, TNR – Good, n/a, TOP - Excellent, Certified, TPCH – Good, n/a, TPIPP – not available, n/a, TRUE – Excellent, Declared, TTW – Very Good, n/a, TU – Excellent, Declared, TVO – Excellent, Declared, UNIQ – not available, Declared, VGI – Excellent, Declared, WHA – not available, Declared, WHART – not available, n/a, WORK – not available, n/a.
Companies participating in Thailand’s Private Sector Collective Action Coalition Against Corruption programme (Thai CAC) under Thai Institute of Directors (as of October 28, 2016) are categorized into:
- Companies that have declared their intention to join CAC, and
- Companies certified by CAC
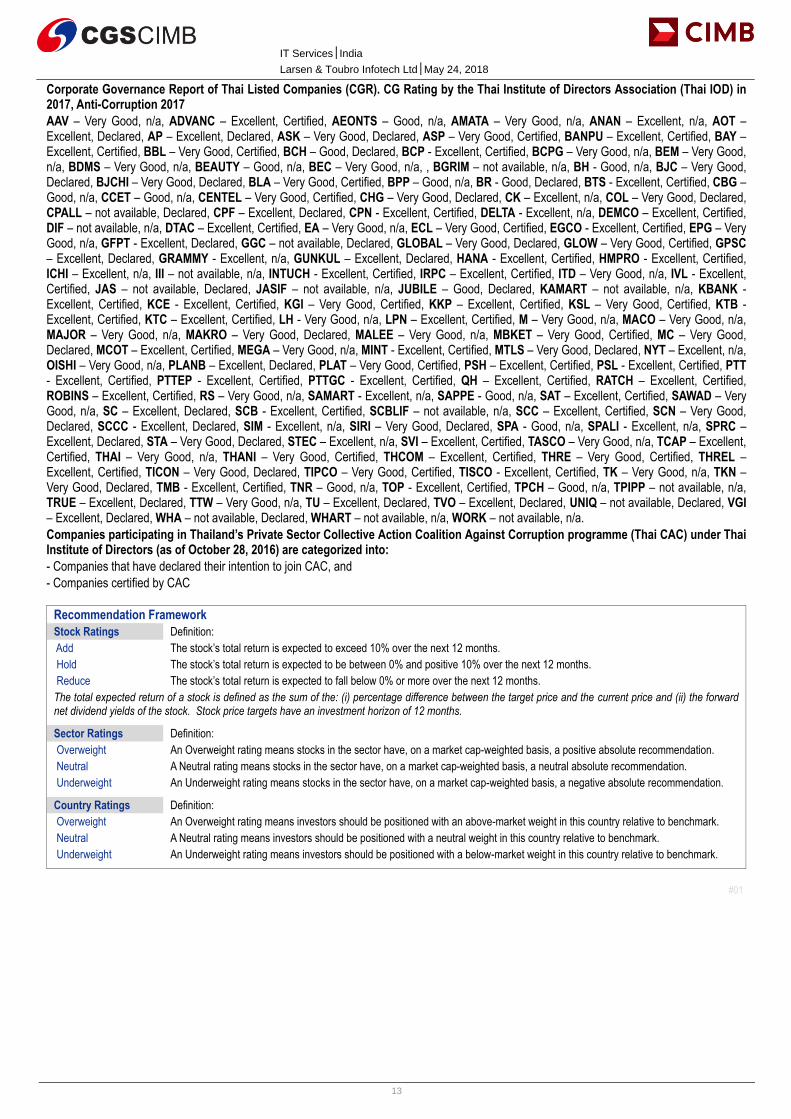
Recommendation Framework
Stock Ratings Definition:
Add The stock’s total return is expected to exceed 10% over the next 12 months.
Hold The stock’s total return is expected to be between 0% and positive 10% over the next 12 months.
Reduce The stock’s total return is expected to fall below 0% or more over the next 12 months.
The total expected return of a stock is defined as the sum of the: (i) percentage difference between the target price and the current price and (ii) the forward net dividend yields of the stock. Stock price targets have an investment horizon of 12 months.
Sector Ratings Definition:
Overweight An Overweight rating means stocks in the sector have, on a market cap-weighted basis, a positive absolute recommendation.
Neutral A Neutral rating means stocks in the sector have, on a market cap-weighted basis, a neutral absolute recommendation.
Underweight An Underweight rating means stocks in the sector have, on a market cap-weighted basis, a negative absolute recommendation.
Country Ratings Definition:
Overweight An Overweight rating means investors should be positioned with an above-market weight in this country relative to benchmark.
Neutral A Neutral rating means investors should be positioned with a neutral weight in this country relative to benchmark.
Underweight An Underweight rating means investors should be positioned with a below-market weight in this country relative to benchmark.