39
Insight H2O™ March 29, 2016 OPTIMIZING YOUR DISTRIBUTION SYSTEM INSIGHT H2O™ PRESENTS: FROM PLANT TO TAP:
| Date post: | 25-Jan-2017 |
| Category: |
Engineering |
| Upload: | black-veatch |
| View: | 395 times |
| Download: | 5 times |
Insi
ght
H2
O™
M
arch
29
, 20
16
OPTIMIZING YOUR DISTRIBUTION SYSTEM
INSIGHT H2O™ PRESENTS:
FROM PLANT TO TAP:

• Q&A will be held at the end. To submit a question, click on the question tab located on the dashboard
• To receive a certificate indicating 1 hour of continuing education, email Ben Klayman at [email protected]
• This webcast is being recorded. An email will be sent to participants with a link to the recording.
TO GET THE MOST OUT OF TODAY’S WEBCAST
2
• Distribution system overview
• Corrosion and metals release
• A proactive approach to managing distribution systems
AGENDA
3
• Dr. Ben Klayman, Black & Veatch
• Dr. Daniel Giammar, Washington University in St. Louis
• Brandy Thigpen, Black & Veatch
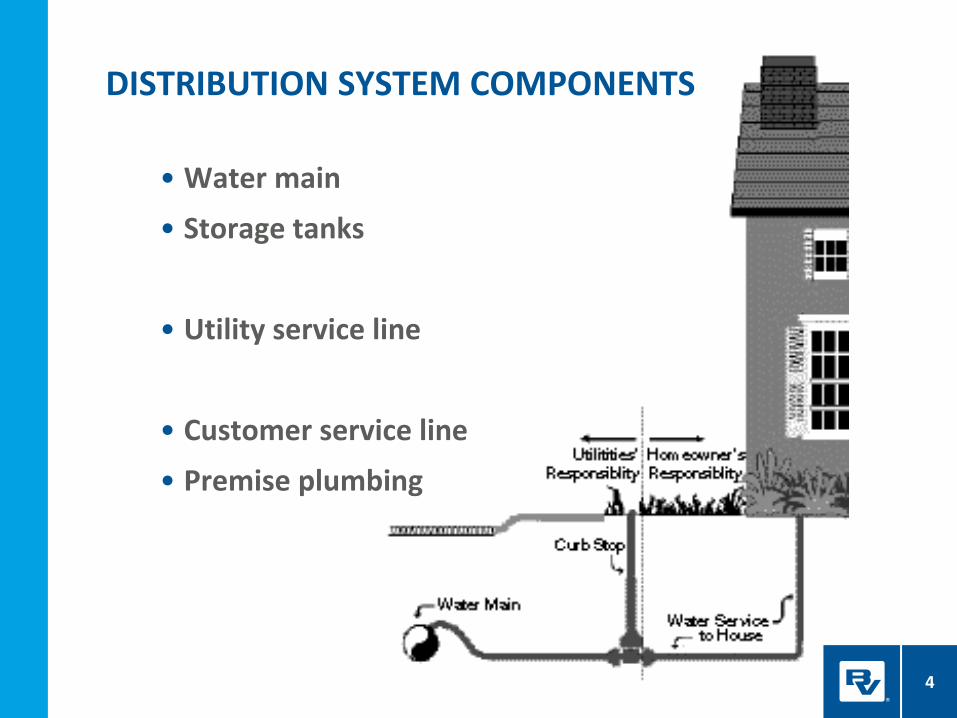
• Water main
• Storage tanks
• Utility service line
• Customer service line
• Premise plumbing
DISTRIBUTION SYSTEM COMPONENTS
4
• Regulations • Lead and Copper Rule
• Sets action level for 90th percentile
• NDWAC Lead and Copper Working Group
• Long term revisions due out 2017
• Disinfectants / Disinfection Byproduct Rule
• Total Coliform Rule
DISTRIBUTION SYSTEM CONSIDERATIONS
5
• Aesthetic / Public Health • Increased microbial activity
• Taste and odor
• Cloudy or colored water
• Metals release
• Maintaining integrity of the distribution system • Operations
• Maintenance
• Replacement program
DISTRIBUTION SYSTEM CONSIDERATIONS
6
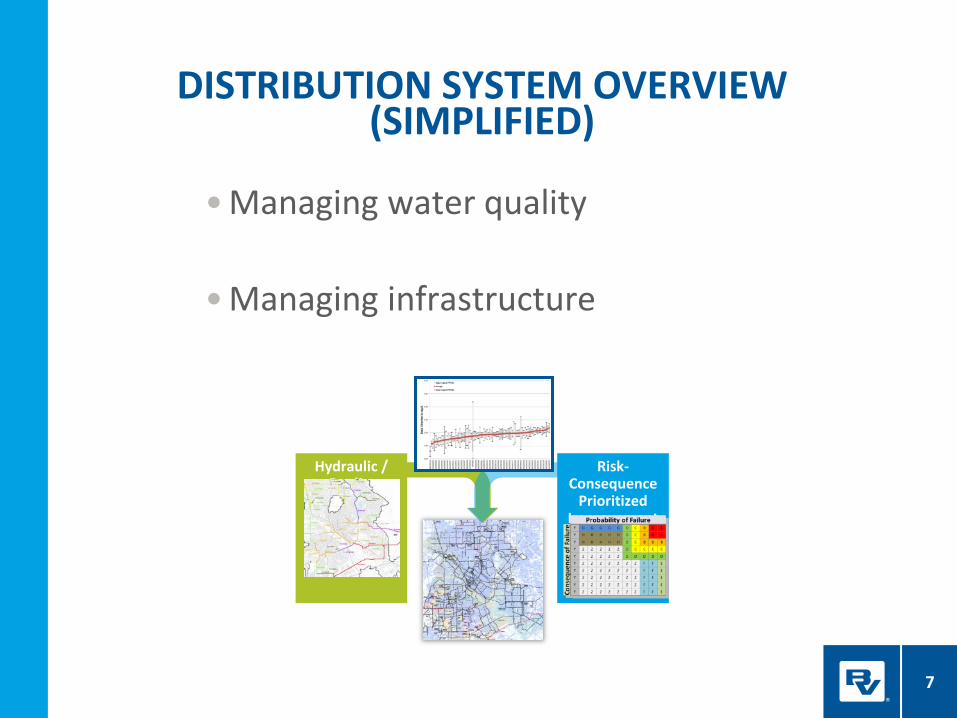
• Managing water quality
• Managing infrastructure
7
DISTRIBUTION SYSTEM OVERVIEW (SIMPLIFIED)
Hydraulic / Quality Analysis
Risk-Consequence
Prioritized Improvement
s
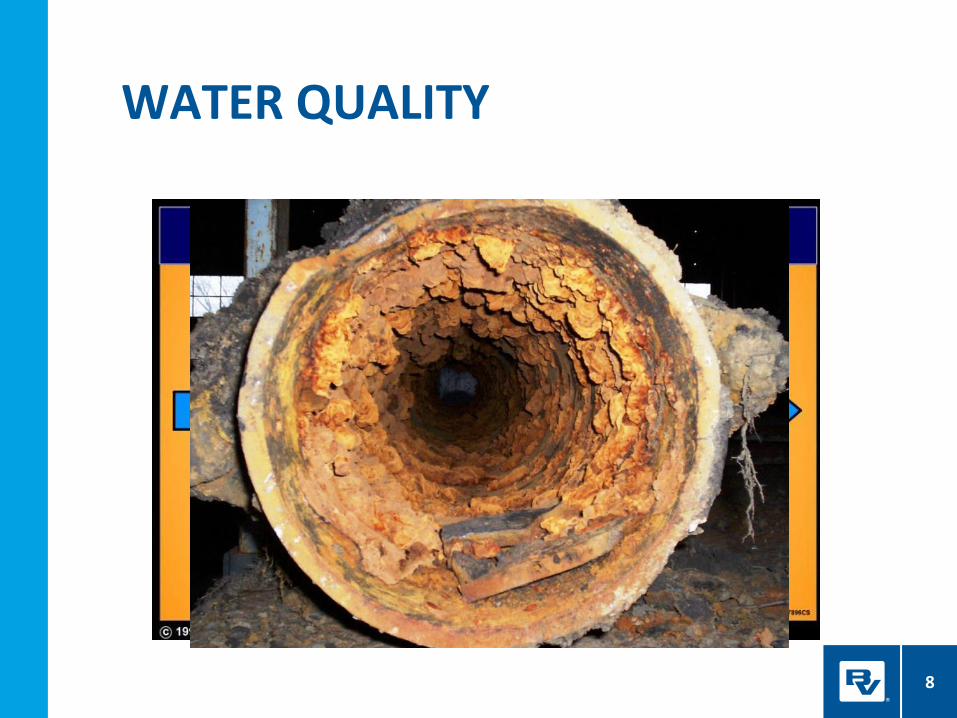
WATER QUALITY
8
WATER QUALITY
06/23/2009
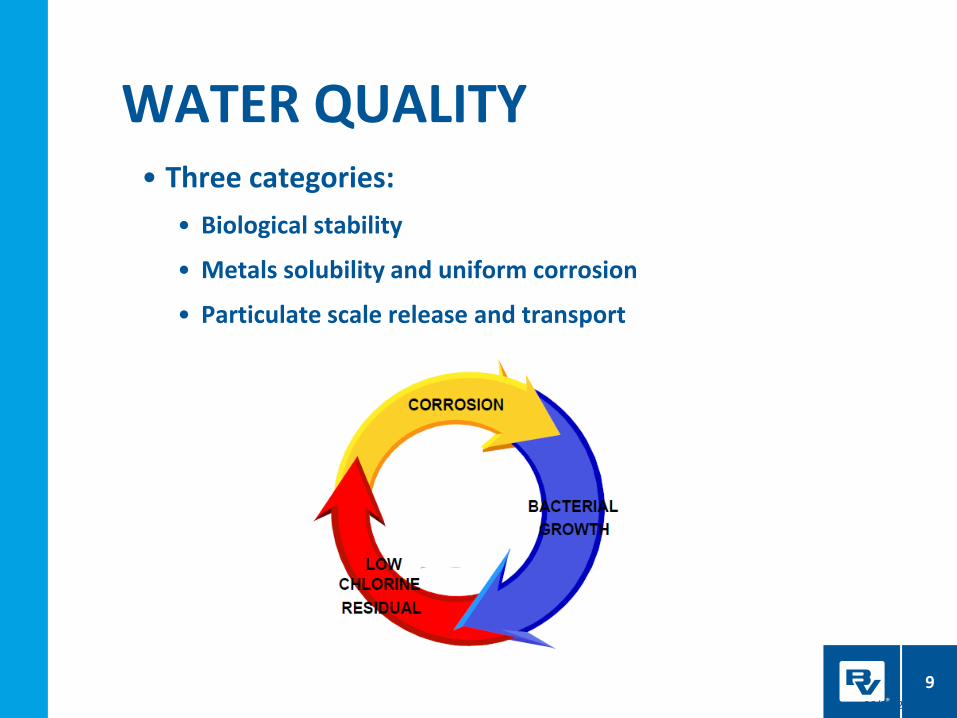
• Three categories:
• Biological stability
• Metals solubility and uniform corrosion
• Particulate scale release and transport
9
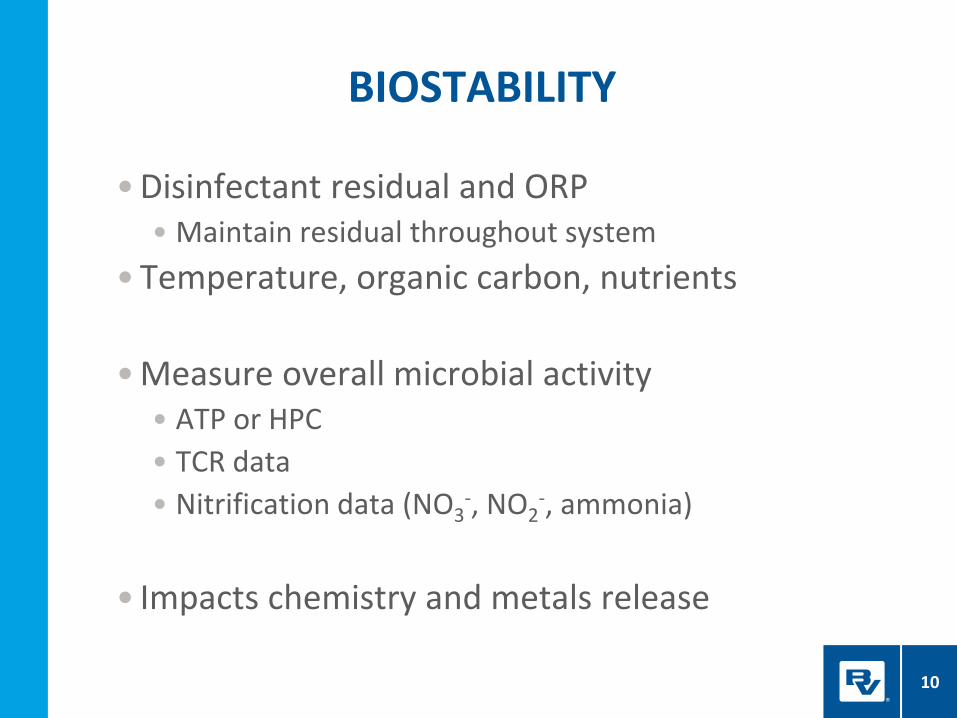
• Disinfectant residual and ORP • Maintain residual throughout system
• Temperature, organic carbon, nutrients
• Measure overall microbial activity • ATP or HPC
• TCR data
• Nitrification data (NO3-, NO2
-, ammonia)
• Impacts chemistry and metals release
10
BIOSTABILITY

CORROSION AND METALS RELEASE
11
Daniel E. Giammar, Ph.D., P.E.
Department of Energy, Environmental, and Chemical Engineering
Washington University in St. Louis
• Active versus passive corrosion
• Iron and red water
• Copper and blue water
• Lead corrosion and corrosion control
Aquatic Chemistry Laboratory Aquatic Chemistry Laboratory 12
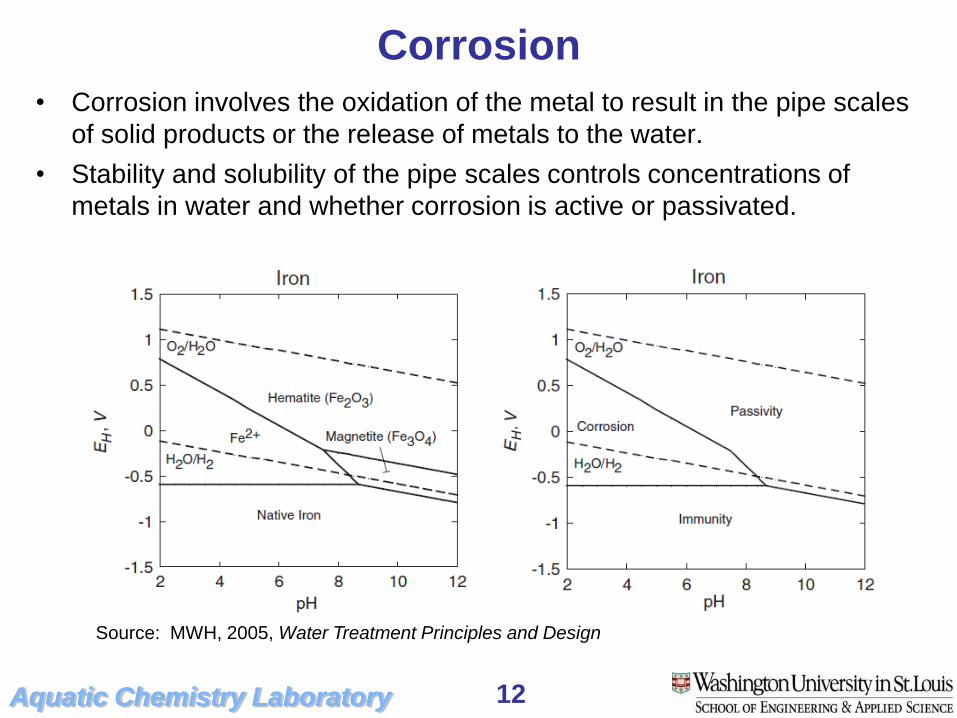
Corrosion
• Corrosion involves the oxidation of the metal to result in the pipe scales
of solid products or the release of metals to the water.
• Stability and solubility of the pipe scales controls concentrations of
metals in water and whether corrosion is active or passivated.
Source: MWH, 2005, Water Treatment Principles and Design

Aquatic Chemistry Laboratory Aquatic Chemistry Laboratory 13
Iron and Red Water
• Perturbations that disturb the scale
mobilize iron.
– changes in pH
– removal of corrosion inhibitor
• Red water complaints.
• Iron corrosion consumes chlorine,
making it harder to maintain residual.
Source: Water Quality and Treatment, 5th Ed., AWWA, 1999 http://events.nace.org/library/corrosion
/Experiments/rust-chemistry.asp
Aquatic Chemistry Laboratory Aquatic Chemistry Laboratory 14
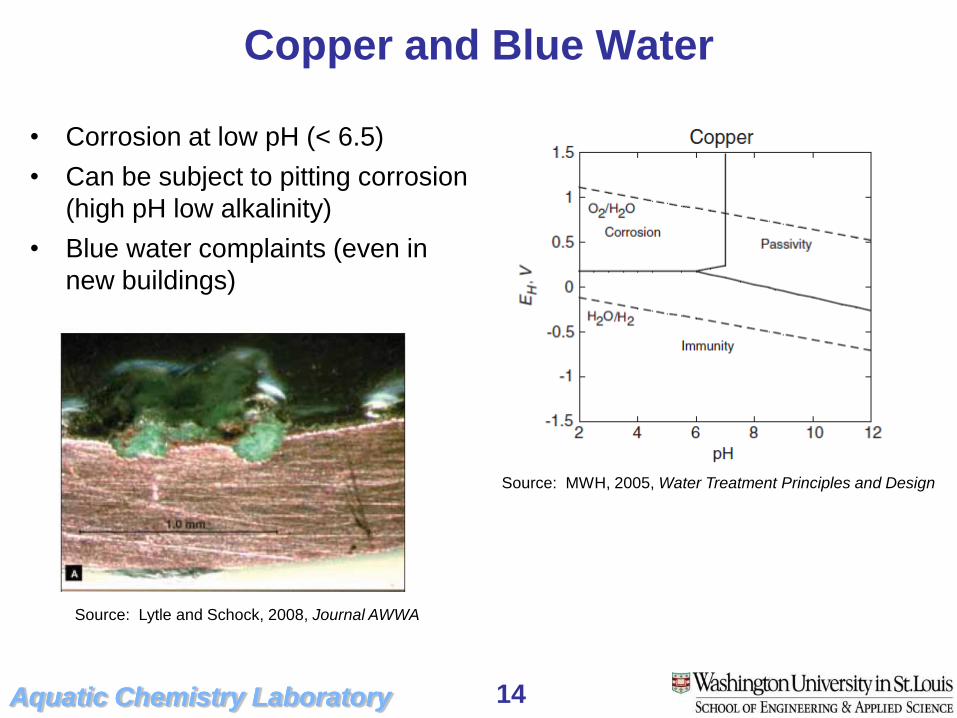
Copper and Blue Water
• Corrosion at low pH (< 6.5)
• Can be subject to pitting corrosion
(high pH low alkalinity)
• Blue water complaints (even in
new buildings)
Source: MWH, 2005, Water Treatment Principles and Design
Source: Lytle and Schock, 2008, Journal AWWA
Aquatic Chemistry Laboratory Aquatic Chemistry Laboratory 15
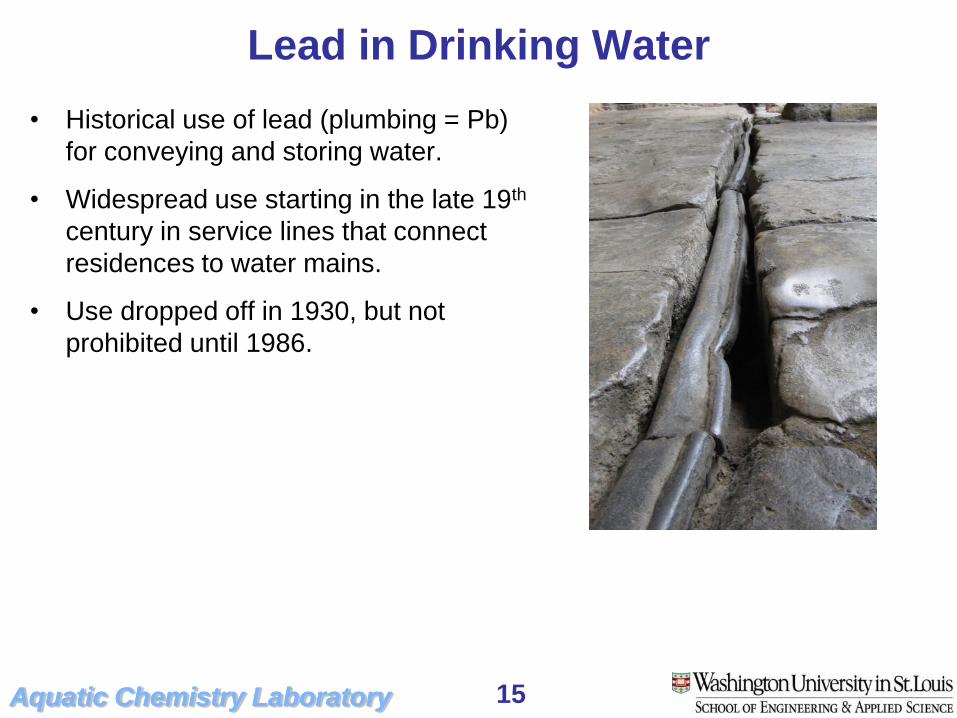
Lead in Drinking Water
• Historical use of lead (plumbing = Pb)
for conveying and storing water.
• Widespread use starting in the late 19th
century in service lines that connect
residences to water mains.
• Use dropped off in 1930, but not
prohibited until 1986.
Aquatic Chemistry Laboratory Aquatic Chemistry Laboratory 16
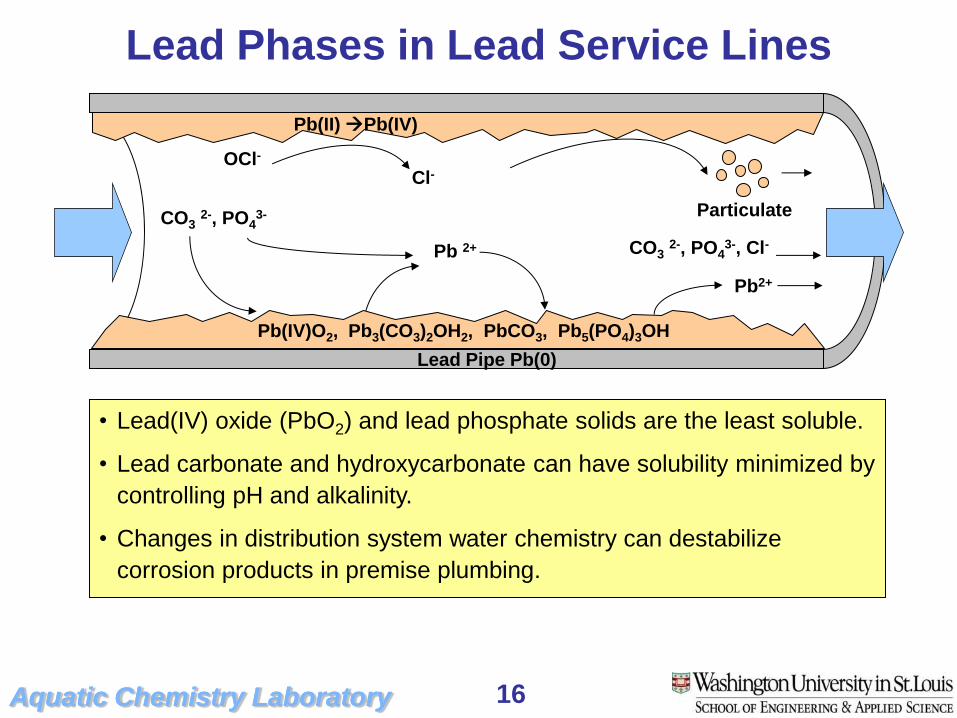
Lead Phases in Lead Service Lines
• Lead(IV) oxide (PbO2) and lead phosphate solids are the least soluble.
• Lead carbonate and hydroxycarbonate can have solubility minimized by
controlling pH and alkalinity.
• Changes in distribution system water chemistry can destabilize
corrosion products in premise plumbing.
CO3 2-, PO4
3-
OCl- Cl-
Pb 2+
Pb(IV)O2, Pb3(CO3)2OH2, PbCO3, Pb5(PO4)3OH
Lead Pipe Pb(0)
CO3 2-, PO4
3-, Cl-
Pb2+
Particulate
Pb(II) Pb(IV)
Aquatic Chemistry Laboratory Aquatic Chemistry Laboratory 17
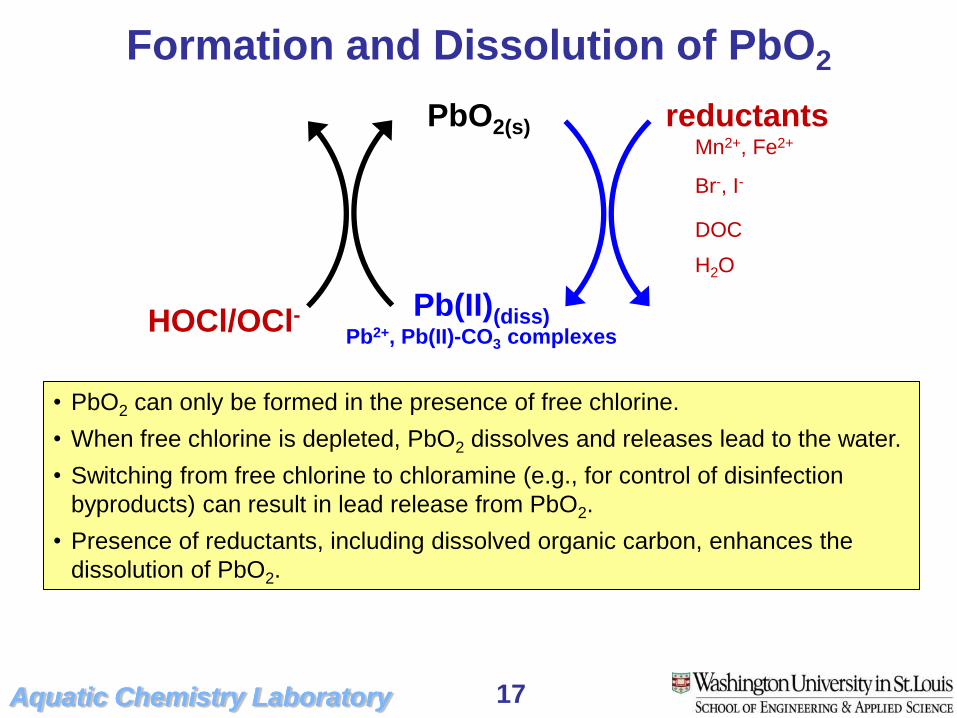
Formation and Dissolution of PbO2
• PbO2 can only be formed in the presence of free chlorine.
• When free chlorine is depleted, PbO2 dissolves and releases lead to the water.
• Switching from free chlorine to chloramine (e.g., for control of disinfection
byproducts) can result in lead release from PbO2.
• Presence of reductants, including dissolved organic carbon, enhances the
dissolution of PbO2.
Mn2+, Fe2+
Br-, I-
DOC
H2O
PbO2(s)
Pb(II)(diss) Pb2+, Pb(II)-CO3 complexes
reductants
HOCl/OCl-
Aquatic Chemistry Laboratory Aquatic Chemistry Laboratory 18
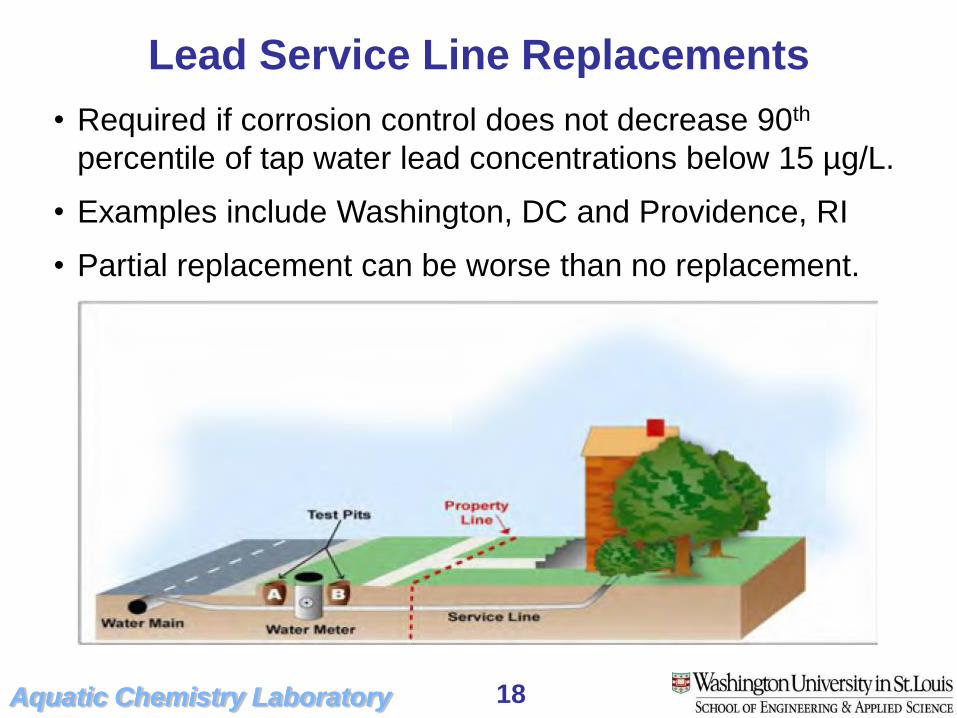
Lead Service Line Replacements
• Required if corrosion control does not decrease 90th
percentile of tap water lead concentrations below 15 µg/L.
• Examples include Washington, DC and Providence, RI
• Partial replacement can be worse than no replacement.
Aquatic Chemistry Laboratory Aquatic Chemistry Laboratory 19
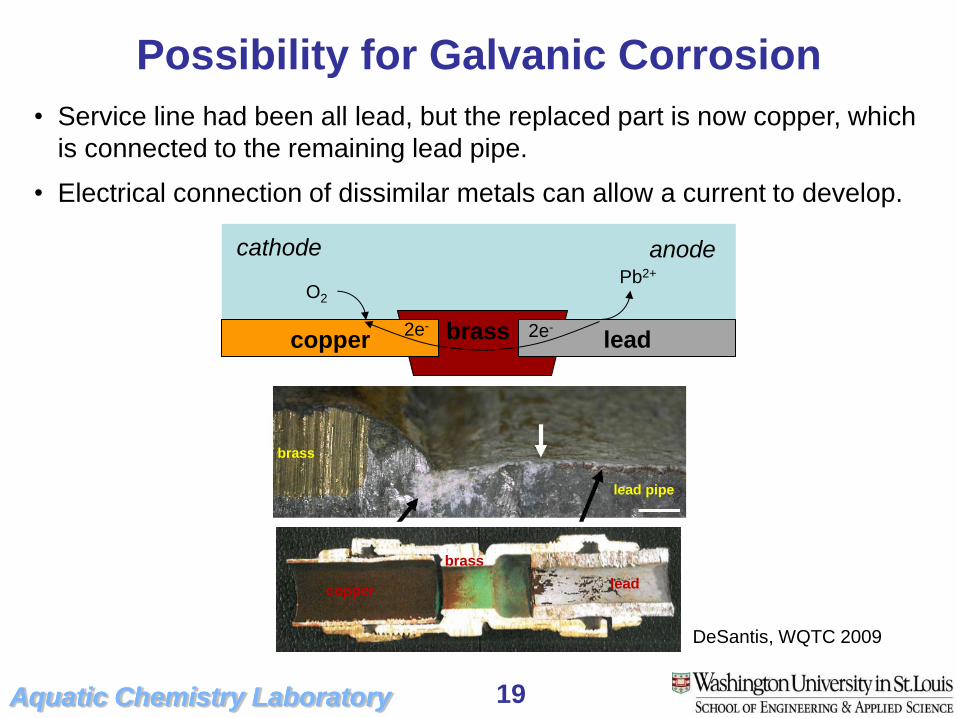
Possibility for Galvanic Corrosion
• Service line had been all lead, but the replaced part is now copper, which
is connected to the remaining lead pipe.
• Electrical connection of dissimilar metals can allow a current to develop.
copper lead brass
Pb2+
O2
2e- 2e-
anode cathode
DeSantis, WQTC 2009
brass
lead pipe
lead copper
brass
Aquatic Chemistry Laboratory Aquatic Chemistry Laboratory 20
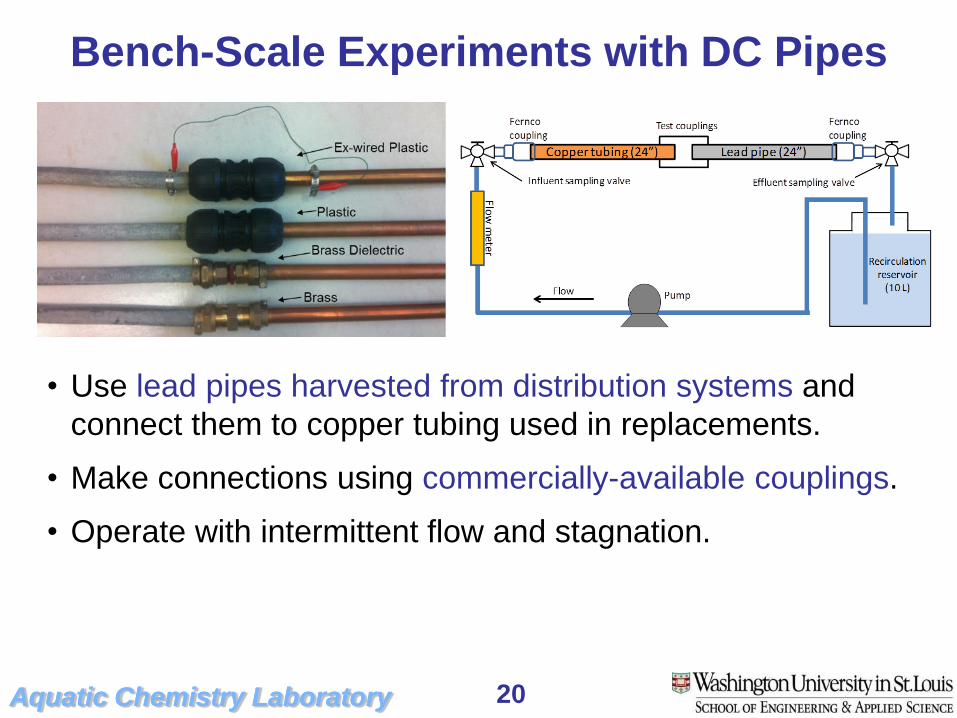
Bench-Scale Experiments with DC Pipes
• Use lead pipes harvested from distribution systems and
connect them to copper tubing used in replacements.
• Make connections using commercially-available couplings.
• Operate with intermittent flow and stagnation.
Aquatic Chemistry Laboratory Aquatic Chemistry Laboratory 21
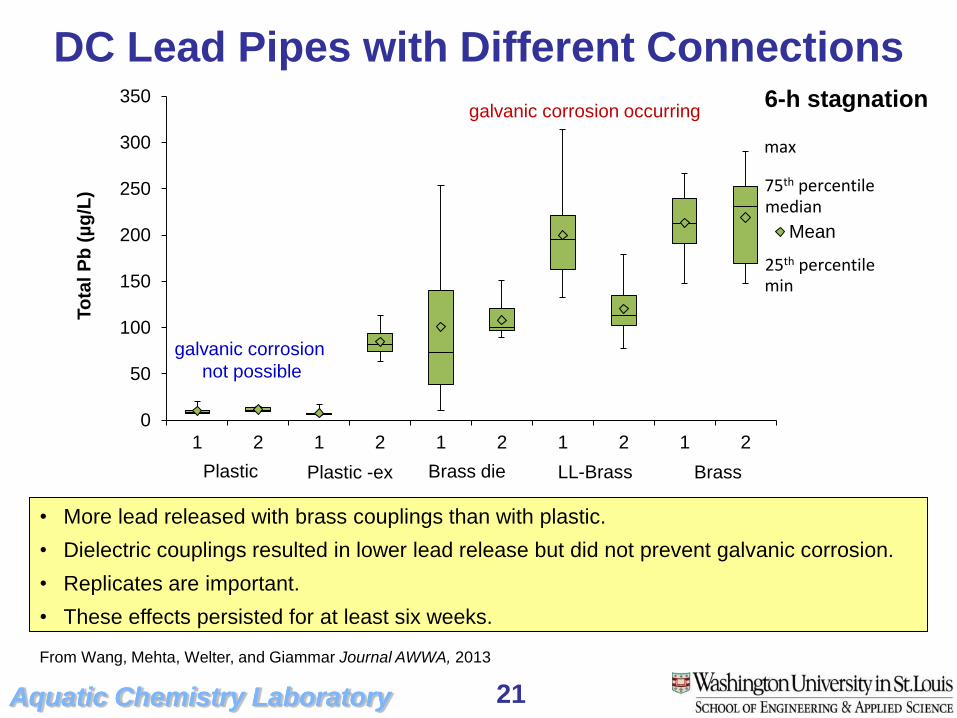
DC Lead Pipes with Different Connections 6-h stagnation
• More lead released with brass couplings than with plastic.
• Dielectric couplings resulted in lower lead release but did not prevent galvanic corrosion.
• Replicates are important.
• These effects persisted for at least six weeks.
0
50
100
150
200
250
300
350
1 2 1 2 1 2 1 2 1 2
To
tal P
b (
µg
/L)
Mean
Brass Brass die Plastic -ex Plastic LL-Brass
max
median
min
75th percentile
25th percentile
galvanic corrosion
not possible
galvanic corrosion occurring
From Wang, Mehta, Welter, and Giammar Journal AWWA, 2013
Aquatic Chemistry Laboratory Aquatic Chemistry Laboratory 22
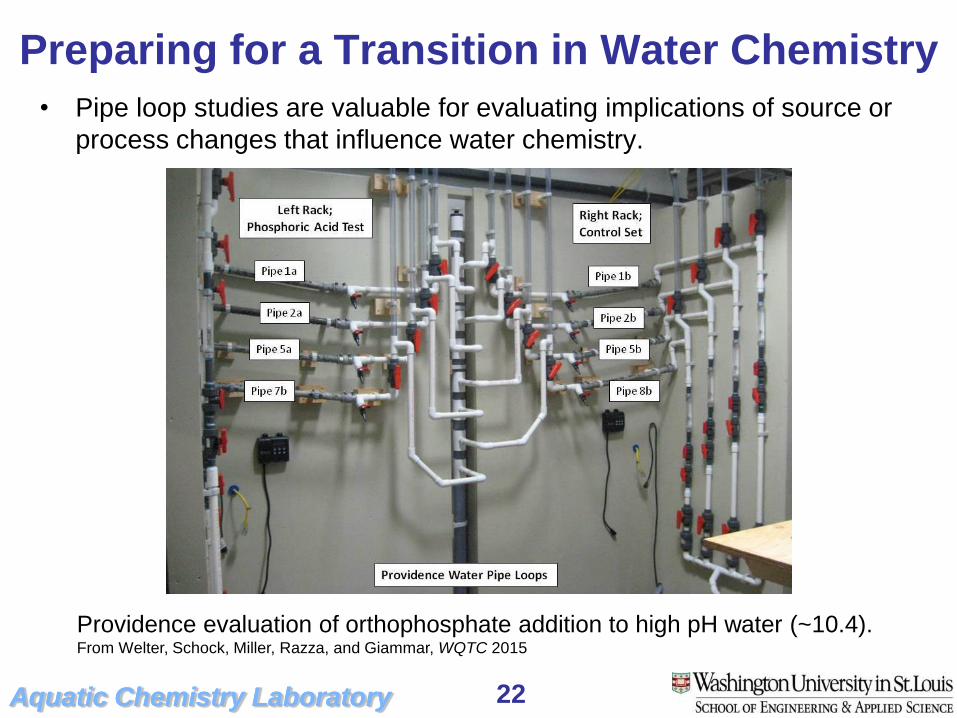
Preparing for a Transition in Water Chemistry
• Pipe loop studies are valuable for evaluating implications of source or
process changes that influence water chemistry.
Providence evaluation of orthophosphate addition to high pH water (~10.4). From Welter, Schock, Miller, Razza, and Giammar, WQTC 2015
Aquatic Chemistry Laboratory Aquatic Chemistry Laboratory 23
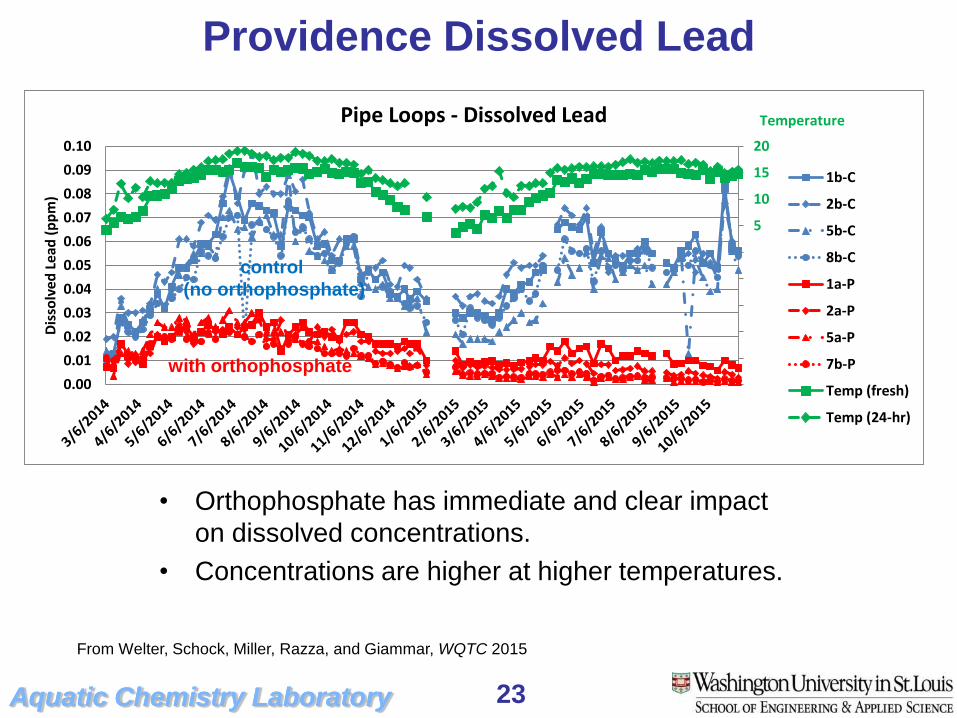
Providence Dissolved Lead
From Welter, Schock, Miller, Razza, and Giammar, WQTC 2015
23
• Orthophosphate has immediate and clear impact
on dissolved concentrations.
• Concentrations are higher at higher temperatures.
-25
-20
-15
-10
-5
0
5
10
15
20
0.00
0.01
0.02
0.03
0.04
0.05
0.06
0.07
0.08
0.09
0.10
Dis
solv
ed L
ead
(p
pm
)
Pipe Loops - Dissolved Lead
1b-C
2b-C
5b-C
8b-C
1a-P
2a-P
5a-P
7b-P
Temp (fresh)
Temp (24-hr)
Temperature
with orthophosphate
control
(no orthophosphate)

Aquatic Chemistry Laboratory Aquatic Chemistry Laboratory 24
Providence Total Lead
From Welter, Schock, Miller, Razza, and Giammar, WQTC 2015
24
• Benefits for total lead take longer to be achieved.
• Replicate experiments valuable for distinguishing impacts
from noisy data associated with use of real pipes.
-25
-20
-15
-10
-5
0
5
10
15
20
0
0.02
0.04
0.06
0.08
0.1
0.12
0.14
0.16
0.18
0.2
Tota
l Lea
d (
pp
m)
Pipe Loops - Total Lead
1b-C
2b-C
5b-C
8b-C
1a-P
2a-P
5a-P
7b-P
Temp (fresh)
Temp (24-hr)
Dates for temperature data are approximate,
Tem
per
atu
re
with orthophosphate
A PROACTIVE APPROACH TO MANAGING DISTRIBUTION SYSTEMS
25
BRANDY THIGPEN, INFRASTRUCTURE PLANNING BLACK & VEATCH
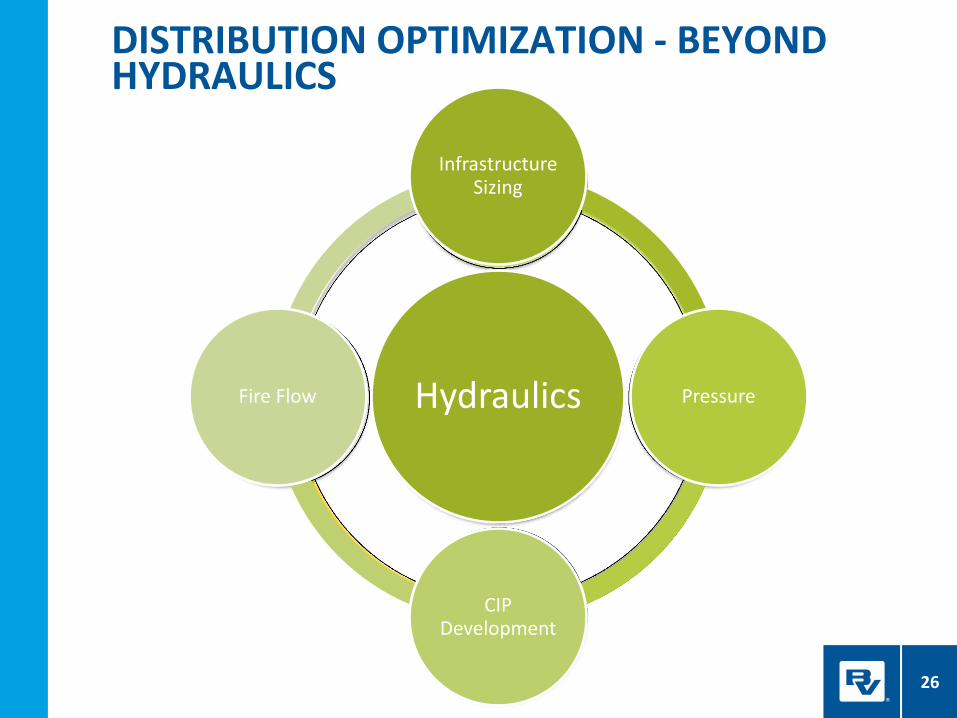
DISTRIBUTION OPTIMIZATION - BEYOND HYDRAULICS
Distribution
System Optimization
Hydraulics
Energy Management
GIS & Asset Management
Water Quality Hydraulics
Infrastructure Sizing
Pressure
CIP Development
Fire Flow
26
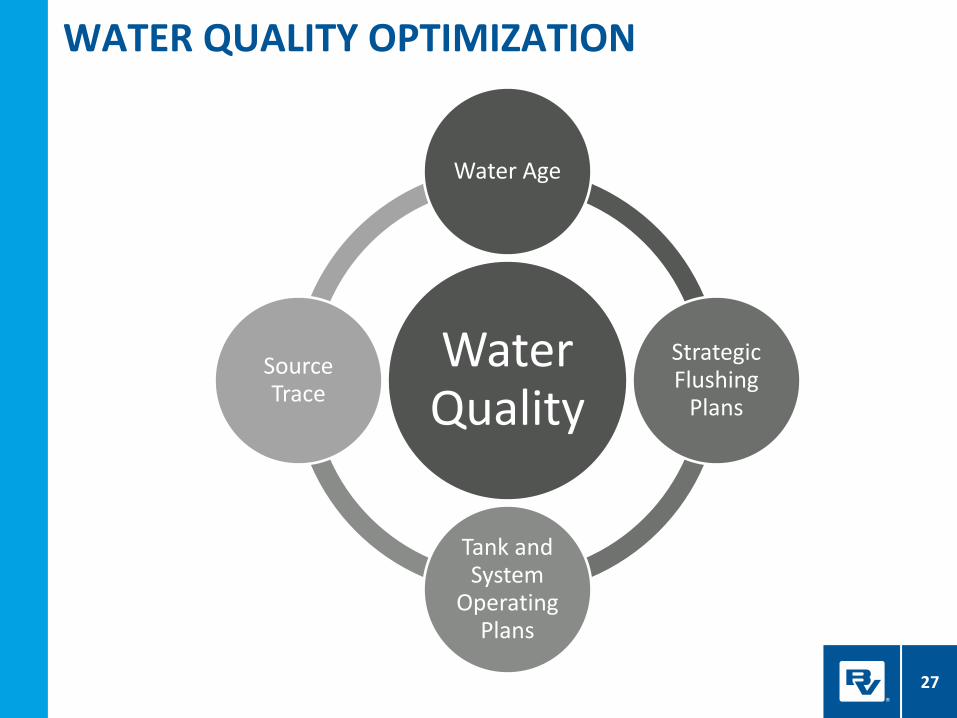
Water Quality
Water Age
Strategic Flushing
Plans
Tank and System
Operating Plans
Source Trace
WATER QUALITY OPTIMIZATION
27
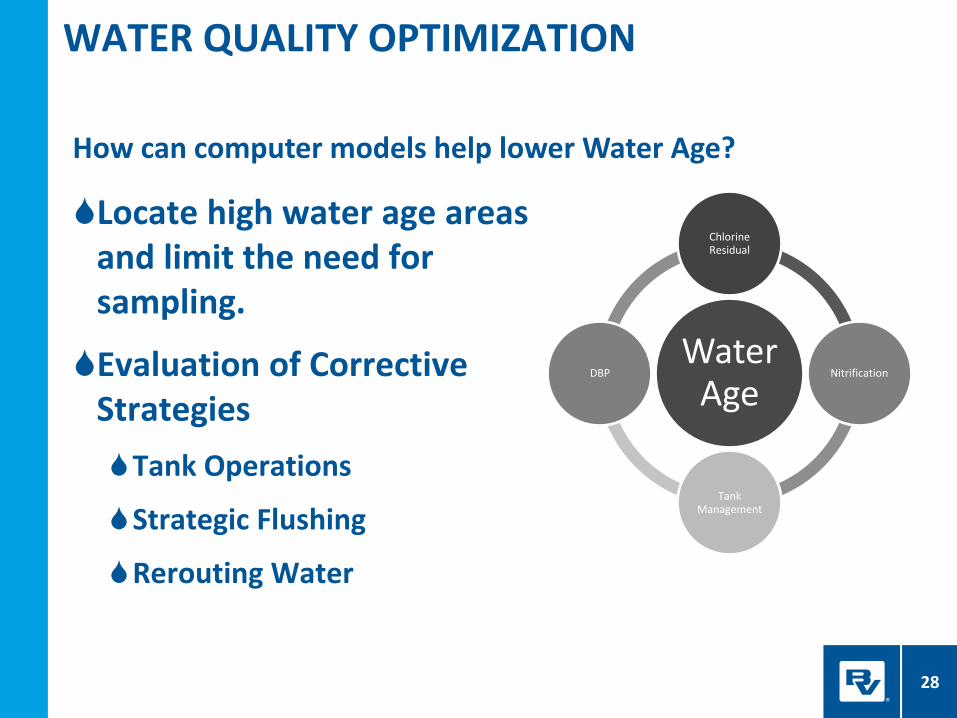
Locate high water age areas and limit the need for sampling.
Evaluation of Corrective Strategies
Tank Operations
Strategic Flushing
Rerouting Water
Water Age
Chlorine Residual
Nitrification
Tank Management
DBP
How can computer models help lower Water Age?
WATER QUALITY OPTIMIZATION
28
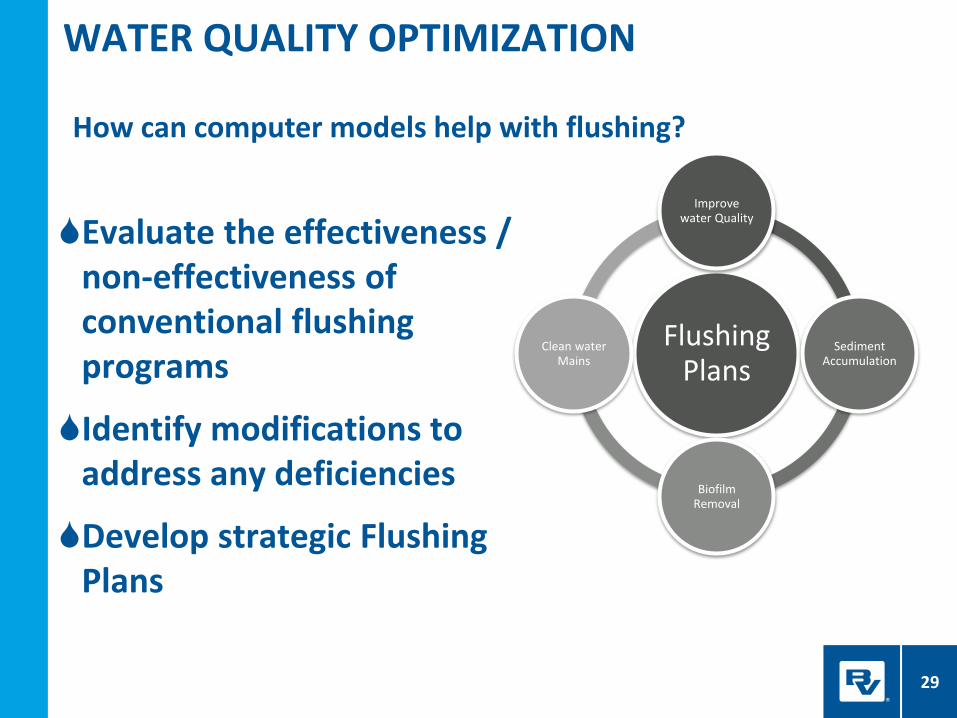
Flushing Plans
Improve water Quality
Sediment Accumulation
Biofilm Removal
Clean water Mains
Evaluate the effectiveness / non-effectiveness of conventional flushing programs
Identify modifications to address any deficiencies
Develop strategic Flushing Plans
How can computer models help with flushing?
WATER QUALITY OPTIMIZATION
29
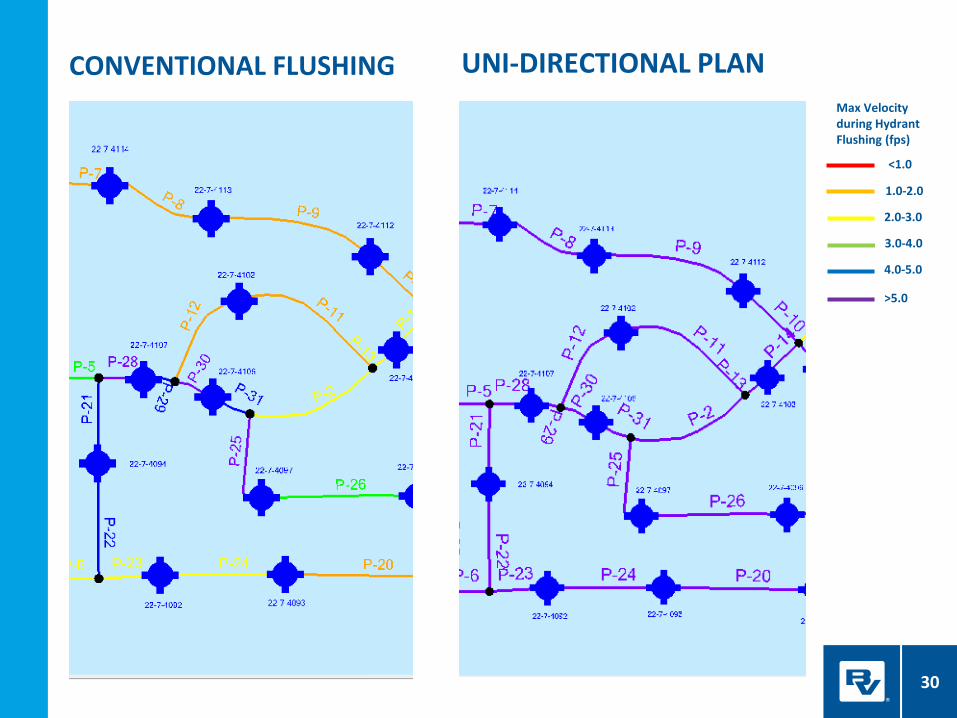
CONVENTIONAL FLUSHING
Max Velocity during Hydrant Flushing (fps)
<1.0
1.0-2.0
2.0-3.0
3.0-4.0
4.0-5.0
>5.0
UNI-DIRECTIONAL PLAN
30

Source trace used to track water movement throughout the system
Source Blending or New Source
Holistic Approach to Operating Plans to achieve quality goals
Managing a Contamination Event
How can computer models help with source and contamination management?
WATER QUALITY OPTIMIZATION
31
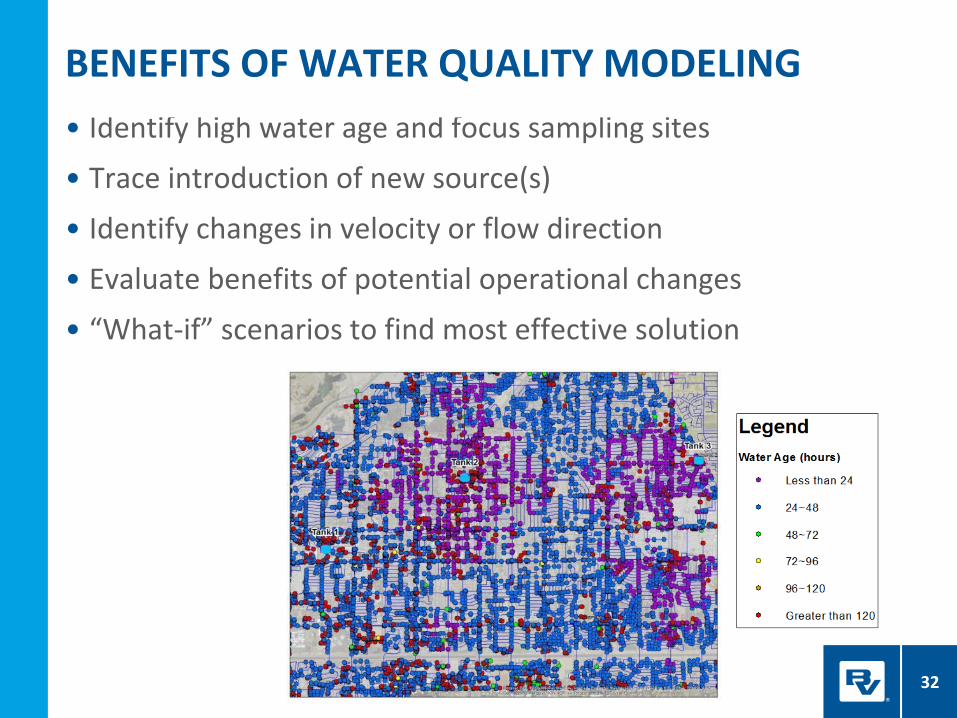
• Identify high water age and focus sampling sites
• Trace introduction of new source(s)
• Identify changes in velocity or flow direction
• Evaluate benefits of potential operational changes
• “What-if” scenarios to find most effective solution
BENEFITS OF WATER QUALITY MODELING
32
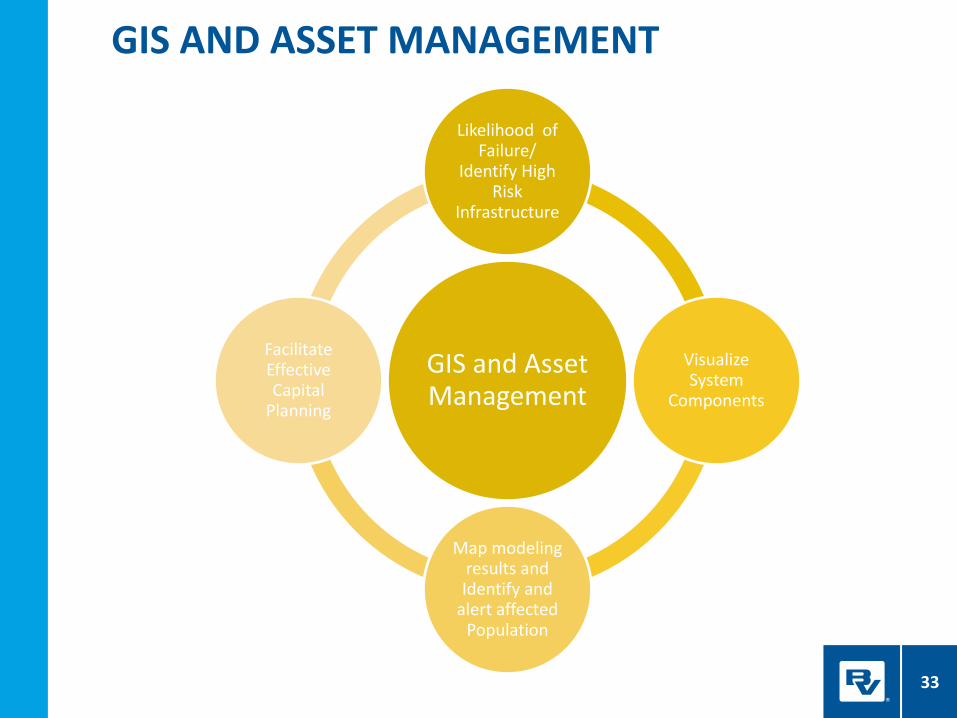
GIS AND ASSET MANAGEMENT
GIS and Asset Management
Likelihood of Failure/
Identify High Risk
Infrastructure
Visualize System
Components
Map modeling results and Identify and
alert affected Population
Facilitate Effective Capital
Planning
33

LINKING ASSET MANAGEMENT WITH WATER QUALITY
R3 = Replace the Right Facility at the Right Time with the Right Material.
Hydraulic / Quality Analysis Risk-Consequence Prioritized Improvements
Locational water quality
34
MOVING FROM COMPLIANCE TO OPTIMIZATION
35
CLOSING THOUGHTS
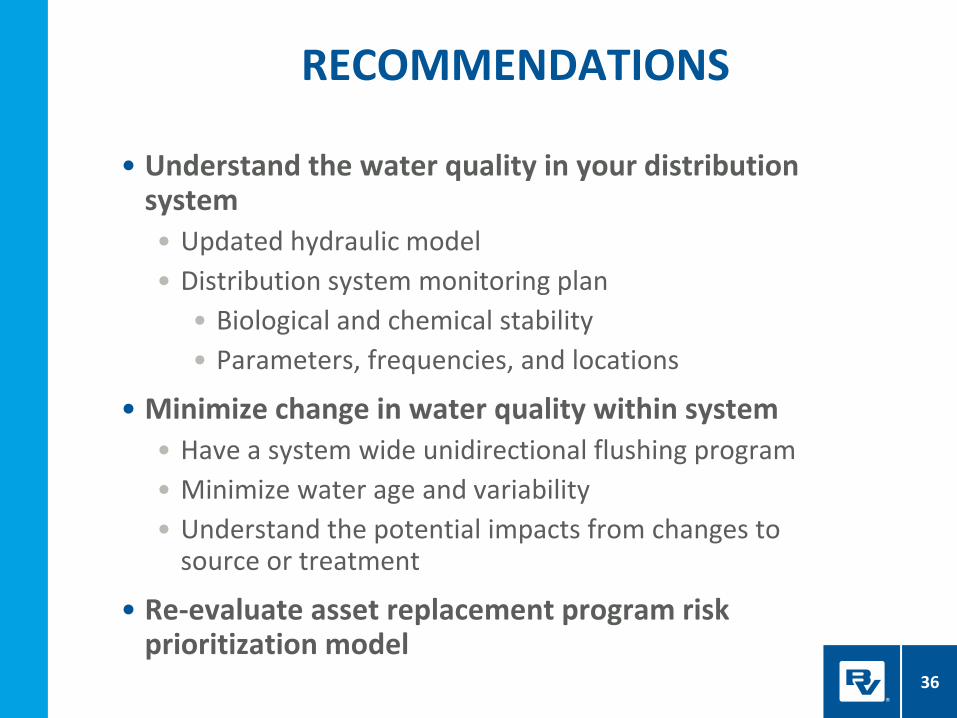
• Understand the water quality in your distribution system
• Updated hydraulic model
• Distribution system monitoring plan
• Biological and chemical stability
• Parameters, frequencies, and locations
• Minimize change in water quality within system
• Have a system wide unidirectional flushing program
• Minimize water age and variability
• Understand the potential impacts from changes to source or treatment
• Re-evaluate asset replacement program risk prioritization model
RECOMMENDATIONS
36
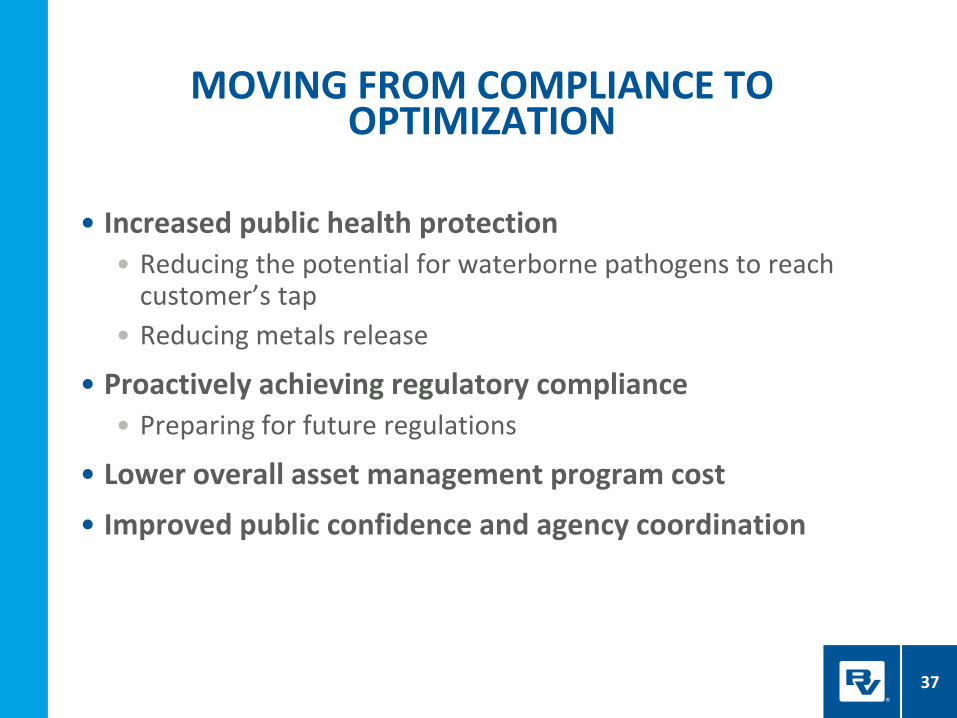
• Increased public health protection
• Reducing the potential for waterborne pathogens to reach customer’s tap
• Reducing metals release
• Proactively achieving regulatory compliance
• Preparing for future regulations
• Lower overall asset management program cost
• Improved public confidence and agency coordination
MOVING FROM COMPLIANCE TO OPTIMIZATION
37

• To submit a question, click on the question tab located on the dashboard
Q&A
38
• Thank you for your participation today
• To receive a certificate indicating 1 hour of continuing education, email Ben Klayman at [email protected]
• This webcast is being recorded. An email will be sent to participants with a link to the recording as well as the Q&A log.
• This webcast is part of a continuing series.
CLOSING THOUGHTS
39


