Insights from Drafting & Passage of North Carolina’s REPS Law (SB3) A Story of Outmoded Utility Regulation & Profit Model Running into Opportunity of the New Global Energy Economy, Security and Jobs Ivan Urlaub Executive Director NC Sustainable Energy Association Kentucky via Skype from North Carolina January 31, 2011
Transcript
Insights from Drafting & Passage of North Carolina’s
REPS Law (SB3)A Story of Outmoded Utility
Regulation & Profit Model Running into Opportunity of the New Global Energy Economy, Security and Jobs
Ivan UrlaubExecutive Director
NC Sustainable Energy Association
Kentucky via Skype from North CarolinaJanuary 31, 2011
Renewable Portfolio Standards
in our global energy economy
State Goal
State RPS
29 states have an RPS; 6 states have
an RE goal
Source: Database for State Incentives for Renewables and Efficiency. November 2009. www.dsireusa.org
Source: DSIRE database, REPS, 2010
Pre-REPS Policy – Lessons Learned
2003 – 2007• Voluntary Green Power Pricing Program (‘03)
• Net metering rule – rule insufficient, only one subscriber (‘05)
• Interconnection Standard <100kW (‘05)
• Clarified RECs belong to customer-generator, utility cannot take (‘05)
• Commercial investment tax credit increased to $2.5 million (‘05)
• Efficiency added to utility Integrated Resource Plans (‘06)
• NCUC changes rules, must include efficiency in long-term plan (‘06)
• “La Capra Study” of requiring RE and EE in NC (‘06)
– EE + RE will cost less than coal, natural gas and nuclear
• 1st REPS in Southeast, 25th in U.S. (‘07)
Source: Ivan Urlaub, NC Sustainable Energy Association. 2011
REPS Utility Compliance
2008 to 2018: Renewable Energy = 75%, Energy Efficiency = 25%
REPS will only deliver about 5.6% RE and 5% EE “in state” by 2021
Ivan Urlaub, NCSEA. Duke University, Nicholas School. Sep 15, 2010
REPS Coops & Munis Compliance
2008 to 2018: They can comply entirely with efficiency, load shifting
Ivan Urlaub, NCSEA. 2011
Story of SB3
• REPS Study Bill and lobbying, 2005• REPS “La Capra” Study, 2006• Study reveals EE + RE cheaper than
coal + natural gas +/- nuclear• Utilities wanted CWIP for coal, nuclear• REPS law as part of “Senate Bill 3”
Compromise with Duke & Progress Energy
• 90+ stakeholders negotiated bill over 7 months and 100+ large and small meetings
• Stakeholder concerns nearly all addressed
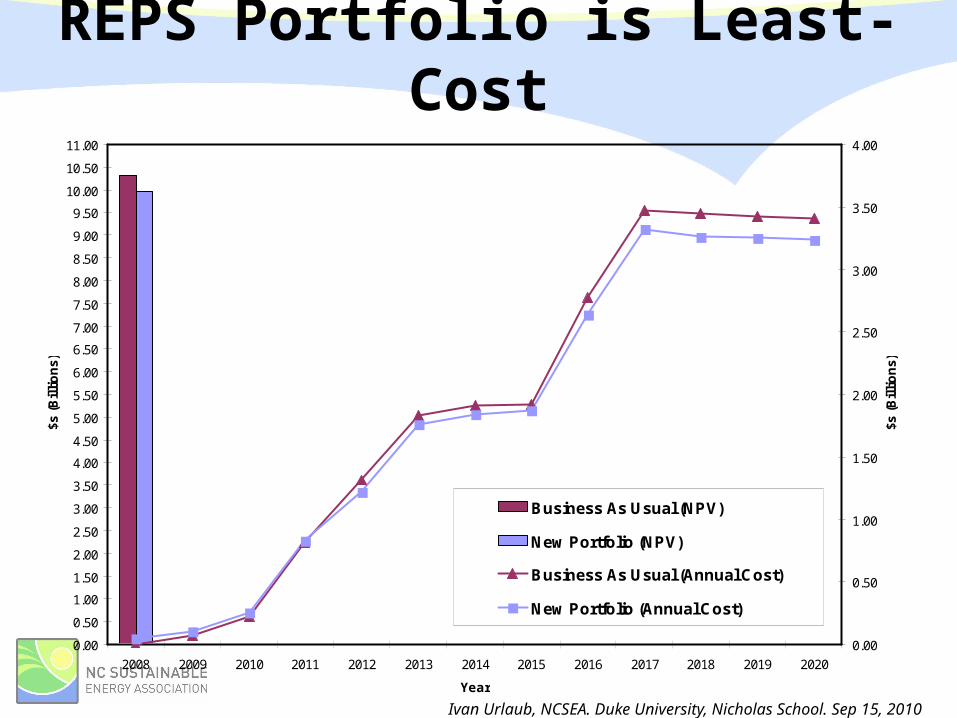
Key findings of NCUC Study
• La Capra study, cost for 2007 – 2017:– 7.5% from RE + 2.5% from EE costs less than
coal and natural gas to meet same need in 2017– 10% REPS costs less than new nuclear if nuclear
costs $3,000/kW or more – new Fed estimate is $5,000/kW
– Some nuclear facilities under construction are on a path to exceed $7,500/kW
• The more EE you commit to, the more cost effective your REPS policy becomes– NC has potential to meet 13% of electric
demand in 2017 with EE costing less than 5 cents / kWh
• New power plants cost more than existingLa Capra Associates, Analysis of the impact of the North Carolina Renewable Energy and Energy Efficiency Portfolio Standard for the State of North Carolina
Ivan Urlaub, NCSEA. Duke University, Nicholas School. Sep 15, 2010
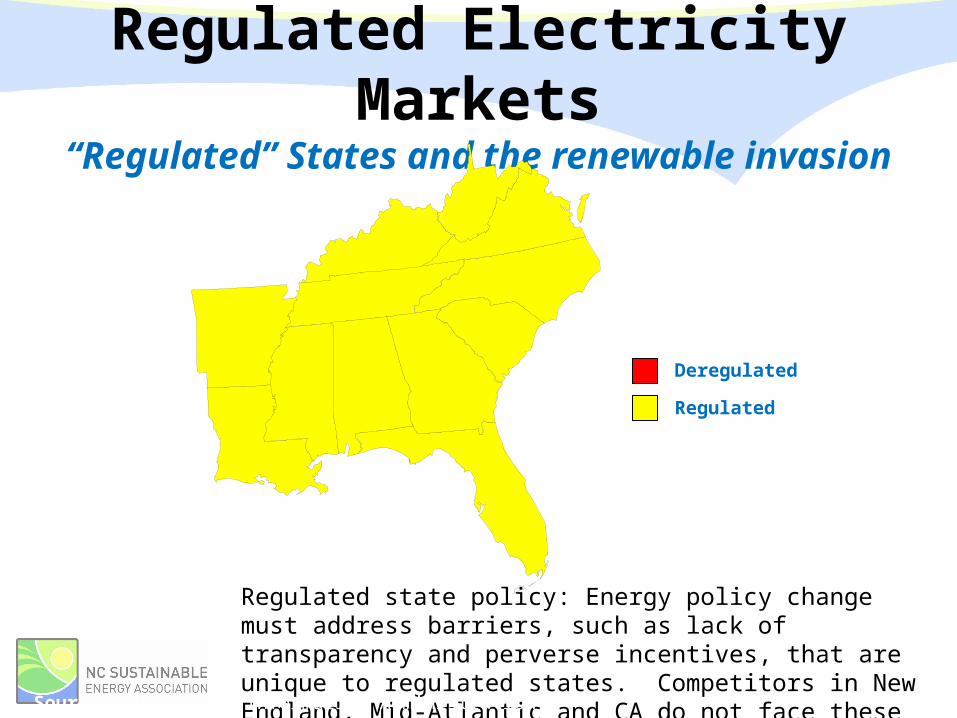
Regulated Electricity Markets
“Regulated” States and the renewable invasion
Deregulated
Regulated
Regulated state policy: Energy policy change must address barriers, such as lack of transparency and perverse incentives, that are unique to regulated states. Competitors in New England, Mid-Atlantic and CA do not face these same barriers.
Source: US Energy Information Administration.
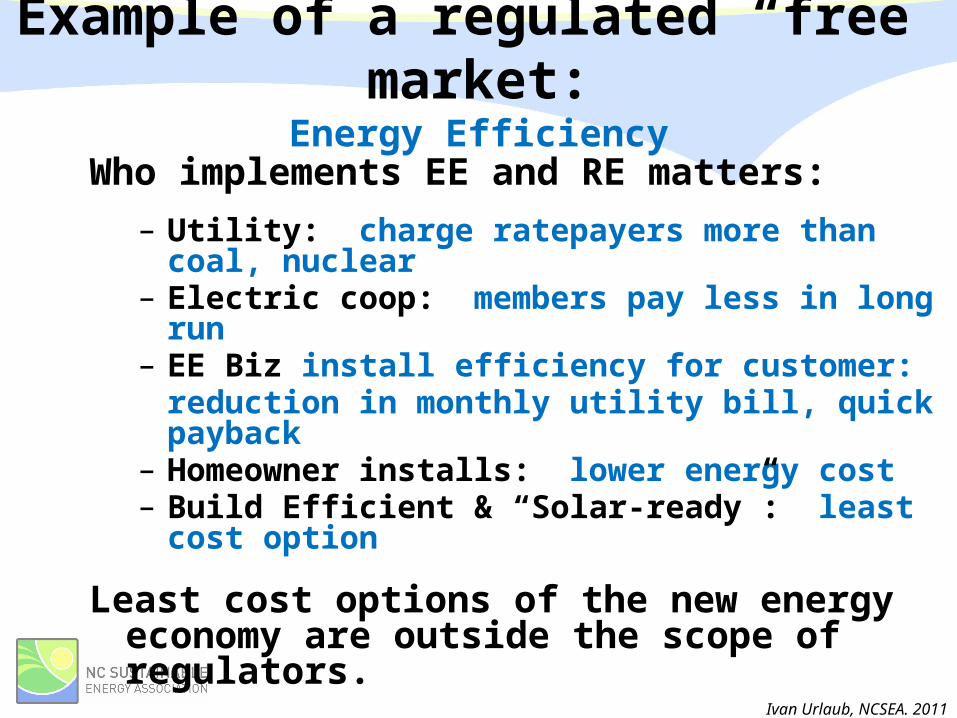
Example of a regulated “free” market:
Energy EfficiencyWho implements EE and RE matters:
– Utility: charge ratepayers more than coal, nuclear
– Electric coop: members pay less in long run
– EE Biz install efficiency for customer: reduction in monthly utility bill, quick payback
– Homeowner installs: lower energy cost– Build Efficient & “Solar-ready”: least cost
option
Least cost options of the new energy economy are outside the scope of regulators.
If more EE but do not change regulatory rate structure: utility earns less revenue, less profit, and lower earnings per share; all three become less predictable for utility shareholders/investors
Ivan Urlaub, NCSEA. 2011
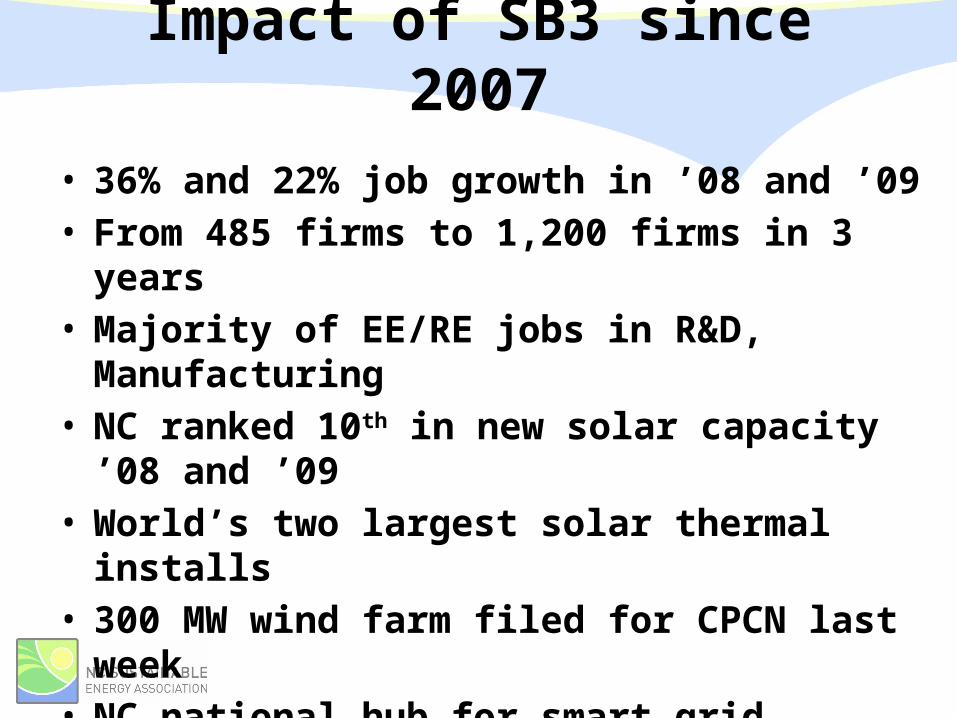
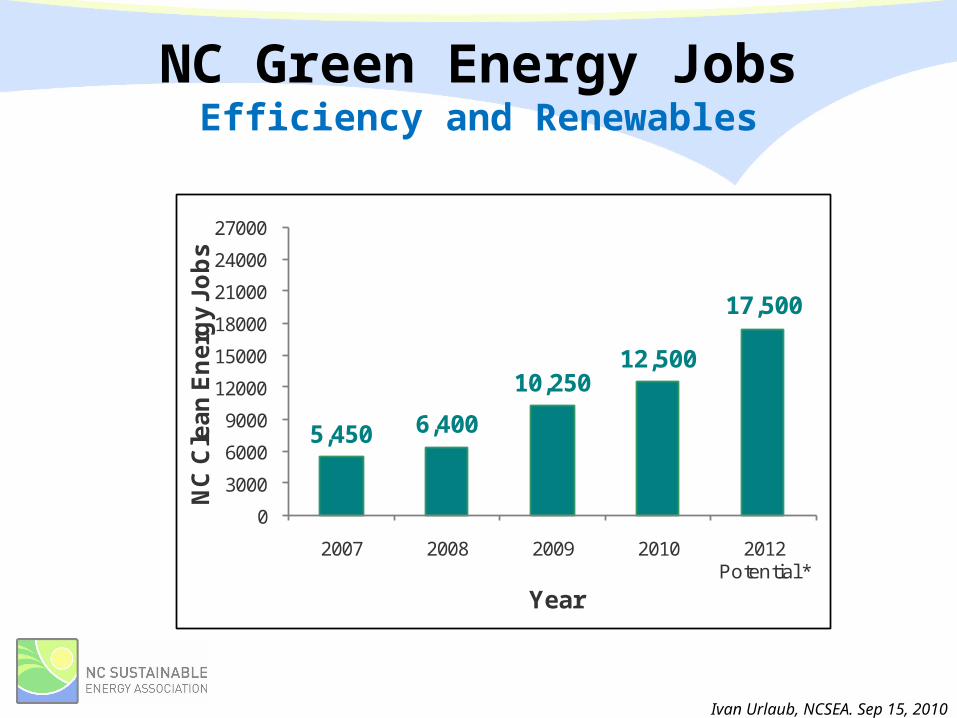
Impact of SB3 since 2007
• 36% and 22% job growth in ’08 and ’09• From 485 firms to 1,200 firms in 3
years• Majority of EE/RE jobs in R&D,
Manufacturing• NC ranked 10th in new solar capacity
’08 and ’09• World’s two largest solar thermal
installs• 300 MW wind farm filed for CPCN last
week• NC national hub for smart grid, energy
storage
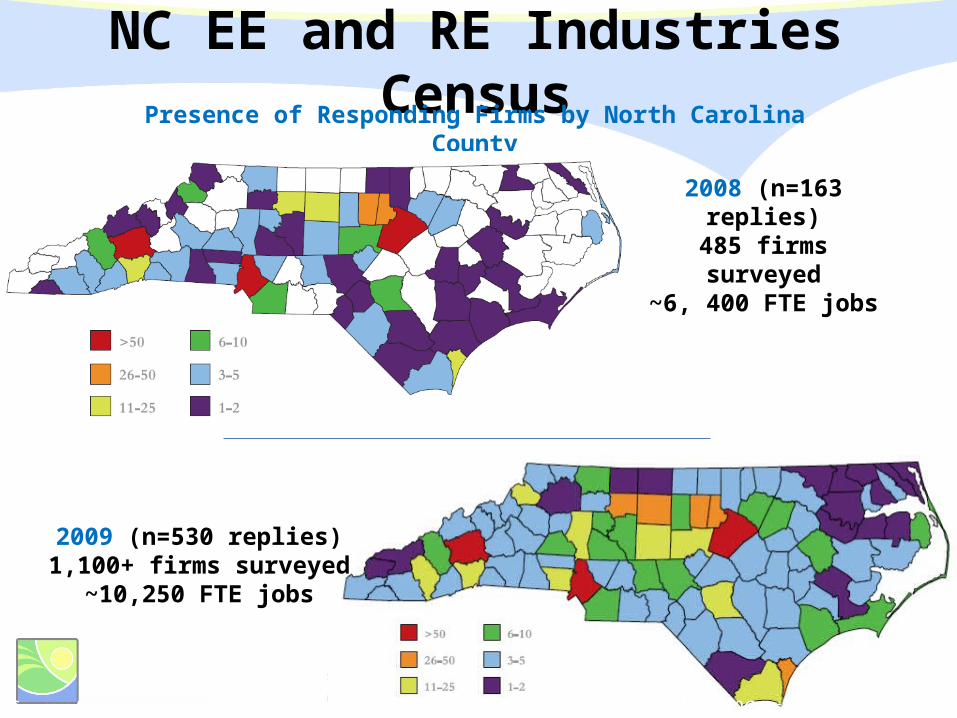
NC EE and RE Industries CensusPresence of Responding Firms by North Carolina County
• 2004 new investment: $46 billion• 2009 new investment: $162 billion• 2010 Forecast: $175 billion - $200
billion• 2019 Forecast: $325 billion• Comparison: NC is $400 billion of US
GDP
• Jobs in subset of solar and wind: – 2009: 831,000 jobs– 2019 Projection: 3.3 million jobsSource: Bloomberg New Energy Finance, March 2010. http://www.cleanedge.com/reports/charts-reports-trends2010.php
Thank you for your interest
Ivan UrlaubExecutive DirectorNC Sustainable Energy Association919.832.7601 ext. [email protected]
Ivan Urlaub, NCSEA. Duke University, Nicholas School. Sep 15, 2010
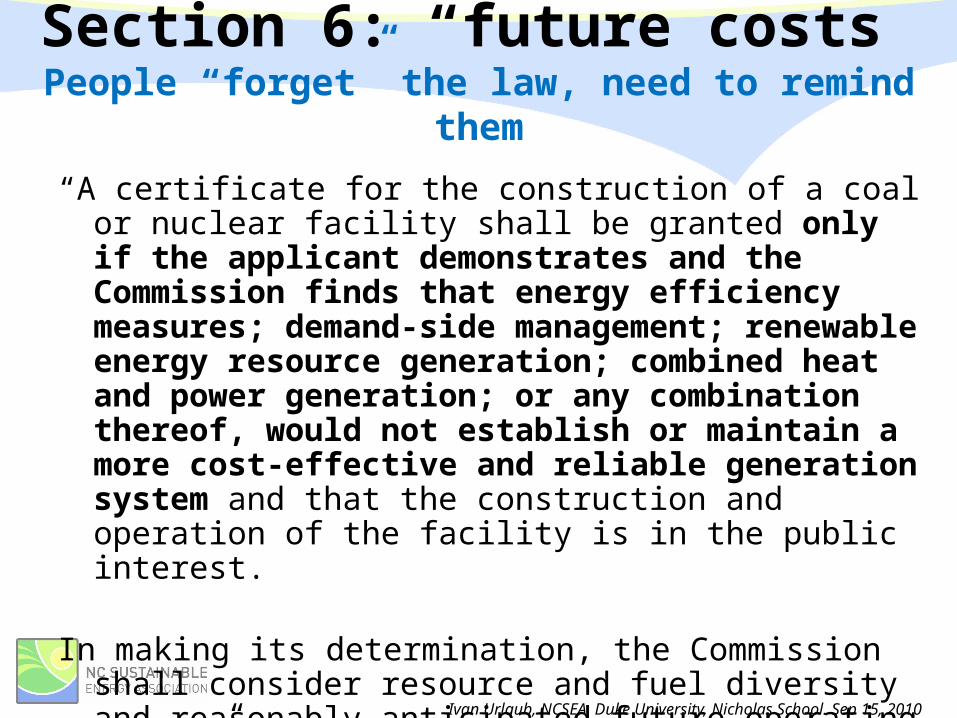
Section 6: “future costs”People “forget” the law, need to remind
them
“A certificate for the construction of a coal or nuclear facility shall be granted only if the applicant demonstrates and the Commission finds that energy efficiency measures; demand-side management; renewable energy resource generation; combined heat and power generation; or any combination thereof, would not establish or maintain a more cost-effective and reliable generation system and that the construction and operation of the facility is in the public interest.
In making its determination, the Commission shall consider resource and fuel diversity and reasonably anticipated future operating costs.” (page 13)
Ivan Urlaub, NCSEA. Duke University, Nicholas School. Sep 15, 2010