69


Insights from the first six months of JobKeeper
October 2021

© Commonwealth of Australia 2021
This publication is available for your use under a Creative Commons BY Attribution 3.0 Australia licence, with the exception of the Commonwealth Coat of Arms, the Treasury logo, photographs, images, signatures and where otherwise stated. The full licence terms are available from http://creativecommons.org/licenses/by/3.0/au/legalcode.
Use of Treasury material under a Creative Commons BY Attribution 3.0 Australia licence requires you to attribute the work (but not in any way that suggests that the Treasury endorses you or your use of the work).
Treasury material used ‘as supplied’
Provided you have not modified or transformed Treasury material in any way including, for example, by changing the Treasury text; calculating percentage changes; graphing or charting data; or deriving new statistics from published Treasury statistics – then Treasury prefers the following attribution:
Source: The Australian Government the Treasury
Derivative material
If you have modified or transformed Treasury material, or derived new material from those of the Treasury in any way, then Treasury prefers the following attribution:
Based on The Australian Government the Treasury data
Use of the Coat of Arms
The terms under which the Coat of Arms can be used are set out on the Department of the Prime Minister and Cabinet website (see www.pmc.gov.au/government/commonwealth-coat-arms).
Other uses
Enquiries regarding this licence and any other use of this document are welcome at:
Manager Media Unit The Treasury Langton Crescent Parkes ACT 2600
Email: [email protected]
Contents
Executive summary .......................................................................................................................1
Introduction ..................................................................................................................................5
1. JobKeeper design and implementation .......................................................................................6
Initial JobKeeper design ........................................................................................................................... 6
The JobKeeper Payment: Three-month review .....................................................................................15
Administration of the program and compliance activity .......................................................................16
2. JobKeeper program data .......................................................................................................... 18
JobKeeper take-up and coverage ...........................................................................................................18
3. Economic effect of JobKeeper .................................................................................................. 25
Impact of JobKeeper on confidence .......................................................................................................26
Impact of JobKeeper on employment ....................................................................................................26
Impact of JobKeeper on earnings ...........................................................................................................30
Impact of JobKeeper on economic activity ............................................................................................32
4. JobKeeper and business-level performance .............................................................................. 39
Analysis of JobKeeper recipients ............................................................................................................39
5. Future work ............................................................................................................................. 47
Evaluation of JobKeeper .........................................................................................................................47
Appendix 1: JobKeeper program data .......................................................................................... 49
Appendix 2: Detailed data on JobKeeper recipients by turnover ................................................... 59
Insights from the first six months of JobKeeper | v
List of boxes, figures, and tables Box 1: Key design features of JobKeeper ................................................................................................. 8
Box 2: Alternative decline in GST turnover tests ....................................................................................10
Box 3: Incentives created by a claw-back mechanism in JobKeeper .....................................................14
Figure 1: Separations and jobs by JobKeeper status and turnover .......................................................... 4
Figure 2: JobKeeper Payment as a wage subsidy and income transfer .................................................12
Figure 3: Businesses’ revenue, profits and JobKeeper impact ...............................................................14
Figure 4: Real quarterly GDP growth ......................................................................................................16
Figure 5: Distribution of JobKeeper entities and payments ...................................................................19
Figure 6: JobKeeper coverage of employment ......................................................................................20
Figure 7: Shares of employment and JobKeeper participants ...............................................................21
Figure 8: JobKeeper payments and coverage by industry .....................................................................22
Figure 9: JobKeeper individuals and coverage by industry ....................................................................22
Figure 10: JobKeeper entities and coverage by industry .......................................................................23
Figure 11: JobKeeper individuals – coverage by region .........................................................................24
Figure 12: Consumer and business confidence ......................................................................................26
Figure 13: Job separations by JobKeeper status ....................................................................................27
Figure 14: Entries into employment .......................................................................................................28
Figure 15: JobKeeper income transfer payments to workers ................................................................29
Figure 16: Labour market .......................................................................................................................30
Figure 17: Income sources as share of March quarter income, by quintile ...........................................31
Figure 18: Income support flows for individuals on the first phase of JobKeeper ................................32
Figure 19: Distribution of turnover growth outcomes for JobKeeper recipients ..................................34
Figure 20: Net saving in the household and non-financial corporate sectors .......................................36
Figure 21: Real GDP ................................................................................................................................37
Figure 22: International comparison of GDP and employment outcomes ............................................38
Figure 23: Cumulative distribution of turnover growth to June quarter ...............................................42
Figure 24: JobKeeper payments by business size and turnover category, $b .......................................43
Figure 25: Separations and jobs, by JobKeeper status and turnover .....................................................45
Table 1: JobKeeper payments, $b, and businesses within sample ........................................................40
Table 2: Turnover decline, %, by JobKeeper recipient status ................................................................41
Table 3: JobKeeper payments and individuals supported .....................................................................42
Table 4: JobKeeper take up – all phases of the program (April 2020 to March 2021) ..........................49
Table 5a: Distribution of JobKeeper entities and payments, Turnover size ..........................................50
Table 5b: Distribution of JobKeeper entities and payments, Entity type ..............................................50
Table 5c: Distribution of JobKeeper entities and payments, State ........................................................50
Table 6a: JobKeeper coverage of employment, Share of total vs private-sector employment ............51
Table 6b: JobKeeper coverage of employment, Share of total employment ........................................51
vi | Insights from the first six months of JobKeeper
Table 7a: JobKeeper first phase distribution of private sector employment, decline in employment, and JobKeeper participants, By sex .................................................................52
Table 7b: JobKeeper first phase distribution of private sector employment, decline in employment, and JobKeeper participants, By age ................................................................52
Table 8: JobKeeper first phase payments – levels and share of compensation of employees, by industry .............................................................................................................................................53
Table 9: JobKeeper first phase individuals – number and coverage of pre-COVID-19 employment, by industry .......................................................................................................................54
Table 10: JobKeeper first phase entities – number and coverage by industry ......................................55
Table 11: JobKeeper first phase coverage of pre-COVID-19 employment, distribution by SA4 ............56
Table 12: JobKeeper recipients by through-the-year turnover decline and size, June quarter 2020 .................................................................................................................................59
Table 13: JobKeeper recipients by through-the-year turnover decline and industry, June quarter 2020 ..................................................................................................................................60
Table 14: JobKeeper recipients by through-the-year turnover decline by state, June quarter 2020 ..................................................................................................................................61
Table 15: JobKeeper recipients by through-the-year turnover decline and size, September quarter 2020 ........................................................................................................................61
Table 16: JobKeeper recipients by through-the-year turnover decline and industry, September quarter 2020 ........................................................................................................................62
Table 17: JobKeeper recipients by through-the-year turnover decline by state, September quarter 2020 ........................................................................................................................63
Table 18: Employment increases in JobKeeper businesses with through-the-year turnover declines of less than 30 per cent in June quarter 2020, May to September 2020 .................63
Executive summary | 1
Executive summary The JobKeeper Payment was a wage subsidy and income support program delivered in the first year of the COVID-19 pandemic. It was a key element of the Australian Government’s macroeconomic response to the global health and economic crisis. This Insights report provides updated data and analysis on the first six months of the program, the initial phase of JobKeeper, and builds on the Treasury JobKeeper Payment: Three-month review.
JobKeeper was designed in an environment of significant uncertainty
JobKeeper was designed to support the economy during a period when widespread public health restrictions were being imposed to control the spread of COVID-19. JobKeeper’s purpose was to support business and job survival, keep employees connected to their employers, and provide income support to individuals. JobKeeper was the largest component of the Government’s macroeconomic stimulus package, delivered to support households and businesses during lockdown and improve the prospects for economic recovery once restrictions were eased.
There was a high degree of uncertainty about the economic outlook when JobKeeper was being designed, in terms of both the severity of the shock and its duration. In March 2020, the NAB monthly measure of business confidence fell 62 points to -66 points – the largest single month decline and lowest level since the survey began in 1997. At that time, Treasury considered it plausible that GDP could be 10 to 12 per cent lower in the June quarter than previously forecast. Treasury estimated the unemployment rate could increase to 15 per cent. An even weaker outlook with GDP falling by 24 per cent was considered possible if lockdowns and restrictions were extended to additional sectors as occurred in countries such as Italy and Spain.
JobKeeper provided six months of support to businesses that expected their turnover to fall substantially at the outset of the pandemic. Given the potential for a very severe outcome to materialise, it was designed to be simple and implemented rapidly, to maximise the amount of support delivered to households and businesses in the shortest possible time. Guaranteed support for six months was designed to provide certainty to businesses. The timeframe was linked to the health advice that restrictions could need to be in place for six months and the ongoing evolution of the pandemic was highly uncertain. It was understood that this risked making payments to businesses that recovered quickly and may not need support by the end of this period. A mechanism to claw back payments from businesses that performed better than expected was not included, reflecting a desire to avoid any disincentives for businesses to adapt and recover. The introduction of such a mechanism would likely have reduced the overall level of activity and muted the recovery.
At the time of the JobKeeper review in June 2020, it was judged appropriate to maintain JobKeeper in its current form for a further three months, even though there was evidence some businesses that were initially heavily impacted were showing signs of recovery. This judgement reflected the still heightened uncertainty surrounding both the pandemic and the economic recovery, the weak economic conditions at the time, and the role that JobKeeper was playing as part of the broader macroeconomic response. Eligibility for JobKeeper moved from an assessment of anticipated decline to actual decline in turnover as the recovery strengthened.

2 | Insights from the first six months of JobKeeper
In the first six months, JobKeeper payments went to businesses strongly affected by health restrictions
JobKeeper payments were targeted to:
• Businesses strongly affected by the pandemic: JobKeeper businesses faced a median decline in turnover of 28 per cent over the year to the June quarter and 23 per cent over the year to the September quarter 2020. This compared with no decline in median turnover for other businesses.
• Businesses at high risk of shedding employees: in March 2020, the job separation rate at JobKeeper businesses had almost doubled due to the COVID-19 health restrictions, but was broadly unchanged in other businesses.
• Sectors directly affected by the public health restrictions: JobKeeper payments were made to around half of the individuals employed in the arts and recreation industry and around 35 per cent in the accommodation and food services industry.
• Small businesses and not-for-profit entities: 99 per cent of entities receiving JobKeeper had a turnover of less than $50 million or were not-for-profits, and over 80 per cent of JobKeeper payments went to these entities. These groups were particularly vulnerable to the impact of health restrictions because of their limited ability to weather economic shocks. (Large businesses with a turnover of more than $250 million made up 0.2 per cent of JobKeeper entities and received around 11 per cent of payments.)
JobKeeper kept employers and employees connected
In May 2020 it is estimated that around 12 per cent of JobKeeper recipients – about 375,000 workers – had been stood down from their job and were only receiving JobKeeper payments. From June to September 2020, an average of around 260,000 stood-down workers were only receiving payments due to JobKeeper each month. Moreover, many JobKeeper workers returned to their jobs after short periods on JobSeeker.
JobKeeper supported productivity and business recovery
In the first six months of the program, JobKeeper went disproportionately to more productive businesses, particularly ones that were financially fragile and which may have had difficulty surviving a period of reduced revenue during restrictions. This helped prevent longer-term scarring by preserving important business-specific capital, knowledge and relationships.
Some businesses did not have large declines in their turnover in the first six months of the program when compared with a year earlier
In the first six months of the scheme, eligibility for JobKeeper was based on a business’s forecast of its turnover decline, over a month or a quarter, to enable the payment to be made rapidly given the unfolding crisis.
Analysis of turnover data indicates that $11.4 billion and $15.6 billion in the June and September quarters 2020 was paid to businesses whose turnover did not decline by 30 per cent (or 50 per cent) compared with a year earlier. JobKeeper payments to these businesses covered on average around 1.45 million individuals. Around $6.8 billion and $6.4 billion in the June and September quarters was paid to businesses whose turnover fell, but not by 30 per cent (or 50 per cent), and $4.6 billion and $9.2 billion, respectively, was paid to businesses with a turnover increase compared with a year earlier. This analysis does not, however, indicate whether businesses were adversely affected by COVID-19 restrictions.

Executive summary | 3
Some businesses, in particular, experienced a decline in turnover following the imposition of the COVID-19 restrictions, but because they were growing businesses or had otherwise changed their structure, this is not evident when their turnover is compared with a year earlier. Estimates suggest that at least $4.9 billion of the $13.8 billion paid to businesses with higher turnover through the year went to growing or changing businesses. These businesses were allowed to use a different test to determine their eligibility for JobKeeper to more accurately reflect the size of the business at the onset of the pandemic. JobKeeper payments to these businesses were important to offset the impact of COVID-19 restrictions on their operations and avoid labour shedding. Abstracting from payments to businesses that had grown strongly over the previous year but appear to have been adversely affected in the quarter, the payments to businesses that increased their turnover compared with a year earlier amounted to around $8.9 billion. These payments covered on average around 480,000 individuals.
Most of the businesses that did not experience declines in turnover of 30 per cent (or 50 per cent) were small businesses. Of the businesses that did not experience the 30 per cent turnover decline, 99 per cent were small (having a turnover of less than $50 million), and $22.5 billion in payments went to these businesses. These businesses had, on average, around four employees. Small businesses accounted for $12.1 billion (88 per cent) of JobKeeper payments that were made to businesses that had increased turnover. Less than $200 million was paid to businesses with a turnover above $1 billion whose turnover increased.
For many businesses that were eligible for JobKeeper but did not end up experiencing their projected decline in turnover, this was because health restrictions were eased earlier, and these businesses’ operations recovered more rapidly than expected. Other businesses were able to operate as a result of the support and successfully adapted their business models.
This analysis does not suggest any of these businesses were ineligible for the JobKeeper Payment. Eligibility for JobKeeper was based on a prospective assessment of a business’s expected change in turnover, and there were a number of different tests that businesses in different circumstances were allowed to use. The Australian Taxation Office (ATO) set out guidance on how to undertake the decline in turnover test/s and the relevant evidence to support the turnover decline estimate, including where using an alternative test. The ATO has established that the vast majority of JobKeeper businesses reasonably estimated their projected decline in turnover.
Most of the businesses who did not experience their expected decline in turnover were still significantly negatively impacted by COVID-19. In particular, the number of separations for these businesses increased by almost 60 per cent in late March 2020, compared to almost no increase for non-JobKeeper businesses (Figure 1a). The number of jobs at these businesses also declined sharply at the start of the crisis and remained below the level for non-JobKeeper businesses at the end of September 2020 (Figure 1b). Following the introduction of JobKeeper, job shedding declined sharply in these businesses and employment outcomes substantially recovered, with estimates suggesting around 200,000 JobKeeper workers were brought back once the policy was introduced. As the economy recovered and these businesses expanded and pivoted production, hours worked for JobKeeper workers increased, as did employment of non-JobKeeper workers, by an estimated 150,000.

4 | Insights from the first six months of JobKeeper
Figure 1: Separations and jobs by JobKeeper status and turnover a. Separations b. Jobs
Note: Figure 1 presents fortnightly time series of jobs and job separations, indexed to equal 100 in the fortnight ending 1 March 2020. Separations are based on cease dates for a worker’s employment relationship with a business (it can include workers who were on zero pay). Series exhibits volatility around end of financial year, which has been corrected. Payroll jobs are based on employee-employer relationships with pay, including any JobKeeper amounts. Dashed line indicates start of JobKeeper. Turnover analysis is based on June quarter 2020 data compared with a year earlier. Source: Treasury analysis of de-identified administrative data (STP and BAS data linked to JobKeeper status).
JobKeeper played an important role in macroeconomic stabilisation and recovery
JobKeeper was designed to support households and businesses during lockdowns so that the economy was in the best position to adapt to lockdown conditions and recover quickly once restrictions eased.
Without the Government’s significant fiscal support, including JobKeeper, Treasury has estimated that the peak of the unemployment rate would have been at least 5 percentage points higher. Without the support provided by JobKeeper and other measures, many individuals could have faced extended periods of unemployment. And many businesses that recovered – even those that recovered quickly – may not have been able to do so.
This broad fiscal support came through two channels: by directly supporting businesses and households and by supporting confidence and reducing uncertainty across the economy. Combined with other macroeconomic measures and the successful control of the virus, JobKeeper contributed to stronger economic outcomes, and better business performance, than anticipated. The fall in employment following the outbreak of COVID-19 was rapid and much sharper than in previous downturns, but as a result of the policy support and better-than-expected health outcomes the recovery in employment was also faster than in previous episodes.
Australia’s economic and health outcomes were better than many comparable countries. In the June quarter 2020, real GDP fell by 19.5 per cent in the United Kingdom, 11.3 per cent in Canada, and 10.0 per cent in Germany, compared with 7.0 per cent in Australia. By March 2021, Australia had surpassed its pre-COVID-19 levels of GDP and employment, a better outcome than all major advanced economies.
0
50
100
150
200
250
0
50
100
150
200
250
Feb-20 Apr-20 Jun-20 Aug-20 Sep-20
IndexIndex
50
60
70
80
90
100
110
50
60
70
80
90
100
110
Feb-20 Apr-20 Jun-20 Aug-20 Sep-20
IndexIndex
Introduction | 5
Introduction JobKeeper was a wage subsidy and income support program introduced at the beginning of the COVID-19 pandemic. It was a key element of the Australian Government’s macroeconomic response to the pandemic. JobKeeper was announced on 30 March 2020 and ended on 28 March 2021. This Insights report draws together analysis undertaken by Treasury on the first six months of JobKeeper (to 27 September 2020) and builds on the JobKeeper Payment: Three-month review (JobKeeper review).1 The report is divided into five sections.
• Section 1 outlines the development of JobKeeper, including the economic and health context in which JobKeeper was developed, JobKeeper design features, and changes made to the policy over time.
• Section 2 provides updated summary program data on JobKeeper recipients.
• Section 3 provides analysis on the economic effect of JobKeeper.
• Section 4 discusses analysis on JobKeeper and business-level performance.
• Section 5 outlines future evaluation and audit activities planned for JobKeeper.
The report draws on ongoing analysis undertaken by Treasury throughout 2020 and 2021 on JobKeeper and macroeconomic developments. This analysis has been updated over time as more data have become available and will continue to be updated. A full evaluation of JobKeeper that considers the process to design and implement JobKeeper, and its economic and broader impacts will be completed in 2022 to provide an assessment of JobKeeper against its policy objectives and record lessons learned for future policy design. This will complement other analysis of the JobKeeper program that is being undertaken by the Australian National Audit Office (ANAO) and by researchers and academics supported by the availability of the JobKeeper administrative data.
1 Australian Treasury, The JobKeeper Payment: Three-month review, July 2020.

6 | Insights from the first six months of JobKeeper
1. JobKeeper design and implementation
Summary
JobKeeper was developed in the second half of March 2020 in response to the worsening health and economic situation in Australia. The health advice at the time was that severe restrictions to control the spread of COVID-19 may need to be in place for six months or more. Treasury modelling suggested that the June quarter 2020 could see 2.1 million fewer people working.
JobKeeper was designed to provide income support to households and businesses while restrictions were in place and to assist the economy stabilise and then recover.
Key design elements were:
(a) ATO delivery which supported an effective and rapid rollout using existing integrity provisions
(b) A prospective turnover test which allowed eligibility to be determined almost immediately
(c) A flat payment structure that was broadly equal to the National Minimum Wage and made
JobKeeper simple and easy to administer
(d) A requirement for full pass through to employees providing income support while preserving
employment connections
(e) Guaranteed support for six months which provided certainty in a highly unpredictable
environment and encouraged businesses to operate, adapt and innovate
The JobKeeper review in June 2020 found that JobKeeper had met its objectives and recommended
that the scheme remain unchanged until the end of September 2020.
Initial JobKeeper design
Context
JobKeeper was announced on 30 March 2020.2 It was developed in the second half of March 2020 in response to the worsening health and economic situation in Australia, including the need for wide-ranging government restrictions on economic activity to contain the spread of COVID-19.3 It followed the first and second economic stimulus packages that were announced on 12 and 22 March 2020.4
2 Prime Minister and Treasurer’s joint media release $130 billion JobKeeper payment to keep Australians in
a job on 30 March 2020. 3 The Treasury Secretary’s June 2020 Opening Address to the COVID-19 Senate Committee provides further
detail on the health considerations, social distancing restrictions and economic situation at the time of the development of JobKeeper.
4 Prime Minister and Treasurer’s joint media releases announcing the first and second economic stimulus packages: Economic Stimulus Package on 12 March 2020 and Supporting Australian workers and businesses on 22 March 2020.

1. JobKeeper design and implementation | 7
In the weeks leading up to the announcement of JobKeeper, it became evident that Australia would need to take unprecedented measures to restrict the spread of COVID-19. Severe restrictions on activity were enforced in China during January and February 2020 and, as the virus spread around the world, by mid-March lockdowns were being imposed in parts of Europe and the United States.
From 11 March, cases of COVID-19 in Australia doubled every few days, reaching over 1,000 by 21 March, over 2,000 by 24 March and over 4,500 by the end of March 2020. Ever greater restrictions were being placed on household and business activities from mid-March onwards. Together with the increasingly cautionary behaviour in response to the highly uncertain health situation, this was having a significant effect on economic activity. In March 2020, the ANZ measure of consumer confidence fell by around 38 per cent to 65.3, a record low for the index. NAB business confidence fell by 62 points to -66 points in the month, its largest single month decline and the lowest level since the survey began. By mid-March, the ASX had lost one-third of its value and the functioning of government bond markets and other financial markets had rapidly deteriorated.
JobKeeper was developed as it became clear health restrictions needed to be tightened even further. Advice from the Chief Medical Officer and the Department of Health was that severe restrictions may be required for six months or more.5 There was active consideration and widespread public discussion of allowing only a narrowly defined list of essential industries to operate, similar to lockdowns put in place in Italy, Spain, the United Kingdom, France and New Zealand.
The high degree of uncertainty and the restrictions on activity announced on 18 March 2020 saw businesses begin to lay off staff. This included some of the country’s largest companies. Virgin Australia, Star Entertainment Group and Mosaic Brands laid off tens of thousands of staff. Lengthy queues formed outside Centrelink offices on 23 March 2020. The Australian Bureau of Statistics (ABS) reported on 26 March 2020 that 86 per cent of all businesses expected to be adversely impacted by COVID-19.6
At the time, Treasury developed a scenario based on restrictions announced by National Cabinet on 24 March 2020 being in place for six months. This modelling suggested that GDP could be 10 to 12 per cent lower than otherwise forecast in the June quarter with around 2.1 million fewer people working. Uncertainty around the outlook was very high and Treasury also modelled a scenario with COVID-19 restrictions akin to the lockdowns in Europe, resulting in GDP 24 per cent, or $120 billion, lower with around 4.8 million fewer people working. Some countries subsequently experienced falls of this magnitude including the United Kingdom where GDP contracted by 19.5 per cent in the June quarter 2020.
JobKeeper design
JobKeeper was part of a significant macroeconomic support package that was designed to respond to the unprecedented economic uncertainty and to reduce the risk of a severe economic downturn. It was intended to provide income support to households and businesses while restrictions were in place and to ensure that the economy could stabilise, adapt to the changed operating environment and then recover quickly once restrictions were eased. It was designed to do this by:
• providing income support to people who were no longer able to work some or all of their previous hours (which also worked to support consumer spending)
5 Australian Health Protection Principal Committee (AHPPC) coronavirus (COVID-19) statement on
17 March 2020. 6 ABS Business Indicators, Business Impacts of COVID 19, March 2020.

8 | Insights from the first six months of JobKeeper
• keeping those people connected to their employers so that businesses could restart quickly and easily once restrictions were eased and to avoid labour market scarring
• providing support to businesses to help them survive, while also encouraging them to continue to operate and thrive where possible
A central consideration in designing the macroeconomic support package was ensuring the overall level of fiscal support was sufficient to provide a credible offset to the economic shock being experienced. Sizeable macroeconomic support was required to provide certainty and give households and businesses confidence that they would be able to endure the crisis. By preventing the destruction of businesses and human capital, JobKeeper was designed to support a strong and rapid recovery.
To achieve these goals and maximise take-up, the scheme needed to be simple for businesses to understand and engage with. It also needed to be delivered as quickly as possible. The scheme was explicitly designed to be a time-limited program to address the downside risks to the economic outlook that were most evident at the time.
Box 1: Key design features of JobKeeper
First phase – 30 March 2020 to 27 September 2020
Payment level – A flat taxable payment of $1,500 per fortnight paid in full to eligible employees.
Business entity eligibility – Employers were required to determine whether they projected a
decline in their Goods and Services Tax (GST) turnover for a month or quarter during the program
compared with a similar period in 2019 (or meet an alternative test). Eligibility criteria varied by
entity size and type – expected declines in turnover of 15, 30 or 50 per cent were required for a
charity, a business with $1 billion or less in aggregated annual turnover, or a business with more
than $1 billion in turnover, respectively. A range of organisations were ineligible, such as
government entities.
Worker eligibility – Eligible employees included full-time and part-time employees and casual
employees who had been employed on a regular and systematic basis for at least 12 months,
including stood-down employees. Eligible employees had to be Australian residents or those on
Special Category 444 visas, aged at least 18 years old in most cases, and employed as of
1 March 2020. Some individuals who were not ‘employees’ could be nominated as an eligible
business participant, such as sole traders. The one-in-all-in rule meant that a participating
organisation had to nominate all eligible employees for JobKeeper unless the individual was
receiving JobKeeper through a different employer.
Delivery – Eligible employers were required to pay their employees a minimum of the JobKeeper amount after tax for each JobKeeper fortnight. Employers were reimbursed for the payments to employees on a monthly cycle, in arrears, through the ATO following a claim process. Existing channels for business engagement with the ATO were used to assist the delivery and administration of JobKeeper.

1. JobKeeper design and implementation | 9
The use of existing ATO channels to deliver the payment was the most effective, rapid and robust mechanism for the delivery of JobKeeper. It allowed businesses to use their existing systems and processes to meet the requirements and obligations of JobKeeper. The first JobKeeper payments were made just over five weeks after the announcement, in the first week of May 2020. The use of existing systems and concepts also enabled the ATO to use its existing compliance and risk programs as well as information already reported to the ATO in prior periods to identify potential compliance or integrity issues from the outset of the scheme.
However, there were also costs imposed by these design decisions. While support was targeted to each entity on a consistent basis, the eligibility tests did not vary by specific business models. For example, mixed businesses that did not meet the decline in turnover threshold but had limited ability to cross-subsidise may not have qualified for the payment. And because the tests were based on turnover, rather than profitability, they did not distinguish between high and low profit margin businesses.
Another feature that aided the rapid rollout of the scheme was that eligibility was determined on a prospective basis, rather than requiring evidence of an actual decline in turnover. This allowed eligibility to be determined almost immediately and for those payments to be quickly passed through to employees. The ATO provided guidance on how make a reasonable estimate of future turnover in a Law Companion Ruling (LCR), including how to reasonably determine whether the business would stay open. The LCR explained the relevant evidence that would be accepted to support a prediction
Second phase – 28 September 2020 to 28 March 2021
Payment level
Time period Tier 1 Tier 2
Part 1 – 28 September 2020 to 3 January 2021
A payment rate of $1,200 per fortnight for all eligible employees who, in the four weekly pay periods before the reference period, were working 20 hours or more per week on average and for business participants who were actively engaged in the business for 20 hours or more per week.
A lower payment of $750 per fortnight for employees who were working less than 20 hours per week on average and business participants who were actively engaged in the business less than 20 hours per week in the reference period.
Part 2 – 4 January 2021 to 28 March 2021
A payment rate of $1,000 per fortnight for all eligible employees who, in the four weekly pay periods before the reference period, were working 20 hours or more per week on average and for business participants who were actively engaged in the business for 20 hours or more per week.
A lower payment of $650 per fortnight for employees who were working less than 20 hours per week on average and business participants who were actively engaged in the business for less than 20 hours per week in the reference period.
Employer eligibility – To be eligible for the JobKeeper extension, businesses and not-for-profits
needed to demonstrate they had experienced an actual decline in turnover (as opposed to a
prospective decline) using actual GST turnover for a certain reference period. Those same rates of
decline depending on entity size and type that were used as a threshold for the first phase were
also used in the second phase.
Worker eligibility reference period – from 3 August 2020 onwards, the date for assessing
employee eligibility for the scheme moved from those employed on 1 March to 1 July 2020.

10 | Insights from the first six months of JobKeeper
of turnover.7 While this guidance provided a useful structure for businesses, some businesses in similar circumstances could have arrived at different forecasts of turnover, resulting in different outcomes in terms of their assessments of their eligibility for the payment. The ATO had the ability to recoup payments where projections were deemed unreasonable to ensure the integrity of the program.
Alternative tests were also included to allow for circumstances where the level of turnover a year earlier would not have provided a reasonable point of comparison (see Box 2 for further information). For new and rapidly growing businesses and for businesses that, for example, had been adversely affected by drought the year earlier, comparing to a much lower level of turnover one year prior would have understated the effect of the pandemic on the business. Other modifications to ordinarily reported GST turnover were made to operationalise the scheme, particularly for not-for-profit entities.
7 The ATO also noted in the LCR “In calculating your projected GST turnover you are not expected to take
into account the impact that the JobKeeper payments may have on your ongoing business. To do this would be to presume the answer to the very question you are asking.” Source: Australian Taxation Office, Law Companion Ruling 2020/1, May 2020.
Box 2: Alternative decline in GST turnover tests
Alternative tests to determine eligibility were included in the program. These catered for events or circumstances that resulted in the relevant comparison period in 2019 not being appropriate for assessing the impact of the pandemic on the business.
These tests covered situations where the business:
• was new, having been established within the previous year
• had acquired or disposed of significant assets
• had been restructured
• had been growing rapidly over the previous year
• had been affected by a drought or natural disaster
• had experienced irregular turnover
• was a sole trader or small partnership having a sickness, injury or leave
In these situations, businesses were allowed to use an alternative comparison period to ensure a broad set of business situations were covered. Generally, alternative periods were for different months/quarters that preceded/proceeded the ordinary comparison period or the year prior was used.
Data on the use of alternative tests was not collected in a manner that allows for detailed analysis on use of these tests in the first six months of the program.

1. JobKeeper design and implementation | 11
To demonstrate they were substantially affected by the lockdowns, businesses were generally required to demonstrate that they expected a decline in GST turnover of at least 30 per cent in a month or quarter compared with a similar period a year earlier. The decision to use GST turnover reflected a preference for using existing mechanisms and concepts, which was important for simplicity, for the integrity of the scheme and for the rapid rollout. The threshold decline of 30 per cent was judged to be significant enough to capture businesses that were genuinely expecting to be affected by the lockdowns, but not too large to make it difficult for businesses to qualify for the payment.
Take-up was supported by the simple design of JobKeeper. For example, the first phase of JobKeeper had a flat payment of $1,500 per fortnight paid in full to eligible employees and other individuals. The $1,500 payment was broadly equal to the National Minimum Wage for an adult full-time employee. This was a design feature that made JobKeeper simple, easy to administer and timely to implement. A proportionate and more targeted payment for individual employees (such as a fixed share of wages) was also considered. This would have prevented some employees being paid more than their usual wages. Given the timeframes to implement and systems available, the ATO could not verify actual pay on a real-time basis to support this option. The flat rate of payment was supported by a rule that employees could only claim the payment from one employer.
Another key feature of JobKeeper was that it had to be fully passed through to employees, so it operated as an alternative to the social security system in providing income support to individuals. It was targeted to those workers, permanent workers and long-term casuals, that were expected to benefit the most from continued connection with their employers. But it was designed to work in tandem with JobSeeker and the Coronavirus Supplement, which provided a similar level of income support to other workers.
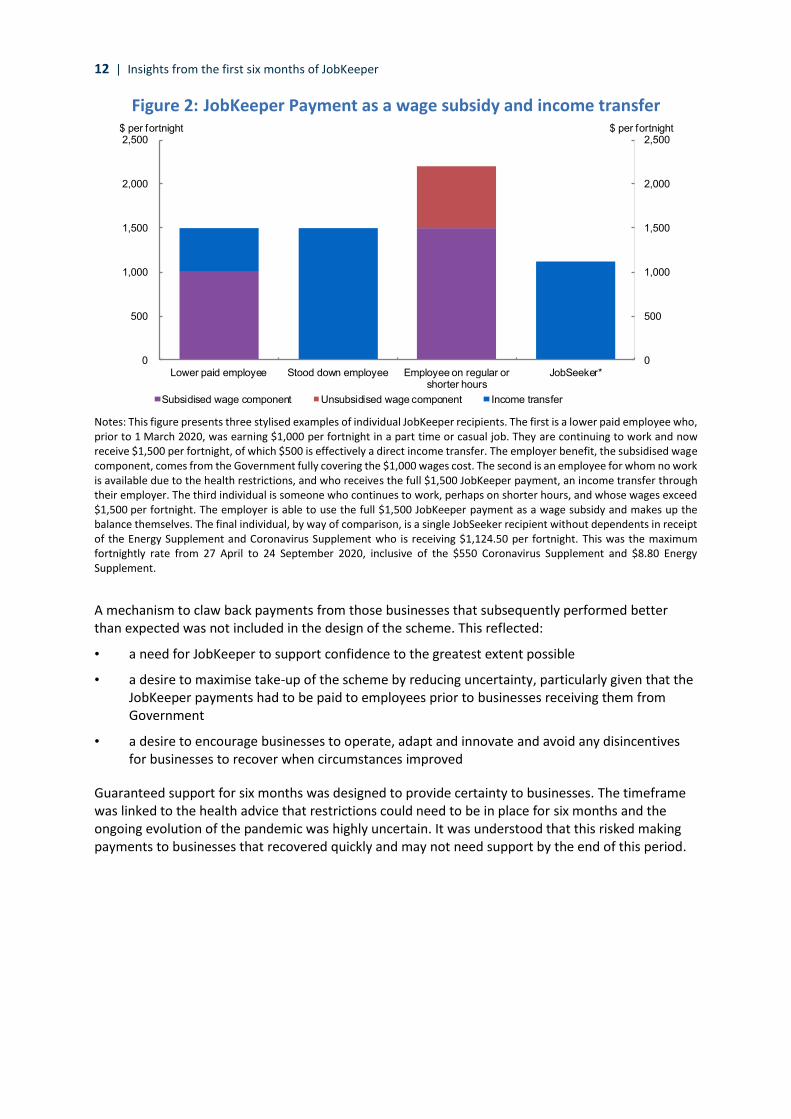
The full pass-through of payments to employees meant that JobKeeper operated as both a wage subsidy and an income transfer, depending on the circumstances of individual recipients. Where a business was not operating or had to fully stand down its staff, JobKeeper operated as an income transfer (Figure 2). Where a business was still operating and had work for its staff, JobKeeper represented a wage subsidy. The extent of the subsidy increased with the hours an employee was able to work, incentivising businesses to continue to operate and to adapt and innovate. This was supported by temporary changes to the Fair Work Act 2009 that allowed employees to use their workers more flexibly. Businesses that continued to operate supported employment and economic activity directly, which also had spill-over effects on other businesses.
12 | Insights from the first six months of JobKeeper
Figure 2: JobKeeper Payment as a wage subsidy and income transfer
Notes: This figure presents three stylised examples of individual JobKeeper recipients. The first is a lower paid employee who, prior to 1 March 2020, was earning $1,000 per fortnight in a part time or casual job. They are continuing to work and now receive $1,500 per fortnight, of which $500 is effectively a direct income transfer. The employer benefit, the subsidised wage component, comes from the Government fully covering the $1,000 wages cost. The second is an employee for whom no work is available due to the health restrictions, and who receives the full $1,500 JobKeeper payment, an income transfer through their employer. The third individual is someone who continues to work, perhaps on shorter hours, and whose wages exceed $1,500 per fortnight. The employer is able to use the full $1,500 JobKeeper payment as a wage subsidy and makes up the balance themselves. The final individual, by way of comparison, is a single JobSeeker recipient without dependents in receipt of the Energy Supplement and Coronavirus Supplement who is receiving $1,124.50 per fortnight. This was the maximum fortnightly rate from 27 April to 24 September 2020, inclusive of the $550 Coronavirus Supplement and $8.80 Energy Supplement.
A mechanism to claw back payments from those businesses that subsequently performed better than expected was not included in the design of the scheme. This reflected:
• a need for JobKeeper to support confidence to the greatest extent possible
• a desire to maximise take-up of the scheme by reducing uncertainty, particularly given that the JobKeeper payments had to be paid to employees prior to businesses receiving them from Government
• a desire to encourage businesses to operate, adapt and innovate and avoid any disincentives for businesses to recover when circumstances improved
Guaranteed support for six months was designed to provide certainty to businesses. The timeframe was linked to the health advice that restrictions could need to be in place for six months and the ongoing evolution of the pandemic was highly uncertain. It was understood that this risked making payments to businesses that recovered quickly and may not need support by the end of this period.
0
500
1,000
1,500
2,000
2,500
0
500
1,000
1,500
2,000
2,500
Lower paid employee Stood down employee Employee on regular orshorter hours
JobSeeker*
$ per fortnight$ per fortnight
Subsidised wage component Unsubsidised wage component Income transfer

1. JobKeeper design and implementation | 13
The potential for policy design features to affect incentives to take up the scheme or hold back the recovery in economic activity was an important consideration in these decisions.8 Box 3 below provides a stylised example to highlight how incentives could manifest themselves. It shows how JobKeeper could have affected the incentives for a business to operate if a claw-back mechanism had been included in the design of the scheme. It shows that for a ‘typical’ business that had the opportunity to recover, but did not expect its turnover to increase significantly, the most profitable decision for the business would have been to reduce turnover to ensure it continued to qualify for JobKeeper. In this example, if the business expected turnover to increase compared with a year earlier, but by less than 13 per cent, the business would have faced an incentive to reduce its turnover by 30 per cent to retain access to JobKeeper and maximise its profits.
The stylised example is a simple one and abstracts from uncertainty about future turnover outcomes, as well as dynamic considerations related to loss of customers or future opening costs.9 But it illustrates that claw-back mechanisms and re-testing for eligibility can operate like anti-production subsidies and perversely encourage businesses to reduce activity to qualify for support.
Section 3 presents evidence on how incentives affected business behaviour in the JobKeeper scheme. The decision not to include a claw-back mechanism in the design of the scheme or to retest eligibility through the first phase also reflected concerns about the potential for significant balance sheet and labour market scarring to impede the recovery. A decision was taken from the outset that the scheme would be time limited and a review of JobKeeper would be undertaken after three months. As it turned out, the economy recovered more strongly than expected, illustrating the importance of flexibility in policy design, including having appropriate review points to ensure policy can be adapted as circumstances change.
8 Research on the design of tax policy has found that as program complexity increases the quality of
individual judgement falls, with participants less able to respond optimally to incentives. Expected payoffs, risk aversion and loss aversion can adversely affect behaviours. See, for example: Banerjee and Ewing (2004) ‘Risk, Wellbeing and Public Policy’: 2004, The Treasury, Economic Roundup Winter 2004; Reeson and Dunstall (2009), ‘Behavioural Economics and Complex Decision-Making’: 2009, CSIRO, CMIS Report No. 09/110; Kahneman and Tversky (1984), ‘Choices, values, frames’, American Psychologist 39(4):341-350; and Leicester, Levell, and Rasul (2012), ‘Tax and benefit policy: insights from behavioural economics’: 2012, Institute for Fiscal Studies.
9 Regarding the role of uncertainty, consider the case where a business thinks there is a fifty-fifty chance that revenue ends up at 103 or 123 per cent of normal levels. The mean expected outcome is then for revenue to be 113 per cent higher, meaning they would be indifferent between increasing production, or stalling and getting JobKeeper. However, if they are risk averse they will prefer the sure option of JobKeeper.

14 | Insights from the first six months of JobKeeper
Box 3: Incentives created by a claw-back mechanism in JobKeeper
This box outlines a stylised example of how JobKeeper could have affected incentives if it was designed with a strict requirement to meet a turnover threshold and/or had a claw-back mechanism. It shows that some businesses would have had an incentive to reduce output and revenue to remain below the turnover threshold to retain access to the payment.
Figure 3 below shows a stylised relationship between a business’s profit and revenue if a JobKeeper payment claw-back arrangement had been put in place. The figure shows businesses could behave in three ways:
1. A business that expects to generate at most 70 per cent of its pre-COVID-19 revenue (that is, have a turnover decline of more than 30 per cent) would be eligible to retain its JobKeeper support, lowering its effective wage bill and raising profit.
2. A business that expects to generate more than 70 per cent, but less than 113 per cent, of pre-COVID-19 revenue would be better off reducing revenue to the 70 per cent threshold by reducing purchases of inputs including labour, lowering output, sales and revenue, thereby retaining eligibility for JobKeeper as this would have led to higher profits.
A business that expects to generate more than 113 per cent of its pre-COVID-19 revenue would be better off not reducing revenue to retain eligibility for JobKeeper.
Figure 3: Businesses’ revenue, profits and JobKeeper impact
Note: The analysis is constructed for an average Australian business using data from 2018-19 ABS Input-Output Tables. For the average business, around 50 per cent of their revenue is used to cover variable costs associated with intermediate inputs; around 25 per cent is associated with covering labour costs; and the remaining 25 per cent of revenue covers fixed costs and profits. On average, JobKeeper provided a subsidy of 60 per cent of wage costs, reducing labour costs by 15 per cent of revenue. Source: Treasury calculations.

1. JobKeeper design and implementation | 15
In other countries, governments introduced a range of schemes to promote job retention. Each scheme was designed and implemented differently to suit national circumstances and requirements. Some schemes used an actual turnover decline or actual evidence on the furloughing of employees, and others determined eligibility on an expected decline in turnover. Where expected turnover decline was a condition of eligibility, jurisdictions took different approaches, with some, such as New Zealand and the Netherlands, requiring businesses to repay part or all of the subsidy if the anticipated declines did not eventuate. Others, such as Ireland, advised that the subsidy would not be recouped if the projection was found to be reasonable.
As the pandemic progressed, all countries extended their schemes to continue support, typically with tightened eligibility requirements and tapered rates of payment. The New Zealand scheme was the first to end after approximately five months. However, their wage subsidy has since been temporarily reinstated in March and August 2021 due to additional lockdowns in response to community transmission. In many countries – such as Canada and Ireland – wage subsidy programs are yet to conclude. At this point there have been no evaluations completed of other country schemes to shed light on the impact of different design parameters or compliance arrangements.
The JobKeeper Payment: Three-month review
Policy considerations
The JobKeeper review was conducted by Treasury in May and June 2020, before being published in July 2020. The review found that JobKeeper had met its objectives.
At the time of the review, the level of business closures was well below average, attributed to policy support including JobKeeper. JobKeeper had kept jobs in place, especially among those in ongoing full-time and part-time roles. From the point of introduction, the rate of decline in employment slowed, then stabilised, and towards the end of May was showing tentative signs of recovery. JobKeeper also played an important role in providing income support to individuals. The review estimated that, at that time, one-quarter of JobKeeper payments represented income transfers directly to individuals.
At the time of the review, the labour market and the broader economy remained very weak. Real GDP contracted by 7 per cent in the June quarter 2020, the largest fall on record (Figure 4). The overall level of labour underutilisation as reported in the May Labour Force Survey was at a record high of 20.2 per cent. Despite an expectation of a recovery in employment in the second half of 2020 overall, employment was still expected to remain 5 per cent below its pre-COVID-19 level in the September quarter 2020, with the total decline in employment greater than the peak-to-trough falls in the 1980s and 1990s recessions of around 4 per cent. While a recovery in output was expected in the September quarter, the level of economic activity was expected to remain well below levels of a year earlier.

16 | Insights from the first six months of JobKeeper
Figure 4: Real quarterly GDP growth
Source: ABS Australian National Accounts: National Income, Expenditure and Product (Cat. No. 5206.0) and Treasury.
The review recommended the scheme remain unchanged until the end of September 2020. Given the scheme was meeting its objectives, the key consideration for continued support was the state of the economy and the uncertainty surrounding the outlook. The review noted that businesses had made employment, investment and activity decisions based on the availability of JobKeeper for six months. This included commitments to retain employees and keep their operations open. While many businesses had begun to recover from the initial shock, the review noted that there was a lot of ground for businesses to make up between a 30 per cent turnover decline and full recovery. Additionally, for many businesses, their recovery was the result of, and contingent on, support from JobKeeper. A withdrawal of support risked dampening the economic recovery.
Changes were made to JobKeeper beyond the first six months as a result of the review. On 21 July 202010, the Government announced an extension of JobKeeper for a further six months until 28 March 2021, with the payment tapered and targeted to those businesses that continued to be most significantly affected by the economic downturn. A two-tiered payment was also introduced to better align the payment with the hours worked by employees and eligible business participants.
To be eligible for JobKeeper under the extension, businesses and not-for-profits needed to demonstrate that they had experienced an actual decline (as opposed to a prospective decline) in turnover in the previous quarter.
Administration of the program and compliance activity
JobKeeper was designed to deliver support quickly and at scale, but with integrity. Integrity features of the JobKeeper policy design and legislative framework included eligibility rules, payments in arrears, reporting and record keeping obligations and the use of existing administrative, civil and criminal penalties. By drawing on existing tax frameworks and concepts, the risks involved in designing the payment in a short period of time were minimised.
10 Prime Minister and Treasurer’s joint media release JobKeeper Payment and income support extended on
21 July 2020.

1. JobKeeper design and implementation | 17
In December 2020, the ANAO published an audit on the Australian Taxation Office’s (ATO) Management of Risks Related to the Rapid Implementation of COVID-19 Economic Response Measures.11 The ANAO found that the ATO had been effective in managing risks related to the rapid implementation of COVID-19 economic response measures and made no recommendations. The ATO conducted comprehensive assurance and compliance activities at both the pre- and post-payment stages using sophisticated data analytics, risk models and systems to ensure they could identify and manage those who were not eligible for JobKeeper.
Projected turnover decline
The ATO has established that the vast majority of JobKeeper businesses reasonably estimated their projected decline in turnover. This is true of those businesses that experienced the expected decline as well as those that did not.
The ATO has undertaken 1,600 compliance checks to assess specifically whether business projections were reasonable, finding that in 95 per cent of cases they were, considering the circumstances at the time. This includes cases where businesses ultimately did not record a decline in turnover of 30 per cent.
The ATO reviewed 480 public and multinational businesses that were identified as having some inconsistencies. Most public and multinational businesses that the ATO reviewed were able to satisfy the JobKeeper eligibility criteria. The ATO reviewed 190 significant global entities, 20 of which voluntarily withdrew from JobKeeper as a result.
Compliance activity
To date the ATO compliance activity for all phases of JobKeeper has resulted in:
• Compliance reviews of 114,000 entities that metrics identified as highest risk, which accounted for $12.5 billion of JobKeeper payments
– $744 million in ineligible claims were identified
– Of which $274 million were stopped prior to payment
• Of the remaining $470 million in ineligible overpayments identified
– $194 million has been recovered
– $89 million is being pursued, with $6 million in dispute
• The ATO has determined not to pursue $180 million in overpayments, mostly from small businesses, where there have been honest mistakes, employers claimed the payments in good faith and have already passed them on to their employees.
• As a result of the 114,000 reviews a further $767 million was prevented in future payments to the ineligible businesses.
The ATO is continuing to implement its compliance program, with ongoing reviews of applications that raise potentially fraudulent behaviour.
11 Australian National Audit Office, Australian Taxation Office’s (ATO) Management of Risks Related to the
Rapid Implementation of COVID-19 Economic Response Measures, December 2020.

18 | Insights from the first six months of JobKeeper
2. JobKeeper program data
Summary
During its first phase, JobKeeper supported around one-third of Australian businesses and jobs.
JobKeeper supported a wide range of entities and individuals across Australia:
• Small businesses with a turnover less than $50 million and not-for-profits accounted for around 99 per cent of all entities and over 80 per cent of payments.
• The largest share of JobKeeper payments were paid to large employing industries such as construction. However, industries hit hardest by COVID-19 such as arts and recreation services had a higher proportion of their workforce supported by JobKeeper.
• Individuals supported by JobKeeper were relatively evenly distributed across regions, with a slightly higher reliance on JobKeeper in the Sydney and Melbourne metropolitan areas.
• On average, 55 per cent of JobKeeper recipients were male and 45 per cent were female, which was broadly proportionate to employment shares.
JobKeeper take-up and coverage
In its first phase (28 March – 27 September 2020) JobKeeper supported on average around 925,000 businesses and 3.6 million individuals each month. Further analysis of ATO data has shown that, cumulatively, around four million unique individuals and around one million unique businesses were supported by JobKeeper in one or more JobKeeper fortnights in the first phase – around one-third of Australian businesses and jobs. Data set out below is for the first phase of the program, unless otherwise specified. Table 4 in Appendix 1 sets out the take-up and payments for JobKeeper by month over the whole program.
Business characteristics
JobKeeper largely supported small businesses. Small businesses with a turnover less than $50 million and not-for-profits accounted for around 99 per cent of all entities and over 80 per cent of payments. Large businesses with a turnover above $250 million made up 0.2 per cent of JobKeeper entities and received around 11 per cent of payments (Figures 5a-b). The representation of large businesses is broadly consistent with their shares of businesses and employment in the broader economy.
At around 41 per cent of the JobKeeper business population, sole traders were the most common entity type (Figure 5c). The majority (90 per cent) were non-employing and they received around 12 per cent of payments. New South Wales and Victoria together accounted for around two-thirds of all entities and payments (Figure 5d). This is slightly more than these states’ share of state final demand, reflecting the impact of the second wave of COVID-19 in Victoria in the September quarter 2020 on payments to that state and the prevalence of business headquarters in these states.

2. JobKeeper program data | 19
Figure 5: Distribution of JobKeeper entities and payments
a. Turnover size
b. Entities and payments by turnover
Entities Net Payments
Annual turnover No.
Share (%) ($b)
Share (%)
Below $2m 935,921 89.4 29.9 42.7
$2m – $10m 65,188 6.2 12.2 17.4
$10m – $50m 14,389 1.4 7.4 10.6
$50m – $250m 3,790 0.4 5.2 7.4
$250m-$1b 1,386 0.1 4 5.7
Above $1b 965 0.1 3.5 5.0
Not for Profit 18,779 1.8 7.8 11.1
Not assigned 6,126 0.6 0.1 0.1
Total 1,046,544 70.0
c. Entity type
d. State
Note: Net payments is the payment disbursements after repayments from entities, excluding voluntary repayments. Source: ATO administrative data.

20 | Insights from the first six months of JobKeeper
Workforce coverage
As a share of employment, Victoria and New South Wales had the highest JobKeeper coverage and the Northern Territory the lowest (Figure 6a). While the number of JobKeeper-supported individuals peaked nationally in July (3.7 million), Victoria’s second COVID-19 wave saw JobKeeper recipients in that state grow through to September (Figure 6b).
Figure 6: JobKeeper coverage of employment a. Share of total vs private-sector employment
b. Share of total employment
Note: Pre-COVID-19 employment given by average employment in the year to February 2020. Count of individuals supported by JobKeeper is the monthly average from April to September 2020. Source: ATO administrative data and ABS Labour Force, Australia, Detailed, Quarterly, August 2021 (Cat. No. 6291.0.55.001).
Individual demographics
Females were disproportionally affected by the initial downturn in the labour market, reflecting the greater impact of health restrictions on industries in which women were more highly represented, and their higher rates of casual work. However, female employment recovered more strongly than male employment through the June and September quarters 2020. On average, over the two quarters, JobKeeper coverage for men and women was broadly consistent with their contraction in hours worked and their share of employment (Figure 7a).
The two youngest age groups (under the age of 25, and 25-34 years) were disproportionately affected by the downturn and under-represented in JobKeeper (Figure 7b). Younger workers accounted for around 30 per cent of the JobKeeper population, despite representing just under 40 per cent of pre-COVID workforce and over 50 per cent of lost work hours during the June and September 2020 quarters. This under representation likely reflects the higher share of short-term casual work and ineligible visa holders amongst these cohorts.
Many of those who did not qualify for JobKeeper were able to receive similar levels of income support through the JobSeeker program and the Coronavirus supplement, illustrating how the two programs were designed to work together. The impact of these programs on income is discussed in Section 3.

2. JobKeeper program data | 21
Figure 7: Shares of employment and JobKeeper participants a. By sex
b. By age
Note: The sum of each cluster of coloured bars is 100 per cent. Source: ATO administrative data, ABS Labour Force, Australia, Monthly, August 2021 (Cat. No. 6202.0.) and ABS Labour Force, Australia, Detailed, Monthly, August 2021 (Cat. No. 6291.0.55.003).
Industry distribution
While the design of JobKeeper was industry neutral, the differential impacts of the pandemic meant that, in practice, entities in some industries were more reliant on JobKeeper than others.
The largest portion of JobKeeper payments were distributed to large employing industries such as construction; professional, scientific and technical services; health care and social assistance; and retail trade (Figure 8). However, payments relative to compensation of employees were highest in industries most affected by the restrictions: arts and recreation services (61 per cent), accommodation and food services (46 per cent) and other services (41 per cent).12
Around half of the pre-COVID-19 workforce in arts and recreation services was supported, with the largest number of JobKeeper individuals in the creative and performing arts and sports and physical recreation sectors. Other services, capturing a diverse range of personal, maintenance and repair, civic and other businesses, also saw around half of its pre-COVID-19 workforce and entities supported by JobKeeper (Figures 9 and 10).
12 Other services includes a broad range of personal services; religious, civic, professional and other interest
group services; selected repair and maintenance activities; and private households employing staff.

22 | Insights from the first six months of JobKeeper
Figure 8: JobKeeper payments and coverage by industry
Note: Compensation of employees (COE) is measured for the June and September quarters 2020. Net payments are the payment disbursements after repayments from entities, excluding voluntary repayments. Source: ATO administrative data and ABS Australian National Accounts, June 2021 (Cat. No. 5206.0).
Figure 9: JobKeeper individuals and coverage by industry
Note: Pre-COVID employment given by average employment in the year to February 2020. Individuals includes employees and eligible business participants (EBPs). Source: ATO administrative data and ABS Labour Force, Australia, Detailed, Quarterly, May 2021 (Cat. no. 6291.0.55.003).

2. JobKeeper program data | 23
Figure 10: JobKeeper entities and coverage by industry
Note: Entities that received JobKeeper included companies, not-for-profits, sole traders, trusts, and partnerships. Some of those entity types may not be represented in the ATO data on income tax returns and payment summary lodgements. Source: ATO administrative data and 2018-19 income tax return and payment summary lodgements.
Regional distribution of individuals on JobKeeper
Coverage of individuals supported by JobKeeper was more evenly distributed across regions than it was across industries, reflecting the diversified nature of most regions and the widespread impact of health restrictions. The regions most reliant on JobKeeper were in Sydney and Melbourne metropolitan areas, the Gold Coast and the Mornington Peninsula (Figure 1113,14).
13 Figure 11 shows JobKeeper coverage of unique individuals, who received JobKeeper in one or more
fortnights in the first six months of the program, by SA4 region. Pre-COVID-19 employment is given by average employment in the year to February 2020. The employment number includes all employment categories and therefore includes some employees who were ineligible for JobKeeper e.g. public sector workers, casual employees not eligible for JobKeeper. The Australian Capital Territory SA4 is equal to the state total and has only been included once.
14 Source: ATO administrative data on JobKeeper unique individuals by postcode allocated to population weighted ABS SA4 regions and ABS Labour Force, Australia, Detailed, Monthly, June 2021 (Cat. No. 6291.0.55.003).

24 | Insights from the first six months of JobKeeper
Figure 11: JobKeeper individuals – coverage by region

3. Economic effect of JobKeeper | 25
3. Economic effect of JobKeeper
Summary
JobKeeper was expected to have a large and lasting effect on economic outcomes, though it is difficult to separate this from the effects of other fiscal support measures and the better-than-expected health outcomes.
Some key short-run economic effects of JobKeeper and other fiscal support measures include:
• Actual GDP outcomes over 2020-21 were much stronger than forecast in July 2020 and the unemployment rate was much lower. This reflected better-than-expected health outcomes, the effectiveness of policy measures at mitigating the negative economic effects of the pandemic and the adaptation of businesses to changed circumstances.
• Analysis of individual incomes using integrated welfare and employment data suggests Government assistance was well targeted throughout 2020. It provided significant income support to those on lower incomes.
• Household and business sector balance sheet positions remained strong despite the impact of the pandemic. Balance sheet support is a key channel through which fiscal policies support the economy.
• Businesses that went on to receive JobKeeper had sharp increases in job losses prior to the program commencing. JobKeeper arrested and partly reversed these losses.
• As economic conditions improved, JobKeeper-recipient businesses responded by increasing hours for their workers on JobKeeper.
Significant direct economic support payments were key elements of the economic response to the COVID-19 health restrictions. These support payments contributed to stabilising the economy through several channels.
One key channel was the expenditure channel, where payments made to businesses and households allowed them to continue to produce, employ, and consume, thus directly supporting economic activity. This channel is most effective when payments are made to businesses or households that are most likely to spend the additional income – for example, to cash flow constrained businesses (typically smaller businesses) or low-income households.
Another important channel was via business and household balance sheets. Both businesses and households benefit from having strong balance sheet positions that provide a financial buffer to absorb economic risk and economic shocks and allow spending to increase as conditions improve.
Second-round effects of these channels were also important. For example, the spending undertaken by one business or household, as a result of extra income, benefits other businesses and their workers, which flows on to broader spending elsewhere in the economy.
All of these channels contributed to supporting confidence about the outlook, reducing precautionary savings behaviour and encouraging investment in new activities. Together, these economic support payments were aimed at avoiding widespread job losses and subsequent economic scarring, which was a significant risk in the early stages of the COVID-19 pandemic.

26 | Insights from the first six months of JobKeeper
It is difficult to separate the effect of JobKeeper from other policies, since in many cases policies were designed to complement each other and their impacts interacted. There is also significant uncertainty around what the economy would have looked like had the full suite of macroeconomic supports not been implemented at the time. Given these interactions and uncertainties, this section provides analysis on some of the initial effects of JobKeeper on the economy.
Impact of JobKeeper on confidence
A key channel through which JobKeeper supported the economy was through reducing uncertainty and improving confidence. Although it is difficult to isolate JobKeeper’s direct effect on confidence, the sharp falls in both business and household confidence measures in March 2020 began to reverse almost immediately following the announcement of JobKeeper. The ANZ measure of consumer confidence increased by 10 per cent to be above 70 in the week following the announcement. Business confidence also improved in the following months (Figure 12). JobKeeper also helped support confidence in financial markets, with equity markets rising steadily in the weeks following the announcement.
Figure 12: Consumer and business confidence a: ANZ Consumer Confidence
b: NAB Business Confidence
Note: Dotted lines show when the announcement of JobKeeper occurred. Consumer confidence is a weekly series and therefore the announcement of JobKeeper was captured in the last week of March 2020. Business confidence is a monthly series, so the impact of the announcement was captured in observations following March. Source: ANZ-Roy Morgan and NAB.
Impact of JobKeeper on employment
JobKeeper reversed employment losses for supported workers and maintained employment relationships
Business microdata indicate that businesses that took up JobKeeper were most adversely affected by the initial shock to the economy. Consistent with businesses’ announcements and other evidence at the time, Single Touch Payroll (STP) data showed a sharp increase in the number of formal job

3. Economic effect of JobKeeper | 27
separations in late March 2020 as businesses affected by the increasing health restrictions began to lay off staff.15 The overall rate of separations increased by around 45 per cent, compared with levels earlier in the year. The increase was almost entirely driven by businesses that went on to enter JobKeeper, with the number of employees formally separating from their employer almost doubling amongst this group within the space of two weeks (Figure 13). In contrast, separations among non-JobKeeper businesses remained broadly unchanged across this period.
Figure 13: Job separations by JobKeeper status
Note: Figure 13 presents fortnightly time series of job separations, indexed to equal 100 in the fortnight ending 1 March 2020. Separations are based on cease dates for a worker’s employment relationship with a business (it can include workers who were on zero pay). Dashed line indicates start of JobKeeper. Series exhibits volatility around end of financial year, which has been corrected. Based on employees in STP data on weekly or fortnightly pay cycles. Source: Treasury analysis of de-identified administrative data (STP data linked to JobKeeper status).
A similar pattern is observed in terms of employment. The total decline in jobs from the start of March to mid-April 2020 was almost 10 per cent.16 Businesses that were not JobKeeper recipients shed around 2 per cent of their jobs to mid-April. For businesses that were JobKeeper recipients, there was an initial 20 per cent drop in total jobs held.
The introduction of JobKeeper appears to have arrested the rate of job shedding. Following the introduction of JobKeeper, the number of separations declined sharply and the initial job losses among eligible workers, a little under 10 per cent in April, were quickly reversed.
During mid-2020 a record number of JobKeeper and other workers returned to their previous ‘existing’ jobs, as measured both from the employer perspective (using STP data) and the employee perspective (using Labour Force Survey microdata; Figure 14a). Of those people who entered the labour market in May, 86 per cent returned to a previous job, while the equivalent for August was 74 per cent. The number of people taking up completely new jobs dropped in May 2020 but recovered quickly.
Even in the more restrictive group of those who experienced a job separation (as reported in the Labour Force Survey, which includes at least some JobKeeper workers) in the three months to May,
15 For a discussion of the coverage of STP, see The JobKeeper Payment: Three-month review. 16 This is consistent with the ABS Weekly Payroll Jobs and Wages in Australia, Week ending 24 April 2020
(Cat. No. 6160.0.55.001).
0
20
40
60
80
100
120
140
160
180
200
0
20
40
60
80
100
120
140
160
180
200
Feb-20 Apr-20 Jun-20 Aug-20 Sep-20
IndexIndex
JobKeeper Recipient
Not JobKeeper Recipient

28 | Insights from the first six months of JobKeeper
43 per cent were re-employed by August 2020, and more than two-thirds had returned to a job they had held before (Figure 14b).
Returning to previously held jobs has been particularly important to employment recovery in the hardest-hit sectors – food and accommodation, and arts and recreation. These dynamics were also more evident for JobKeeper workers than other workers.
Figure 14: Entries into employment a: Monthly entries into new and existing jobs
b: Re-employment rate three months after separation
Note: Figure 14a. Data are monthly transitions into employment (from unemployment or not in the labour force), seasonally adjusted. Due to the use of longitudinal weights, totals will not match ABS Labour Force numbers exactly. Figure 14b. Data are workers who had become unemployed, having left or lost a job (including being retrenched) in the previous quarter, who had regained employment in the subsequent quarter. Dashed lines are the average of each series. Source: Treasury analysis using ABS Longitudinal Labour Force Survey (Cat. No. 6602.0).
As the economy recovered, businesses were able to expand activity by increasing hours for JobKeeper workers
By maintaining employment relationships, JobKeeper appears to have allowed businesses to more quickly adapt and recover production as the restrictions eased, expanding hours worked by their JobKeeper workers and minimising scarring. Unlike a furlough scheme, the structure of JobKeeper strongly incentivised such an expansion, given the business only directly benefited from payments where staff were working and generating revenue. Where staff were not working, JobKeeper operated only as an income transfer to households.
STP data can be used to estimate the share of JobKeeper that was paid to compensate workers for actual hours worked, and the share paid on top of this to workers to reach the flat payment rate. The former is a wage subsidy to the business, while the latter is an income transfer to households. As workers’ hours of work increase, the share of JobKeeper that was an income transfer declined.
The analysis of STP data, presented in Figure 15, shows that the average amount of JobKeeper payments that were an income transfer peaked at around $350 in May. After this time, the data show that the share of JobKeeper payments that were income transfers declined, consistent with an increase in hours worked by JobKeeper workers. Similarly, over the first six months of the program,

3. Economic effect of JobKeeper | 29
the share of workers stood down on zero hours declined from 12 per cent in May (around 375,000 employees) to around 8 per cent in September (around 235,000 workers). There was a slight increase in the share of JobKeeper paid as transfers in August and September, as Melbourne re-entered lockdown.
Figure 15: JobKeeper income transfer payments to workers a. Average income transfer
b. Distribution of income transfers
Note: Based on JobKeeper-nominated employees in STP data on weekly or fortnightly pay cycles. The implied JobKeeper income transfer is the difference between earnings exclusive of JobKeeper and $1,500 and is calculated including zero income transfers. Data expressed as average income transfer per fortnight. Figure 15a shows the average income transfer across the sample in dollar values. Figure 15b shows the share of employees on full, partial and no income transfers each fortnight. Source: Treasury analysis of de-identified administrative data (STP data linked to JobKeeper status).
JobKeeper contributed to substantially better aggregate labour market outcomes
Labour market outcomes highlight the importance of JobKeeper and other fiscal support measures in mitigating the economic effect of the pandemic. The ABS estimates that there were 1.8 million people who worked less than their usual hours for economic reasons in April 2020. Of these, about 750,000 were stood down on zero hours and around one million people were working fewer hours than usual.
Treasury estimated in early April that, in the absence of JobKeeper, the unemployment rate could reach 15 per cent. Updated modelling in the July Economic and Fiscal Update found that without the Government’s fiscal support measures, the peak of the unemployment rate would have been at least 5 percentage points higher (Figure 16).17
17 Some of the observed attenuation of the unemployment rate rise is a result of measurement of the labour
force status of workers receiving JobKeeper. Zero-hour workers who may otherwise have been recorded as unemployed or not in the labour force were recorded as employed when they were receiving JobKeeper payments.
100
150
200
250
300
350
400
100
150
200
250
300
350
400
Apr-20 Jun-20 Aug-20 Sep-20
$$
0
10
20
30
40
50
60
70
80
0
10
20
30
40
50
60
70
80
Apr-20 Jun-20 Aug-20 Sep-20
%%
Full transfer
Wage subsidy only
Partial transfer

30 | Insights from the first six months of JobKeeper
Figure 16: Labour market a. Unemployment rate
b. Employment level
Note: Before and after economic support estimates are taken from July Fiscal and Economic Update 2020. Source: ABS Labour Force, Australia (Cat. No. 6202.0) and Treasury.
The fall in employment following the outbreak of COVID-19 was rapid and much sharper than in previous downturns, but as a result of the policy support and better-than-expected health outcomes the recovery in employment was also faster than in previous episodes. Those cohorts that were significantly affected at the outset of the pandemic, such as women and youth, recovered strongly, with employment-to-population ratios back to their pre-COVID-19 levels by March 2021.
Impact of JobKeeper on earnings
JobKeeper played a crucial role in supporting earnings for lower income individuals and households
Analysis of individual employment and welfare incomes using integrated welfare and employment data suggests that Government support was well targeted and played a key role in supporting incomes throughout 2020, particularly at the lower end of the income distribution.
Changes in average income levels across 2020 have been calculated across the five income quintiles taking into account employment income, welfare income and JobKeeper payments (Figure 17). This shows that average incomes in the lowest two income quintiles increased in the June quarter 2020 despite larger employment losses in these groups, reflecting the introduction of the Coronavirus Supplement and JobSeeker eligibility criteria changes as well as JobKeeper payments. Incomes remained above pre-pandemic levels throughout 2020, even as government supports were tapered, reflecting improved labour market conditions. Income for the third- and fourth-highest income quintiles remained similar to March levels, while the income of the top quintile declined slightly.
0
2
4
6
8
10
12
14
16
0
2
4
6
8
10
12
14
16
Jun-15 Jun-17 Jun-19 Jun-21
%%
After economic support(estimate)
Before economic support(estimate)
Actual

3. Economic effect of JobKeeper | 31
However, this likely understates growth for the top quintile, as business and investment income are excluded.18
JobKeeper payments and income transfers played a larger role in supporting people in lower income quintiles. This is because lower income individuals were both more likely to be on JobKeeper and the flat rate payment was a larger share of their pre-COVID-19 salary. As expected, the contribution of JobKeeper declined substantially in the December 2020 quarter, reflecting fewer recipients in the second phase of JobKeeper (October 2020 to March 2021), the reduced payment rate and the introduction of a lower payment rate for recipients who were previously working part time.
Figure 17: Income sources as share of March quarter income, by quintile
Note: Only covers employment and welfare income. Business, investment or other income excluded. Workers assigned income quintile based on 2019 wage and salary income. As such those without wage income in 2019 are excluded. Source: Treasury analysis of Labour Market Tracker Data and ABS Australian National Accounts: National Income, Expenditure and Product (Cat. No. 5206.0).
JobKeeper lessened the need for payments through the social security system
Many of the JobKeeper workers that returned to their employer following the introduction of the program would otherwise have received JobSeeker payments. This can be seen from analysing the flows of JobKeeper workers between these payments. Before JobKeeper was in place, a large number of workers that would eventually receive JobKeeper had started receiving JobSeeker (Figure 18).19 As JobKeeper was rolled out, the majority of these workers moved from JobSeeker to JobKeeper and re-connected with their employer. As such, JobKeeper complemented JobSeeker in supporting incomes for households, while also supporting employment relationships.
18 The December quarter National Accounts showed a 13.6 per cent increase in gross mixed income, and an
11.7 per cent increase in gross operating surplus for private non-financial corporations, from December 2019 to December 2020.
19 This analysis may understate these effects, given many JobKeeper workers may have applied for but never actually received JobSeeker.
0.0
0.2
0.4
0.6
0.8
1.0
1.2
1.4
0.0
0.2
0.4
0.6
0.8
1.0
1.2
1.4
Mar Jun Sep Dec Mar Jun SepDec Mar Jun SepDec Mar Jun SepDec Mar Jun SepDec
1st 2nd 3rd 4th 5th
ShareShare
Employment income (excl. JobKeeper)
JobKeeper income transfer
Welfare payments
JobKeeper wage subsidy

32 | Insights from the first six months of JobKeeper
Figure 18: Income support flows for individuals on the first phase of JobKeeper
Note: Income support includes Newstart Allowance (prior to 20 March 2020), JobSeeker Payment (from 20 March 2020) and Youth Allowance (Other). Flows onto and off income support payments include flows from nil rate recipient status to being in receipt of a payment. Two-week moving average. Source: Treasury analysis of de-identified administrative data (linked STP and welfare payment microdata).
Impact of JobKeeper on economic activity
JobKeeper helped to ensure resource-reallocation in the economy remained linked to productivity and limited economic scarring
A recent OECD paper examined labour flows and reallocation in the Australian economy during COVID-19.20 It found that while reallocation of labour in the economy declined, it remained firmly linked to productivity. That is, more productive businesses remained more likely to grow and survive, compared to less productive businesses. This is important, given COVID-19 could have led to significant medium-term economic scarring if it caused an indiscriminate shake-out of highly productive businesses, and the loss of their business-specific capital.
The paper also found that JobKeeper played a role in this outcome, boosting the link between productivity and reallocation. In fact, the authors estimate that aggregate labour productivity would have been between 4.5 and 5.5 per cent lower if reallocation and productivity had been de-coupled, and that JobKeeper can account for around half of this. This analysis finds that in the first six months of the program, JobKeeper disproportionately supported highly productive but financially fragile businesses that might have had trouble surviving a period of decreased activity and revenue.
That said, the paper did find evidence that JobKeeper became more distortionary over time as the economic recovery took hold. In particular, the analysis found that when businesses rolled off the first phase of JobKeeper in September 2020 there was some significant labour movement towards more productive businesses, suggesting that JobKeeper had been starting to hold back this reallocation as the economy continued to recover.
20 D Andrews, E Bahar and J Hambur (2021), The COVID-19 shock and productivity-enhancing reallocation in
Australia: Real-time evidence from Single Touch Payroll, OECD Economics Department Working Paper No. 1677. This paper was jointly funded by the OECD and Treasury.
-20
-10
0
10
20
30
40
-20
-10
0
10
20
30
40
Mar-20 Apr-20 May-20 Jun-20 Jul-20 Aug-20 Sep-20
'000'000
Move off income
support
Moveonto income
support
JobKeeper started (30 March 2020)
Net change

3. Economic effect of JobKeeper | 33
JobKeeper subsidies supported businesses in need
One of the key purposes of JobKeeper was to protect businesses that had to cease or wind back their operations because of the public health restrictions.
From a macroeconomic perspective, the combination of economic support measures, including JobKeeper and the Boosting Cash Flow for Employers measure, as well as temporary insolvency relief prevented an increase in business failures. Administrations were at very low levels during 2020. The RBA has noted that JobKeeper played an important role, ensuring businesses had sufficient liquidity to pay their bills.21
The share of JobKeeper payments going to businesses as a wage subsidy increased as the economy recovered and workers got more hours. Based on Figure 15a above, the average amount of JobKeeper payments that represented an income transfer peaked at $350 (around 25 per cent of the $1500) in May 2020, meaning that the share that represented a wage subsidy was at its lowest point at around 75 per cent at that time. The provision of the wage subsidy enabled many of these businesses to continue operating and then to pivot and grow.
JobKeeper represented a sizeable and important subsidy for wage costs for many businesses. On average, JobKeeper provided a subsidy of 60 per cent of wage costs, reducing labour costs by 15 per cent of revenue. This subsidy was particularly important for those businesses that were hardest hit by the pandemic. Almost one-quarter of JobKeeper recipient businesses faced no out-of-pocket wage costs in September, with workers’ wages being completely covered by JobKeeper payments. Turnover for these businesses in the quarter was typically 39 per cent lower than the previous year, compared to 23 per cent for a broader sample of JobKeeper businesses.
Survey evidence demonstrates the role of JobKeeper in supporting businesses. According to a Spring 2020 survey by Sensis, approximately 44 per cent of Australian small businesses would not have survived without JobKeeper. In the hardest hit sectors, the role of JobKeeper was even more significant, with 65 per cent of hospitality small businesses reporting JobKeeper was responsible for their survival.22 In September 2020, MYOB’s Business Monitor survey of more than 1,000 SMEs found that among businesses that accessed JobKeeper, 82 per cent reported it allowed trading to continue in the face of doubt.23
The re-testing of JobKeeper eligibility created some incentives to adjust operations
JobKeeper was designed to reduce the extent of the downturn and support a strong economic recovery. Nonetheless, the shift to improve targeting of the scheme in its extension phase distorted business decisions for some businesses from July to September, as turnover in this period was used to determine eligibility for the December quarter. These results highlight the trade-offs between tight targeting and avoiding disincentives for business to adapt and grow. While the disincentives to maximise turnover appear to have been relatively limited in the first phase of JobKeeper, the re-testing of eligibility ahead of the second, more targeted phase, appears to have created incentives for some businesses to curtail their operations.
21 Reserve Bank of Australia, Financial Stability Review Box B: Business Failure Risk in the COVID-19
Pandemic, October 2020 22 Sensis, September 2020 Business Index, September 2020. 23 MYOB, Business Monitor: Budget Edition, September 2020.

34 | Insights from the first six months of JobKeeper
It is common to observe individuals and entities adjusting their behaviour in response to eligibility thresholds. Where individuals and entities have an incentive to remain on one side of a threshold, bunching is often observed. Breunig and Johnson (2017) highlight one example of this in the personal income tax system.24 They find statistically significant bunching at all notches in the Australian tax system.
Figure 19 shows the distribution of turnover growth for recipients of the first phase of JobKeeper in the June and September quarters of 2020, relative to the equivalent period the previous year. For the June quarter, the number of businesses with sales declines of slightly more than 30 per cent was somewhat higher than the number with declines of slightly less than 30 per cent. This suggests that some businesses sought to adjust their operations to ensure that they were eligible for JobKeeper, even though that was not necessary for their eligibility.
More notable is the pattern in the September quarter. The share of businesses with turnover declines of slightly more than the 30 per cent (50,000 businesses with sales declines between 30 and 35 per cent) was much larger than the share with declines slightly smaller than 30 per cent (20,000 businesses with declined between 25 and 30 per cent). This provides evidence that a number of businesses may have adjusted their operations to qualify for the second phase of JobKeeper.
Manipulation or misstatement of turnover to allow for access to the second phase of JobKeeper was a key focus of the ATO’s compliance strategy. The ATO identified risk factors such as dramatic changes in turnover, adjustments to Business Activity Statements, tip offs and other intelligence, and turnover slightly below the threshold for further investigation in their compliance program.
Figure 19: Distribution of turnover growth outcomes for JobKeeper recipients
Note: Through-the-year growth in BAS turnover in the June and September quarters. Excludes NFPs. Only includes businesses with sales growth strictly between -100 per cent and 100 per cent. Figure interpolated for zero growth businesses due to large spike. Source: Treasury analysis of de-identified administrative data (BAS data linked to JobKeeper status).
24 R Breunig and S Johnson, Taxpayer responsiveness to marginal tax rates: Bunching evidence from the
Australian personal income tax system, September 2017
0.0
0.1
0.2
0.3
0.4
0.5
0.6
0.7
0.8
0.9
1.0
0.0
0.1
0.2
0.3
0.4
0.5
0.6
0.7
0.8
0.9
1.0
-100 -90 -80 -70 -60 -50 -40 -30 -20 -10 0 10 20 30 40 50 60 70 80 90 100
%%
September
June
Share of firms with through-the-year sales growth at this level, %

3. Economic effect of JobKeeper | 35
JobKeeper is likely to have provided ongoing economic support by strengthening balance sheets
Balance sheet support is a key channel through which fiscal policies support the economy. For businesses, strong balance sheets allow them to borrow or provide credit to counterparties. These buffers are important for the effective operation of the economy as they reduce counterparty risk and allow businesses to fund investment. Following a shock that raises economic uncertainty, economic policy that supports the replenishment of these buffers can assist in bringing forward the recovery in investment and consumption activity as the recovery takes hold. This supports the economy in the medium to long term.
Household and business sector balance sheet positions have remained strong despite the impact of the pandemic. This reflects:
• the financial and economic support from the Government
• the recovery in equity markets and the resilience in house prices, which have been aided by accommodative monetary policy and a supportive financial system
• increased saving flowing from both restrictions on household consumption and precautionary behaviour of households and businesses
On the household side, net saving in the June and September quarters of 2020 amounted to around $130 billion, which was much larger than results seen in the previous decade (Figure 20). Since much of this additional saving for consumers was unintended and a result of both precautionary saving due to high uncertainty and being unable to consume certain goods and services as a result of lockdown restrictions, it is reasonable to expect that consumers will gradually run down these savings through higher consumption expenditure during the recovery.
Saving by businesses also increased sharply in the June and September quarters 2020, reflecting the substantial support to businesses. Combined with elevated uncertainty that manifested in sharply lower investment spending, this led to the value of cash and deposits held by non-financial corporations increasing by $48 billion over the period. The improvement to businesses’ balance sheets is expected to support additional investment spending as the economy recovers and uncertainty subsides, especially when combined with the Government’s substantial investment incentives also in place.25 Business investment has already been better than was expected in the early stages of the crisis, when new private business investment was forecast to fall by more than 12 per cent in 2020-21. Machinery and equipment investment by the private sector, which has shorter lead times than many other forms of investment, has risen by 22.4 per cent since it troughed in the September quarter 2020.
25 There is evidence that increases in cash flow can increase investment spending for businesses. La Cava
(2005) finds that when businesses experiencing financial distress are separated from other businesses there is empirical evidence of a channel for cash flow of businesses to influence investment decisions, suggesting fiscal policy can support investment by providing financial support to a broad class of businesses.

36 | Insights from the first six months of JobKeeper
Figure 20: Net saving in the household and non-financial corporate sectors
Source: ABS Australian National Accounts: National Income, Expenditure and Product (Cat. No. 5206.0).
Aggregate economic activity recovered more strongly than expected
At the July 2020 Economic and Fiscal Update, it was estimated that the fiscal support committed at that time would increase the level of real GDP by around ¾ of a per cent in 2019-20 and by 4¼ per cent in 2020-21 relative to a counterfactual of no policy support (Figure 21). These forecasts took into account the direct effect of fiscal support on household and business incomes and hence consumption and investment spending, and the second-round effects of this spending.26 They also incorporated an estimate of the ongoing positive effect on spending of Government support on household and business confidence.
As it transpired, actual GDP outcomes over 2020-2021 were much stronger than Treasury had forecast in July 2020. This is likely to be a result of a number of factors:
• the significantly better-than-expected health outcomes from the successful implementation of public health measures
• that the policy measures, including JobKeeper, were more effective at mitigating the economic effects of the pandemic than was originally expected, through minimising the extent of balance sheet and labour market scarring and providing enough demand stimulus so that the economy could rebound quickly once restrictions eased
• supply-side restrictions were less binding than was originally expected because businesses were more able to adapt business models (including through enabling more people to work from home) and households were more willing to substitute their consumption towards goods and away from services
26 These forecasts were developed with the help of Treasury’s macroeconometric model. See: Bullen et al
(2021), The Treasury Macroeconometric Model of Australia: Modelling Approach, Treasury Paper, September 2021.

3. Economic effect of JobKeeper | 37
Figure 21: Real GDP
Note: Before and after economic support estimates are taken from July 2020 Fiscal and Economic Update and rebased to June Quarter GDP 2021. Source: ABS Australian National Accounts: National Income, Expenditure and Product (Cat. No. 5206.0) and Treasury.
The original estimate of the cost of JobKeeper was based on a scenario where GDP was around 24 per cent lower than otherwise forecast, consistent with the more severe restrictions that were being actively considered at the time. With restrictions less severe than initially expected, and economic and health outcomes markedly better, the cost of the first phase of JobKeeper was significantly less than originally expected, at around $70 billion.
The Australian economy fared better in the initial stages of the pandemic and recovered faster than many other comparable countries. Australia was ahead of any major advanced economy in surpassing pre-pandemic levels of GDP in the March quarter 2021. In the June quarter 2021, Australia was still ahead of major advanced economies in recovering pre-pandemic levels of GDP, with the United States the only country out of the G7 to return to pre-pandemic levels (Figure 22a). Australia surpassed pre-pandemic levels of employment in March 2021. In June 2021, Australia remained the only country to have returned to pre-pandemic levels of employment compared to the group of major advanced economies (Figure 22b).
410
420
430
440
450
460
470
480
490
500
510
410
420
430
440
450
460
470
480
490
500
510
Jun-15 Jun-16 Jun-17 Jun-18 Jun-19 Jun-20 Jun-21
$b$b
Actual
After economic support(estimate)
Before economic support(estimate)
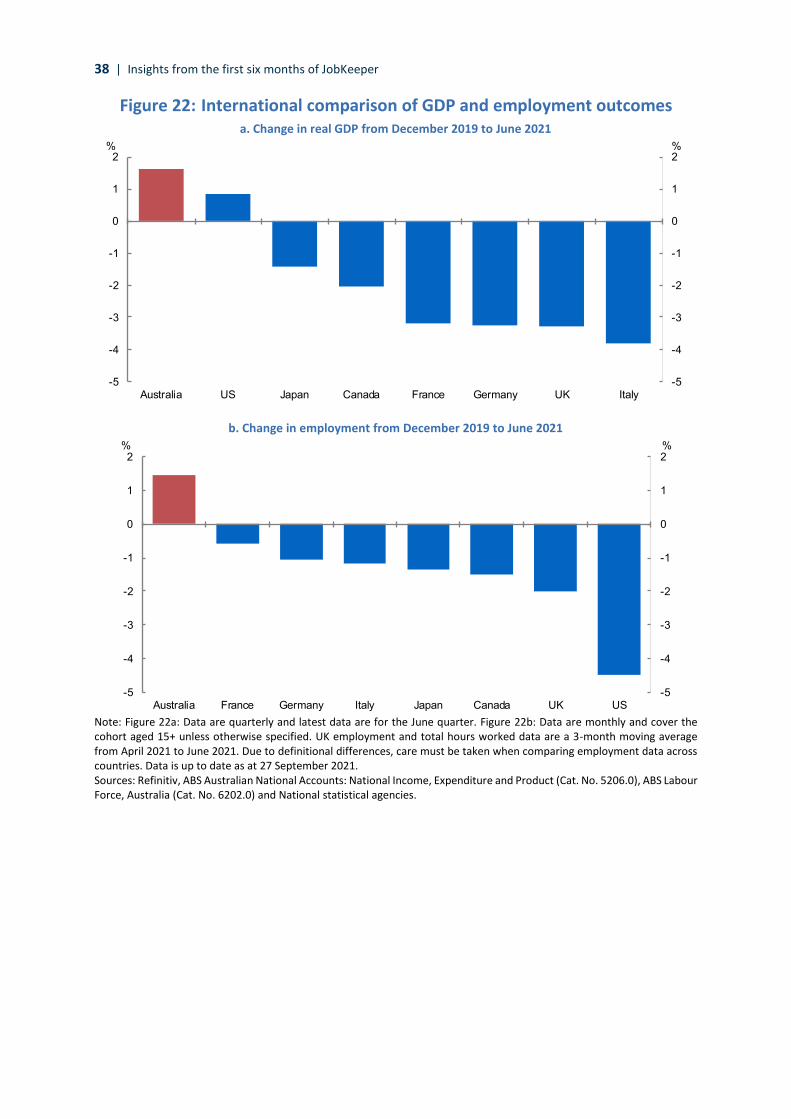
38 | Insights from the first six months of JobKeeper
Figure 22: International comparison of GDP and employment outcomes a. Change in real GDP from December 2019 to June 2021
b. Change in employment from December 2019 to June 2021
Note: Figure 22a: Data are quarterly and latest data are for the June quarter. Figure 22b: Data are monthly and cover the cohort aged 15+ unless otherwise specified. UK employment and total hours worked data are a 3-month moving average from April 2021 to June 2021. Due to definitional differences, care must be taken when comparing employment data across countries. Data is up to date as at 27 September 2021. Sources: Refinitiv, ABS Australian National Accounts: National Income, Expenditure and Product (Cat. No. 5206.0), ABS Labour Force, Australia (Cat. No. 6202.0) and National statistical agencies.
-5
-4
-3
-2
-1
0
1
2
-5
-4
-3
-2
-1
0
1
2
Australia US Japan Canada France Germany UK Italy
%%
-5
-4
-3
-2
-1
0
1
2
-5
-4
-3
-2
-1
0
1
2
Australia France Germany Italy Japan Canada UK US
%%

4. JobKeeper and business-level performance | 39
4. JobKeeper and business-level performance
Summary
JobKeeper businesses experienced larger declines in turnover than other businesses on average. Some businesses, however, did not experience a 30 per cent (or 50 per cent) decline in turnover.
• Around $11.4 billion was paid in the June quarter 2020 and $15.6 billion in the September quarter to businesses that did not have a 30 per cent (or 50 per cent) decline in turnover compared to the same period the previous year. Of this, $4.6 billion went to businesses that had an increase in turnover over the year to the June quarter and $9.2 billion to businesses with an increase over the year to the September quarter.
– The vast majority of the payments to businesses that increased their turnover went to small businesses – around $12.1 billion or 88 per cent of the total.
– Many of these businesses had been allowed to use an alternative test to determine their eligibility, as turnover relative to a year earlier was not a good indication of the impact of COVID-19 on their operations. Around $4.9 billion of the payments that were made to businesses whose turnover increased were made to businesses that had grown significantly over the year prior to COVID-19, but who appear to have experienced a significant COVID-19 impact.
– For other businesses, this outcome reflected better-than-expected health and business conditions and supported the economic recovery.
• Most JobKeeper businesses that did not experience a 30 per cent (or 50 per cent) decline in turnover compared with a year earlier, including those with turnover increases, were still significantly negatively impacted by COVID-19.
– Employment outcomes for these businesses were typically worse than for non-JobKeeper businesses.
Analysis of JobKeeper recipients
The turnover outcomes of businesses that took part in the first phase of JobKeeper have been analysed using individual business-level turnover data from Business Activity Statements submitted to the ATO, alongside business-level program data. This analysis focuses directly on the distribution of outcomes at the individual business level observed during the first phase of JobKeeper.
This analysis has examined the subset of businesses for whom appropriate data on turnover are available. It uses quarterly data from Business Activity Statements, since those data are most commonly available. Businesses had the option to base their eligibility on a monthly decline in turnover, but only large businesses are required to remit Business Activity Statements on a monthly basis.

40 | Insights from the first six months of JobKeeper
The detailed analysis that follows covers around two-thirds of the businesses that received assistance – around $47.6 billion of the $70.3 billion paid in the first phase of JobKeeper (Table 1).27 Recipients excluded from this analysis were:
• Not-for-Profit (NFP) recipients. The JobKeeper definition of turnover differed substantially from the Business Activity Statement definition for registered charities, particularly for revenue from donations and government grants.
• Businesses such as new entrants that did not submit a Business Activity Statement a year earlier and businesses too small to submit a quarterly Business Activity Statement.
• Some businesses that reported as part of a consolidated group. This analysis includes consolidated groups where JobKeeper was received by the reporting entity, but not where a member entity of the group is the JobKeeper recipient. For those groups where the reporting entity received JobKeeper, not all members of a group would necessarily have been JobKeeper recipients, making analysis based on Business Activity Statements less reliable given turnover is reported at the group, not entity, level.28
Table 1: JobKeeper payments, $b, and businesses within sample
June Q Sept Q Total
Total JobKeeper disbursed 31.8 38.5 70.3
Of which unable to match to BAS due to GST groupings 3.5 4.0 7.4
Of which unable to examine due to Not-for-profit reporting 3.7 4.1 7.8
Of which unable to match to BAS due to non-reporting or business entry 3.8 3.7 7.4
JobKeeper disbursed within sample 20.9 26.7 47.6
Total JobKeeper entities 899,867 950,187
JobKeeper entities within sample 606,608 661,224
Source: Treasury analysis of de-identified administrative data (BAS data linked to JobKeeper status).
The below analysis of turnover outcomes has limitations in assessing whether the first phase of JobKeeper was effectively targeted at the individual business level. This is because:
• Outcomes cannot be compared with hypotheticals – what might have happened – had JobKeeper not been introduced or had it been designed differently. To be eligible for JobKeeper in the first six months of the program, a business had to have a reasonable expectation of facing the specified decline in turnover in either the month or the quarter in the absence of JobKeeper support and given the health and economic outlook at the time.
• For some businesses – such as fast-growing young businesses or businesses that had merged or re-structured – it is not reasonable to compare turnover in the same quarter in the previous year to assess the impact of COVID-19 on their operations. These businesses were generally able to determine their eligibility using alternative tests (see Section 1, Box 2).
27 Note that all analysis uses gross disbursements and does not net out repayments (including voluntary
repayments). 28 Given Business Activity Statements are reported for the entire group, rather than a specific entity, analysis
for JobKeeper entities within groups is difficult. While the analysis included cases where the recipient entity was the reporting entity, the Business Activity Statement data cannot be relied on to capture that entity’s turnover. For example, turnover for the JobKeeper entity may have declined, while turnover for the group, which is reported in Business Activity Statements, increased. This represented a compromise between maximising the sample and maximising the accuracy of the analysis. Based on the turnover distributions in the sample, including all entities in consolidated entities, or excluding them all, does not substantially change the analysis.

4. JobKeeper and business-level performance | 41
• For some businesses, turnover in Business Activity Statements does not align with the definition of turnover used for JobKeeper. For example, the sale and liquidation of assets are included in Business Activity Statement measures of turnover, but were not included in the JobKeeper turnover test.
This analysis also does not suggest any of these businesses were ineligible for the JobKeeper Payment. Businesses’ eligibility was based on a prospective test; businesses were allowed to choose whether to establish their eligibility on a monthly or quarterly basis; and alternative tests were allowed for businesses in different situations. The Australian Taxation Office (ATO) set out guidance on how to undertake the decline in turnover test/s and the relevant evidence to support the turnover decline estimate, including where using an alternative test. The ATO has established that the vast majority of JobKeeper businesses reasonably estimated their projected decline in turnover.
Nonetheless, analysing turnover outcomes provides some insights.
Most JobKeeper recipients were businesses with significant turnover declines
JobKeeper businesses had significantly worse outcomes in terms of turnover than non-JobKeeper businesses. This is consistent with the early analysis in the JobKeeper review. The median through-the-year turnover decline for JobKeeper recipient businesses was 28 per cent in the June quarter and 23 per cent in the September quarter 2020, compared with no decline for other businesses (Table 2).
Table 2: Turnover decline, %, by JobKeeper recipient status
June Q Sept Q
Mean Median Mean Median
JobKeeper businesses -21.7 -27.9 -14.8 -22.7
Non-JobKeeper businesses -1.5 0.0 -0.2 0.0
Note: Turnover change calculated over the year to specified quarter. Sales growth above 100 per cent is winsorised. Source: Treasury analysis of de-identified administrative data (BAS data linked to JobKeeper status).
Figure 23 shows the cumulative distribution of turnover outcomes for JobKeeper and non-JobKeeper businesses. It shows that non-JobKeeper businesses tended to have higher turnover growth than JobKeeper businesses over the year to the June quarter 2020. For example, around half of non-JobKeeper businesses experienced an increase in turnover over this period, compared with only around one-quarter of JobKeeper businesses. Conversely, around half of JobKeeper businesses faced a turnover decline of more than 30 per cent, compared with around one-quarter of non-JobKeeper businesses.
Figure 23 also illustrates that analysis of turnover decline over the past year captures factors other than just COVID-19 impacts. For both JobKeeper and non-JobKeeper businesses, mergers, restructurings and other structural changes in business operations significantly affect measured turnover outcomes in any given year. Around 10 per cent of businesses across both JobKeeper and non-JobKeeper businesses had a measured decline in turnover greater than 90 per cent or a measured increase in turnover was greater than 100 per cent.29
29 Broadly similar shares of businesses tend to have such extreme outcomes under ‘normal’ economic
conditions.

42 | Insights from the first six months of JobKeeper
Figure 23: Cumulative distribution of turnover growth to June quarter
Note: Data expressed as through-the-year turnover growth. Dotted lines are medians. Source: Treasury analysis of de-identified administrative data (BAS data linked to JobKeeper status).
Some JobKeeper businesses had annual turnover declines less than 30 per cent
This Business Activity Statement analysis indicates that (Table 3):
• Around $11.4 billion and $15.6 billion in the June and September quarters 2020, was paid to businesses with a turnover decline over the year that was less than 30 per cent (or 50 per cent).
• Around $6.8 billion and $6.4 billion in the June and September quarters 2020, was paid to businesses with a turnover decline over the year that was between zero and 30 per cent (or 50 per cent).
• Around $4.6 billion and $9.2 billion in the June and September quarters 2020, was paid to businesses with a turnover increase over the year.
Table 3: JobKeeper payments and individuals supported
Payments to businesses
($ billion)
Individuals supported in
businesses (million)
Jun Q Sep Q Total Jun Q Sep Q
Annual turnover decline less than 30% (or 50%) 11.4 15.6 27.0 1.4 1.5
Annual turnover decline between 0 – 30% (or 50%) 6.8 6.4 13.2 0.8 0.6
Annual turnover increase 4.6 9.2 13.8 0.6 0.9
Annual turnover increase, excluding those 2.7 6.2 8.9 0.4 0.6 whose growth fell in the quarter
Note: Turnover change calculated over the year to specified quarter. Change in turnover growth defined as growth from June or September 2019 to comparative period in 2020, less growth from March 2019 to March 2020. Change in turnover growth cannot be calculated for all firms with increased turnover (e.g. due to firms not existing in March 2019). As such, numbers based on applying share for available sample to the full $4.6 and $9.2 billion figures. Source: Treasury analysis of de-identified administrative data (BAS data linked to JobKeeper status).
0
10
20
30
40
50
60
70
80
90
100
0
10
20
30
40
50
60
70
80
90
100
-100
-90
-80
-70
-60
-50
-40
-30
-20
-10
0 10
20
30
40
50
60
70
80
90
100
%%
JobKeeper businesses
Non-JobKeeper businesses
Share of firms with through-the-year turnover growth at or above, %

4. JobKeeper and business-level performance | 43
The vast majority of these payments went to small businesses. Small businesses with revenue below $50 million accounted for $22.5 billion (83 per cent) of the payments to businesses that did not report the expected declines in turnover in both quarters, and $12.1 billion (88 per cent) of the payments to businesses with turnover increases (Figure 24). In terms of the number of businesses, they account for over 99 per cent of all recipients in both cases. The average business that did not have a decline in turnover of 30 per cent (or 50 per cent) had around four supported individuals (employees or business participants).
Figure 24: JobKeeper payments by business size and turnover category, $b a: Businesses without 30 (or 50) per cent turnover
decline in the June and September quarters b: Businesses with a turnover increase in the June
and September quarters
Source: Treasury analysis of de-identified administrative data (BAS data linked to JobKeeper status).
In the June quarter 2020, shares of businesses with through-the-year turnover declines larger than 30 per cent (or 50 per cent) were quite similar across states. However, in the September quarter a larger share of businesses in Victoria had more significant turnover declines (see Tables 14 and 17).
Across industries, the analysis suggests that businesses in accommodation and food, and arts and recreation were most likely to experience a turnover decline of 30 per cent (or 50 per cent) compared with a year earlier (Tables 13 and 16). In contrast, of the industries that received substantial JobKeeper payments, businesses in construction, manufacturing, and wholesale and retail trade were less likely to experience a turnover decline of 30 per cent (or 50 per cent) compared with a year earlier. Detailed data on JobKeeper recipients by turnover are available in Appendix 2.
But many businesses that appear not to have had large turnover declines were still significantly affected by COVID-19 restrictions
For some businesses, the same quarter in the previous year did not represent a reasonable comparison period to assess the impact of COVID-19. For example, young and growing businesses may have experienced substantial growth over the year to the March quarter 2020 and then been

44 | Insights from the first six months of JobKeeper
significantly impacted in the June quarter. These businesses may have experienced a decline in turnover in the June quarter, but not over the year to the June quarter. These businesses were able to use alternative turnover tests to determine their eligibility with more appropriate reference periods.
Data were not systematically captured on the test that businesses used to determine their eligibility.30 To examine the extent to which rapidly growing businesses were affected by COVID-19 restrictions, Treasury examined the change in the through-the-year turnover growth rate from the March quarter.31 The analysis shows that around $4.9 billion (35 per cent) of the $13.8 billion paid to businesses with increases in turnover through the year was paid to businesses that actually had a decline in through-the-year turnover growth since the March quarter.32 These businesses are likely to have been eligible to use an alternative test, and their turnover looks to have declined in the June quarter 2020 (in seasonally adjusted terms). Abstracting from payments to these businesses, payments to businesses with an increase in turnover amounted to around $8.9 billion.
These types of dynamics appear to be particularly important for businesses that had large turnover increases. Around 6 per cent of businesses within the sample (approximately 35,000) had turnover increases of over 100 per cent over the year to the June quarter, accounting for around $690 million of JobKeeper payments. These businesses were very small, with around 77 per cent having two or fewer JobKeeper-nominated individuals. Of the $690 million paid to these businesses, 75 per cent was paid to businesses that had a decline in through-the-year growth in the June quarter.
Other businesses that did not have a turnover decline of 30 per cent (or 50 per cent) over the year to the quarter did face significant declines in turnover in the early months of restrictions.33 Analysis of businesses that report their turnover on a monthly frequency shows that around 40 per cent of businesses that did not have a through-the-year turnover decline of 30 per cent (or 50 per cent) in the June quarter overall did experience such a decline in the month of April. For these businesses, this outcome likely reflects the earlier-than-expected easing of restrictions and the surprisingly strong economic recovery.
The effect of the strong recovery was also evident in the quarterly outcomes. Of the $9.2 billion that went to businesses with a turnover increase over the year to the September quarter, $1.9 billion went to businesses that had a decline of more than 30 per cent through the year to the June quarter. Of the $6.4 billion paid to firms with a decline between zero and 30 per cent over the year to the September quarter, $2.0 billion went to firms that had a turnover decline of more than 30 per cent through the year to the June quarter.
30 The ATO set out guidance on how to undertake the decline in turnover test/s and the relevant evidence to
support the turnover decline estimate, including where using an alternative test. When undertaking compliance activities or reviews of claims the ATO requires the business to demonstrate that they have appropriately applied this guidance. The ATO issued advice in Law Companion Ruling (LCR 2020/1 – lcr2020-001.pdf (ato.gov.au) and other alternative test guidance material Alternative test | Australian Taxation Office (ato.gov.au).
31 Specifically, growth from the March quarter 2019 to the March quarter 2020 is compared to growth from the June quarter 2019 to the June quarter 2020, or the September quarter 2019 to the September quarter 2020. Results are qualitatively similar looking at actual quarter on quarter changes. However, seasonality makes these comparisons more difficult.
32 Change in turnover growth cannot be calculated for all firms with increased turnover (e.g. due to firms not existing in March 2019). As such, the $4.9 billion figure is arrived at by applying shares calculated for available sample, to the full quarterly figures for firms with a turnover increase.
33 This is a sample of generally larger businesses. Businesses with GST turnover of greater than $20 million are required to report their Business Activity Statements on a monthly basis.

4. JobKeeper and business-level performance | 45
Businesses that did not have the expected turnover declines still displayed worse employment outcomes than non-JobKeeper businesses
The number of separations for JobKeeper businesses that did not experience a turnover decline of 30 per cent (or 50 per cent) over the year increased by around 60 per cent in late March, compared to almost no increase for non-JobKeeper businesses (Figure 25a). The number of jobs at these businesses also declined sharply at the start of the crisis and remained below the level for non-JobKeeper businesses at the end of September (Figure 25b).
There were also moderate declines in hours worked within these businesses, though to a lesser extent than businesses that did experience a turnover decline of 30 per cent (or 50 per cent). In businesses that did not experience a turnover decline of 30 per cent (or 50 per cent) over the year to the June quarter, around 5 per cent of employees were stood down. This equates to around 85,000 workers who were stood down and working zero hours and who would likely have lost the connection to their employer without JobKeeper support. Income transfers for these businesses increased, suggesting they had still had to reduce the hours worked by their employees, though not by as much as businesses that faced higher reductions in turnover.
Figure 25: Separations and jobs, by JobKeeper status and turnover a. Separations b. Jobs
Note: Figure presents fortnightly time series of job separations and payroll jobs, indexed to equal 100 in the fortnight ending 1 March 2020. Separations are based on cease dates for a worker’s employment relationship with a business (it can include workers who were on zero pay). Series exhibits volatility around end of financial year, which has been corrected. Payroll jobs are based on employee-employer relationships with pay, including any JobKeeper amounts. Dashed line indicates start of JobKeeper. Turnover analysis is based on June quarter 2020 data compared to a year earlier. Source: De-identified administrative data (STP and BAS data linked to JobKeeper status).
0
50
100
150
200
250
0
50
100
150
200
250
Feb-20 Apr-20 Jun-20 Aug-20 Sep-20
IndexIndex
50
60
70
80
90
100
110
50
60
70
80
90
100
110
Feb-20 Apr-20 Jun-20 Aug-20 Sep-20
IndexIndex

46 | Insights from the first six months of JobKeeper
Following the introduction of JobKeeper, job shedding declined sharply in these businesses. And employment outcomes substantially recovered, with estimates suggesting around 200,000 JobKeeper workers were brought back once the policy was introduced (see Table 18 in Appendix 2).34 As the economy recovered and these businesses expanded and pivoted production, hours worked for JobKeeper workers increased, as did employment of non-JobKeeper workers (by an estimated 150,000).35 This analysis suggests that JobKeeper affected employment decisions even in JobKeeper businesses that experienced better outcomes than they had expected.
34 The increase in jobs is calculated from the trough in May, given the timing of initial payments. 35 These estimates assume that, prior to the pandemic, around one-third of employment in these businesses
were workers that were not eligible for JobKeeper, consistent with evidence in the JobKeeper review.
5. Future work | 47
5. Future work
Summary
An evaluation will be completed in 2022 to provide a detailed assessment of JobKeeper against its policy objectives and lessons learned for future policy makers.
The ANAO is currently undertaking an audit of the ATO’s Administration of the JobKeeper Scheme, which is due to be tabled in December 2021.
Over the period ahead, analysis of the JobKeeper program is also expected to be undertaken by researchers and academics using the administrative data that is available through the ABS DataLab.
Evaluation of JobKeeper
This report has focussed on the first six months of JobKeeper, drawing on administrative and macroeconomic data. An evaluation of JobKeeper will be undertaken to consider the effectiveness of JobKeeper in achieving its policy objectives and lessons learned from the process to design and deliver JobKeeper. Should economic circumstances ever again call for a program like JobKeeper, it will be important to have drawn from the experience of the program and to have considered how it could be improved. The evaluation will consider the full program and draw on a broad range of relevant quantitative and qualitative data to carefully analyse the outcomes and impacts of JobKeeper.36
The evaluation will consider the following issues.
• The extent to which JobKeeper achieved its stated policy objectives: to support business and job survival; to preserve the employment relationship (between employees and employers), and to provide needed income support; and to decrease uncertainty.
• The broader outcomes and unintended consequences of JobKeeper, including the impact of JobKeeper directly in supporting recipients and indirectly on the economy and society.
• Lessons learned from the design and implementation of JobKeeper, including to inform any future policy responses.
The evaluation will consider JobKeeper as part of the suite of economic measures introduced in response to COVID-19, including how it interacted with other policies. In time, it will be important to examine the broader macroeconomic response for lessons it might offer future policy makers. Similar reflection processes followed the Global Financial Crisis, including papers published in May 2021 by the Institute of Public Administration Australia.37
Given the size of JobKeeper, it is appropriate for academics, researchers and others to conduct analysis of JobKeeper and consider its impacts. The JobKeeper review indicated that Treasury would work with the ATO and the ABS to make JobKeeper administrative data available for research
36 While JobKeeper ended on 28 March 2021, the ATO continues to administer the program, with
compliance work ongoing and the ATO able to process JobKeeper payments for eligible recipients until 31 March 2022.
37 Institute of Public Administration Australia, Public Policy Lessons from the Global Financial Crisis, May 2021.

48 | Insights from the first six months of JobKeeper
purposes. Since November 2020 deidentified JobKeeper microdata has been made available to government researchers, academics and public policy institutes through the ABS DataLab. To access this dataset, researchers are required to register and request access through the ABS DataLab and provide the necessary documentation, including a research project proposal. Access to ABS microdata is carefully managed to protect privacy and confidentiality. It can only be accessed for research, policy and statistical purposes. The data are never used for compliance purposes. Treasury welcomes research projects using this dataset and ongoing collaboration with the research community, which will examine the effectiveness and impact of JobKeeper from a range of different perspectives.
The ANAO is currently undertaking an audit into the ATO’s Administration of the JobKeeper Scheme, due to be tabled in December 2021. The report will consider the effectiveness of the ATO’s administration of JobKeeper, implementation of effective measures to protect the integrity of JobKeeper payments and the effectiveness of monitoring, reporting and operational performance.
The JobKeeper evaluation will consider and integrate any relevant findings from the ANAO audit process, analysis presented by researchers and academics, and final JobKeeper program data, and is expected to be finalised in 2022.

Appendix 1: JobKeeper program data | 49
Appendix 1: JobKeeper program data This appendix provides detailed data for all phases of the JobKeeper program and the underlying data for figures in Section 2 ‘JobKeeper program data’.
Table 4: JobKeeper take up – all phases of the program (April 2020 to March 2021)
First phase of JobKeeper – April to September 2020
Apr 2020 May 2020 Jun 2020 Jul 2020 Aug 2020 Sep 2020
JobKeeper fortnights 30 Mar–26 Apr
27 Apr–24 May
25 May–
21 Jun
22 Jun–
19 Jul
20 Jul–
30 Aug
31 Aug–
27 Sept
Monthly Totals
Number of entities receiving payment
862,150 908,992 928,459 943,287 963,874 943,399
Number of individuals 3,368,680 3,580,365 3,639,526 3,659,934 3,642,790 3,610,916
Net monthly payments $10.1b $10.7b $10.9b $11b $16.4b $10.8b
Total cumulative net payments (all periods)
$10.1b $20.9b $31.8b $42.8b $59.1b $70b
Second phase of JobKeeper – October 2020 to March 2021
Oct 2020 Nov 2020 Dec 2020 Jan 2021 Feb 2021 Mar 2021
JobKeeper fortnights 28 Sept– 25 Oct
28 Oct–
22 Nov
23 Nov–
3 Jan
4 Jan–
31 Jan
1 Feb–
28 Feb
1 Mar–
28 Mar
Monthly Totals
Number of entities receiving payment
511,334 506,903 497,308 375,026 373,440 355,051
Number of individuals 1,633,406 1,606,673 1,569,009 1,087,037 1,072,520 1,031,848
Net monthly payments $3.7b $3.7b $5.4b $2.1b $2.1b $2b
Total cumulative net payments (all periods)
$73.7b $77.4b $82.7b $84.8b $86.9b $88.8b
Note: Entity counts are based on unique ABNs. Entities include employers and eligible business participants with a processed application. An eligible business participant is an individual who is actively engaged in the operation of the business and is not an employee of the business. There can only be one eligible business participant claimed for the entity. Individuals include employees and eligible business participants. Net payments is the payment disbursements after repayments from entities, excluding voluntary repayments. Totals for all periods may not balance due to rounding. August 2020 and December 2020 net payments are higher due to having three fortnights (all other months are two fortnights). Source: ATO administrative data as at 15 August 2021.

50 | Insights from the first six months of JobKeeper
Tables 5a-c: Distribution of JobKeeper entities and payments
a. Turnover size
Entities Net Cash Payments
Annual turnover No. Share (%) ($b) Share (%)
Below $2m 935,921 89.4 29.9 42.7
$2m – $10m 65,188 6.2 12.2 17.4
$10m – $50m 14,389 1.4 7.4 10.6
$50m – $250m 3,790 0.4 5.2 7.4
$250m-$1b 1,386 0.1 4.0 5.7
Above $1b 965 0.1 3.5 5.0
Not for Profit 18,779 1.8 7.8 11.1
Not assigned 6,126 0.6 0.1 0.1
Total 1,046,544 70.0
Data underlying Figure 5a and 5b. Source: ATO administrative data as at 20 September 2021.
b. Entity type
Entity type
Share of entities
%
Share of payments
%
Individual (sole trader) 40.6 11.8
Company 37.6 67.7
Trust 15.2 16.9
Partnership 6.6 3.6
Data underlying Figure 5c. Source: ATO administrative data as at 15 August 2021.
c. State
State
Share of entities
%
Share of payments
%
NSW 33.7 34.0
VIC 29.7 29.8
QLD 18.4 18.4
WA 9.2 8.8
SA 5.8 5.7
TAS 1.6 1.6
ACT 1.0 1.1
NT 0.5 0.5
Data underlying Figure 5d. Source: ATO administrative data as at 15 August 2021.

Appendix 1: JobKeeper program data | 51
Tables 6a-b: JobKeeper coverage of employment a. Share of total vs private-sector employment
State
Total employment
%
Private-sector employment
%
NSW 29.5 34.3
VIC 31.2 36.1
QLD 25.9 30.5
WA 23.1 27.0
SA 23.8 28.3
TAS 22.6 28.1
ACT 17.6 28.8
NT 13.8 19.2
Aus. 27.7 32.6
Data underlying Figure 6a. Note: Pre-COVID employment given by average employment in the year to February 2020. Count of individuals supported by JobKeeper is the monthly average from April to September 2020. Source: ATO administrative data as 15 August 2021 and ABS Labour Force, Australia, Detailed, Quarterly, May 2021 (Cat. No. 6291.0.55.003).
b. Share of total employment
State April
%
May
%
June
%
July
%
August
%
September
%
NSW 28.1 29.7 30.1 30.1 29.6 29.2
VIC 28.4 30.2 30.7 31.3 32.8 33.1
QLD 25.2 26.6 27.0 26.9 25.3 24.8
WA 21.2 22.9 23.6 23.8 23.6 23.1
SA 22.0 23.8 24.3 24.4 24.2 23.8
TAS 21.1 22.5 23.1 23.3 23.0 22.7
ACT 17.0 17.9 18.2 18.2 17.4 16.9
NT 13.4 14.0 14.1 14.0 13.7 13.5
Aus. 26.0 27.6 28.1 28.2 28.1 27.9
Data underlying Figure 6b. Source: ATO administrative data as at 15 August 2021 and ABS Labour Force, Australia, Detailed, Quarterly, May 2021 (Cat. No. 6291.0.55.003).

52 | Insights from the first six months of JobKeeper
Tables 7a-b: JobKeeper first phase distribution of private sector employment, decline in employment, and JobKeeper participants a. By sex
Share of JobKeeper participants
%
Share of decline in hours worked
(Apr-Sept 2020)
%
Share of pre-COVID employment
(March 2020)
%
Male 54.6 53.1 52.6
Female 45.4 46.9 47.4
Data underlying Figure 7a. Source: ATO administrative data as at 7 July 2021 and ABS Labour Force, Australia, Monthly, August 2021 (Cat. No. 6202.0).
b. By age
Share of JobKeeper participants
%
Share of decline in hours worked
(Apr-Sept 2020)
%
Share of pre-COVID employment
(March 2020)
%
15-24 10.3 14.9 22.4
25-34 21.8 23.9 29.9
35-44 23.2 21.8 18.5
45-54 21.7 20.3 17.3
55-64 16.6 14.7 8.4
65 + 6.3 4.5 3.5
Data underlying Figure 7b. Source: ATO administrative data as at 7 July 2021 and ABS Labour Force, Australia, Detailed, Monthly, August 2021 (Cat. No. 6291.0.55.003).

Appendix 1: JobKeeper program data | 53
Table 8: JobKeeper first phase payments – levels and share of compensation of employees, by industry
Industry
Net payments
($ billions)
Share of compensation of
employees
%
Arts and Recreation Services 2.6 60.9
Accommodation and Food Services 6.3 46.1
Other Services 4.9 41.2
Agriculture, Forestry and Fishing 1.4 28.9
Retail Trade 6.3 23.6
Rental, Hiring and Real Estate Services 2.2 23.0
Construction 8.3 22.4
Professional, Scientific and Technical Services 8.8 16.9
Manufacturing 5.5 16.4
Transport, Postal and Warehousing 3.4 15.8
Wholesale Trade 3.4 14.8
Administrative and Support Services 4.0 14.3
Information Media and Telecommunications 1.0 12.0
Health Care and Social Assistance 7.2 11.2
Education and Training 2.6 6.0
Financial and Insurance Services 1.2 4.6
Electricity, Gas, Water and Waste Services 0.2 2.8
Mining 0.3 2.0
Public Administration and Safety 0.4 0.9
Data underlying Figure 8. Note: Compensation of employees (COE) is measured for the June and September quarters 2020. Source: ATO administrative data as at 15 August 2021 and ABS Australian National Accounts, June 2021 (Cat. No. 5206.0).

54 | Insights from the first six months of JobKeeper
Table 9: JobKeeper first phase individuals – number and coverage of pre-COVID-19 employment, by industry
Industry
JobKeeper individuals
(000s)
Share of pre-COVID-19 employment
%
Arts and Recreation Services 132.8 53.0
Rental, Hiring and Real Estate Services 110.6 51.9
Other Services 249.5 49.4
Administrative and Support Services 203.7 44.6
Wholesale Trade 173.1 43.8
Professional, Scientific and Technical Services 452.3 39.1
Construction 424.0 35.9
Accommodation and Food Services 321.1 34.9
Manufacturing 283.2 31.5
Transport, Postal and Warehousing 176.1 26.6
Retail Trade 323.9 25.6
Information Media and Telecommunications 53.3 25.5
Agriculture, Forestry and Fishing 72.1 22.0
Health Care and Social Assistance 371.6 21.2
Financial and Insurance Services 61.3 13.5
Education and Training 131.9 12.1
Electricity, Gas, Water and Waste Services 10.5 6.9
Mining 15.7 6.5
Public Administration and Safety 20.6 2.5
Data underlying Figure 9. Note: Pre-COVID employment given by average employment in the year to February 2020. Individuals includes employees and eligible business participants (EBPs). Source: ATO administrative data as at 15 August 2021 using monthly average number of individuals supported and ABS Labour Force, Australia, Detailed, Quarterly, May 2021 (Cat. no. 6291.0.55.003).
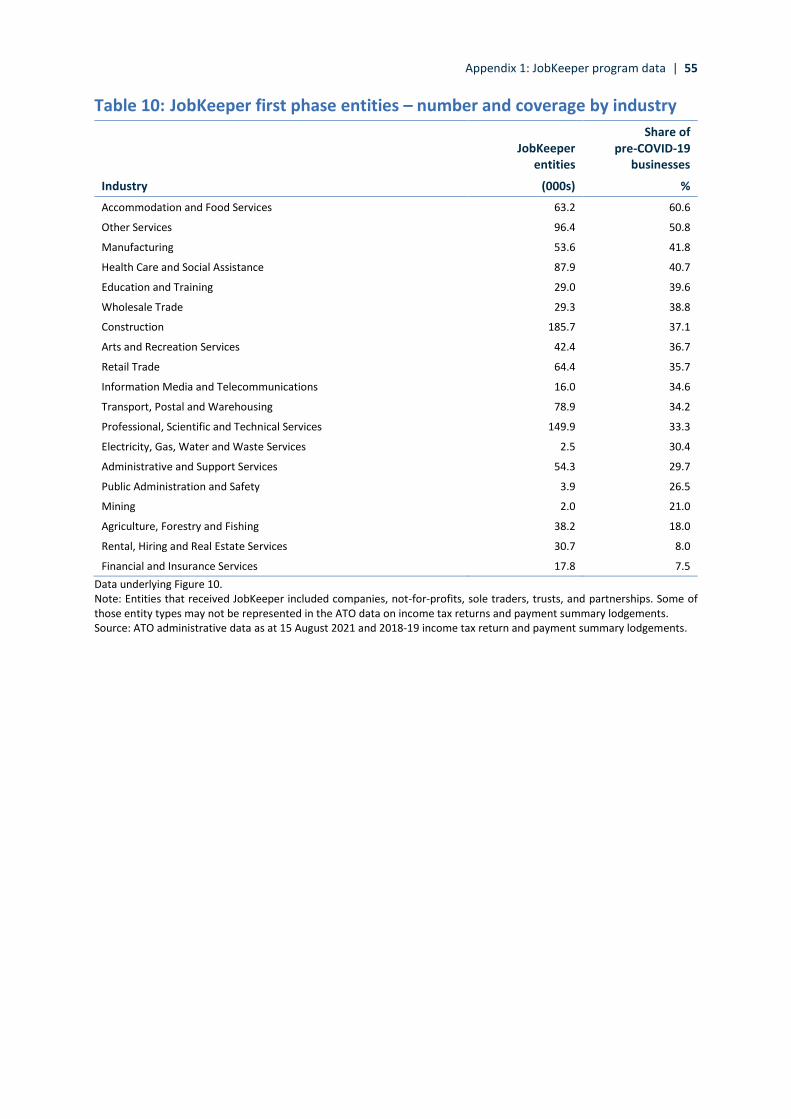
Appendix 1: JobKeeper program data | 55
Table 10: JobKeeper first phase entities – number and coverage by industry
Industry
JobKeeper entities
(000s)
Share of pre-COVID-19
businesses
%
Accommodation and Food Services 63.2 60.6
Other Services 96.4 50.8
Manufacturing 53.6 41.8
Health Care and Social Assistance 87.9 40.7
Education and Training 29.0 39.6
Wholesale Trade 29.3 38.8
Construction 185.7 37.1
Arts and Recreation Services 42.4 36.7
Retail Trade 64.4 35.7
Information Media and Telecommunications 16.0 34.6
Transport, Postal and Warehousing 78.9 34.2
Professional, Scientific and Technical Services 149.9 33.3
Electricity, Gas, Water and Waste Services 2.5 30.4
Administrative and Support Services 54.3 29.7
Public Administration and Safety 3.9 26.5
Mining 2.0 21.0
Agriculture, Forestry and Fishing 38.2 18.0
Rental, Hiring and Real Estate Services 30.7 8.0
Financial and Insurance Services 17.8 7.5
Data underlying Figure 10. Note: Entities that received JobKeeper included companies, not-for-profits, sole traders, trusts, and partnerships. Some of those entity types may not be represented in the ATO data on income tax returns and payment summary lodgements. Source: ATO administrative data as at 15 August 2021 and 2018-19 income tax return and payment summary lodgements.

56 | Insights from the first six months of JobKeeper
Table 11: JobKeeper first phase coverage of pre-COVID-19 employment, distribution by SA4
SA4 CODE SA4 REGION Share of pre-COVID-19 employment
%
National Average
31.3
100 NEW SOUTH WALES – TOTAL 31.2
101 Capital Region 27.0
102 Central Coast 33.6
103 New South Wales – Central West 25.3
104 Coffs Harbour – Grafton 31.4
105 Far West and Orana 28.9
106 Hunter Valley exc Newcastle 28.3
107 Illawarra 30.6
108 Mid North Coast 33.5
109 Murray 28.6
110 New England and North West 27.3
111 Newcastle and Lake Macquarie 27.0
112 Richmond – Tweed 34.2
113 Riverina 24.9
114 Southern Highlands and Shoalhaven 36.3
115 Sydney – Baulkham Hills and Hawkesbury 38.5
116 Sydney – Blacktown 26.9
117 Sydney – City and Inner South 27.4
118 Sydney – Eastern Suburbs 33.6
119 Sydney – Inner South West 34.6
120 Sydney – Inner West 30.4
121 Sydney – North Sydney and Hornsby 31.9
122 Sydney – Northern Beaches 39.7
123 Sydney – Outer South West 33.4
124 Sydney – Outer West and Blue Mountains 29.5
125 Sydney – Parramatta 29.6
126 Sydney – Ryde 29.4
127 Sydney – South West 32.5
128 Sydney – Sutherland 37.4
200 VICTORIA – TOTAL 34.7
201 Ballarat 32.9
202 Bendigo 30.4
203 Geelong 35.9
204 Hume 30.1
205 Latrobe – Gippsland 29.2
206 Melbourne – Inner 31.7
207 Melbourne – Inner East 38.0

Appendix 1: JobKeeper program data | 57
SA4 CODE SA4 REGION Share of pre-COVID-19 employment
%
208 Melbourne – Inner South 36.5
209 Melbourne – North East 35.5
210 Melbourne – North West 39.7
211 Melbourne – Outer East 39.8
212 Melbourne – South East 35.7
213 Melbourne – West 33.4
214 Mornington Peninsula 37.4
215 Victoria – North West 28.8
216 Shepparton 28.4
217 Warrnambool and South West 24.1
300 QUEENSLAND – TOTAL 30.3
301 Brisbane – East 31.3
302 Brisbane – North 30.6
303 Brisbane – South 28.6
304 Brisbane – West 26.0
305 Brisbane Inner City 30.6
306 Cairns 31.3
307 Darling Downs – Maranoa 25.9
308 Central Queensland 20.3
309 Gold Coast 37.7
310 Ipswich 26.3
311 Logan – Beaudesert 32.7
312 Mackay – Isaac – Whitsunday 23.1
313 Moreton Bay – North 32.9
314 Moreton Bay – South 33.9
315 Queensland – Outback 12.8
316 Sunshine Coast 35.3
317 Toowoomba 35.9
318 Townsville 25.9
319 Wide Bay 26.0
400 SOUTH AUSTRALIA – TOTAL 28.8
401 Adelaide – Central and Hills 31.5
402 Adelaide – North 28.1
403 Adelaide – South 29.5
404 Adelaide – West 32.0
405 Barossa – Yorke – Mid North 26.0
406 South Australia – Outback 23.1
407 South Australia – South East 24.3

58 | Insights from the first six months of JobKeeper
SA4 CODE SA4 REGION Share of pre-COVID-19 employment
%
500 WESTERN AUSTRALIA – TOTAL 27.5
501 Bunbury 26.2
502 Mandurah 23.9
503 Perth – Inner 29.6
504 Perth – North East 29.3
505 Perth – North West 29.8
506 Perth – South East 27.9
507 Perth – South West 28.5
508 Western Australia – Outback (North and South) 20.0
509 Western Australia – Wheat Belt 22.1
600 TASMANIA – TOTAL 28.8
601 Hobart 29.6
602 Launceston and North East 29.6
603 Tasmania – South East 23.0
604 Tasmania – West and North West 27.8
700 NORTHERN TERRITORY – TOTAL 17.6
701 Darwin 20.9
702 Northern Territory – Outback 12.1
800 AUSTRALIAN CAPITAL TERRITORY – TOTAL 21.7
801 Australian Capital Territory 21.7
Data underlying Figure 11. Note: In 2012 the Statistical Area Level 4 (SA4) regions were changed in Western Australia. Area 508 was divided into two areas: 510 and 511. However, ABS labour force data still reports at area 508. Areas 510 and 511 have been combined into Area 508 in the tables. Table 11 shows JobKeeper coverage of unique individuals, who received JobKeeper in one or more fortnights in the first six months of the program, by SA4 region. Pre-COVID-19 employment is given by average employment in the year to February 2020. The employment number includes all employment categories and therefore includes some employees who were ineligible for JobKeeper e.g. public sector workers, casual employees not eligible for JobKeeper. The Australian Capital Territory SA4 is equal to the state total and has only been included once. Source: ATO administrative data on JobKeeper unique individuals by postcode as at 9 February 2021, allocated to population weighted ABS SA4 regions; ABS Labour Force, Australia, Detailed, Monthly, June 2021 (Cat. No. 6291.0.55.003).

Appendix 2: Detailed data on JobKeeper recipients by turnover | 59
Appendix 2: Detailed data on JobKeeper recipients by turnover The tables in this appendix provide further details on the data presented in section 4.
Table 12: JobKeeper recipients by through-the-year turnover decline and size, June quarter 2020
Totals Turnover decline more than 30%
(or 50%)
Turnover decline between 0 – 30%
(or 50%)
Turnover increase
Entities (‘000s)
Disbursements
($m)
Share of entities
(%)
Share of disbursements
(%)
Share of entities
(%)
Share of disbursements
(%)
Share of entities
(%)
Share of disbursements
(%)
Total 606.6 20,887.1 48 46 25 33 27 22
Below $2m 534.5 9,663.5 49 47 24 28 27 25
$2m – $10m 56.0 4,794.5 43 43 31 34 26 23
$10m – $50m 12.1 2,829.8 43 43 33 37 24 20
$50m – $250m 2.7 1,665.7 44 46 35 40 21 15
$250m – $1b 1.0 1,126.6 42 48 42 39 16 13
$1b+ 0.3 807.0 49 52 36 44 15 3
Note: Large businesses (those with turnover greater than $1 billion) were subject to a 50 per cent decline in turnover test.
Turnover analysis is based on quarterly data compared to a year earlier.
Source: JobKeeper disbursement data as at November 2020 and BAS data as at August 2021.
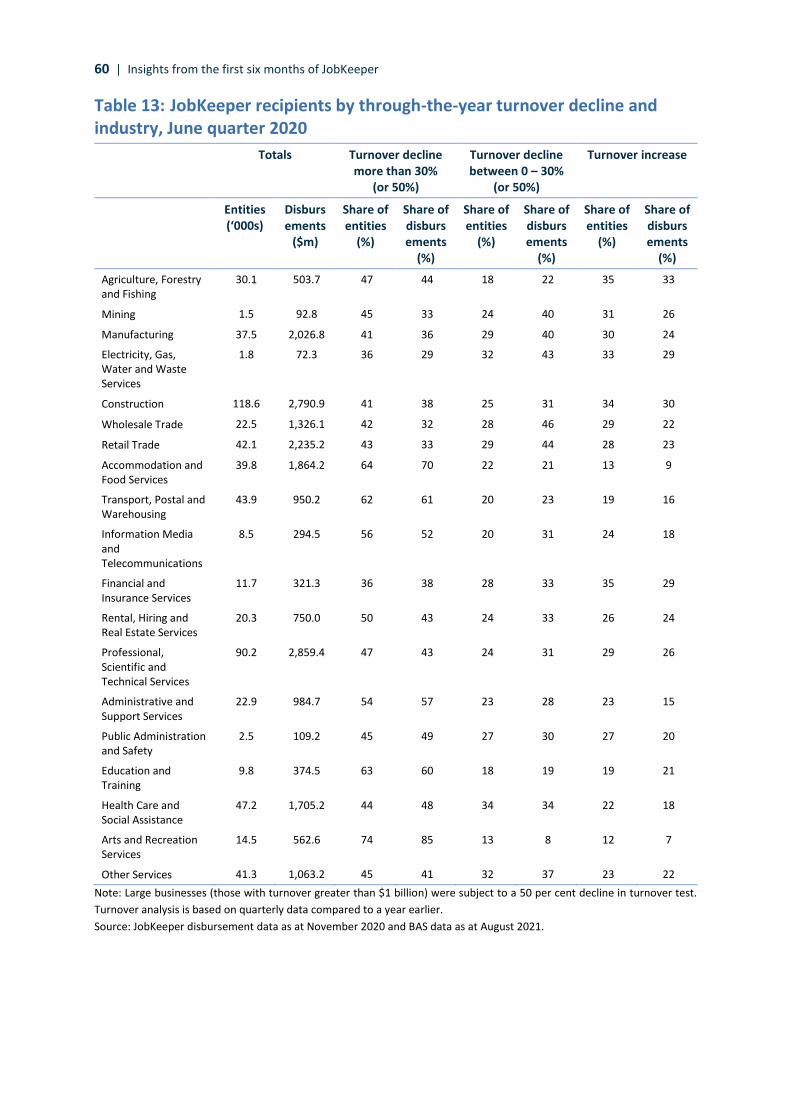
60 | Insights from the first six months of JobKeeper
Table 13: JobKeeper recipients by through-the-year turnover decline and industry, June quarter 2020
Totals Turnover decline more than 30%
(or 50%)
Turnover decline between 0 – 30%
(or 50%)
Turnover increase
Entities (‘000s)
Disbursements
($m)
Share of entities
(%)
Share of disbursements
(%)
Share of entities
(%)
Share of disbursements
(%)
Share of entities
(%)
Share of disbursements
(%)
Agriculture, Forestry and Fishing
30.1 503.7 47 44 18 22 35 33
Mining 1.5 92.8 45 33 24 40 31 26
Manufacturing 37.5 2,026.8 41 36 29 40 30 24
Electricity, Gas, Water and Waste Services
1.8 72.3 36 29 32 43 33 29
Construction 118.6 2,790.9 41 38 25 31 34 30
Wholesale Trade 22.5 1,326.1 42 32 28 46 29 22
Retail Trade 42.1 2,235.2 43 33 29 44 28 23
Accommodation and Food Services
39.8 1,864.2 64 70 22 21 13 9
Transport, Postal and Warehousing
43.9 950.2 62 61 20 23 19 16
Information Media and Telecommunications
8.5 294.5 56 52 20 31 24 18
Financial and Insurance Services
11.7 321.3 36 38 28 33 35 29
Rental, Hiring and Real Estate Services
20.3 750.0 50 43 24 33 26 24
Professional, Scientific and Technical Services
90.2 2,859.4 47 43 24 31 29 26
Administrative and Support Services
22.9 984.7 54 57 23 28 23 15
Public Administration and Safety
2.5 109.2 45 49 27 30 27 20
Education and Training
9.8 374.5 63 60 18 19 19 21
Health Care and Social Assistance
47.2 1,705.2 44 48 34 34 22 18
Arts and Recreation Services
14.5 562.6 74 85 13 8 12 7
Other Services 41.3 1,063.2 45 41 32 37 23 22
Note: Large businesses (those with turnover greater than $1 billion) were subject to a 50 per cent decline in turnover test.
Turnover analysis is based on quarterly data compared to a year earlier.
Source: JobKeeper disbursement data as at November 2020 and BAS data as at August 2021.

Appendix 2: Detailed data on JobKeeper recipients by turnover | 61
Table 14: JobKeeper recipients by through-the-year turnover decline by state, June quarter 2020
Totals Turnover decline more than 30%
(or 50%)
Turnover decline between 0 – 30%
(or 50%)
Turnover increase
Entities (‘000s)
Disburs ements
($m)
Share of
entities (%)
Share of disbursements
(%)
Share of
entities (%)
Share of disbursements
(%)
Share of
entities (%)
Share of disbursements
(%)
NSW 201.6 6,884.8 50 48 25 30 25 22
VIC 173.2 6,196.9 47 46 25 35 28 19
QLD 116.5 3,976.6 47 44 26 32 27 24
WA 57.9 1,865.6 46 40 27 35 27 24
SA 36.6 1,238.1 46 43 27 33 27 24
TAS 10.1 360.5 48 44 26 32 26 24
ACT 7.3 254.1 48 46 26 30 26 24
NT 3.5 110.5 47 45 26 31 28 24
Note: Large businesses (those with turnover greater than $1 billion) were subject to a 50 per cent decline in turnover test.
Turnover analysis is based on quarterly data compared to a year earlier.
Source: JobKeeper disbursement data as at November 2020 and BAS data as at August 2021.
Table 15: JobKeeper recipients by through-the-year turnover decline and size, September quarter 2020
Totals Turnover decline more than 30%
(or 50%)
Turnover decline between 0 – 30%
(or 50%)
Turnover increase
Entities (‘000s)
Disbursements
($m)
Share of entities
(%)
Share of disbursements
(%)
Share of entities
(%)
Share of disbursements
(%)
Share of entities
(%)
Share of disbursements
(%)
Total 661.2 26725.6 46 41 20 24 34 34
Below $2m 586.6 12,775.3 46 43 20 21 34 36
$2m – $10m 58.0 6,005.0 41 40 23 24 35 36
$10m – $50m 12.4 3,556.9 43 41 23 26 34 33
$50m – $250m 2.7 2,028.7 41 37 27 35 32 29
$250m – $1b 1.0 1,289.0 37 40 25 33 36 42
$1b+ 0.3 1,068.3 38 52 32 33 30 15
Note: Large businesses (those with turnover greater than $1 billion) were subject to a 50 per cent decline in turnover test.
Turnover analysis is based on quarterly data compared to a year earlier.
Source: JobKeeper disbursement data as at November 2020 and BAS data as at August 2021.
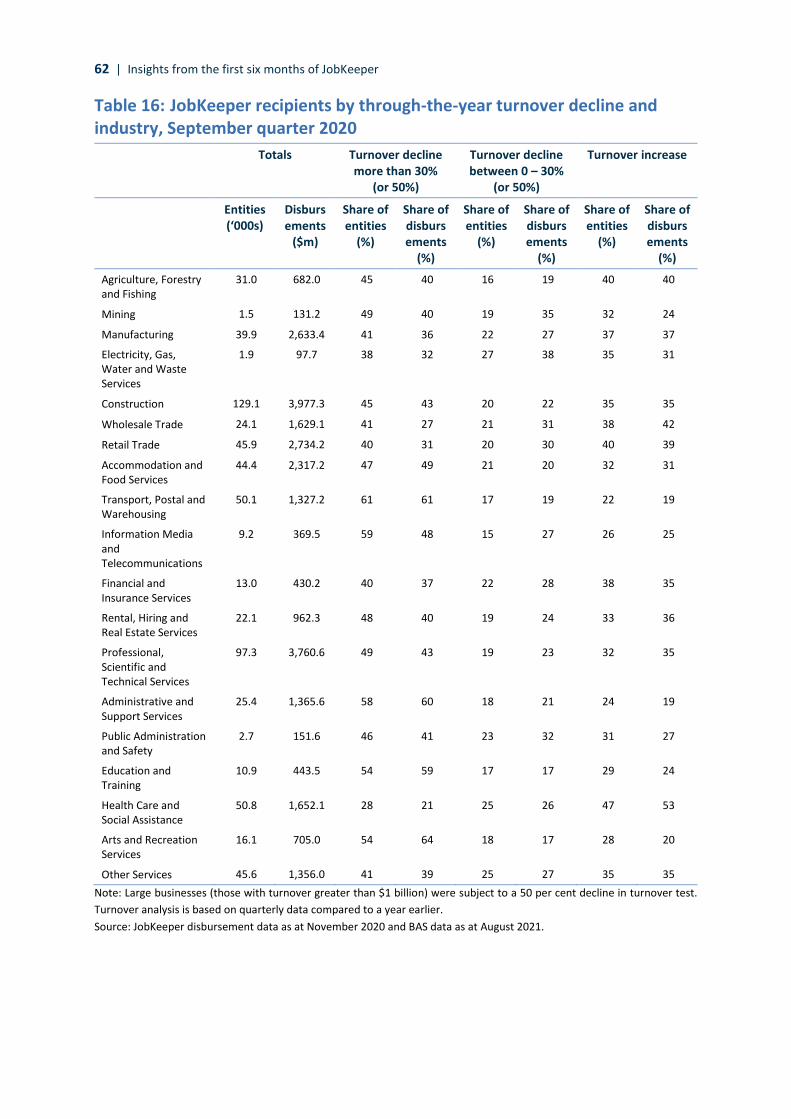
62 | Insights from the first six months of JobKeeper
Table 16: JobKeeper recipients by through-the-year turnover decline and industry, September quarter 2020
Totals Turnover decline more than 30%
(or 50%)
Turnover decline between 0 – 30%
(or 50%)
Turnover increase
Entities (‘000s)
Disbursements
($m)
Share of entities
(%)
Share of disbursements
(%)
Share of entities
(%)
Share of disbursements
(%)
Share of entities
(%)
Share of disbursements
(%)
Agriculture, Forestry and Fishing
31.0 682.0 45 40 16 19 40 40
Mining 1.5 131.2 49 40 19 35 32 24
Manufacturing 39.9 2,633.4 41 36 22 27 37 37
Electricity, Gas, Water and Waste Services
1.9 97.7 38 32 27 38 35 31
Construction 129.1 3,977.3 45 43 20 22 35 35
Wholesale Trade 24.1 1,629.1 41 27 21 31 38 42
Retail Trade 45.9 2,734.2 40 31 20 30 40 39
Accommodation and Food Services
44.4 2,317.2 47 49 21 20 32 31
Transport, Postal and Warehousing
50.1 1,327.2 61 61 17 19 22 19
Information Media and Telecommunications
9.2 369.5 59 48 15 27 26 25
Financial and Insurance Services
13.0 430.2 40 37 22 28 38 35
Rental, Hiring and Real Estate Services
22.1 962.3 48 40 19 24 33 36
Professional, Scientific and Technical Services
97.3 3,760.6 49 43 19 23 32 35
Administrative and Support Services
25.4 1,365.6 58 60 18 21 24 19
Public Administration and Safety
2.7 151.6 46 41 23 32 31 27
Education and Training
10.9 443.5 54 59 17 17 29 24
Health Care and Social Assistance
50.8 1,652.1 28 21 25 26 47 53
Arts and Recreation Services
16.1 705.0 54 64 18 17 28 20
Other Services 45.6 1,356.0 41 39 25 27 35 35
Note: Large businesses (those with turnover greater than $1 billion) were subject to a 50 per cent decline in turnover test.
Turnover analysis is based on quarterly data compared to a year earlier.
Source: JobKeeper disbursement data as at November 2020 and BAS data as at August 2021.

Appendix 2: Detailed data on JobKeeper recipients by turnover | 63
Table 17: JobKeeper recipients by through-the-year turnover decline by state, September quarter 2020
Totals Turnover decline more than 30%
(or 50%)
Turnover decline between 0 – 30%
(or 50%)
Turnover increase
Entities (‘000s)
Disburs ements
($m)
Share of entities
(%)
Share of disbursements
(%)
Share of entities
(%)
Share of disbursements
(%)
Share of entities
(%)
Share of disbursements
(%)
NSW 221.3 8,683.0 44 40 21 24 36 36
VIC 190.3 8,253.6 57 52 17 23 25 25
QLD 125.8 4,964.9 40 38 22 25 38 37
WA 62.0 2,341.4 36 29 21 26 43 45
SA 39.2 1,563.1 37 30 22 26 41 43
TAS 10.8 458.2 36 33 21 24 42 43
ACT 8.0 324.2 40 38 22 25 38 37
NT 3.7 137.1 36 35 23 25 41 40
Note: Large businesses (those with turnover greater than $1 billion) were subject to a 50 per cent decline in turnover test.
Turnover analysis is based on quarterly data compared to a year earlier.
Source: JobKeeper disbursement data as at November 2020 and BAS data as at August 2021.
Table 18: Employment increases in JobKeeper businesses with through-the-year turnover declines of less than 30 per cent in June quarter 2020, May to September 2020
JobKeeper workers
Non-JobKeeper workers
Total
Businesses with turnover increase 80,000 55,000 135,000
Business with turnover decline between 0 – 30% (or 50%) 125,000 90,000 215,000
Total 205,000 145,000 350,000
Note: These are estimates based on applying percentage changes observed within the STP sample, which focuses on weekly and fortnightly pay cycles, to estimates of the total stock of employees at the start of JobKeeper. For JobKeeper workers, stock is assumed to be the 3.1 million average employees covered by the payment over the first phase of the program, scaled down to reflect the lower sample used for the turnover analysis ($47 billion of the $70 billion paid). For non-JobKeeper workers we apply a ratio of 6 non-JobKeeper workers for every JobKeeper worker, based on data for March and evidence in the 3-month JobKeeper review. Large businesses (those with turnover greater than $1 billion) were subject to a 50 per cent decline in turnover test. Increase from employment trough in early May to September.


