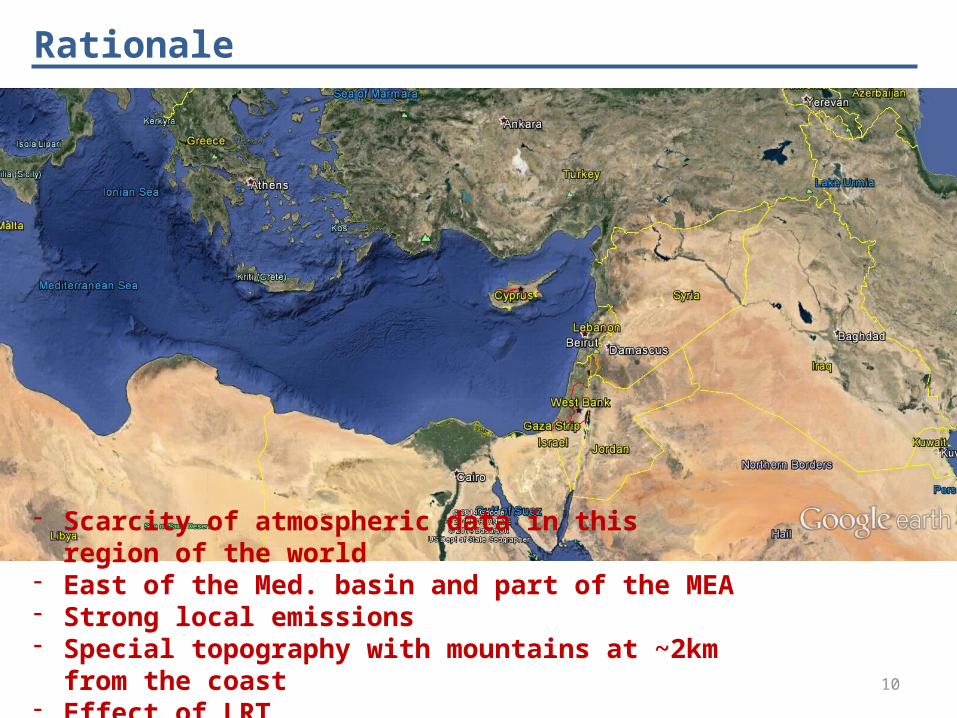
- Scarcity of atmospheric data in this region of the world- East of the Med. basin and part of the MEA- Strong local emissions- Special topography with mountains at ~2km from the coast- Effect of LRT- Strong insulation
11
Rationale
- East of the Med. basin and part of the MEA- Strong local emissions- Special topography with mountains at ~2km from the coast- Effect of LRT- Insulation- Scarcity of atmospheric data in this region of the world
Emission and Chemistry of Organic Carbon in the East Mediterranean
ECOCEM – Beirut
12
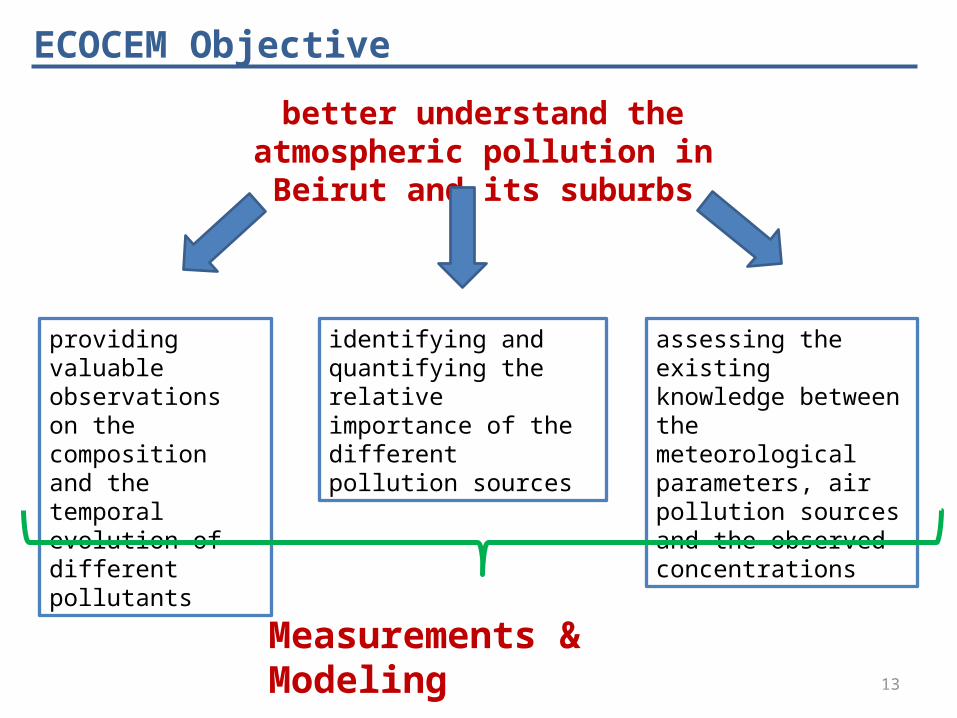
better understand the atmospheric pollution in Beirut and its suburbs
ECOCEM Objective
providing valuable observations on the composition and the temporal evolution of different pollutants
identifying and quantifying the relative importance of the different pollution sources
assessing the existing knowledge between the meteorological parameters, air pollution sources and the observed concentrations
13
better understand the atmospheric pollution in Beirut and its suburbs
ECOCEM Objective
providing valuable observations on the composition and the temporal evolution of different pollutants
identifying and quantifying the relative importance of the different pollution sources
assessing the existing knowledge between the meteorological parameters, air pollution sources and the observed concentrations
Measurements & Modeling
14
Methodology
Field campaigns in summer and winter
Gridded Emissions inventory with a temporal
variation
Measurements & Modeling
15
Summer campaign : 1 – 17 July 2011Winter campaign : 28 January – 13 February 2012
Site : Mar Roukoz (USJ campus), Faculty of sciences
Field campaigns
Beyrouth
16
Measured parameters
NO/NO2/NOxOzoneCOSome aldehydes and ketonesMore than 60 VOC (GCFID, PTRMS and active tubes)
Wind speed/Wind directionTemperaturePressureRelative humidityNO2 photolysis frequency
17
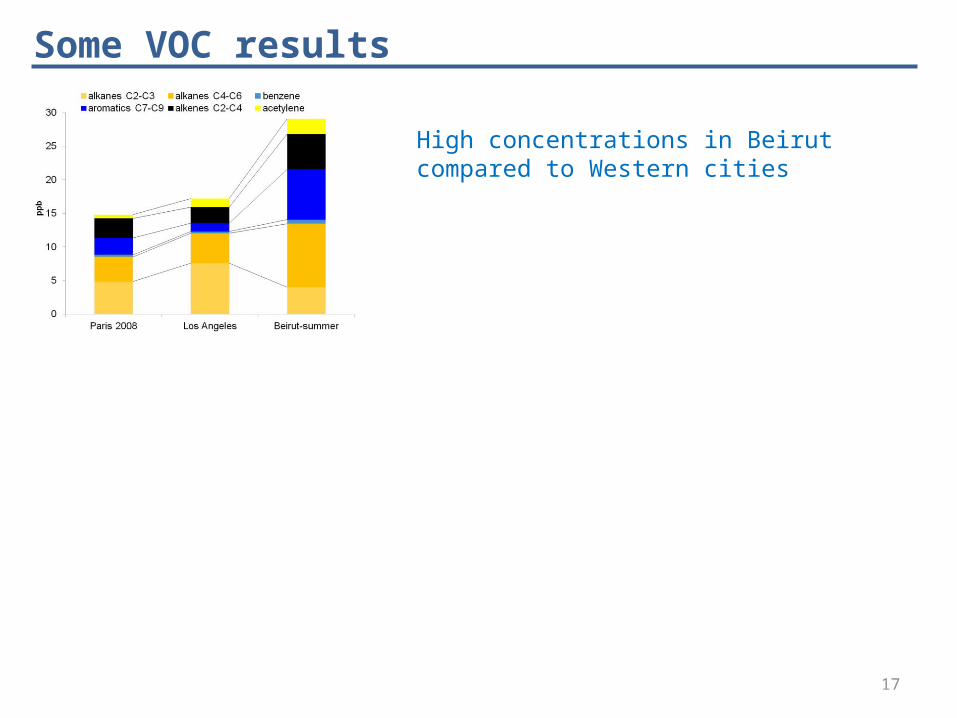
Some VOC results
High concentrations in Beirut compared to Western cities
18
Some VOC results
High concentrations in Beirut compared to Western cities
Summer
Winter
0 1 2 3 4 5 6 7 8 9 10
11
12
13
14
15
16
17
18
19
20
21
22
23
0
5
10
15
20
25
Co
nce
ntr
atio
n (
µg
/m3)
Heures locales
toluene isopentane
0 1 2 3 4 5 6 7 8 9 10
11
12
13
14
15
16
17
18
19
20
21
22
23
0
5
10
15
20
25
Co
nce
ntr
atio
n (
µg
/m3)
Heures locales
toluene isopentane
• Most NMHCs: summer maximum and a winter minimum
• NMHC distribution mainly driven by strong local emissions and local atmospheric dynamics, without a clear evidence of photochemical removal in summer or an influence from long range transport.
Salameh et al., Env. Chem. under revision
19
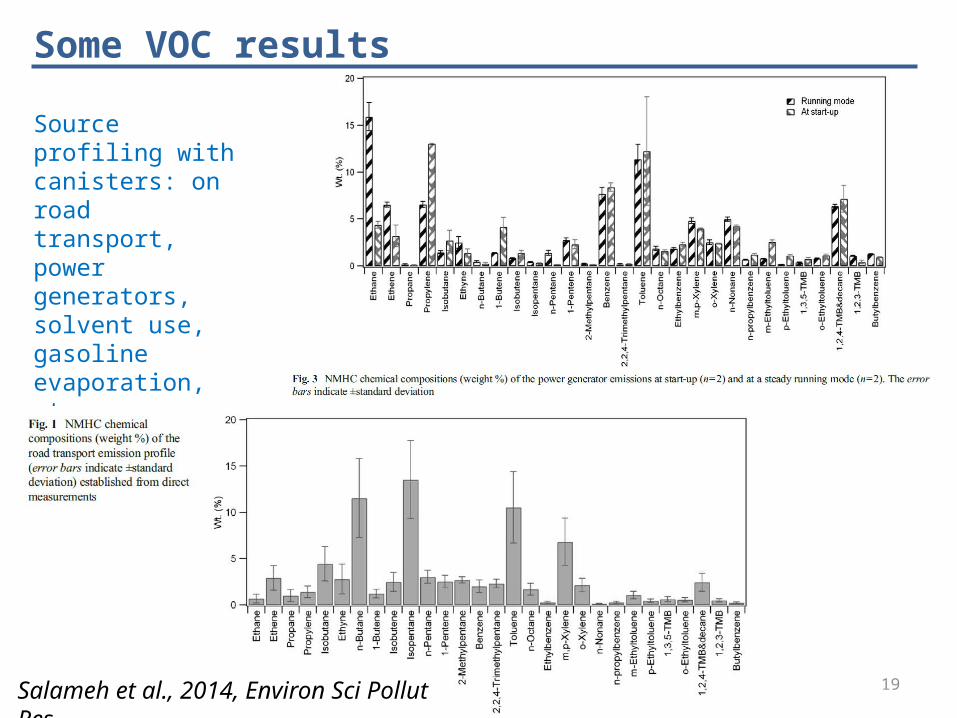
Some VOC results
Source profiling with canisters: on road transport, power generators, solvent use, gasoline evaporation, etc.
Salameh et al., 2014, Environ Sci Pollut Res
20
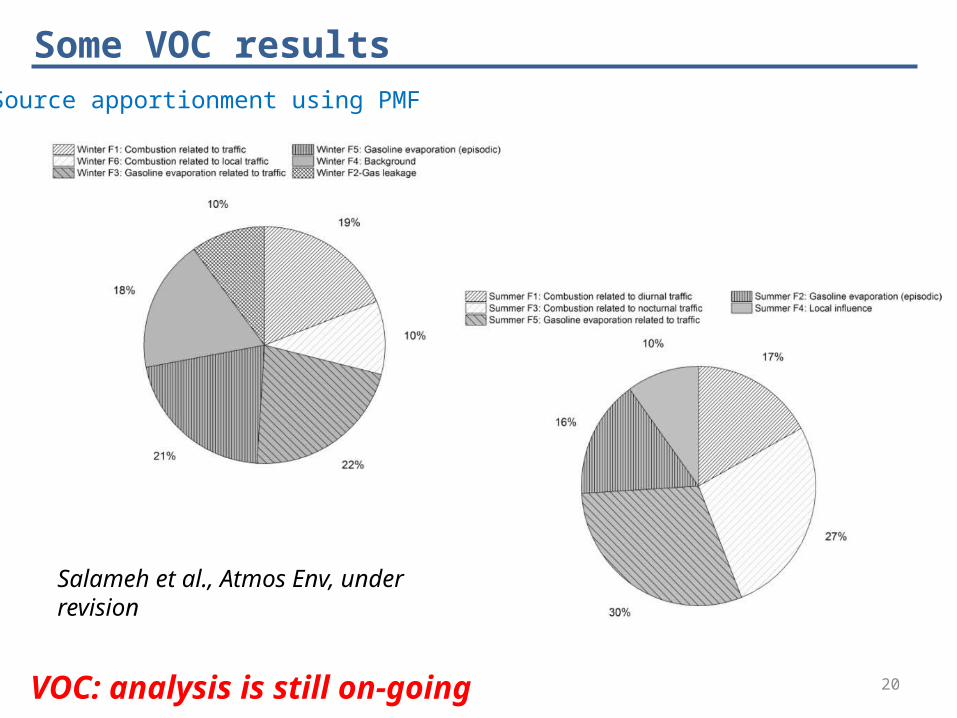
Some VOC results
Salameh et al., Atmos Env, under revision
Source apportionment using PMF
VOC: analysis is still on-going
21
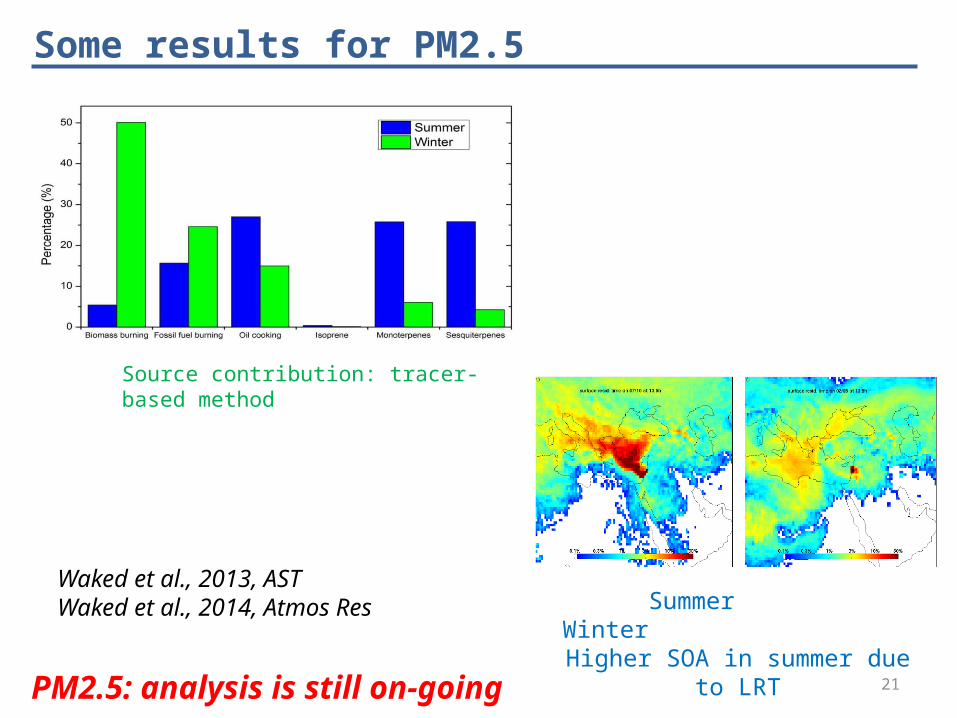
Some results for PM2.5
Source contribution: tracer-based method
Summer WinterHigher SOA in summer due to LRT
PM2.5: analysis is still on-going
Waked et al., 2013, ASTWaked et al., 2014, Atmos Res
22
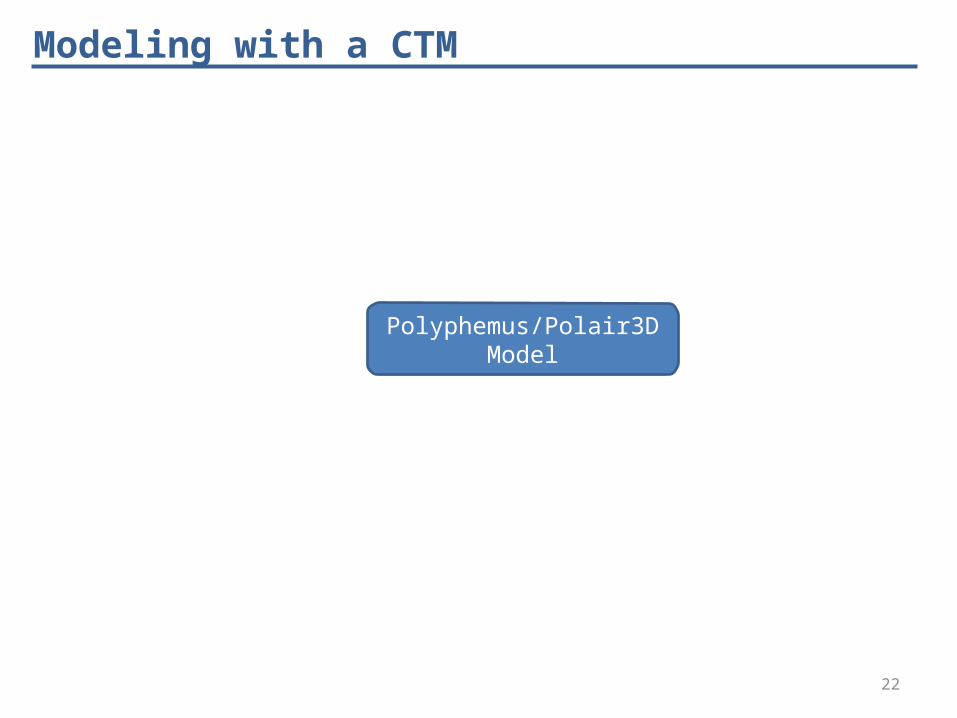
Modeling with a CTM
Polyphemus/Polair3D Model
23
Modeling with a CTM
Polyphemus/Polair3D ModelEmissions inventory for Lebanon
24
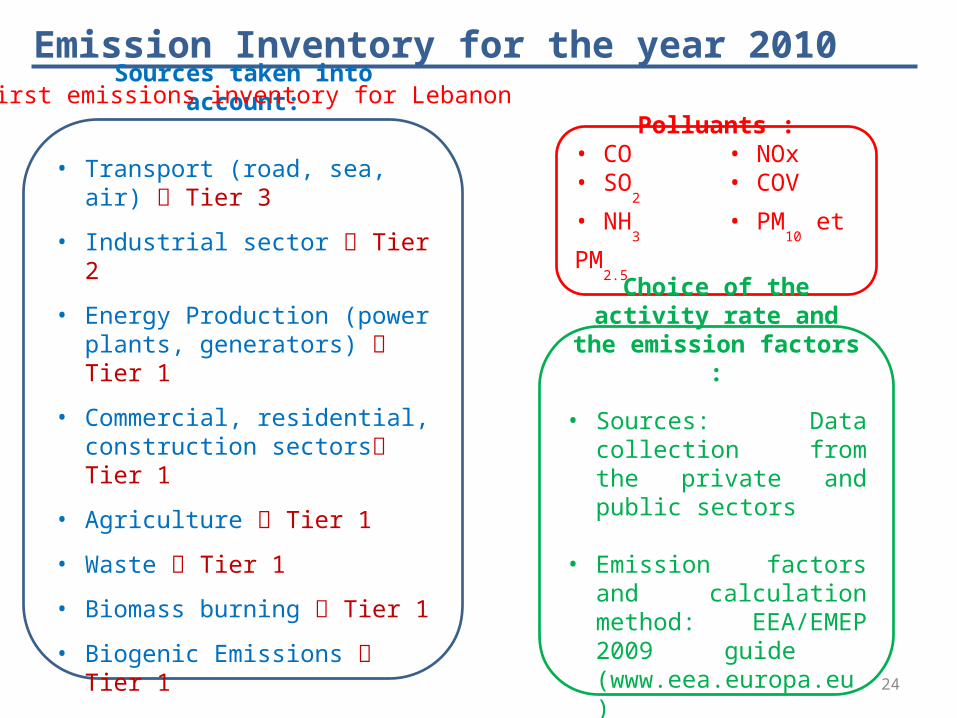
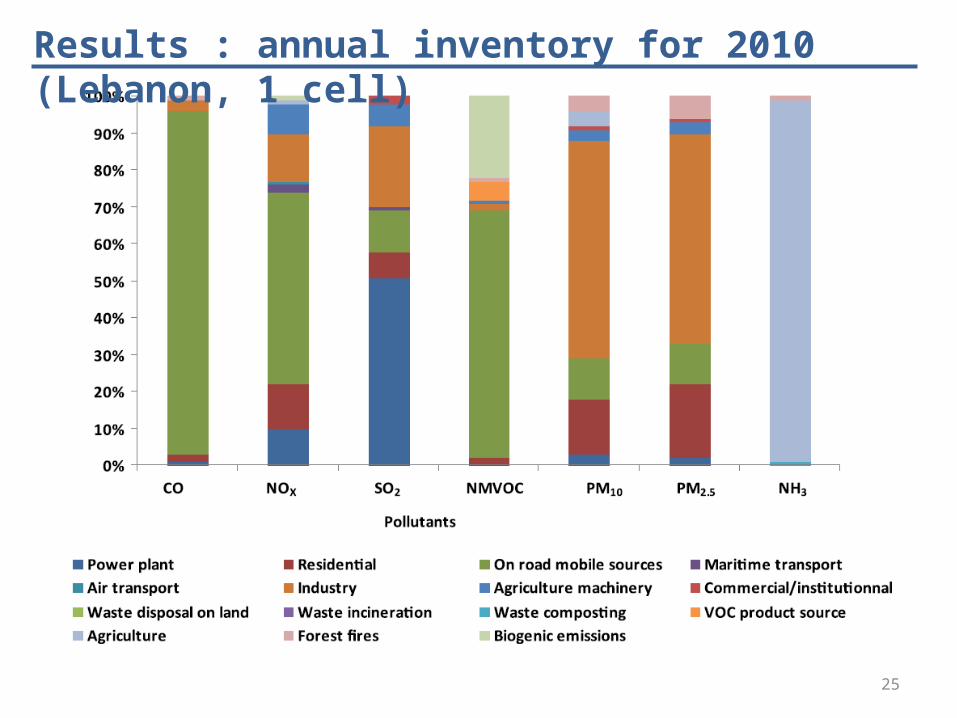
Sources taken into account:
• Transport (road, sea, air) Tier 3
• Industrial sector Tier 2
• Energy Production (power plants, generators) Tier 1
• Commercial, residential, construction sectors Tier 1
• Agriculture Tier 1
• Waste Tier 1
• Biomass burning Tier 1
• Biogenic Emissions Tier 1
Polluants :• CO • NOx• SO
2 • COV
• NH3
• PM10
et PM2.5
Choice of the activity rate and the emission factors :
• Sources: Data collection from the private and public sectors
• Emission factors and calculation method: EEA/EMEP 2009 guide (www.eea.europa.eu)
Emission Inventory for the year 2010First emissions inventory for Lebanon
25
Results : annual inventory for 2010 (Lebanon, 1 cell)
26
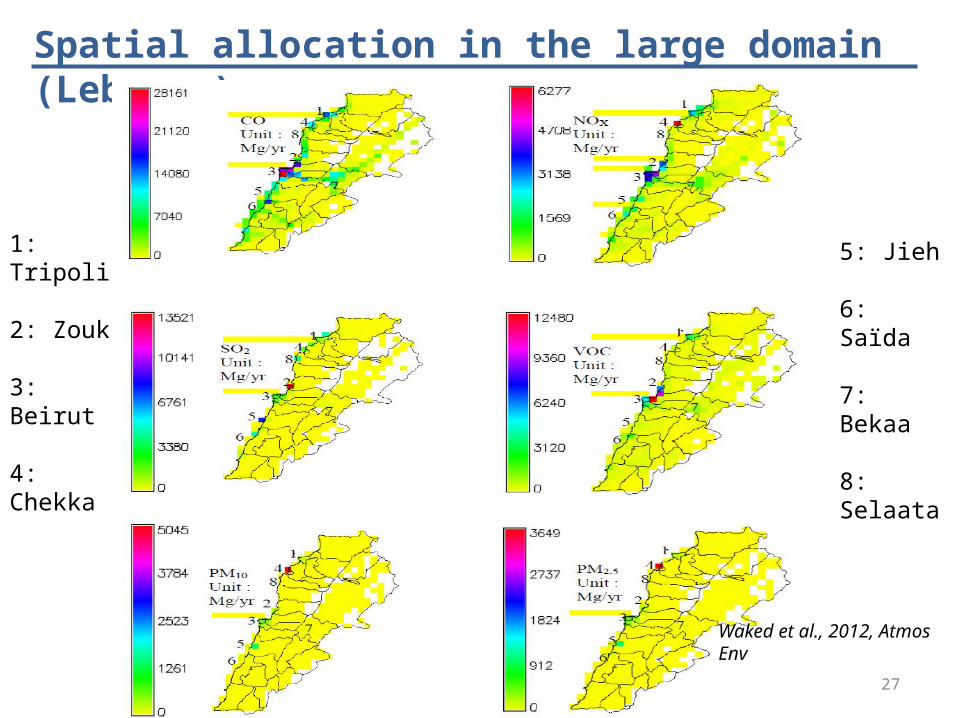
• After the calculation of the annual emissions allocation in space and time
• 2 domains :Lebanon : cells of 5km x 5kmBeirut and suburbs : cells of 1km x 1km
• Stationary Sources (Power plants,…) : localisation of each source by longitude and latitude
• Mobile Sources : road traffic (number of vehicles by segment)
Spatial and temporal resolution
1 km x 1 km
5 km x 5 km
30 km
40km
27
1: Tripoli
2: Zouk
3: Beirut
4: Chekka
5: Jieh
6: Saïda
7: Bekaa
8: Selaata
Spatial allocation in the large domain (Lebanon)
Waked et al., 2012, Atmos Env
28
1: Beirut
2: Zouk
Spatial allocation in the inner domain (Beirut and sub.)
Waked et al., 2012, Atmos Env
29
Extension of the assess. of emissions from transport in MEA
Waked and Afif, 2012, Atmos Env
30
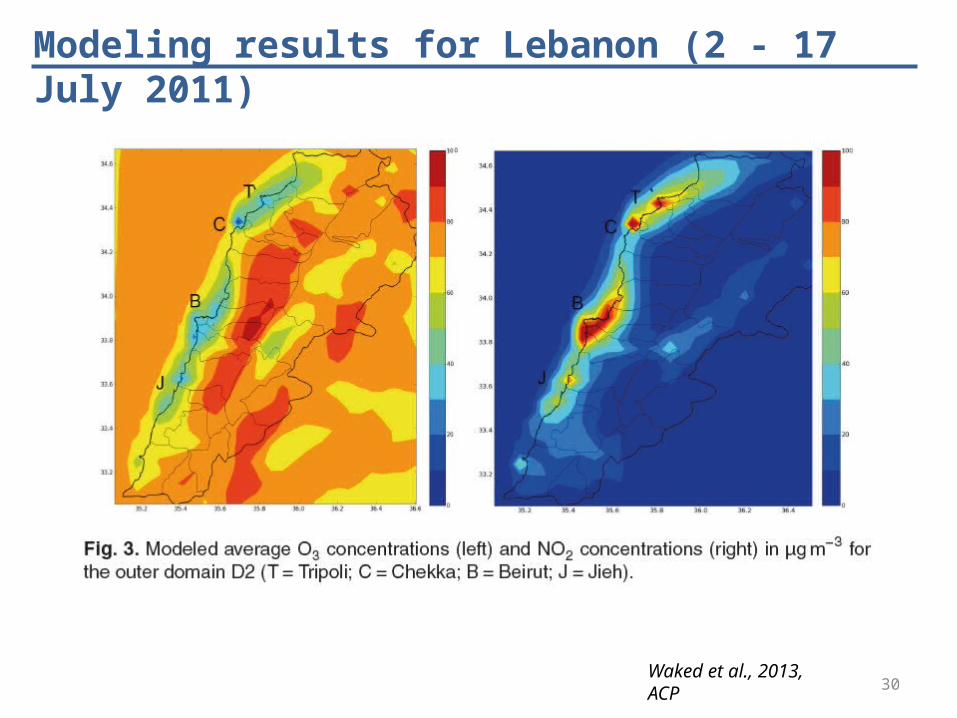
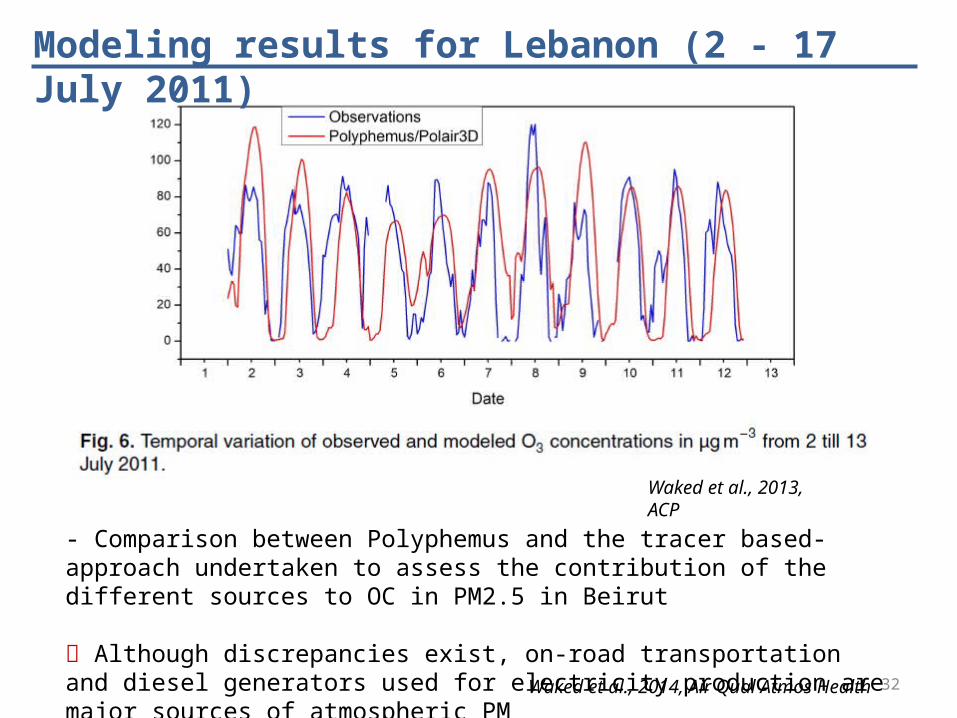
Modeling results for Lebanon (2 - 17 July 2011)
Waked et al., 2013, ACP
31
Modeling results for Lebanon (2 - 17 July 2011)
Waked et al., 2013, ACP
32
Modeling results for Lebanon (2 - 17 July 2011)
Waked et al., 2013, ACP
- Comparison between Polyphemus and the tracer based-approach undertaken to assess the contribution of the different sources to OC in PM2.5 in Beirut
Although discrepancies exist, on-road transportation and diesel generators used for electricity production are major sources of atmospheric PM
Waked et al., 2014, Air Qual Atmos Health
33
Conclusion• New Dataset of pollutants available for Lebanon with an emission inventory,
measurements, etc.
• Work is still on-going to analyze data
• New actions have/are taking place, ex. Tunnel experiment in July 2014
The new actions are part of the TRANSEMED initiative Agnès Borbon Friday morning!