32
INSPIRING IMAGINATION FOR MATERIAL SCIENCE

INSPIRING IMAGINATION FOR MATERIAL SCIENCE
Energy related applications of calorimetry
Rémi ANDRE – SETARAM Instrumentation
ECN / ExperTA Technology day
Petten, The Netherlands, Thursday, February 5th

Definition of DSC
� Differential Scanning
Calorimetry (DSC) :
� A technique in which the heat
flux (thermal power) to (or
from) a sample is measured
versus time or temperature
while the temperature of the
sample is programmed, in a
controlled atmosphere.
� The difference of heat flux
between a crucible containing
the sample and a reference
crucible (empty or not) is
measured
International
Confederation for Thermal
Analysis and Calorimetry
www.ictac.org
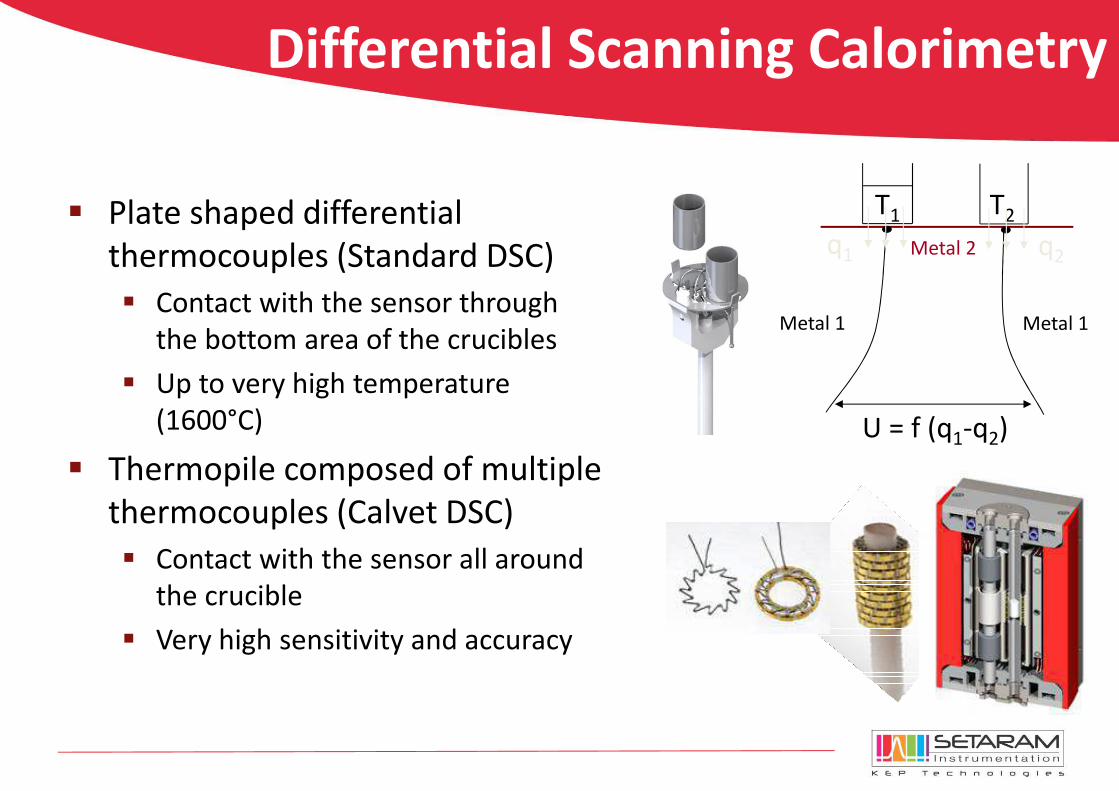
Differential Scanning Calorimetry
� Plate shaped differential
thermocouples (Standard DSC)
� Contact with the sensor through
the bottom area of the crucibles
� Up to very high temperature
(1600°C)
� Thermopile composed of multiple
thermocouples (Calvet DSC)
� Contact with the sensor all around
the crucible
� Very high sensitivity and accuracy
Metal 2
Metal 1Metal 1
U = f (q1-q2)
T1 T2
q1 q2
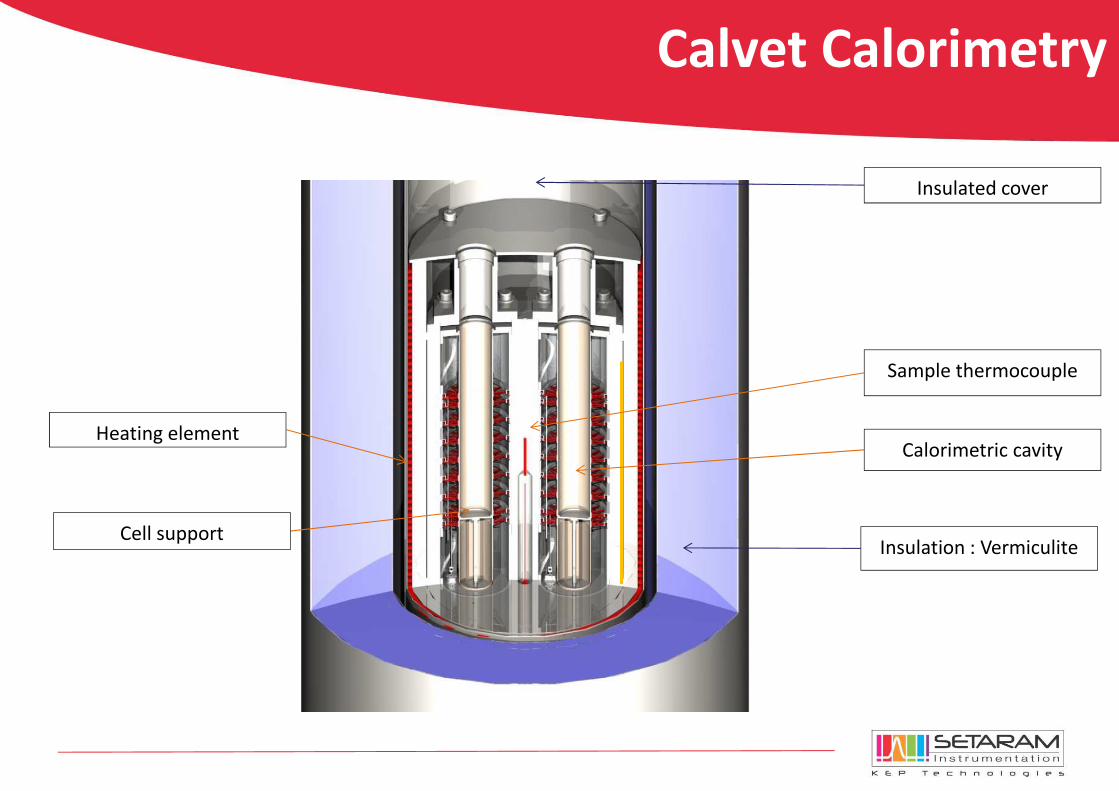
C80
Calorimetric cavity
Insulation : Vermiculite
Sample thermocouple
Heating element
Cell support
Insulated cover
Calvet Calorimetry

Sample vessels
Peltier
Elements
Reference
vessels
Microcalorimetry
� Peltier elements (networks of semiconductors)
� µDSC Peltier elements are used both ways
� To heat up or cool down the calorimetric block
� To collect heat from the sides of the cells

7
� Large number of cells available means a wide range of applications
�Standard cells : transitions, isothermal stability, Cp
of solid or powders,…
• Fields of application : chemical compatibility, stability of
hazardous materials, phase diagrams,…
�Mixing cells : heats of mixing, of wetting
(immersion), of dissolution, of adsorption,…
• Fields of application : cement setting, chemical reactions,
polymerizations, surface properties (adsorption, wetting),…
Cells

8
High Pressure cells
� Stainless Steel
� Temperature range : -40°C / 120°C
� Max pressure : 400 or 1000 bars
� 1 gas input
� Used under isothermal or scanning mode
� Max available volume : 0.33mL or 0.19mL
� Connection to gas panels
Injection from HP gas panel
Solid or liquid sample
Solid or liquid sample
Injection from HP gas panel

Batteries
� Self discharge of batteries
� Temperature : 30°C
� Sample : AA type lithium battery
� Reference : equivalent mass of
alumina
� Insertion of sample and reference
cell at t = 0
� After 5 hours, the cells are
swapped, leading to a new
equilibrium
� Self discharge power is equal to
half of the difference in terms of
equilibrium levels, i.e. 228.2 / 2 =
114.1µW
Time (h)87.576.565.554.543.53
Hea
tFlo
w (m
W)
0.15
0.1
0.05
0
-0.05
-0.1
-0.15
-0.2
Exo
t : 4.1 and 7.1 (h) ∆ : 228.2 (µW)
cells swapped
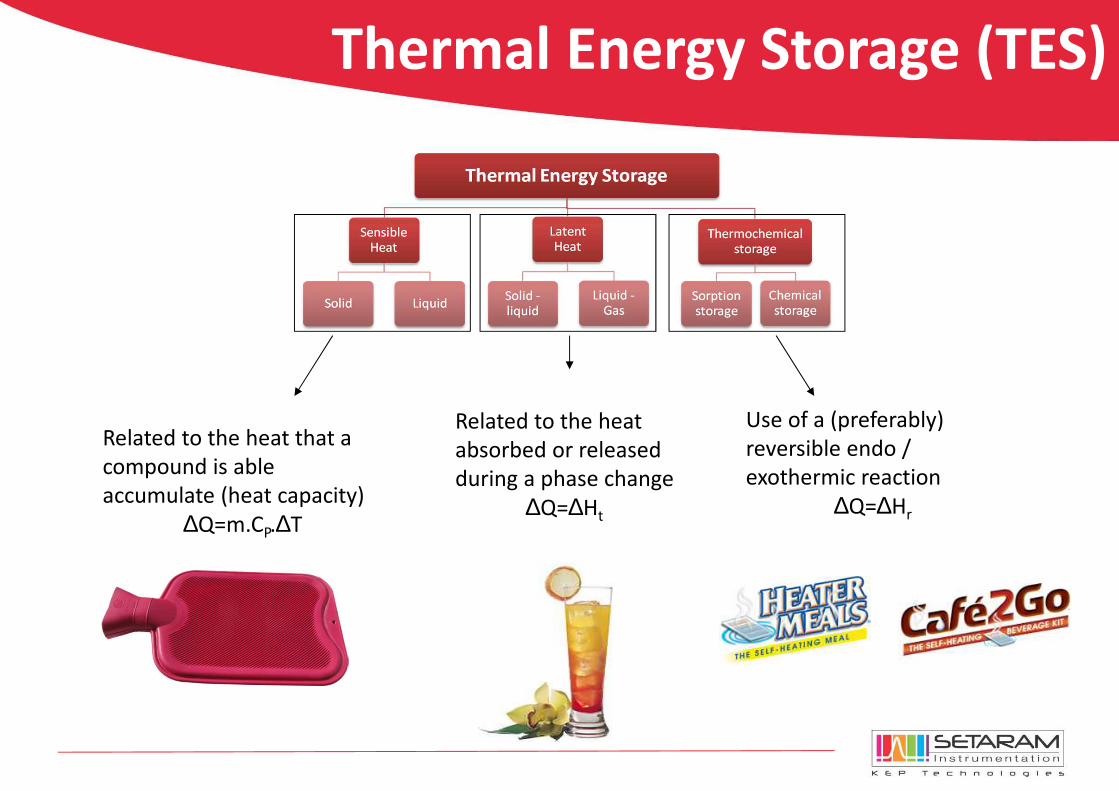
Thermal Energy Storage (TES)
Related to the heat that a
compound is able
accumulate (heat capacity)
∆Q=m.CP.∆T
Related to the heat
absorbed or released
during a phase change
∆Q=∆Ht
Use of a (preferably)
reversible endo /
exothermic reaction
∆Q=∆Hr
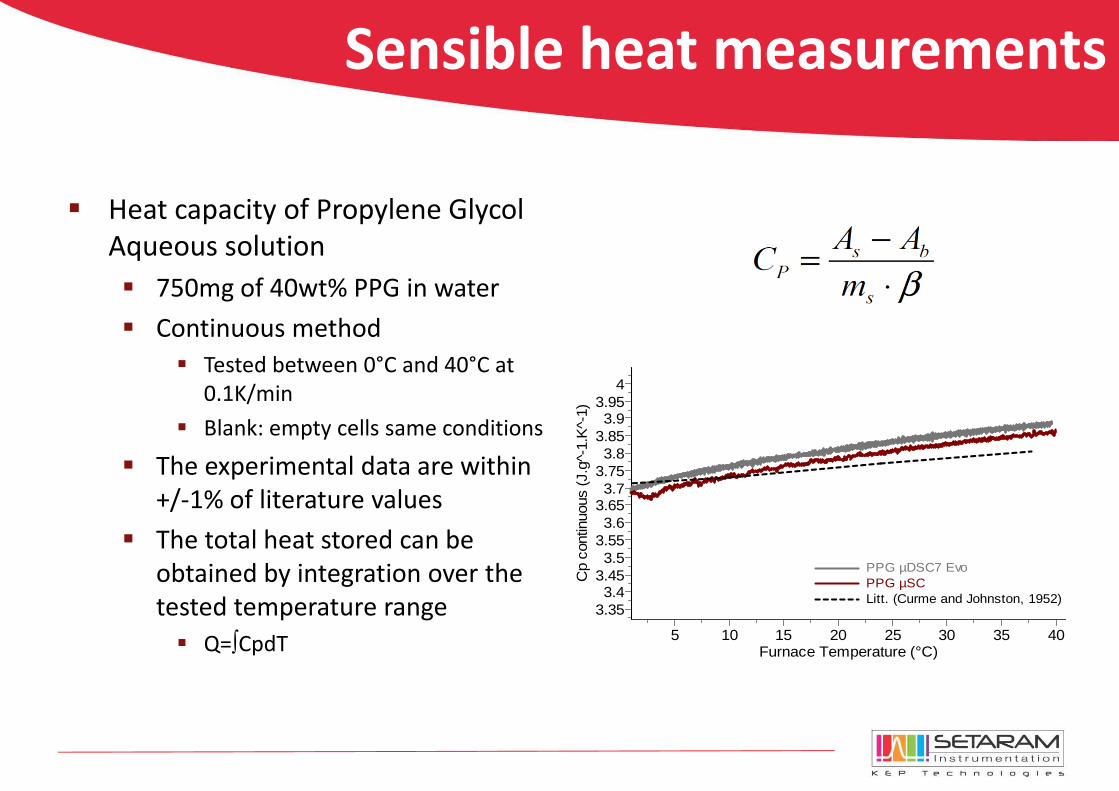
Sensible heat measurements
� Heat capacity of Propylene Glycol
Aqueous solution
� 750mg of 40wt% PPG in water
� Continuous method
� Tested between 0°C and 40°C at
0.1K/min
� Blank: empty cells same conditions
� The experimental data are within
+/-1% of literature values
� The total heat stored can be
obtained by integration over the
tested temperature range
� Q=∫CpdT Furnace Temperature (°C)403530252015105
Cp
cont
inuo
us (
J.g^
-1.K
^-1)
43.953.9
3.853.8
3.753.7
3.653.6
3.553.5
3.453.4
3.35
PPG µDSC7 EvoPPG µSCLitt. (Curme and Johnston, 1952)

Latent heat measurements
� Commercially available PCM
� Blend of paraffins, specifications:
mp = 27°C, ΔH = 184 J.g-1
� 50 mg samples fresh and aged
� Test conditions
� Heating from -5°C to 35°C at
0.05°C.min-1
� After accelerated ageing (100
heating / cooling cycles at 5°C/min):
� The storage capacity is not affected, the
latent heat of melting still being 158 J.g-1
� The shift of melting temperature is
significant (0.7°C)
Furnace Temperature (°C)302520151050
Hea
tFlo
w (f
resh
sam
ple)
(mW
)
0
-1
-2
-3
-4
-5
Hea
tFlo
w (a
ged
sam
ple)
(mW
)
0-0.5-1-1.5-2-2.5-3-3.5-4-4.5
HeatFlow (fresh sample)HeatFlow (aged sample)
Exo
Heat : 22.0 (J/g) Onset : 2.0 (°C)
Heat : 158.0 (J/g) Onset : 27.1 (°C)
Exo
Heat : 21.7 (J/g) Onset : 1.7 (°C)
Heat : 158.0 (J/g) Onset : 26.4 (°C)

Oil&Gas - Flow assurance
� Flow assurance
� Refers to the control of hydrocarbon flow from the
reservoir to the delivery point
� Topics
� Wax, asphaltene crystallization, gas hydrates
formation
� 51 serious problems linked with wax deposition
in the Gulf of Mexico between 1992 and 2002
� The cost for repair can reach à $1 million/mile in
subsea pipelines (400m)
� Revenue losses can reach $3 million/day for
deep wells
Wax Buildup in Production Piping

Flow Assurance - Waxes
� Technique: DSC
� Experiment� Crude oil samples (40mg) in aluminum
crucibles
� Temperature profile
� Heating from 25°C up to 80°C at 5°C/min
� Cooling down to 10°C at 2°C/min
� Results
� Exothermic crystallization of the waxes
contained in the oili. Onset temperature = WAT
ii. The amount of waxes precipitated vs.
Temperature data can be obtained by partial
integration and estimation of the heat of
crystallization of « pure » paraffin
Sample Temperature (°C)70605040302010
% P
reci
pita
ted
wax
es (
J/g)
12
10
8
6
4
2
0
Crude Oil 1Crude Oil 3
Sample Temperature (°C)70605040302010
Hea
tFlo
w (
mW
)
Heat : -23.2 (J/g) WAT : 54.2 (°C)
Heat : -7.7 (J/g) WAT : 35.4 (°C)
0.5
Cooling
(i)
(ii)

Flow Assurance - Waxes
Lenise C. Vieira, Maria B. Buchuid, Elizabete F. Lucas, Effect of Pressure on the Crystallization of Crude Oil Waxes. II. Evaluation
of Crude Oils and Condensate, Energy & Fuels (2009)
WAT vs nitrogen pressure
WAT vs methane pressure
� Technique: µDSC + HP
� Experiment� Crude oil samples (100mg) in HP cells with
high (A) and low (C) wax content
� At a given N2 or CH4 pressure:
� heating to 80°C and isotherm of 180
minutes at this temperature,
� cooling at 1°C/min until reaching a
temperature of -10°C
� Results
� Nitrogen: WAT increases with P
� Methane: WAT decreases with P
� CH4, unlike N2, plays a role in
improving the solubilization of waxes.

Hydrogen Storage
� Fuel cell applications :� Stationary
� Safety power (hospital, networks, defense…)
� Electricity for isolated sites
� Power for industrial processes
� Portable� Laptop
� Mobile phones
� Digital equipments
� Portable electrical tools
� Automotive � Transportation
� Defense
� Bike, scooter, boat
� Car
DaimlerChrysler
Angstrom
Axane

Volumetry / Manometry
� Gas is injected in a reservoir
� Of known volume
� At a controlled Temperature
� At a set pressure
� Quantity of gas in the reservoir is
known from these three
parameters and its equation of
state (EOS)
� Sample is contained in a reservoir
� At a set temperature
� Whose free volume is determined
Vent
Test gas
Vacuum
ExpansionReservoir
Sam
ple
Reservo
ir
Pressure measurement
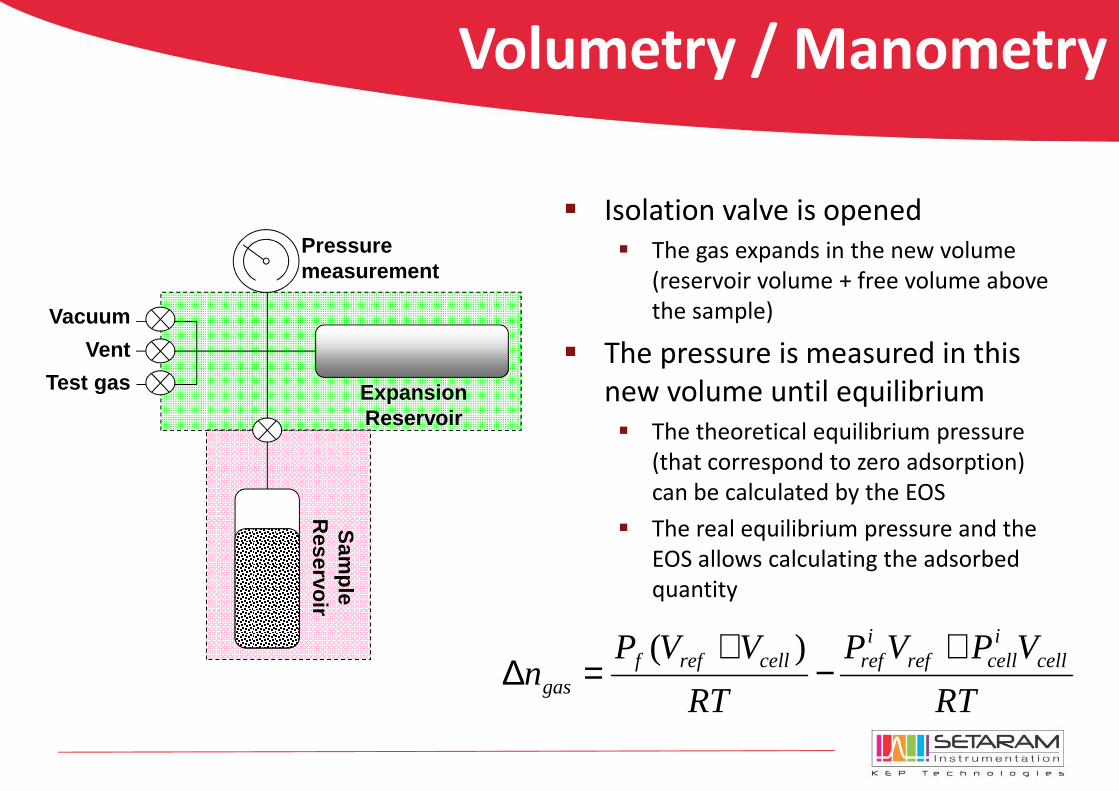
Volumetry / Manometry
� Isolation valve is opened
� The gas expands in the new volume
(reservoir volume + free volume above
the sample)
� The pressure is measured in this
new volume until equilibrium
� The theoretical equilibrium pressure
(that correspond to zero adsorption)
can be calculated by the EOS
� The real equilibrium pressure and the
EOS allows calculating the adsorbed
quantity
Vent
Test gas
Vacuum
ExpansionReservoir
Sam
ple
Reservo
ir
Pressure measurement
RT
VPVP
RT
VVPn cell
icellref
irefcellreff
gas
+−
+=∆
)(

PCTPro-E&E Features
� Instrument flexibility� Wide temperature and pressure ranges
� Vacuum to 200 bar
� -269°C to 500°C
� External sample holder� Wide range of sample sizes
� Easy airless sample handling
� Fully automated computer control
� 5 calibrated volumes (5 to 1,200ml)� Experiment can be optimized for sample and
type of measurement
� Multiple pressure aliquot settings

Hydrogen - Kinetics
� Destabilization of the Mg/MgH2
system by transition metals, their
oxides, and carbon
� Sample (0.5g) directly activated in
the HP cell of a Sensys at 350 °C
by hydrogen cycles between 15
bar and 1 bar
� Very good kinetic behaviors:
� 1.5 min/1.7 min to absorb / desorb 6
wt % H2
C. Milanese et al, International Journal of Hydrogen Energy 35 (2010) 9027-9037
Mg 94wt% - C 1wt% - Nb2O5 5wt%
milled during 1h

Hydrogen - Thermodynamics
*Lynch J. F., J. Chem. Soc., Faraday Trans. 1, (1974) 70 814-824
� PCT Mode� Palladium 880mg at 170°C
� Injections of H2 1 bar in a
volume of 5.78mL
� Heat release per dose increases
during the alpha -> beta
transition of Pd
� The average differential heat of
adsorption in the alpha phase is
found equal to 23.2kJ/molH2
(litt*: 23.32 kJ/molH2–1)

Hydrogen - Thermodynamics
� Hydrogen adsorption on MOF-
5 (BASF Basolite Z100H)� 180mg Sample
� Degasing at 130°C, 3 hours, 10-2mbar
� Isotherm at -186°C (BT2.15)
� Sorption isotherm and differential
heat of adsorption are measured
� The integral heat of adsoprtion (-
4.19kJ/mol) can be compared to the
value detemrined by B. Schmitz et al*:
-4.0kJ/mol
Pressure (bar) (h)
35302520151050
H2
wt%
|c
(-)
3.5
3
2.5
2
1.5
1
0.5
Dif
f. H
ea
t (k
J/m
ol)
(-)
-1
-2
-3
-4
B. Schmitz et al, ChemPhysChem, Volume 9, Issue 15, pages 2181–2184 (2008)

Biomass
� Biodiesel production from vegetable oil
� Biodiesels are synthesized from a transesterification reaction of triglycerides by low molecular weight alcohols leading to the formation of fatty acid alkyl esters.
� This reaction requires the use of a catalyst:� liquid (KOH, NaOH, H2SO4…)
� solid catalyst (zinc aluminates, zeolites, silica mesostructured materials or immobilized enzymes)
Transesterification:

� Conditions� Apparatus: C80
� cells: batch mixing with membrane
� Sample masses:
� Temperature: 30°C, 40°C and 50°C
� Stirring: 20 min
Biomass
Sample Mass (mg)
Colza oil 1300
NaOH in EtOH 450

Biomass
Time (h)302520151050
Hea
tFlo
w (
mW
)
Con
vers
ion
(%)
100
80
60
40
20
0
Colza Oil + NaOH / EtOH 50°CColza Oil + NaOH / EtOH 40°CColza Oil + NaOH / EtOH 30°C
0.5
Reaction
Temp (°C)
Enthalpy
(J/g EtONa)
Time to 98%
conversion (h)
Max heat release
(mW/g)
30 -10.3 20.0 0.69
40 -10.9 11.7 0.89
50 -11.5 10.8 1.37

CO2 Capture and sequestration
� Mainly on Power generation unit,
but also in industries
� Technologies
� Solvent scrubbing (amine solution)
� Post- or Pre-combustion capture
� Cryogenic separation
� Energy cost is high due to refrigeration needed
� Membranes
� Separation of CO2 from gas flow through
porous membranes
� Adsorption
� Activated carbon, zeolites
� MOFs, carbonates

CO2 Capture and sequestration
� High pressure continuous flow
mixing cell
� Fluids (CO2 and amine solution)
introduced at the upper part
� Preheating of the fluids before
entering the calorimetric zone
� Mixing at the bottom part of the
cell
� Resulting mixture extracted from
the cell through the oulet tube.
� Reaction heat is exchanged with
the thermopile through the rolled
tube
Outlet A+B
Preheater
Fluid A
Fluid B
Mixing
device
Thermopile
surrounding
the cell
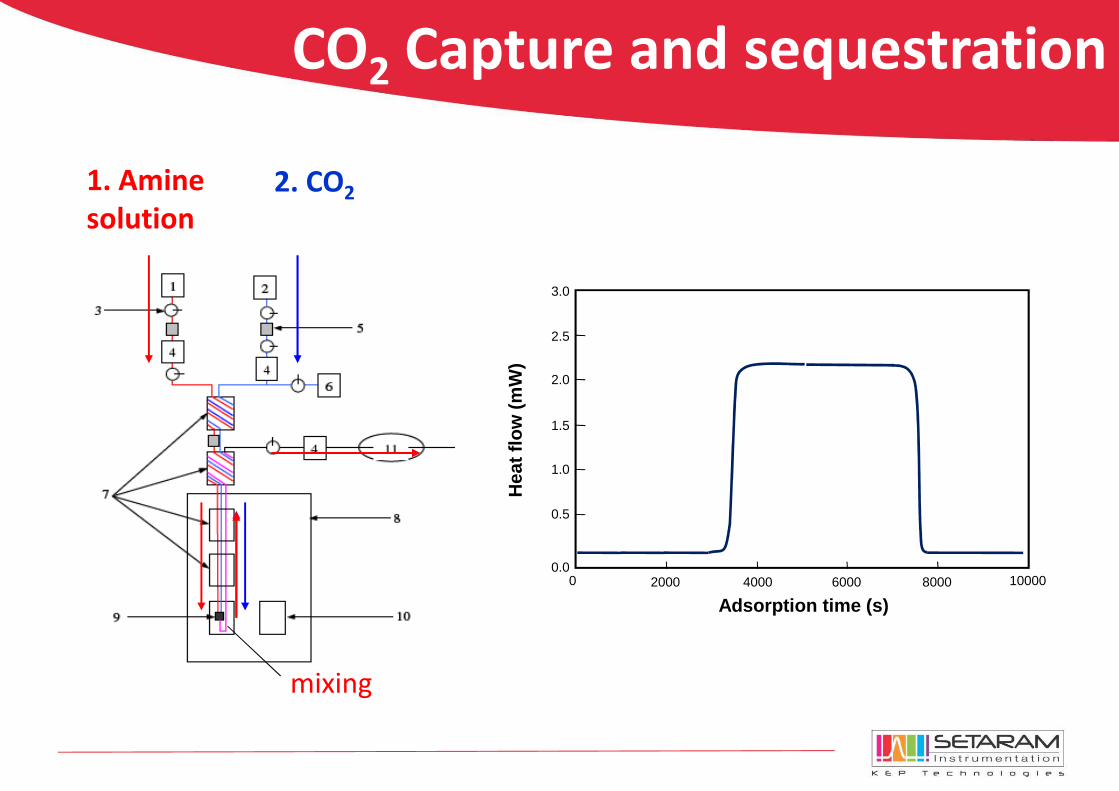
CO2 Capture and sequestration
2000 4000 6000 8000 100000
0.5
0.0
1.0
1.5
2.0
2.5
3.0
Hea
t fl
ow
(mW
)
Adsorption time (s)
1. Amine
solution
2. CO2
mixing

CO2 Capture and sequestration
� Solubility limit in water + NaCl
� ΔHmix (kJ.mol−1 salt
free solution)
� mNaCl = 1
� T = 323.1 K
� p = 5 MPa
Solubility limit
No additional CO2 dissolved; Total
mixing enthalpy unchangedTotal mixing enthalpy increases
D. Koschel et al. Fluid Phase Equilibria 247 (2006) 107
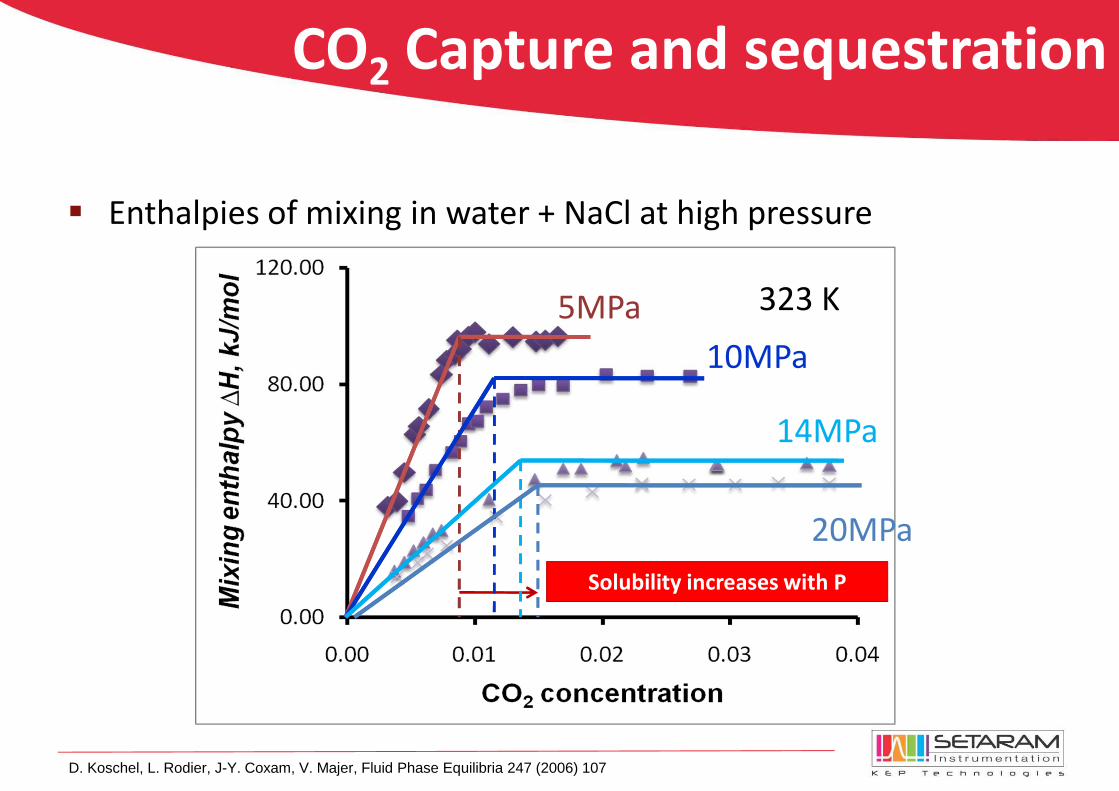
CO2 Capture and sequestration
� Enthalpies of mixing in water + NaCl at high pressure
D. Koschel, L. Rodier, J-Y. Coxam, V. Majer, Fluid Phase Equilibria 247 (2006) 107
5MPa
10MPa
323 K
Solubility increases with P
14MPa
20MPa

Thanks for your attention!

Energy related applications of calorimetry
Rémi ANDRE – SETARAM Instrumentation
ECN / ExperTA Technology day
Petten, The Netherlands, Thursday, February 5th


