C.D. Howe Institute Institut C.D. Howe Communiqué Embargo: For release Tuesday, September 12, 2000, at 10:00 a.m. Rapid money growth threatens higher inflation, warns C.D. Howe Institute study The Bank of Canada may need to raise interest rates further to prevent rising inflation, says a C.D. Howe Institute Commentary released today. The study points out that the M1 measure of Canada’s money stock grew an explosive 24 percent over the past year. In the past, M1 — which measures cash and chequing accounts, forms of money closely associated with spending — has been a reliable indicator of ups and downs in the economy and in inflation. If the Bank of Canada does not take measures to slow money growth, inflation will likely move above the top of the Bank’s 1–to–3 percent target range. The study, “Stop the Press! Rapid Money Growth May Bring Higher Inflation,” was written by William B.P. Robson, Director of Research at the C.D. Howe Institute, and Shay Aba, Research Analyst at the Institute. They argue that M1 deserves attention because it plays an important role in the chain that connects the Bank of Canada’s interest-rate policy to economic growth and inflation. When money is abundant, households and businesses gain confidence and raise their spending. When, as at present, the economy is operating close to capacity, this extra spending is likely to push up inflation. The authors acknowledge that developments in the banking industry may be exagger- ating M1 growth. They also note that rapid money growth does not imply higher inflation if the economy’s demand for money is growing at the same pace. Although the economy has been growing robustly without inflationary pressure, Robson and Aba find that — after ad- justing measured M1 for several financial sector innovations and making generous allow- ances for influences that might be increasing demand for it — recent growth has pushed the stock of M1 too high for comfort. They conclude, therefore, that the Bank of Canada should rein in M1 growth to avoid an inflationary blowoff. * * * * * The C.D. Howe Institute is Canada’s leading independent, nonpartisan, nonprofit economic policy research institution. Its individual and corporate members are drawn from business, labor, agriculture, universities, and the professions. — 30 —
Transcript
C.D. Howe InstituteInstitut C.D. Howe Communiqué
Embargo: For release Tuesday, September 12, 2000, at 10:00 a.m.
Rapid money growththreatens higher inflation,
warns C.D. Howe Institute studyThe Bank of Canada may need to raise interest rates further to prevent rising inflation, saysa C.D. Howe Institute Commentary released today. The study points out that the M1 measureof Canada’s money stock grew an explosive 24 percent over the past year. In the past, M1 —which measures cash and chequing accounts, forms of money closely associated withspending — has been a reliable indicator of ups and downs in the economy and in inflation.If the Bank of Canada does not take measures to slow money growth, inflation will likelymove above the top of the Bank’s 1–to–3 percent target range.
The study, “Stop the Press! Rapid Money Growth May Bring Higher Inflation,” waswritten by William B.P. Robson, Director of Research at the C.D. Howe Institute, and ShayAba, Research Analyst at the Institute. They argue that M1 deserves attention because itplays an important role in the chain that connects the Bank of Canada’s interest-rate policyto economic growth and inflation. When money is abundant, households and businessesgain confidence and raise their spending. When, as at present, the economy is operatingclose to capacity, this extra spending is likely to push up inflation.
The authors acknowledge that developments in the banking industry may be exagger-ating M1 growth. They also note that rapid money growth does not imply higher inflation ifthe economy’s demand for money is growing at the same pace. Although the economy hasbeen growing robustly without inflationary pressure, Robson and Aba find that — after ad-justing measured M1 for several financial sector innovations and making generous allow-ances for influences that might be increasing demand for it — recent growth has pushed thestock of M1 too high for comfort. They conclude, therefore, that the Bank of Canada shouldrein in M1 growth to avoid an inflationary blowoff.
* * * * *
The C.D. Howe Institute is Canada’s leading independent, nonpartisan, nonprofit economic policyresearch institution. Its individual and corporate members are drawn from business, labor, agriculture,universities, and the professions.
— 30 —
For further information, contact: Bill Robson or Shay AbaKristine Gray (media relations),
“Stop the Press! Rapid Money Growth May Bring Higher Inflation,”C.D. Howe Institute Commentary 144,by William B.P. Robson and Shay Aba (September 2000). 20 pp.; $10.00 (prepaid, plus postage & handlingand GST — please contact the Institute for details). ISBN 0-88806-476-4.
Copies are available from: Renouf Publishing Company Limited, 5369 Canotek Road, Ottawa, OntarioK1J 9J3 (stores: 71½ Sparks Street, Ottawa, Ontario; 12 Adelaide Street West, Toronto, Ontario); or directlyfrom the C.D. Howe Institute, 125 Adelaide Street East, Toronto, Ontario M5C 1L7. The full text of thispublication is also available from the Institute’s Internet website at www.cdhowe.org.
C.D. Howe Institute / Institut C.D Howe Communiqué / 2
C.D. Howe InstituteInstitut C.D. Howe Communiqué
Embargo : à publier le mardi 12 septembre 2000 à 10 h
Selon une étude de l’Institut C.D. Howe, lacroissance rapide de la masse monétaire
pourrait entraîner une hausse du taux d’inflation
La Banque du Canada pourrait être forcée de hausser les taux d’intérêt pour juguler l’inflation,révèle un Commentaire de l’Institut C.D. Howe publié aujourd’hui. Selon l’étude, l’agrégatmonétaire mesuré par le M1 a subi une hausse considérable de 24 % au cours des 12 derniersmois. Dans le passé, le M1 — qui représente les espèces et les comptes de chèque, des formesmonétaires étroitement associées à la dépense — s’est avéré un indicateur fiable des fluctuationséconomiques et de l’inflation. Si la Banque du Canada ne prend pas de mesures pour ralentir lacroissance monétaire, le taux d’inflation dépassera probablement sa fourchette cible de 1 à 3 %.
Intitulée « Stop the Press! Rapid Money Growth May Bring Higher Inflation » (« Arrêtezles presses ! La croissance monétaire pourrait entraîner une hausse du taux d’inflation »),l’étude est rédigée par William B.P. Robson, directeur de la recherche à l’Institut C.D. Howe, etShay Aba, analyste de recherche auprès de l’Institut. Ces derniers soutiennent qu’il faut sesoucier du M1, car il occupe une place importante dans la chaîne qui lie la politique de laBanque du Canada en matière de taux d’intérêt à la croissance économique et à l’inflation.Lorsque l’argent coule à flots, les ménages et les entreprises prennent confiance et augmententleurs dépenses. Lorsque l’économie fonctionne presque à capacité, comme c’est le casmaintenant, ces dépenses supplémentaires favorisent une hausse du taux d’inflation.
Les auteurs reconnaissent que les tendances de l’industrie bancaire pourraient bienexagérer la croissance du M1. Ils soulignent également qu’une croissance rapide de la massemonétaire ne signifie pas forcément une hausse du taux d’inflation lorsque la demandeéconomique d’argent progresse au même rythme. Cependant, bien que l’économie connaisseune croissance solide dépourvue de pressions inflationnistes, MM. Robson et Aba constatentque — même après que l’on ait généreusement redressé la mesure du M1 pour tenir compte dediverses innovations dans le secteur financier et de facteurs qui pourraient accroître la demande— la croissance récente a porté le M1 à un niveau qui est, selon eux, trop élevé. Par conséquent,ils arrivent à la conclusion que la Banque du Canada devrait freiner la croissance du M1 pouréviter un excès inflationniste.
* * * * *
L’Institut C.D. Howe est un organisme indépendant, non-partisan et à but non lucratif, qui joue un rôleprépondérant au Canada en matière de recherche sur la politique économique. Ses membres, individuelset sociétaires, proviennent du milieu des affaires, syndical, agricole, universitaire et professionnel.
– 30 –
Renseignements : Bill Robson ou Shay AbaKristine Gray (relations avec les médias), Institut C.D. Howe
téléphone : (416) 865-1904; télécopieur : (416) 865-1866;courriel : [email protected]; site Web : www.cdhowe.org
« Stop the Press! Rapid Money Growth May Bring Higher Inflation », Commentaire de l’Institut C.D. Howeno 144, par William B.P. Robson et Shay Aba, septembre 2000, 20 p., 10 $ (frais d’expédition et TPS en sus,commande payable d’avance — prière de communiquer avec l’Institut à cet effet). ISBN 0-88806-476-4.
On peut se procurer des exemplaires de cet ouvrage auprès des : Éditions Renouf ltée, 5369, cheminCanotek, Ottawa (Ontario) K1J 9J3 (librairies : 71 ½ , rue Sparks, Ottawa [Ontario] et 12, rue AdelaideOuest, Toronto [Ontario]) ou encore en s’adressant directement à l’Institut C.D. Howe, 125, rue AdelaideEst, Toronto (Ontario) M5C 1L7. On peut également consulter le texte intégral de cet ouvrage au site Webde l’Institut à l’adresse suivante : www.cdhowe.org.
C.D. Howe Institute / Institut C.D. Howe Communiqué / 2
CommentaryC.D. Howe Institute
w w w . c d h o w e . o r g N o . 1 4 4 , S e p t e m b e r 2 0 0 0 I S S N 0 8 2 4 - 8 0 0 1
Stop the Press!Rapid Money Growth May BringHigher Inflation
William B.P. RobsonShay Aba
In this issue...
The stock of transactions money in Canada — the monetary aggregate M1 —is growing so fast that the Bank of Canada may need to raise interest rates toprevent rising inflation.
The Study in Brief...
Recent growth of M1, a measure of money in Canada closely associated with spending, has beenextraordinarily rapid: 24 percent over the year to July. Past periods of such explosive monetary expansionhave signalled unsustainable growth in spending and rising inflation. M1’s past record as a leadingindicator, and its role in the chain that links Bank of Canada policy with economic growth and inflation,raises the question of whether the Bank needs to tighten policy to avoid an inflationary blow-off.
If M1 is expanding in line with the money demand of households and firms whose output andspending are growing at a pace consistent with the Bank of Canada’s 2 percent inflation target, there isno reason for alarm. If, however, the growth of M1 is outpacing that demand, Canada could be headedfor trouble.
To determine whether the country’s demand for money is growing fast enough to absorb the risingstock of M1 without higher inflation, this study first adjusts the Bank of Canada’s M1 aggregate byremoving distortions caused by innovations and ownership changes in the banking system. Statisticaltechniques are then applied to estimate how changes in spending and interest rates may have affectedthe demand for transactions money.
Using as a benchmark the fourth quarter of 1997 — a time when the economy was doing reasonablywell (though operating somewhat below its productive capacity) and when monetary growth seemedconducive to stable inflation — the study compares the growth of the money supply since then to highand low estimates of growth in money demand. Despite several assumptions that lead to a generousassessment of the possible rate of demand growth, the study finds that recent demand is unlikely tohave grown fast enough to absorb the current money stock without inflation.
It appears that, if the growth of M1 does not soon fall below double digits, the Bank of Canada willhave to raise short-term interest rates to protect the country from rising inflation.
The Authors of This Issue
William B.P. Robson is Director of Research at the C.D. Howe Institute. He specializes in Canadian fiscaland monetary policy. His 1994 book, The Great Canadian Disinflation, co-authored with David Laidler,won the Canadian Economics Association’s Doug Purvis Memorial Award for excellence in writing onCanadian economic policy.
Shay Aba is a Research Analyst at the C.D. Howe Institute. He has a degree in economics from YorkUniversity.
is a periodic analysis of, and commentary on, current public policy issues. The manuscript was copy edited byLenore d’Anjou and prepared for publication by Wendy Longsworth and Barry A. Norris. As with all Institute publications, the views expressedhere are those of the author, and do not necessarily reflect the opinions of the Institute’s members or Board of Directors.
To order this publication, please contact: Renouf Publishing Co. Ltd., 5369 Canotek Rd., Unit 1, Ottawa K1J 9J3 (tel.: 613-745-2665;fax: 613-745-7660), Renouf’s stores at 71½ Sparks St., Ottawa (tel.: 613-238-8985) and 12 Adelaide St. W., Toronto (tel.: 416-363-3171),or the C.D. Howe Institute, 125 Adelaide St. E., Toronto M5C 1L7 (tel.: 416-865-1904; fax: 416-865-1866; e-mail: [email protected]).
$10.00; ISBN 0-88806-476-4
After disappointing growth during most of the 1990s, the Canadian economyentered the new decade with a bang. Output and jobs are expandinghealthily. Through the first half of 2000, real gross domestic product (GDP)was up about 5 percent from year-earlier levels, while job growth of about
3 percent reduced the unemployment rate to around 7 percent. Meanwhile, inflationremains under control. Despite a one-time push from higher oil prices that raised thetotal consumer price index (CPI) 3 percent above its year-earlier level in June, coremeasures of inflation remain around 1.5 percent, below the Bank of Canada’s target of2 percent and well within the 1-to-3 percent band around the target. On its face, then,Canada’s economic performance seems to be just about everything that the makers ofmonetary policy could wish for.
Past experience shows, however, that maintaining steady growth with stableinflation is no easy task. Modern economies are complex, and signals of future growthand potential inflation are rarely straightforward. In Canada, fortunately, one indicatorof financial conditions has proved over many years to provide useful advanceinformation about the economy. That indicator is M1, which is usefully thought of astransactions money because it is essentially the aggregate of cash held outside thebanking system and demand deposits (chequing accounts) at the chartered banks, theforms of money most commonly used in spending on goods and services. And M1 isnow growing extraordinarily rapidly: it was up almost 24 percent over the year to July,and recent monthly growth rates show no slackening. To use an archaic but effectiveimage, the money-printing press is running full bore.
Such explosive growth of M1 is rare. Among the few past periods of comparableexpansion are episodes in the early 1970s and late 1980s, when rapid M1 growthpreceded unsustainable expansions of spending and rising inflation. It is natural towonder, therefore, whether recent M1 growth signals that the 125 basis point increasethat the Bank of Canada has engineered in the Bank rate since late 1999 is insufficient.Does the Bank need to slow the press further and nip an inflationary blowoff in the bud?
Making Sense of M1 Growth
Answering that question requires an estimate of how much M1 is too much. If the stockof M1 is expanding in line with the requirements of households and firms whoseoutput and spending are growing at a pace consistent with stable inflation, there is noreason for alarm. If, on the other hand, the current stock of M1 in the economy is abovethat amount or if recent growth rates would soon push it above that amount, then theBank of Canada needs to act to prevent inflation from rising.
How much money do households and firms need to support stable-inflation ratesof growth? As often in economics, clues to this question can be found in pastrelationships. Particularly important are the growth of the economy’s productivepotential and the level of interest rates on other financial assets (because these interestrates determine the cost that holders of money incur by passing up investments inhigher-yielding alternatives). Since M1 as conventionally measured is also influencedby innovations in the banking industry, however, using past data to estimate the
C.D. Howe Institute Commentary 1
We thank David Laidler, Loretta Nott, and several other referees for comments. Responsibility for theconclusions presented here and for any remaining errors is ours.
demand for money requires considerable care and some adjustments, which wedescribe below.
Stop the Press!
To preview our conclusions, our review of past relationships suggests that, while theCanadian economy’s demand for transactions money is likely expanding robustly, it isnot growing strongly enough to absorb as much transactions money as is now beingcreated. Even after we make generous allowances for the uncertainties that always arisein using past evidence to predict the future, it looks as though the press is running toofast, threatening a pickup in inflation.
Our concerns on this score are all the greater because our statistical work on theresponse of money demand to growth in output — and hence the rate at which moneycan grow without boosting inflation — yields estimates that are higher than theoreticaland empirical work usually produce. If we have overestimated the response of moneydemand to output growth, we have probably underestimated the amount of excess M1currently in circulation. There is always a possibility that developments in the financialsector beyond those we have taken into account are producing misleading signals. Butour concern is supported by other evidence: growth in broader monetary aggregatesthat is faster than the Bank of Canada has estimated as consistent with stable inflationin the past; the persistent weakness of the exchange rate, which suggests an oversupplyof Canadian dollars; and last but not least the fact that consumer price inflation isalready at the top of the Bank’s 1-to-3 percent band.
On the whole, it seems that the Bank may need to raise short-term interest ratesfurther, slowing the press, to get inflation back to its 2 percent target.
Why Worry about M1?
M1 is not the only measure of the quantity of money in the country. For manypurposes, broader aggregates are useful (see Box 1). But M1 warrants special attention.
The simplest argument for watching M1 and for reacting to overrapid growth byraising short-term interest rates is that this monetary aggregate has a long-standingrecord as a signal of future economic growth and inflation. There are reasons to thinkthat this record is not just a coincidence or an artifact of the data, but that it reflects animportant role for money in transmitting the central bank’s actions to the broadereconomy.
M1’s Forecasting Record
To begin with, M1’s record as a predictor of growth is as good as or better than that ofany other leading indicator. Figure 1 illustrates the year-over-year growth of M1 and ofGDP (both adjusted for inflation) since the late 1960s. Even this simple representation— which neglects the fact that changes in interest rates can affect growth of moneydemand, causing occasional changes in the relationship between M1 growth and theeconomy — illustrates M1’s solid forecasting record. Instances in which the aggregateprovided misleading signals of economic accelerations and decelerations are
2 C.D. Howe Institute Commentary
M1 has a long-standing record asa signal of futureeconomic growthand inflation.
comparatively rare, and this reliability is reflected in its tendency to lead major risesand falls of inflation as well.
M1’s Role in TransmittingMonetary Impulses to the Economy
If M1’s tendency to lead economic growth and inflation was simply an observed factwithout any apparent explanation, it would be wise to be skeptical about its reliabilityas a signal of future economic developments. However, there are good reasons to thinkthat this tendency is not a coincidence of timing — say, with movements in M1 beingobserved just ahead of the economic fluctuations they accompany — but rather that itreflects an important role for transactions money in the economy.
Unlike broader measures of money that include accounts at financial institutionscontaining instruments used as stores of wealth, M1 is money that households andbusinesses use when they buy and sell goods and services.1 And as M1 is passed fromhand to hand, it conveys important information to its recipients about the state of the
C.D. Howe Institute Commentary 3
Box 1: Canadian Monetary Aggregates
Counting the quantity of money in an economy is a challenging exercise because it is oftendifficult to know what to include. Because the possibilities are so numerous, most countrieshave several definitions. Those used in Canada, from the narrowest to the broadest,include
• currency outside banks: the notes and coins issued by the Bank of Canada and the RoyalCanadian Mint that are outside the banking system;
• M1: currency outside banks plus Canadian-dollar demand deposits (chequingaccounts) at Canadian banks net of the private sector float (a balancing amount relatedto transactions that are not yet complete);
• M2: M1 plus the chartered banks’ holdings of personal saving deposits (these mayhave chequable features) and nonpersonal (firms’) notice deposits;
• M2+: M2 plus personal and nonpersonal deposits at the near banks (trust companies,credit unions, caisses populaires, and so on) plus funds invested in certain moneymarket mutual funds; and
• M2++: M2 plus Canada Savings Bonds and non-money market mutual funds.
Source: Adapted and updated from Laidler and Robson 1994, 54.
1 This focus on M1’s role in transactions is why we prefer to use net M1, as shown in Figure 1. Thisaggregate adjusts the total of currency and chequing accounts for payment items in transit — in “float”— which consist mainly of cheques that have been credited against the payee’s account but not yetdeducted from the payer’s account (and thus must be subtracted to avoid double counting) and bankdrafts that have been deducted from the payer’s account but not yet credited to the payee’s account(which must be added). Float can vary dramatically from month to month. This volatility, along withuncertainty about whether all the items in float are moving between accounts measured in M1, hasmade the Bank of Canada wary of net M1; recent Bank commentary has focused on its grosscounterpart. Float’s obviously transactions-oriented nature, however, makes it hard to ignore in an“active money” view of the world — a theoretical consideration that gains additional force from theempirical observation that net M1 is a slightly better leading indicator of GDP than is gross M1.
economy generally and about their own financial condition and prospects particularly.2
This information, in turn, alters their spending decisions. When money receipts arehigher than expected, households and businesses gain confidence and raise theirconsumption and investment; when money receipts are lower than expected, they loseconfidence and lower spending.
As spending rises and falls, the rate at which the economy is absorbing goods andservices rises and falls as well, intensifying or easing pressure on its productivecapacity. Money growth that promotes absorption in line with capacity tends to yieldstable inflation, as seems to have been the case for the past few years. Money growthrapid enough to push absorption above the economy’s productive capacity tends topush inflation higher, with buyers becoming more numerous and more eager thansellers, as happened in Canada during the early 1970s and the late 1980s. And moneygrowth that chokes off spending, creating a gap between output and capacity, lowersinflation, as happened in the early 1980s and again in the early 1990s.
During times when economic growth and inflation are stable, financial markets arecalm, and monetary policy is steady, M1 receipts and balances tend to coincide withhousehold and business expectations, and the rate of M1 growth yields little or no
4 C.D. Howe Institute Commentary
Figure 1: Real Growth Rates of GDP and M1, 1969:Q1–2000:Q2
Note: The aggregate reported here is measured M1 net of items in transit. See the text for an explanation ofthe difference between gross and net M1 and our reasons for using the latter here.
Sources: Statistics Canada, CANSIM; and authors’ calculations.
2 In contrast is a “passive money” view, in which portfolio readjustments keep the amount of moneyactually available in the economy equal to the amount of money demanded. In this view, neither M1nor any other measure of the money stock has causative power. The passive money view seems moreapt for the saving accounts included in M2 and M3, which more closely resemble other financial assetssuch as money-market securities, than for M1, which is far likelier to be exchanged against goods andservices.
year
-ove
r-ye
ar G
DP
grow
th (
%)
year
-ove
r-ye
ar M
1 gr
owth
(%
)
GDP
M1
information about the future beyond what other indicators of expectations, spending,and output provide. At other times, however, the stock of M1 may differ from whathouseholds and businesses would demand in equilibrium. On those occasions, M1 mayprovide signals that are useful to the Bank of Canada as it seeks to keep inflation fromdropping below the bottom or rising through the top of its target band.
How Much M1 Does Canada Need?
To decide whether recent M1 growth signals inflationary pressure, we need to do twothings.
First, recalling that M1 occasionally has provided misleading signals in the past,apparently because of innovations in the banking industry and the financialenvironment more generally, we need to allow for the possibility that similarextraordinary factors are affecting M1 growth in the present.
Second, after allowing for any such factors, we need to estimate how much M1Canadian households and businesses would wish to hold if the economy were growingat a rate consistent with steady inflation, and if other influences on the demand for M1— in particular, the cost of holding it rather than other financial assets that pay higherrates of interest — were at levels consistent with that growth. If current growth isdriving M1 to a level that exceeds our estimates of the demand for it, the Bankprobably needs to act to rein it in.
Institutional Factors Influencing M1
From time to time, technological innovations and structural changes in the bankingindustry make M1 a misleading measure of transactions money. Under thosecircumstances, getting a picture of the growth of transactions money clear enough tomake inferences about future economic activity and inflation may require adding ordeleting certain types of accounts from the published aggregate.3
One much-examined example of an innovation that affected M1 occurred in the late1970s and early 1980s, when banks introduced daily interest and savings accounts aswell as cash-management packages for businesses. By providing a convenient, higher-yielding alternative to largely interest-free demand deposits, these innovationseffectively raised the opportunity cost of holding M1, lowering its growth rate over aprotracted period of time.4
More recently, two financial industry developments appear to be affecting the stockof M1 in the other direction. First, the chartered banks’ absorption of major investmentdealers has led to the inclusion in M1 of free credit balances — cash balances thatinvestors keep with their brokers. These balances are as liquid as chequing accounts,but their creation and destruction reflect portfolio adjustments, rather than transactionsin goods and services. There is therefore no reason to expect M1 movements that reflect
C.D. Howe Institute Commentary 5
3 For a recent survey of alternative measures of transactions money, see Aubry and Nott (2000).
4 By 1986, Aubry and Nott (2000, 2) estimate that the cumulative effect of these innovations left the stockof M1 30 percent lower than it otherwise would have been. As we explain below, we deal with thischange in opportunity cost by including an appropriate measure of opportunity cost in our regressions.
Getting a picture ofthe growth oftransactions moneyclear enough tomake inferencesabout futureeconomic activityand inflation mayrequire adding ordeleting certaintypes of accountsfrom the publishedaggregate.
changes in free credit balances to signal future changes in output and prices in the sameway that movements reflecting changes in other components of the aggregate do. Inaddition, part of the recent growth of M1 reflects increases in deposits held at banks bynonbank financial institutions. These accounts also are unlikely to reflect transactions ingoods and services.5 Accordingly, we subtract from M1 both free credit balances andthe deposits of other financial institutions, producing an aggregate we call adjusted M1(M1A).
Another complication in interpreting M1 arises from a development in the early1990s: the removal of the requirement that banks hold non-interest-bearing reserveswith the Bank of Canada against demand deposits.6 When the reserve requirementdisappeared, flows of money out of nonpersonal notice deposits, which are notincluded in M1, and into nonpersonal demand deposits, which are included, againdistorted the aggregate’s growth. Previous work at the C.D. Howe Institute (Boessenkool,Laidler, and Robson 1997) deals with this problem by adding nonpersonal chequablenotice deposits to M1, thereby creating a new aggregate called M1X.
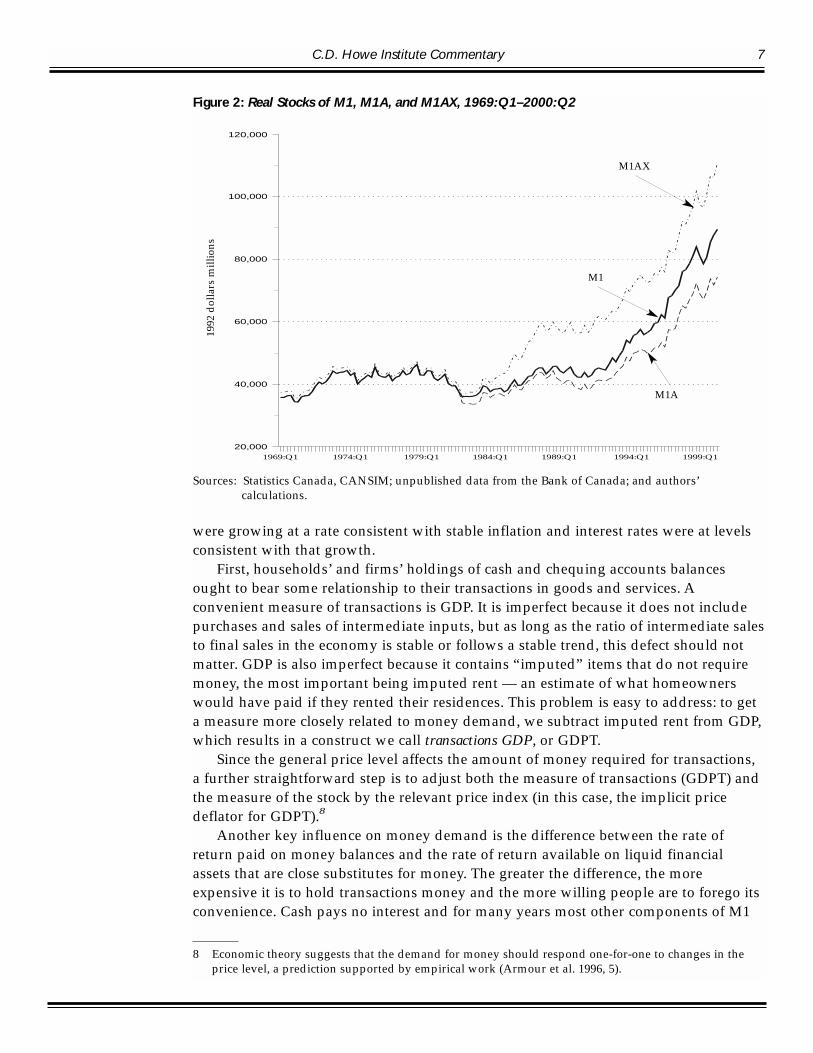
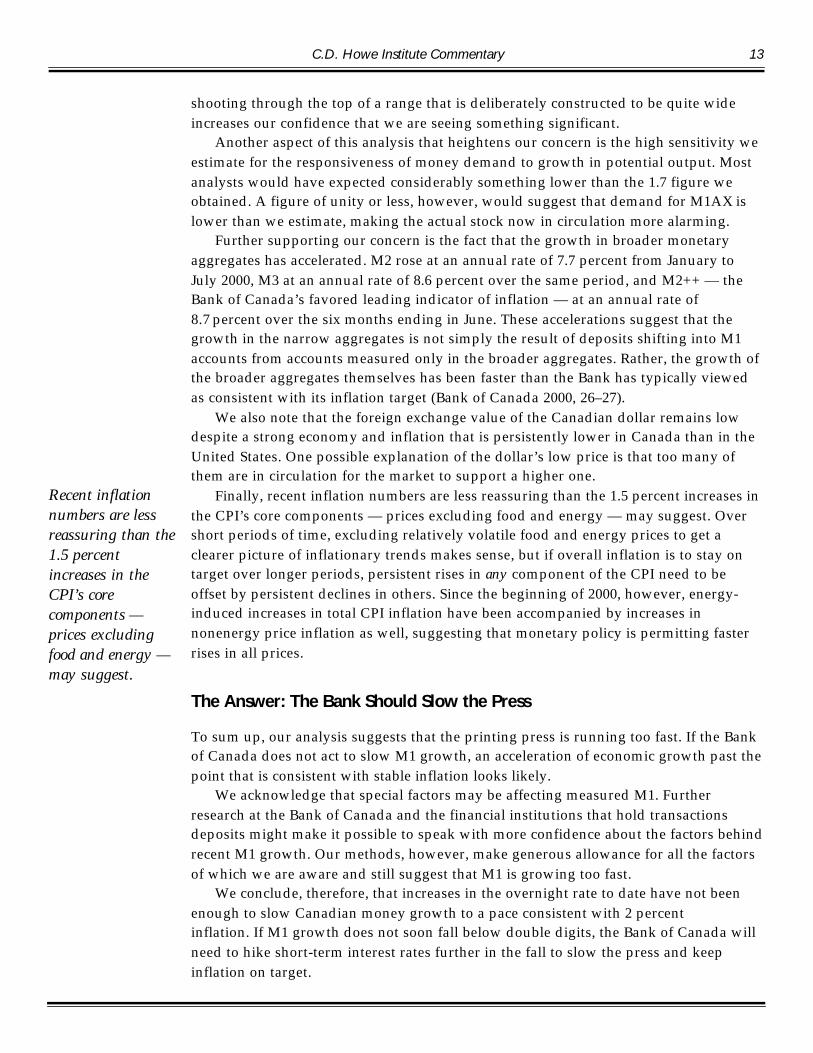
It should be possible to get a cleaner definition of transactions money by allowingfor all these effects. We remove free credit balances and deposits of other financialinstitutions from M1 on the grounds that they are not transactions money, and we addnonpersonal chequable notice deposits on the grounds that they are practicallyindistinguishable from their demand counterparts. We call the resulting new aggregateadjusted M1X (M1AX). Figure 2 compares the inflation-adjusted stock of M1 withsimilarly adjusted stocks of M1A and M1AX since the late 1960s. Figure 3 showsgrowth of M1AX and of GDP; both the removal of free credit balances and financial-institution deposits and the “internalization” of the shift between notice and demanddeposits improve the correlation between growth in the money supply and GDPgrowth.7
Estimating M1 Demand
Having adjusted measured M1 to reduce the effects of institutional changes, we turn totrying to determine how much money Canadians would wish to hold if the economy
6 C.D. Howe Institute Commentary
5 There is some oversimplification here, since financial institutions do transact in goods and services andmaintain accounts connected with those transactions. Formally, however, measures of the money stock,such as M1, are measures of the liabilities of the banking system held by individuals and businessesoutside it: accounts banks hold with each other are not counted. If the Bank of Canada consolidated theassets and liabilities of the financial institutions holding these accounts with the rest of the bankingsystem, these accounts would not appear in the monetary aggregates.
6 Reserve requirements used to oblige banks to hold non-interest-bearing deposits at the Bank of Canadaagainst certain types of deposits held by their customers. The required reserve ratio on notice depositswas lower than that required on demand deposits. By effectively taxing different types of deposits atdifferent rates, this requirement created incentives for banks to classify deposits as notice rather thandemand deposits and to move customers’ money out of demand deposits and into notice deposits.With the phasing out of reserve requirements, these incentives disappeared, accelerating the growth ofdemand deposits at the expense of notice deposits.
7 From the first quarter of 1969 to the second quarter of 2000, the correlation coefficient between thegrowth of real M1 and the growth of real GDP two quarters later was 0.57, while the correlationcoefficient between real M1AX and real GDP was 0.60. See the appendix for more information on thesecorrelations.
The removal of freecredit balances andfinancial-institutiondeposits and the“internalization” ofthe shift betweennotice and demanddeposits improvethe correlationbetween growth inthe money supplyand GDP growth.
were growing at a rate consistent with stable inflation and interest rates were at levelsconsistent with that growth.
First, households’ and firms’ holdings of cash and chequing accounts balancesought to bear some relationship to their transactions in goods and services. Aconvenient measure of transactions is GDP. It is imperfect because it does not includepurchases and sales of intermediate inputs, but as long as the ratio of intermediate salesto final sales in the economy is stable or follows a stable trend, this defect should notmatter. GDP is also imperfect because it contains “imputed” items that do not requiremoney, the most important being imputed rent — an estimate of what homeownerswould have paid if they rented their residences. This problem is easy to address: to geta measure more closely related to money demand, we subtract imputed rent from GDP,which results in a construct we call transactions GDP, or GDPT.
Since the general price level affects the amount of money required for transactions,a further straightforward step is to adjust both the measure of transactions (GDPT) andthe measure of the stock by the relevant price index (in this case, the implicit pricedeflator for GDPT).8
Another key influence on money demand is the difference between the rate ofreturn paid on money balances and the rate of return available on liquid financialassets that are close substitutes for money. The greater the difference, the moreexpensive it is to hold transactions money and the more willing people are to forego itsconvenience. Cash pays no interest and for many years most other components of M1
C.D. Howe Institute Commentary 7
Figure 2: Real Stocks of M1, M1A, and M1AX, 1969:Q1–2000:Q2
Sources: Statistics Canada, CANSIM; unpublished data from the Bank of Canada; and authors’calculations.
8 Economic theory suggests that the demand for money should respond one-for-one to changes in theprice level, a prediction supported by empirical work (Armour et al. 1996, 5).
1992
dol
lars
mill
ions
M1AX
M1
M1A
paid little or no interest, so the opportunity cost of holding M1 was essentially equal tothe rate of return on alternatives, such as short-term securities or guaranteedinvestment certificates. More recently, however, thanks to advances in technology andcompetition among financial service providers, more of the deposits included in M1pay interest. We estimate the average interest rate on M1AX from data on flows offunds. The difference between this interest rate and a liquid alternative — for which weuse the rate on three-month Treasury bills (T-bills) — represents the opportunity cost ofM1AX that we use in our statistical work.
Finally, since we are concerned about the recent behavior of M1AX — specifically,the possibility that the stock of money in circulation may be deviating from the amountthat Canadians wish to hold for a given level of transactions and interest rates — wewant to exclude the recent rapid growth from the period that we examine for cluesabout money demand. Accordingly, we exclude from our regression analysisobservations after the fourth quarter of 1997. That point seems a reasonable cutoff: theeconomy was then growing steadily; inflation during the following year was roughlystable; and no financial shocks were affecting Canadian interest rates.
A regression of inflation-adjusted M1AX on inflation-adjusted GDPT (both measuredin natural logarithms) and its opportunity cost, OC, yields the following equation.Standard errors are shown in parentheses below the relevant coefficients.9
8 C.D. Howe Institute Commentary
Figure 3: Real Growth Rates of GDP and M1AX, 1969:Q1–2000:Q2
Sources: Statistics Canada, CANSIM; unpublished data from the Bank of Canada; and authors’calculations.
9 We use data without seasonal adjustment, and therefore include quarterly dummy variables. Thecoefficients are robust to the inclusion of linear and quadratic time trends; augmented Dickey-Fullertests suggest that the residuals are stationary despite the low Durbin-Watson statistic. A more completeset of diagnostic statistics for this and other similar regressions is contained in the appendix.
R2 = 0.986 SE = 0.027 DW = 1.19 Time period covered: 1983:Q1–1997:Q4
An odd feature of this equation is the high coefficient on GDTP. Much past empiricalwork on M1 tends to find a responsiveness to income growth of less than 1.0, a findingpredicted by theoretical work on transactions money. In view of the fact thatcoefficients of about 1.7 result from several different specifications, however, we feelobliged to treat the finding seriously as a description of M1AX’s historical behavior. 10
Is Current M1 Growth Inflationary?
The final major step in our examination of money growth is to use these estimates ofthe responsiveness of money demand to income and interest rates to try to determinewhether recent money growth threatens higher inflation. We do this by selecting abenchmark period in the past when economic conditions appear to have beenconsistent with stable inflation, and estimating a likely path for money demand growthsince then. If M1AX appears to be above, or heading above, the upper bound of thatestimated path, the Bank of Canada should consider tightening.
Estimates of Noninflationary Money Growth
As noted above, the fourth quarter of 1997 seems a reasonable period to use as abenchmark. Twelve to 18 months after that date, key measures of prices registeredincreases similar to those they showed then (Bank of Canada 2000, 6–7), suggestingthat, while the economy may not have been operating at its productive capacity, it wasprobably not very far below it.11 Moreover, real GDP growth during the 12-monthperiod following the fourth quarter of 1997 was 2.8 percent — about the middle of therange of estimates of growth in the economy’s productive capacity12 — evidence thatmonetary conditions at the end of 1997 were conducive to stable inflation growth. Wetherefore choose that period as an apt point for a benchmark from which to estimatehow much demand for M1 would have grown in a stable environment where growthcontinued at a pace consistent with steady inflation.
Of the factors influencing demand, increases in the price level are the moststraightforward to deal with. Since the Bank of Canada’s target for inflation is aforward-looking one in which past under- or overshoots are ignored, we simply use the
C.D. Howe Institute Commentary 9
10 Anticipating later discussion, we emphasize that if this coefficient is an overestimate, calculations ofM1AX demand using it will tend to be exaggerated, understating the inflationary pressures inherent inany given level of the actual money stock.
11 The Bank of Canada estimates that the difference between actual and potential output in the fourthquarter of 1997 was a disinflationary gap of about 1.5 percentage points (Bank of Canada 2000, 14).There is, however, considerable uncertainty about such estimates — the 95 percent confidence intervalaround them is about 2 percentage points either way — and the stability of inflation during thefollowing period suggests the gap was small. The latest estimate by the Organisation for Economic Co-operation and Development of Canada’s output gap during all of 1997 was 1.1 percent (OECD 2000, 255).
12 The Bank of Canada’s estimate of the output gap in the fourth quarter of 1998 was virtually unchangedfrom its estimate in the fourth quarter of 1997 (Bank of Canada 2000, 14).
If M1AX appears tobe above, or headingabove, the likelypath for moneydemand growth, theBank of Canadashould considertightening.
increases in the deflator for GDPT that actually occurred between the fourth quarter of1997 and the second quarter of 2000.
The influence of GDPT growth is trickier to estimate for two reasons. There isdisagreement about how quickly the economy’s productive capacity is growing and,therefore, about how quickly spending can grow without producing inflationary ordisinflationary output gaps. Also, as the standard errors in our equation indicate,estimates of the responsiveness of money demand to growth in expenditures andincomes are imprecise. We therefore produce both a low- and a high-growth estimate ofthe response of money demand to increases in potential output. The low-growthestimate assumes that capacity has been growing at an annual rate of 2.5 percent andthat the responsiveness of demand to that growth is at the lower end of the likely rangeof our estimate (two standard errors below the estimate). The high-growth estimateassumes that capacity has been growing at an annual rate of 3 percent and that theresponsiveness of demand is at the higher end of our range (two standard errors abovethe estimate).
Next is the question of what to assume about interest rates and how they affectmoney demand. Again, we allow for uncertainty on this issue using a double-barreledapproach. Our low-growth estimate assumes that the increase in the opportunity costof holding transactions money between the fourth quarter of 1997 and the secondquarter of 2000 — an increase of 192 basis points — is consistent with noninflationarygrowth and that the depressive effect of those increases on money demand is at theupper end of (two standard errors above) a range around our estimate of this effect.Our high-growth estimate assumes that the level of interest rates in the fourth quarterof 1997 was consistent with stable inflation growth both then and now and allows forno such depressive effect.
Finally, we adjust our starting points. Our benchmark for the money stock is notquite the same as the amount outstanding in the fourth quarter of 1997, for tworeasons. First, the value we estimate in our money demand equation is below the actualfigure for M1AX at that time. Our second adjustment moves our benchmark in theopposite direction and largely offsets the first change. Most observers feel that actualoutput was then below potential, so we raise our benchmark from where it wouldotherwise have been to allow for the money growth that would merely haveaccommodated a return to stable-inflation output. Finally, acknowledging theuncertainty about our estimates, we begin our low- and high-growth paths at points alittle more than 5 percent lower and 5 percent higher (two standard errors in ourregression) than our adjusted benchmark.
Then, using the above estimates for the responsiveness of money demand to outputgrowth and interest rates, we calculate the likely change in demand for M1AX betweenthe fourth quarter of 1997 and the second quarter of 2000. Figure 4 traces the resultinggrowth-path estimates, along with the actual growth of M1AX.13 (Box 2 explains allthese calculations in greater detail.)
The movement of M1AX relative to our estimated target range has some interestingfeatures. We note, though the uncertainties in interpreting short-term movements in themonetary aggregates lead us not to put much weight on it, that M1AX’s temporary dipin 1999 suggests slackening growth in mid-2000, for which the second quarter national
10 C.D. Howe Institute Commentary
13 The M1AX series shown in the figure was adjusted for seasonality using the moving-average method.
We calculate thelikely change indemand for M1AXbetween the fourthquarter of 1997 andthe second quarterof 2000.
accounts and recent weaker employment figures provide some evidence. The usual lagsmean that this pause may precede a slackening of price pressure around the end of2000. The more rapid money growth in early 2000 would normally signal renewedeconomic vigor later in the year, with inflationary pressure mounting in 2001.
Most important, these estimates suggest that even if the demand for money is at thehighest levels indicated by our analysis, recent M1AX growth has still been unsettlinglystrong. Rather than simply raising the level of money back to where it ought to havebeen after weakness in 1999, the robust expansion of early 2000 may threaten aresurgence of inflation.
Caveats and Other Evidence
Despite the past forecasting records of M1 and M1AX and the reasonable story behindtheir significance as leading indicators of output and inflation, there are inevitabledoubts about their reliability as a signal of the current outlook. Some of the recentgrowth in these aggregates could reflect further changes in the financial industry whosedetails are not yet clear (such as growth in multipurpose accounts that are counted inM1 yet are predominantly saving accounts). On the whole, however, we are inclined tosee the weight of evidence as supporting concern about recent rates of money growth.
Our methodology has offset at least some of the uncertainties inherent in statisticalwork. Our use of two standard errors in setting our benchmarks and in estimating ourelasticities is a fairly generous accommodation, as is our combining of all factors thatwould contribute to high demand in our high-growth estimate. To see money growth
C.D. Howe Institute Commentary 11
Figure 4: Target Bands for M1AX and Actual M1AX, 1994:Q1–2000:Q2(seasonally adjusted)
Sources: Statistics Canada, CANSIM; unpublished data from the Bank of Canada; and authors’calculations.
$ m
illio
ns
actual growth
high growth
low growth
12 C.D. Howe Institute Commentary
Box 2: Calculating the Money Target
Judging how much M1AX would be consistent with stable-inflation growth requires firstfinding a benchmark point and then estimating how the demand for M1AX is likely tohave grown since then.
We selected the fourth quarter of 1997 as a benchmark for reasons discussed in thetext. Our point estimate (the fitted value in our regression) of money demand at that timeis some 3 percent below the actual level of M1AX. Because the economy was likelyoperating below capacity in the fourth quarter of 1997, however, we raise the benchmarkpoint a bit: by roughly 1.7 percentage points — an output gap of 1 percent multiplied byour estimate (1.7) of the responsiveness of M1AX demand to changes in GDPT (GDP lessimputed rent). Because there is uncertainty about this estimate, the starting points we usefor our high- and low-growth paths for M1AX demand are some 5.4 percent above andbelow it (5.4 percent is equal to two standard errors of the estimate of our regression,which means we have 95 percent confidence that the true value of M1AX demand fallswithin this range).
Next, we need estimates of how much demand for M1AX has grown since then due tochanges in output and in the opportunity cost of holding M1AX. Our regression resultsprovide us with estimates of these responses. Since both M1AX and GDPT are expressed innatural logarithms, the elasticity of M1AX demand with respect to GDPT is simply thecoefficient on GDPT. Since the opportunity cost is expressed in percentage points, theelasticity of M1AX demand with respect to changes in it is the coefficient on opportunitycost multiplied by its level, for which we use the average of the figures in the fourthquarter of 1997 and the second quarter of 2000. For both elasticities, we add or subtract twostandard errors from the coefficients in our regression in calculating the high- and low-growth paths. (As already noted, we assume that the elasticity of M1AX demand withrespect to the price level is unity.) This method greatly increases our confidence that M1AXdemand lies within the area bounded by our high- and low-growth paths.
The table in this box shows the steps in calculating the target range. The end points ofthe high- and low-growth paths are derived by multiplying the starting points by the totalpercentage change in estimated M1AX demand, taking into account the elasticities and thechanges in potential output, in opportunity cost, and in the price level between the fourthquarter of 1997 and the second quarter of 2000. The growth paths are interpolated betweenthe starting and end points.
Calculation of the Target Range for Money Demand
Low Growth High Growth
Starting value ($ millions) 95,926 95,926Starting value +/– 2 standard deviations ($ millions) 90,748 101,104Change in potential GDPT, 1997:4Q–2000:2Q (% ) 6.37 7.67Income elasticity 1.63 1.79Demand change due to income change (%) 10.36 13.77Change in OC, 1997:4Q– 2000:2Q (%) 68.25 0OC elasticity –0.095 –0.068Demand change due to OC change (%) –6.51 0Price level elasticity 1 1Change in price level (%) 3.34 3.34Total change (%) 7.19 17.11Estimated demand in 2000:2Q ($ millions) 97,272 118,398
Source: Authors’ calculations.
shooting through the top of a range that is deliberately constructed to be quite wideincreases our confidence that we are seeing something significant.
Another aspect of this analysis that heightens our concern is the high sensitivity weestimate for the responsiveness of money demand to growth in potential output. Mostanalysts would have expected considerably something lower than the 1.7 figure weobtained. A figure of unity or less, however, would suggest that demand for M1AX islower than we estimate, making the actual stock now in circulation more alarming.
Further supporting our concern is the fact that the growth in broader monetaryaggregates has accelerated. M2 rose at an annual rate of 7.7 percent from January toJuly 2000, M3 at an annual rate of 8.6 percent over the same period, and M2++ — theBank of Canada’s favored leading indicator of inflation — at an annual rate of8.7 percent over the six months ending in June. These accelerations suggest that thegrowth in the narrow aggregates is not simply the result of deposits shifting into M1accounts from accounts measured only in the broader aggregates. Rather, the growth ofthe broader aggregates themselves has been faster than the Bank has typically viewedas consistent with its inflation target (Bank of Canada 2000, 26–27).
We also note that the foreign exchange value of the Canadian dollar remains lowdespite a strong economy and inflation that is persistently lower in Canada than in theUnited States. One possible explanation of the dollar’s low price is that too many ofthem are in circulation for the market to support a higher one.
Finally, recent inflation numbers are less reassuring than the 1.5 percent increases inthe CPI’s core components — prices excluding food and energy — may suggest. Overshort periods of time, excluding relatively volatile food and energy prices to get aclearer picture of inflationary trends makes sense, but if overall inflation is to stay ontarget over longer periods, persistent rises in any component of the CPI need to beoffset by persistent declines in others. Since the beginning of 2000, however, energy-induced increases in total CPI inflation have been accompanied by increases innonenergy price inflation as well, suggesting that monetary policy is permitting fasterrises in all prices.
The Answer: The Bank Should Slow the Press
To sum up, our analysis suggests that the printing press is running too fast. If the Bankof Canada does not act to slow M1 growth, an acceleration of economic growth past thepoint that is consistent with stable inflation looks likely.
We acknowledge that special factors may be affecting measured M1. Furtherresearch at the Bank of Canada and the financial institutions that hold transactionsdeposits might make it possible to speak with more confidence about the factors behindrecent M1 growth. Our methods, however, make generous allowance for all the factorsof which we are aware and still suggest that M1 is growing too fast.
We conclude, therefore, that increases in the overnight rate to date have not beenenough to slow Canadian money growth to a pace consistent with 2 percentinflation. If M1 growth does not soon fall below double digits, the Bank of Canada willneed to hike short-term interest rates further in the fall to slow the press and keepinflation on target.
C.D. Howe Institute Commentary 13
Recent inflationnumbers are lessreassuring than the1.5 percentincreases in theCPI’s corecomponents —prices excludingfood and energy —may suggest.
Appendix: Statistical and Econometric Evidence
Estimating money demand equations is always a challenge. Even if the relationshipsbetween that demand and the variables generally assumed to influence it — output,prices, and interest rates — are stable, financial sector innovations can produce theirown fluctuations in the money stock.
Choosing the Appropriate Monetary Aggregate
In regression analysis, the two most common ways of dealing with such changes arethe use of dummy variables and the construction of new aggregates that attempt toremove their effects.
Adding dummy variables to a regression is problematic. Coefficients on dummyvariables often capture other effects as well and, in the process, contaminate estimatesof the impact of those other effects. Instead, we chose to construct a new aggregate,M1AX. As described in the text, we subtracted free credit balances and deposits ofother financial institutions from M1 because these amounts do not appear to representtransactions money in the hands of the nonbank public, and we added nonpersonalchequable notice accounts because the distinction between them and current accountsis unclear.
The theory behind the construction of M1AX sounds reasonable, but is it supportedby the data? Table A-1, which shows correlations between growth in inflation-adjustedmoney and GDP is encouraging. Since it takes time until the effects of changes in themonetary aggregates on GDP appear, we show the correlation between the currentgrowth, t, of the money aggregates and the growth of GDP one, two, and three quartersahead. The new monetary aggregate, M1AX, has a greater correlation in every timeperiod. In this sense, its predictive power can be said to be better than M1’s.
The Relationship between Money Demand,GDP, and the Opportunity Cost
To estimate the demand for money, we used ordinary least-squares regression and, asexplanatory variables, real GDPT and the opportunity cost, OC, of holding M1AX(which can best be measured, given available data, by the three-month T-bill rate minusthe ratio to M1AX of interest paid on deposits included in M1AX). To avoid moving-average problems, we used data without seasonal adjustment and added seasonaldummy variables to the regression. We adjusted our money series for inflation bydividing it by the implicit price deflator for GDPT. The results of this regression areshown in Table A-2, where M1AX and GDPT are expressed in natural logarithms.
Past research at the Bank of Canada (for example, Armour et al. 1996) tends to findthat the presence of a unit root in M1 and in our explanatory variables cannot berejected; the augmented Dicky-Fuller test computed to three lags on the residuals inthis regression suggests that they are stationary and that a long-run cointegratingrelationship exists (the critical values for the test are –1.947 for a 5 percent probability ofa unit root and –2.606 for a 1 percent probability). As we show below, the results arerobust to the inclusion of time trends in the regression, increasing our confidence in thereliability of these coefficients.
14 C.D. Howe Institute Commentary
Other Specifications and Monetary Aggregates
The high coefficient on GDPT led us to try several other alternative specifications, theresults of which are shown in Table A-3. None of them is obviously superior to ourfavored regression. Regressions using M1A obtain lower coefficients on income.However, they exhibit worse autocorrelation in the residuals (as shown by the lowerDurbin-Watson statistic), and augmented Dicky-Fuller tests on the specificationmatching our favored regression suggest nonstationary residuals, casting doubt on thereliablity of these coefficients for policy.
We also ran our regressions using alternate money aggregates and time periods.The results (shown in Table A-4) do not change our main conclusion: that recent moneygrowth suggests future inflation. Indeed, the other aggregates, which have lowerelasticities with respect to output, support stable inflation growth rates lower thanthose we report for M1AX.
C.D. Howe Institute Commentary 15
Table A-1: Correlations between Year-Over-YearGrowth in Real GDP, M1, and M1AX, 1969:Q1–2000:Q2
GDPt GDPt+1 GDPt+2 GDPt+3
M1 0.3113 0.4864 0.5744 0.5214
M1AX 0.3584 0.5256 0.5996 0.5383
Source: Statistics Canada, CANSIM; unpublished Bank of Canada data; and authors’ calculations.
Note: M1A, M1AX, and GDPT are in 1992 dollars, expressed in natural logarithms; opportunity cost is expressed inlevels. Data are not adjusted for seasonality.
Sources: Statistics Canada, CANSIM; and authors’ estimates.
References
Armour, Jamie, et al. 1996. “A Distant-Early-Warning Model of Inflation Based on M1 Disequilibria.” Bankof Canada Working Paper 96-5. Ottawa.
Aubry, Jean-Pierre, and Loretta Nott. 2000. "Measuring Transactions Money in a World of FinancialInnovation." In Money, Monetary Policy, and Transmission Mechanisms, 3-35. Proceedings of a conferenceheld by the Bank of Canada, November 1999. Ottawa: Bank of Canada.
Bank of Canada. 2000. Monetary Policy Report. Ottawa. May.
Boessenkool, Kenneth J., David E.W. Laidler, and William B.P. Robson. 1997. “More Money Than Is Goodfor Us: Why the Bank of Canada Should Tighten Monetary Policy.” C.D. Howe Institute Commentary 95.Toronto: C.D. Howe Institute. July.
Laidler, David E.W., and William B.P. Robson. 1994. The Great Canadian Disinflation: The Economics andPolitics of Monetary Policy in Canada, 1988–93. Policy Study 19. Toronto: C.D. Howe Institute.
Organisation for Economic Co-operation and Development (OECD). 2000. OECD Economic Outlook. Paris.June.
C.D. Howe Institute Commentary 17
Table A-4: Regression Results Using Other Aggregates andAnnual Data, 1983:Q1–1997:Q4