4/10/2007-1 Institute for Defense Analyses 4850 Mark Center Drive • Alexandria, Virginia 22311-1882 Nathan Platt Steve Warner Jeffry Urban James Heagy January 11, 2007 Evaluation of Urban HPAC Predictions with Joint Urban 2003 Field Trial Data 2007 CBIS Conference Renaissance Austin Hotel Austin, Texas 8-12 January 2007
Transcript
4/10/2007-1
Institute for Defense Analyses 4850 Mark Center Drive • Alexandria, Virginia 22311-1882
Nathan PlattSteve WarnerJeffry UrbanJames Heagy
January 11, 2007
Evaluation of Urban HPAC Predictions with Joint Urban 2003 Field Trial Data
2007 CBIS ConferenceRenaissance Austin Hotel
Austin, Texas8-12 January 2007
4/10/2007-2
Outline
• Introduction
• Status
• Urban Mode / MET Comparisons
• Altitude MET “Thresholding”
• PROFILE ALL versus MEDOC meteorological input format
4/10/2007-3
Introduction
• Past IDA studies of Salt Lake City (“Urban 2000”) & MUST
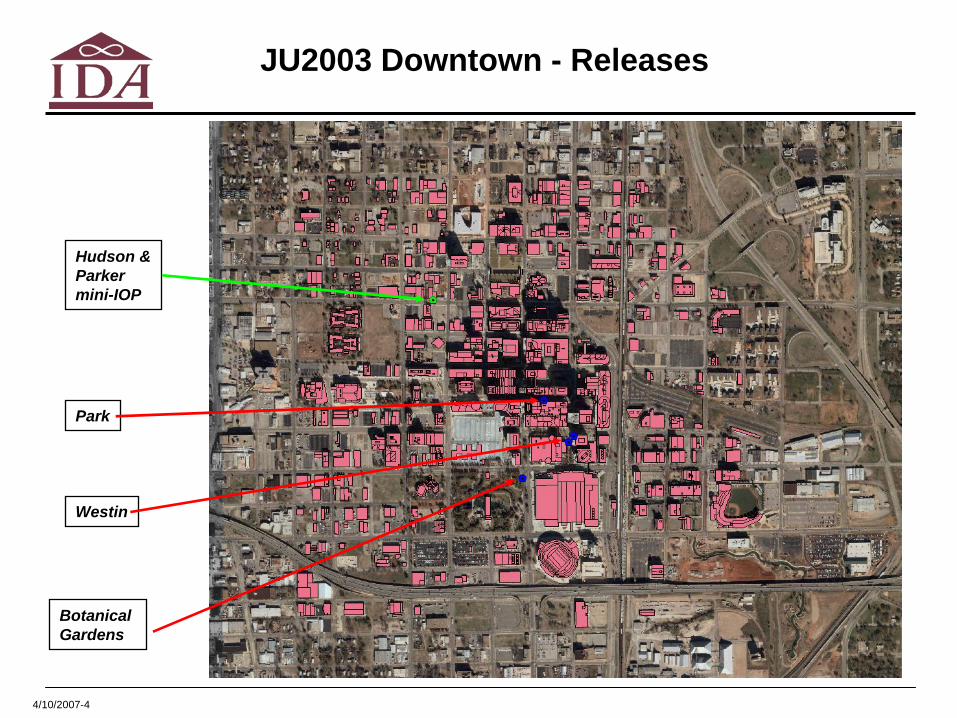
• Joint Urban 2003 field trial – a multi agency effort conducted in Oklahoma City during the summer of 2003
– For this study, we examined the outdoor SF6 releases only
• 10 IOP’s– Continuous releases: 29– Puff releases: 40– Additional mini-IOP on 7/15/05 to help understand vertical
» Models are obtained and we’re learning how to run them– QUIC-URB/QUIC-PLUME (LANL)
» Models are obtained and we’re learning how to run them
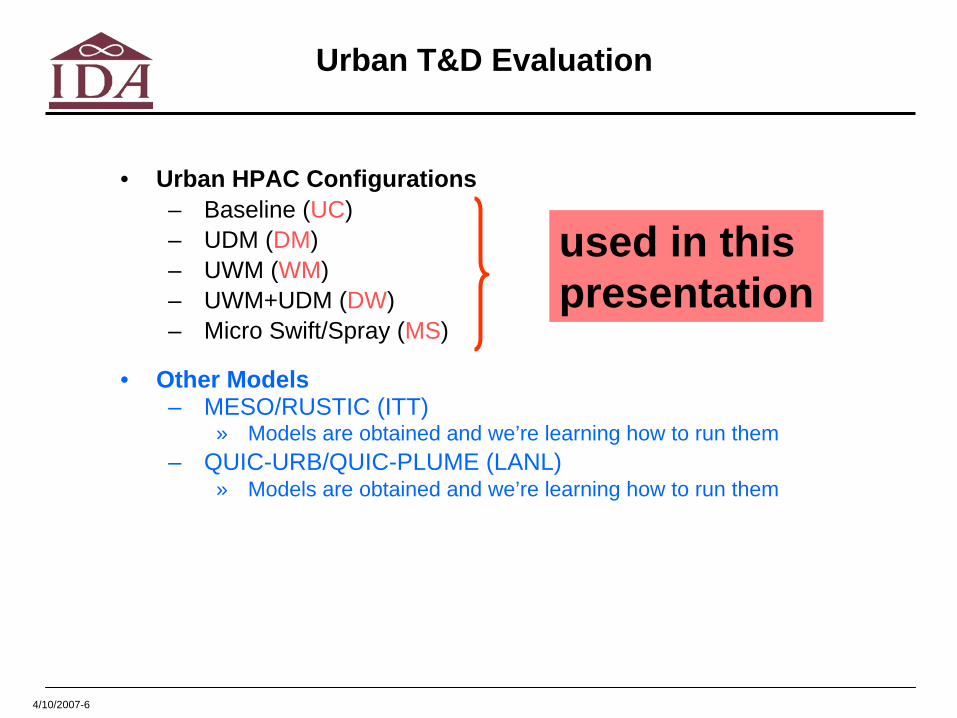
used in this presentation
4/10/2007-7
Status
• To date, we have used over 50 separate MET input options to create HPAC predictions
– Some of these MET inputs were created for us by» NCAR (RTFDDA, VLAS)» NGIC (GCAT)» DSTO-Australia (CCAM)
– These include “low-altitude” MET thresholding for SODARs
• Created over 2000 HPAC projects– Developed “batching” capability to run multiple Urban HPAC
projects without GUI» Based in ICE
– Total number of HPAC runs is well over 3000!» Large number of projects were run more than once
• MSS projects• SODARs and Profiler MET projects
• Statistical and graphical evaluations near completion
4/10/2007-8
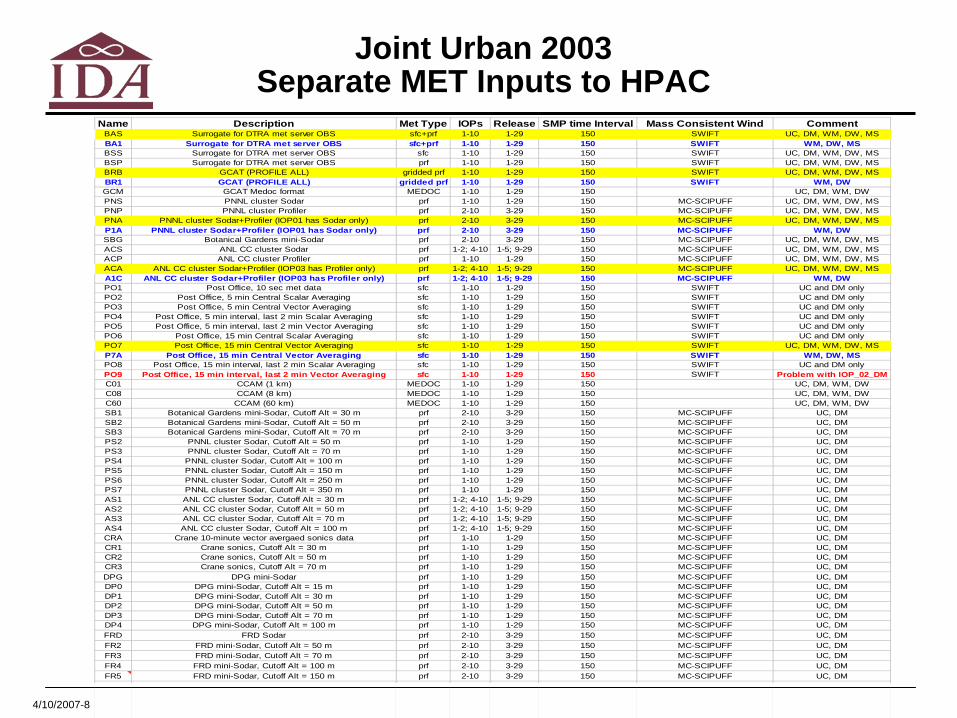
Joint Urban 2003 Separate MET Inputs to HPAC
Name Description Met Type IOPs Release SMP time Interval Mass Consistent Wind CommentBAS Surrogate for DTRA met server OBS sfc+prf 1-10 1-29 150 SWIFT UC, DM, WM, DW, MSBA1 Surrogate for DTRA met server OBS sfc+prf 1-10 1-29 150 SWIFT WM, DW, MSBSS Surrogate for DTRA met server OBS sfc 1-10 1-29 150 SWIFT UC, DM, WM, DW, MSBSP Surrogate for DTRA met server OBS prf 1-10 1-29 150 SWIFT UC, DM, WM, DW, MSBRB GCAT (PROFILE ALL) gridded prf 1-10 1-29 150 SWIFT UC, DM, WM, DW, MSBR1 GCAT (PROFILE ALL) gridded prf 1-10 1-29 150 SWIFT WM, DWGCM GCAT Medoc format MEDOC 1-10 1-29 150 UC, DM, WM, DWPNS PNNL cluster Sodar prf 1-10 1-29 150 MC-SCIPUFF UC, DM, WM, DW, MSPNP PNNL cluster Profiler prf 2-10 3-29 150 MC-SCIPUFF UC, DM, WM, DW, MSPNA PNNL cluster Sodar+Profiler (IOP01 has Sodar only) prf 2-10 3-29 150 MC-SCIPUFF UC, DM, WM, DW, MSP1A PNNL cluster Sodar+Profiler (IOP01 has Sodar only) prf 2-10 3-29 150 MC-SCIPUFF WM, DWSBG Botanical Gardens mini-Sodar prf 2-10 3-29 150 MC-SCIPUFF UC, DM, WM, DW, MSACS ANL CC cluster Sodar prf 1-2; 4-10 1-5; 9-29 150 MC-SCIPUFF UC, DM, WM, DW, MSACP ANL CC cluster Profiler prf 1-10 1-29 150 MC-SCIPUFF UC, DM, WM, DW, MSACA ANL CC cluster Sodar+Profiler (IOP03 has Profiler only) prf 1-2; 4-10 1-5; 9-29 150 MC-SCIPUFF UC, DM, WM, DW, MSA1C ANL CC cluster Sodar+Profiler (IOP03 has Profiler only) prf 1-2; 4-10 1-5; 9-29 150 MC-SCIPUFF WM, DWPO1 Post Office, 10 sec met data sfc 1-10 1-29 150 SWIFT UC and DM onlyPO2 Post Office, 5 min Central Scalar Averaging sfc 1-10 1-29 150 SWIFT UC and DM onlyPO3 Post Office, 5 min Central Vector Averaging sfc 1-10 1-29 150 SWIFT UC and DM onlyPO4 Post Office, 5 min interval, last 2 min Scalar Averaging sfc 1-10 1-29 150 SWIFT UC and DM onlyPO5 Post Office, 5 min interval, last 2 min Vector Averaging sfc 1-10 1-29 150 SWIFT UC and DM onlyPO6 Post Office, 15 min Central Scalar Averaging sfc 1-10 1-29 150 SWIFT UC and DM onlyPO7 Post Office, 15 min Central Vector Averaging sfc 1-10 1-29 150 SWIFT UC, DM, WM, DW, MSP7A Post Office, 15 min Central Vector Averaging sfc 1-10 1-29 150 SWIFT WM, DW, MSPO8 Post Office, 15 min interval, last 2 min Scalar Averaging sfc 1-10 1-29 150 SWIFT UC and DM onlyPO9 Post Office, 15 min interval, last 2 min Vector Averaging sfc 1-10 1-29 150 SWIFT Problem with IOP_02_DMC01 CCAM (1 km) MEDOC 1-10 1-29 150 UC, DM, WM, DWC08 CCAM (8 km) MEDOC 1-10 1-29 150 UC, DM, WM, DWC60 CCAM (60 km) MEDOC 1-10 1-29 150 UC, DM, WM, DWSB1 Botanical Gardens mini-Sodar, Cutoff Alt = 30 m prf 2-10 3-29 150 MC-SCIPUFF UC, DMSB2 Botanical Gardens mini-Sodar, Cutoff Alt = 50 m prf 2-10 3-29 150 MC-SCIPUFF UC, DMSB3 Botanical Gardens mini-Sodar, Cutoff Alt = 70 m prf 2-10 3-29 150 MC-SCIPUFF UC, DMPS2 PNNL cluster Sodar, Cutoff Alt = 50 m prf 1-10 1-29 150 MC-SCIPUFF UC, DMPS3 PNNL cluster Sodar, Cutoff Alt = 70 m prf 1-10 1-29 150 MC-SCIPUFF UC, DMPS4 PNNL cluster Sodar, Cutoff Alt = 100 m prf 1-10 1-29 150 MC-SCIPUFF UC, DMPS5 PNNL cluster Sodar, Cutoff Alt = 150 m prf 1-10 1-29 150 MC-SCIPUFF UC, DMPS6 PNNL cluster Sodar, Cutoff Alt = 250 m prf 1-10 1-29 150 MC-SCIPUFF UC, DMPS7 PNNL cluster Sodar, Cutoff Alt = 350 m prf 1-10 1-29 150 MC-SCIPUFF UC, DMAS1 ANL CC cluster Sodar, Cutoff Alt = 30 m prf 1-2; 4-10 1-5; 9-29 150 MC-SCIPUFF UC, DMAS2 ANL CC cluster Sodar, Cutoff Alt = 50 m prf 1-2; 4-10 1-5; 9-29 150 MC-SCIPUFF UC, DMAS3 ANL CC cluster Sodar, Cutoff Alt = 70 m prf 1-2; 4-10 1-5; 9-29 150 MC-SCIPUFF UC, DMAS4 ANL CC cluster Sodar, Cutoff Alt = 100 m prf 1-2; 4-10 1-5; 9-29 150 MC-SCIPUFF UC, DMCRA Crane 10-minute vector avergaed sonics data prf 1-10 1-29 150 MC-SCIPUFF UC, DMCR1 Crane sonics, Cutoff Alt = 30 m prf 1-10 1-29 150 MC-SCIPUFF UC, DMCR2 Crane sonics, Cutoff Alt = 50 m prf 1-10 1-29 150 MC-SCIPUFF UC, DMCR3 Crane sonics, Cutoff Alt = 70 m prf 1-10 1-29 150 MC-SCIPUFF UC, DMDPG DPG mini-Sodar prf 1-10 1-29 150 MC-SCIPUFF UC, DMDP0 DPG mini-Sodar, Cutoff Alt = 15 m prf 1-10 1-29 150 MC-SCIPUFF UC, DMDP1 DPG mini-Sodar, Cutoff Alt = 30 m prf 1-10 1-29 150 MC-SCIPUFF UC, DMDP2 DPG mini-Sodar, Cutoff Alt = 50 m prf 1-10 1-29 150 MC-SCIPUFF UC, DMDP3 DPG mini-Sodar, Cutoff Alt = 70 m prf 1-10 1-29 150 MC-SCIPUFF UC, DMDP4 DPG mini-Sodar, Cutoff Alt = 100 m prf 1-10 1-29 150 MC-SCIPUFF UC, DMFRD FRD Sodar prf 2-10 3-29 150 MC-SCIPUFF UC, DMFR2 FRD mini-Sodar, Cutoff Alt = 50 m prf 2-10 3-29 150 MC-SCIPUFF UC, DMFR3 FRD mini-Sodar, Cutoff Alt = 70 m prf 2-10 3-29 150 MC-SCIPUFF UC, DMFR4 FRD mini-Sodar, Cutoff Alt = 100 m prf 2-10 3-29 150 MC-SCIPUFF UC, DMFR5 FRD mini-Sodar, Cutoff Alt = 150 m prf 2-10 3-29 150 MC-SCIPUFF UC, DM
4/10/2007-9
SWIFT, MC-SCIPUFF Processed MET and MEDOC Formatted MET
• For MET input options that involve inputs that SWIFT was originally designed for, we used SWIFT to obtain mass consistent winds
– “DTRA Server MET” like inputs» Surface station(s) .SFC and Upper Air profile(s) .PRF
– Regularly spatio-temporally gridded data» Forecasts by MM5» These include GCAT “PROFILE ALL” and RTFFDA from NCAR
• For MET input options that use JU2003 wind-profile instruments, we used MC-SCIPUFF to obtain mass consistent winds
– Profilers– (mini) Sodars– Crane Sonics
» It is possible that Crane Sonics would be compatible with SWIFT, but then results would be incompatible with SODARs
• For MET input options that would use LIDAR data, we plan to use SWIFT– Running of NCAR’s VLAS outputs on IOP 2 seems to confirm this
• CCAM MET (DSTO-Australia) is available only in MEDOC format– Obtained and run GCAT MEDOC formatted MET predictions for comparisons
with CCAM
• This leads to a caution when comparing different MET options
4/10/2007-10
Urban Mode / MET Comparisons Notation for MET Input Options
• ACA: ANL (downwind) Sodar + Profiler
• PNA: PNNL (upwind) Sodar + Profiler
• PO7: Post Office rooftop station
• BAS: Baseline (airport) Surface + Profiler
• BRB: GCAT “Profile All”
• SBG: Botanical Gardens mini-Sodar
4/10/2007-11
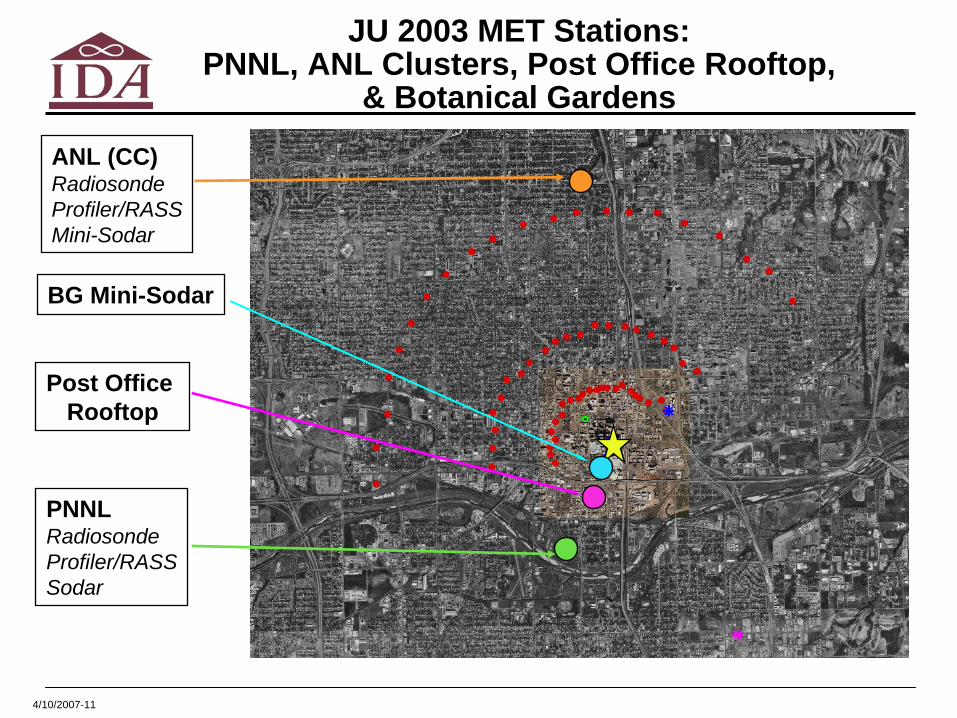
JU 2003 MET Stations: PNNL, ANL Clusters, Post Office Rooftop,
& Botanical Gardens
ANL (CC)RadiosondeProfiler/RASSMini-Sodar
PNNLRadiosondeProfiler/RASSSodar
BG Mini-Sodar
Post Office Rooftop
4/10/2007-12
Baseline MET Within 30km of Releases
• Surface– Source: University of Utah
Mesonet (MesoWest)» Stations: KOUN, KOKC, KPWA,
KTIK
• Upper Air– Source: University of Wyoming– Station: KOUN
Red – SurfaceBlue – ProfileBlack - Releases
28 km
12 km
14 km
14 km
Prevailing wind speed is from South
4/10/2007-13
Standard Statistics and 2D Measures of Effectiveness
∑∑
+
−=
i
io
ip
i
io
ip
CC
CCNAD
)(
||
)()(
)()(
∑∑
+
−=
i
io
ip
i
io
ip
CC
CCFB
)(5.0
)(
)()(
)()(
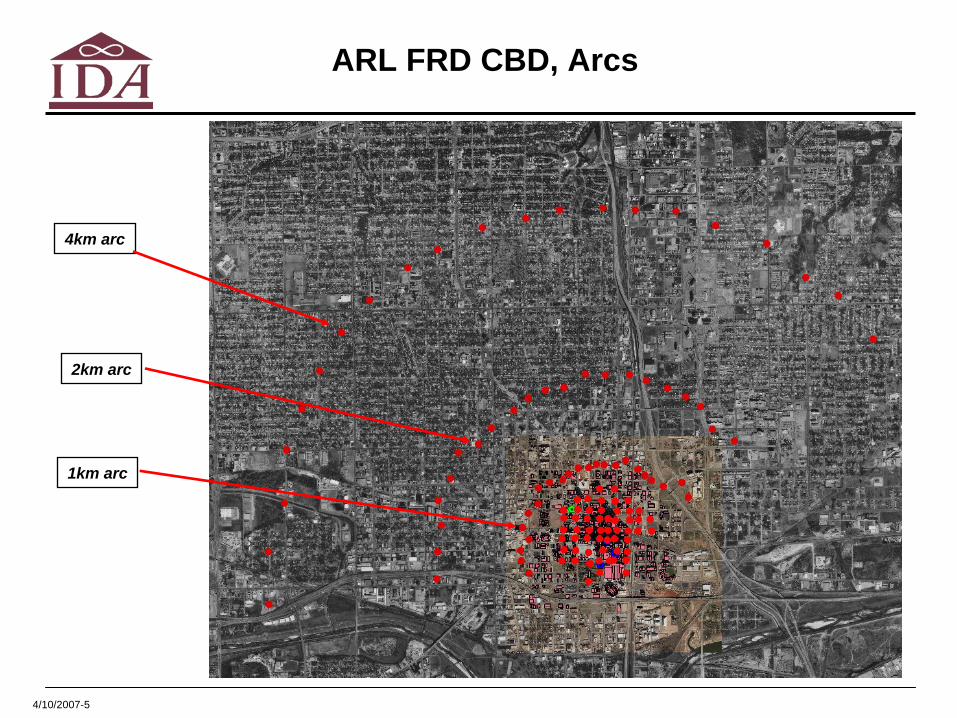
• Calculated stats (13 types) and 2D MOEs for 30-min average concentrations for all available ARL FRD samplers
• Considered 29 continuous releases (10 IOPs)
• Stats and MOEs calculated for each 2-hr observation period, then averaged over releases
– Separate averages for day and night releases
• MOE: 250 ppt threshold “hazard area”
• Stats for this discussion:Comparisons done for:1) day/night2) all surface samplers, CBD, all
arcs, each arc3) each of eight 15-minute periods,
each of four 30-minute periods, each of two 1-hour periods, all 30-minute periods , and all 2- hour periods
4) In total, ~82,000 metrics computed
4/10/2007-14
Results
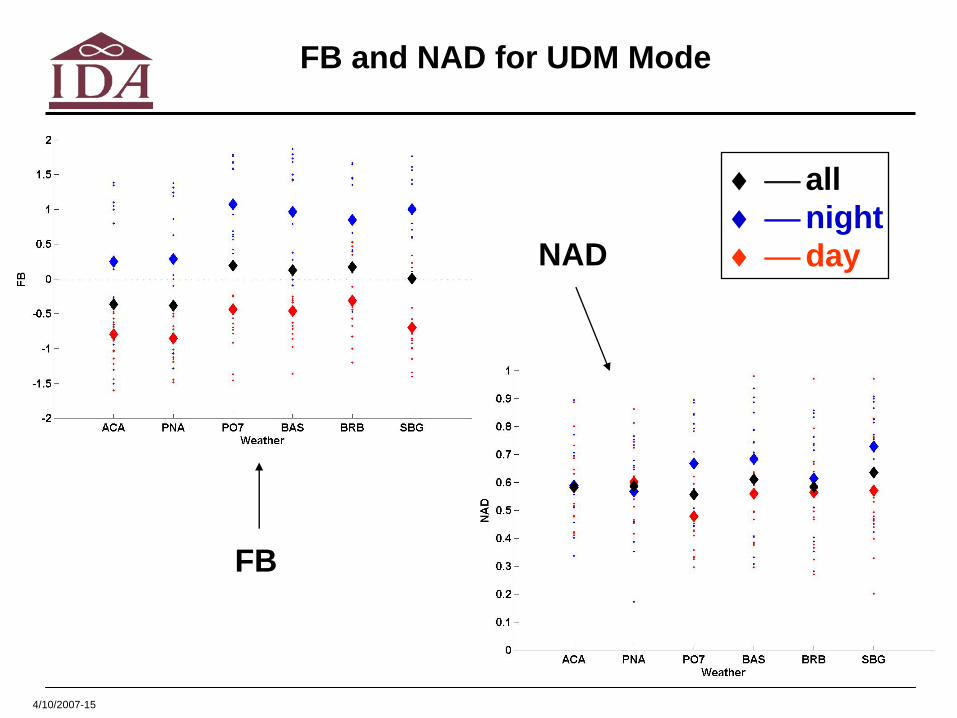
• Night vs. Day discrepancy for UC, UDM, UWM, UDM+UDW modes– Significant differences in model performance depending on time of day– Daytime performance is better than nighttime for MET input options with a large
day – night discrepancy (Baseline, GCAT, PO, BG)» For small discrepancies (ANL, PNNL): night slightly better than day
– UC, UDM, UWM, and UDM+UDW all tend to under-predict during the day and over-predict at night (across nearly all MET input options)
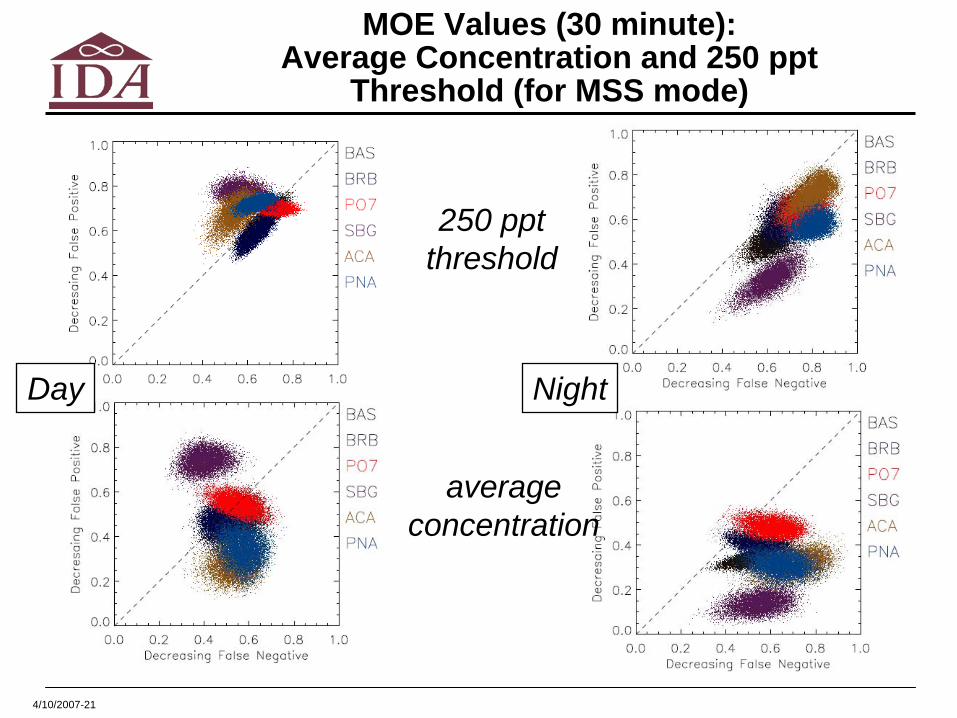
• Little day – night discrepancy for MSS mode– MSS tends to over-predict during both day and night– MSS day and night results are similar (neither has clearly better results)
• Model performance– Daytime model performance difficult to rank– UDM performs better than UC at night for PNA, Baseline, GCAT, BG– MSS performs better than UC at night for PO, Baseline, BG– MSS has less prediction bias than UC, UDM at night for PO, Baseline, GCAT
» During the day, bias is also small (comparable to UDM+UDW with the opposite sign)– UWM does not appear to enhance performance over UDM
• MET input options– Post Office, GCAT, Baseline met perform slightly better than ANL and PNNL MET
during the day but over-predict worse at night for UC, UDM, UWM, UDM+UDW– ANL MET seems to be the best overall performer at night (small margin)– PO MET seems to be the best overall performer during the day (small margin)– Botanical Gardens mini-Sodar is the worst performer at night
4/10/2007-15
FB and NAD for UDM Mode
♦ ⎯ all♦ ⎯ night♦ ⎯ dayNAD
FB
4/10/2007-16
FB and NAD for MSS Mode
♦ ⎯ all♦ ⎯ night♦ ⎯ dayNAD
FB
4/10/2007-17
MOE Values (30 minute): Average Concentration and 250 ppt Threshold (for Baseline MET Input Option)
250 ppt threshold
averageconcentration
Day Night
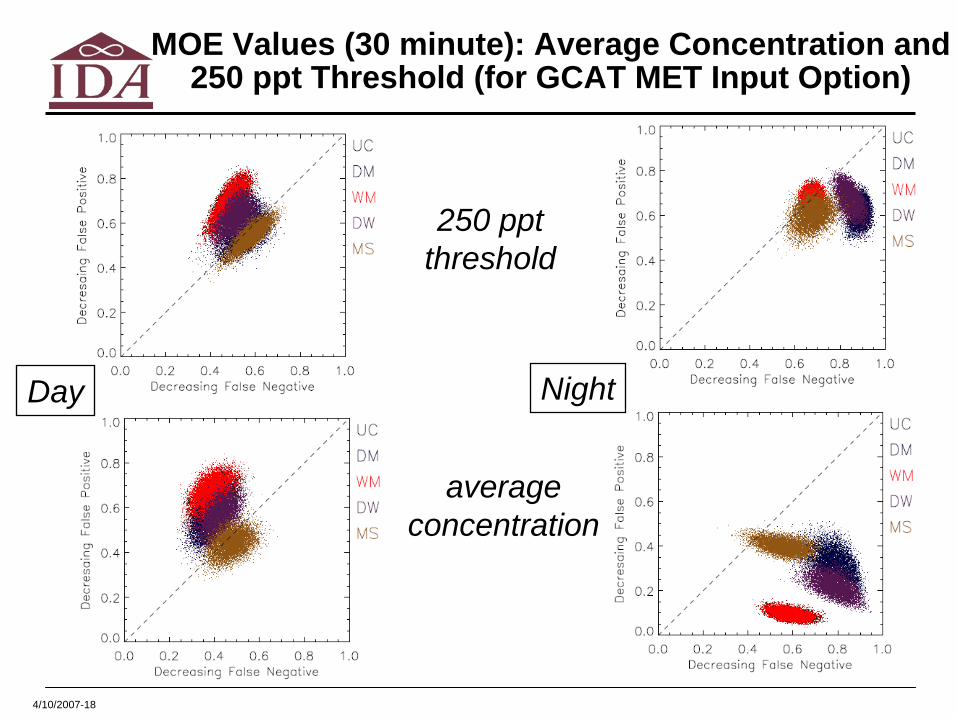
4/10/2007-18
MOE Values (30 minute): Average Concentration and 250 ppt Threshold (for GCAT MET Input Option)
250 ppt threshold
averageconcentration
Day Night
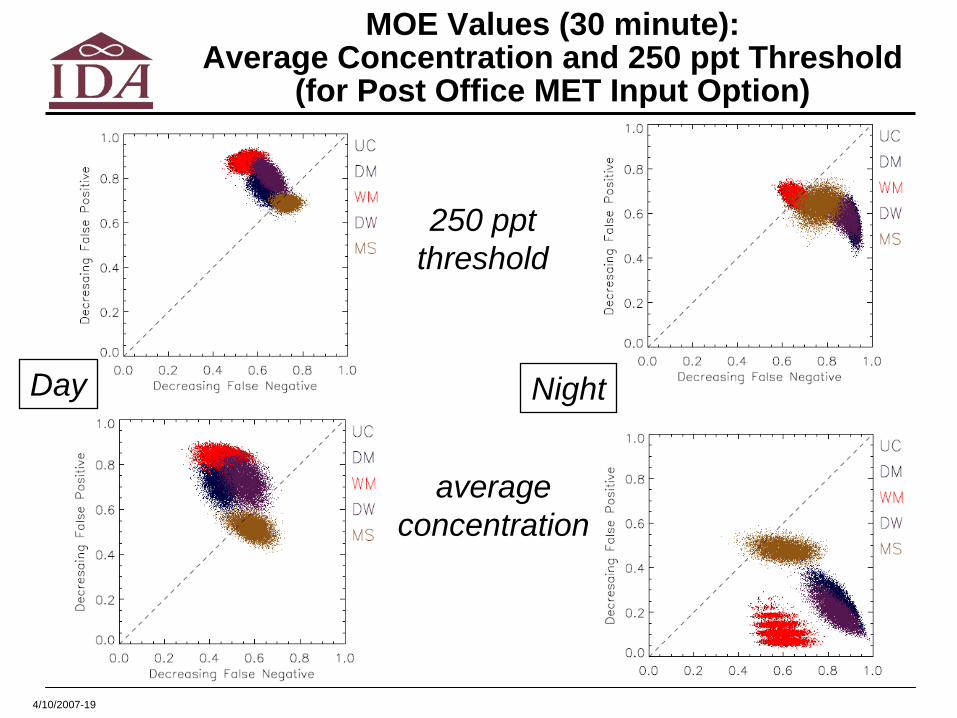
4/10/2007-19
MOE Values (30 minute): Average Concentration and 250 ppt Threshold
(for Post Office MET Input Option)
250 ppt threshold
averageconcentration
Day Night
4/10/2007-20
MOE Values (30 minute): Average Concentration and 250 ppt
Threshold (for UDM mode)
250 ppt threshold
averageconcentration
Day Night
4/10/2007-21
MOE Values (30 minute): Average Concentration and 250 ppt
Threshold (for MSS mode)
250 ppt threshold
averageconcentration
Day Night
4/10/2007-22
Results
• Night vs. Day discrepancy for UC, UDM, UWM, UDM+UDW modes– Significant differences in model performance depending on time of day– Daytime performance is better than nighttime for MET input options with a large
day – night discrepancy (Baseline, GCAT, PO, BG)» For small discrepancies (ANL, PNNL): night slightly better than day?
– UC, UDM, UWM, and UDM+UDW all tend to underpredict during the day and overpredict at night (across nearly all MET input options)
• Little day – night discrepancy for MSS mode– MSS tends to overpredict during both day and night– MSS day and night results are similar (neither has clearly better results)
• Model performance– Daytime model performance difficult to rank– UDM performs better than UC at night for PNA, Baseline, GCAT, BG– MSS performs better than UC at night for PO, Baseline, BG– MSS has less prediction bias than UC, UDM at night for PO, Baseline, GCAT
» During the day, bias is also small (comparable to UDM+UDW with the opposite sign)– UWM does not appear to enhance performance over UDM
• Met inputs– Post Office, GCAT, Baseline met perform slightly better than ANL and PNNL MET
during the day but overpredict worse at night for UC, UDM, UWM, UDM+UDW– ANL MET seems to be the best overall performer at night (small margin)– PO MET seems to be the best overall performer during the day (small margin)– Botanical Gardens mini-Sodar is the worst performer at night
4/10/2007-23
Altitude Met Thresholding
4/10/2007-24
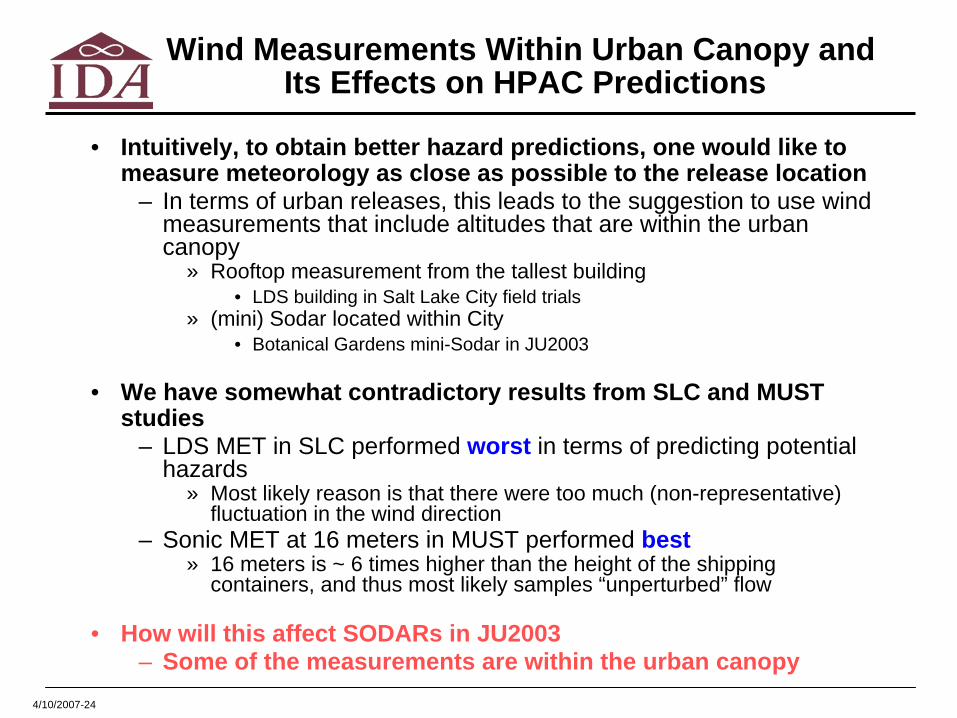
Wind Measurements Within Urban Canopy and Its Effects on HPAC Predictions
• Intuitively, to obtain better hazard predictions, one would like to measure meteorology as close as possible to the release location
– In terms of urban releases, this leads to the suggestion to use wind measurements that include altitudes that are within the urban canopy
» Rooftop measurement from the tallest building • LDS building in Salt Lake City field trials
» (mini) Sodar located within City• Botanical Gardens mini-Sodar in JU2003
• We have somewhat contradictory results from SLC and MUST studies
– LDS MET in SLC performed worst in terms of predicting potential hazards
» Most likely reason is that there were too much (non-representative) fluctuation in the wind direction
– Sonic MET at 16 meters in MUST performed best» 16 meters is ~ 6 times higher than the height of the shipping
containers, and thus most likely samples “unperturbed” flow
• How will this affect SODARs in JU2003– Some of the measurements are within the urban canopy
4/10/2007-25
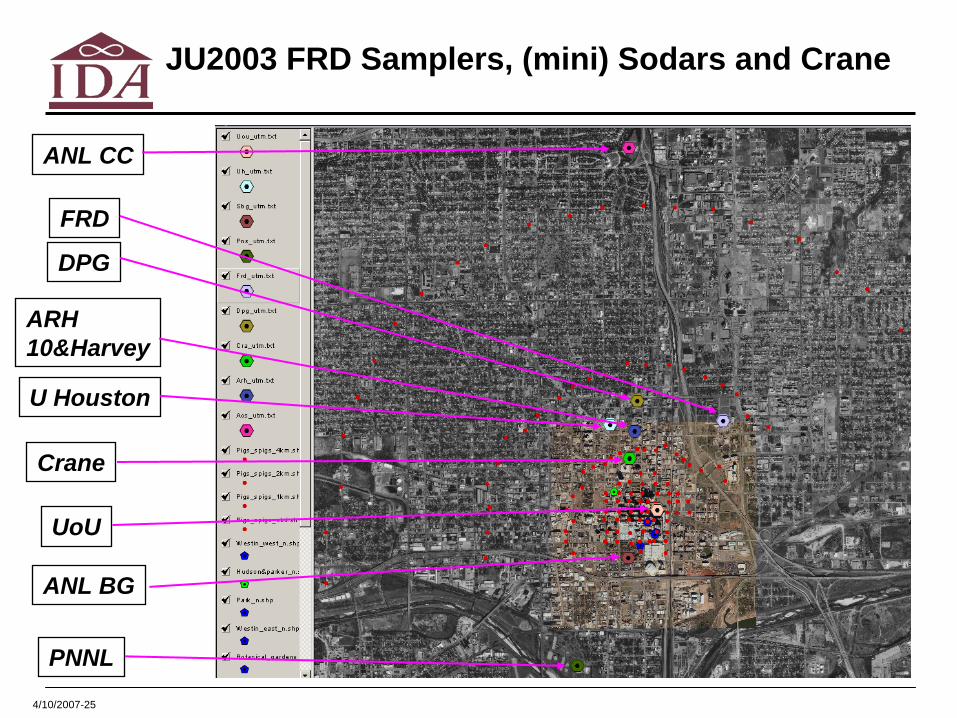
JU2003 FRD Samplers, (mini) Sodars and Crane
ANL CC
PNNL
UoU
ANL BG
Crane
U Houston
ARH10&Harvey
FRD
DPG
4/10/2007-26
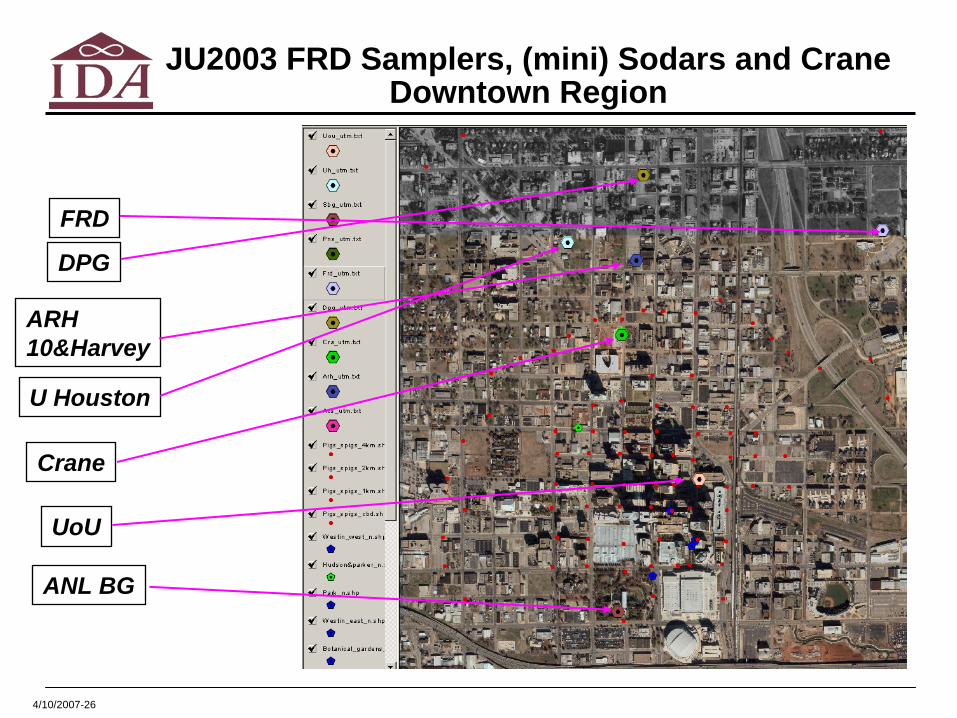
JU2003 FRD Samplers, (mini) Sodars and Crane Downtown Region
UoU
ANL BG
Crane
U Houston
ARH10&Harvey
FRD
DPG
4/10/2007-27
ANL BG and PNNL (mini) Sodar MOE Plots
Differences between night and day predictions / Night results seems to be significantly degraded with respect to day predictions
Botanical Gardens mini-Sodar PNNL Sodar
250 ppt threshold
averageconcentration
4/10/2007-28
ANL BG mini-Sodar Profiles
At night, low altitudewinds are significantlydifferent from higher altitude
4/10/2007-29
PNNL Sodar Profiles
At night, low altitudewinds are significantlydifferent from higher altitude
Consider effects on URBAN HPAC predictions byremoving low lever wind vectors
4/10/2007-30
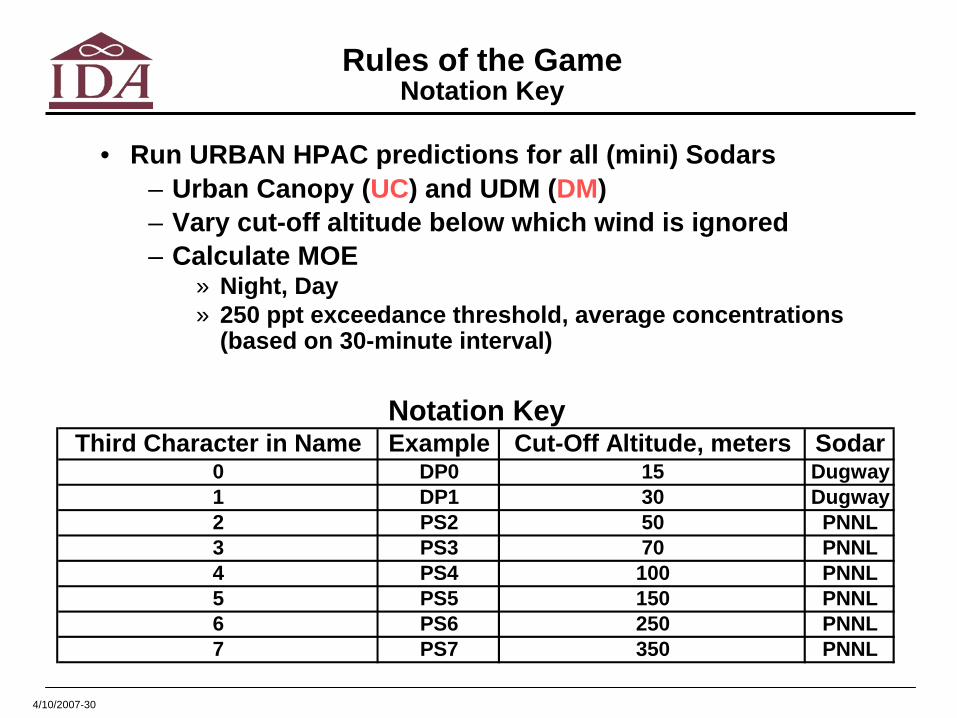
Rules of the Game Notation Key
• Run URBAN HPAC predictions for all (mini) Sodars– Urban Canopy (UC) and UDM (DM)– Vary cut-off altitude below which wind is ignored– Calculate MOE
» Night, Day» 250 ppt exceedance threshold, average concentrations
(based on 30-minute interval)
Third Character in Name Example Cut-Off Altitude, meters Sodar0 DP0 15 Dugway1 DP1 30 Dugway2 PS2 50 PNNL3 PS3 70 PNNL4 PS4 100 PNNL5 PS5 150 PNNL6 PS6 250 PNNL7 PS7 350 PNNL
Notation Key
4/10/2007-31
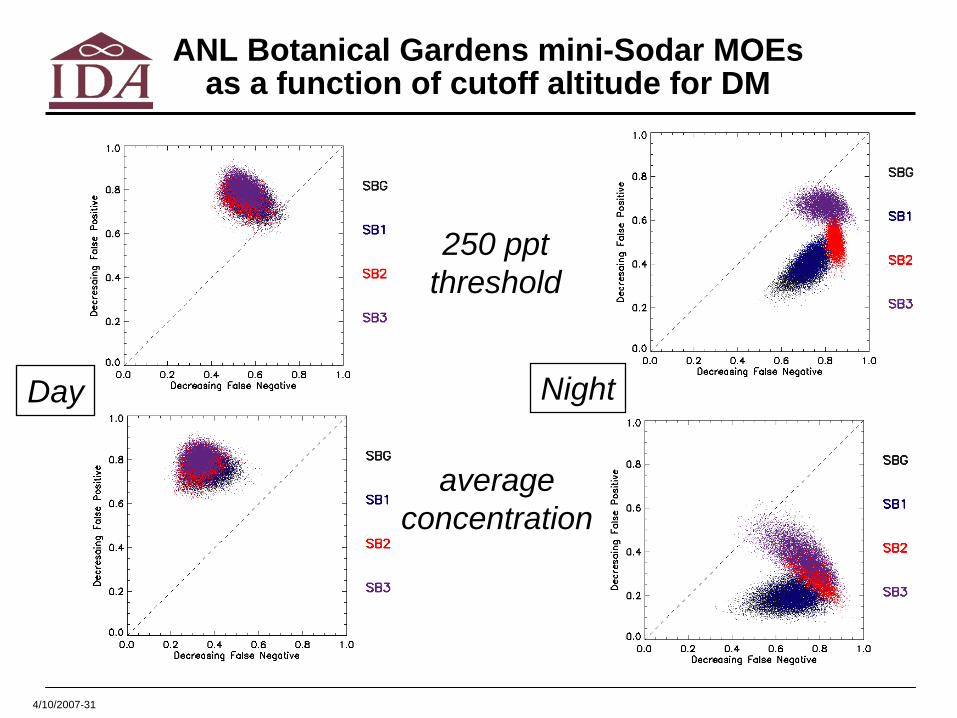
ANL Botanical Gardens mini-Sodar MOEs as a function of cutoff altitude for DM
250 ppt threshold
averageconcentration
Day Night
4/10/2007-32
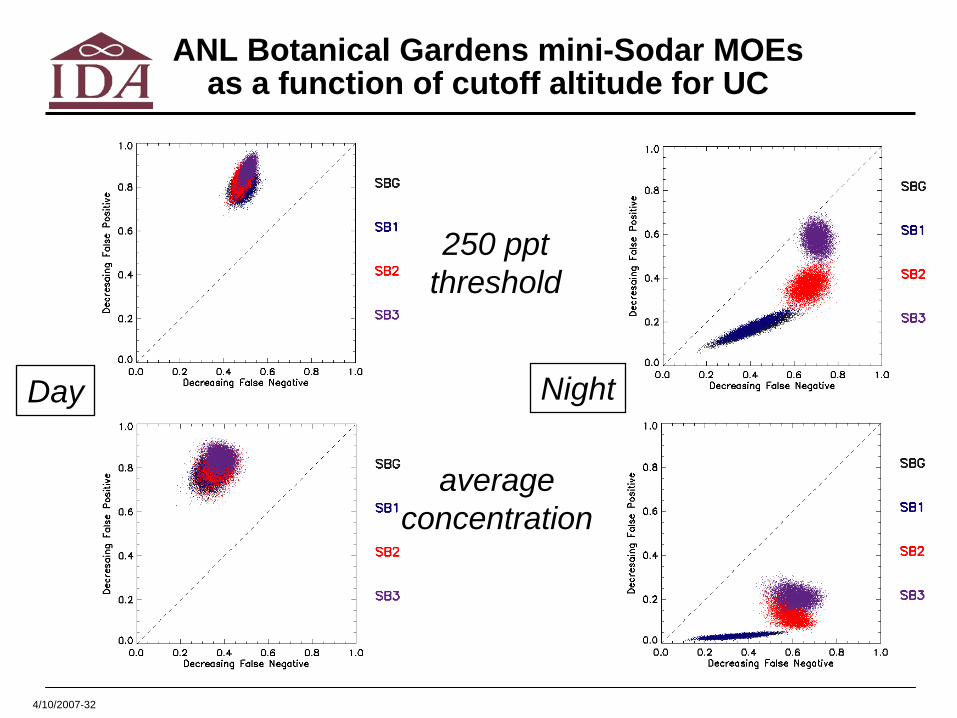
ANL Botanical Gardens mini-Sodar MOEs as a function of cutoff altitude for UC
250 ppt threshold
averageconcentration
Day Night
4/10/2007-33
PNNL Sodar MOEs as a function of cutoff altitude for DM
250 ppt threshold
averageconcentration
Day Night
4/10/2007-34
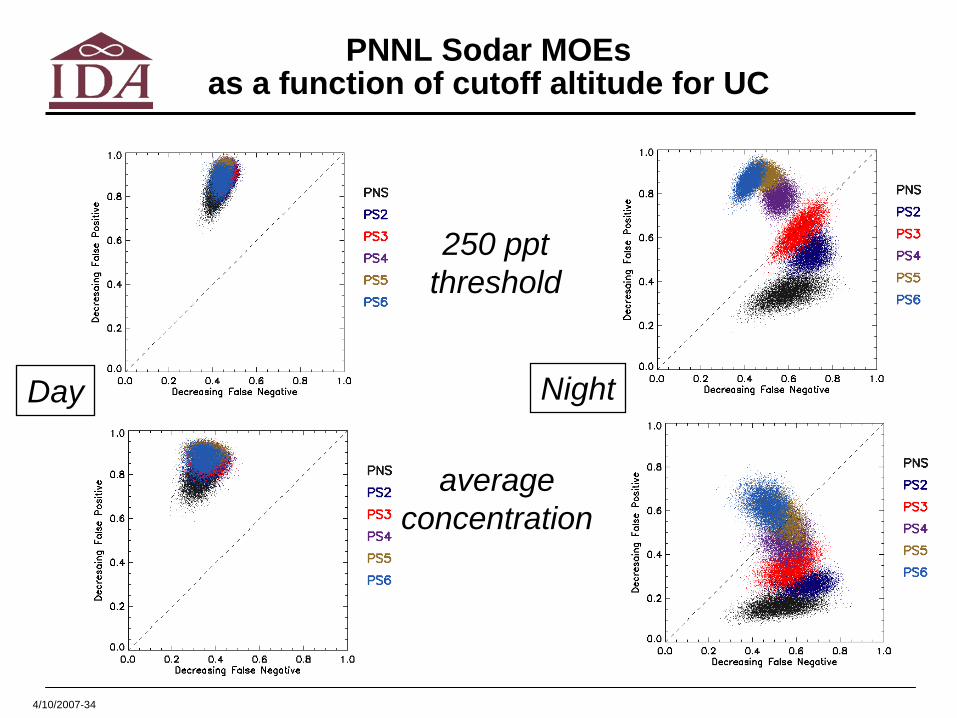
PNNL Sodar MOEs as a function of cutoff altitude for UC
250 ppt threshold
averageconcentration
Day Night
4/10/2007-35
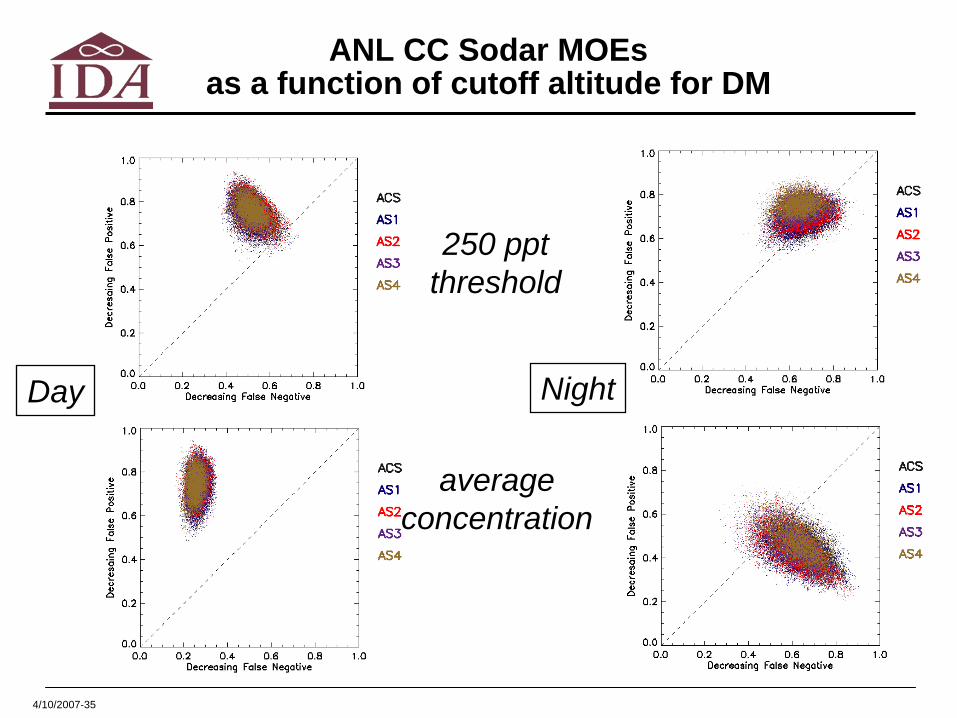
ANL CC Sodar MOEs as a function of cutoff altitude for DM
250 ppt threshold
averageconcentration
Day Night
4/10/2007-36
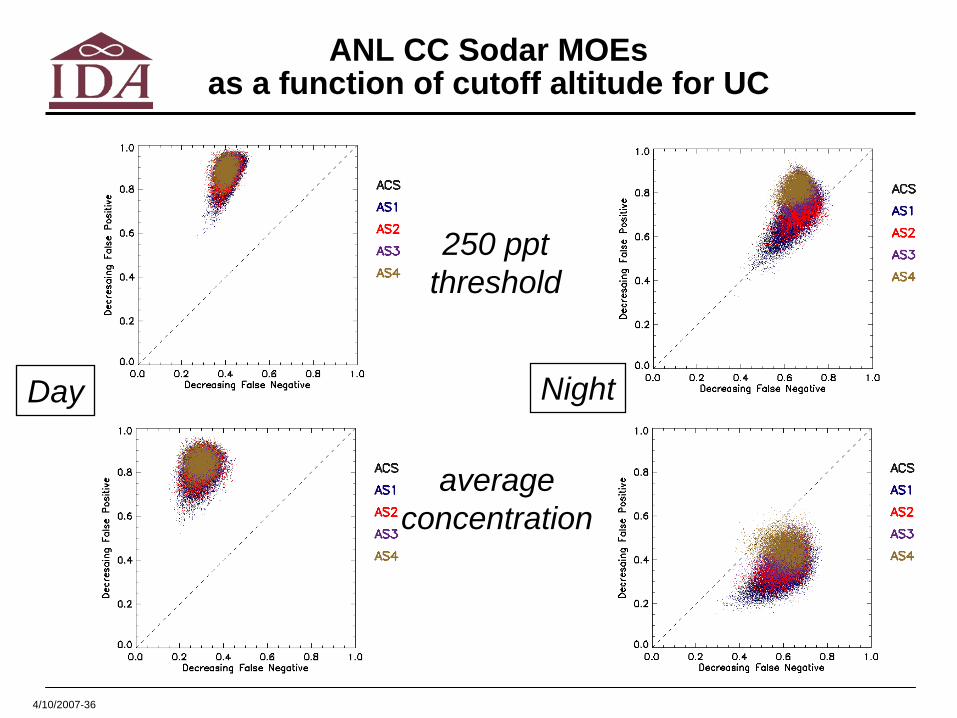
ANL CC Sodar MOEs as a function of cutoff altitude for UC
250 ppt threshold
averageconcentration
Day Night
4/10/2007-37
Conclusions
• At night, (mini) Sodar measurement below ~70-100 meters should not be used when running URBAN HPAC predictions for JU2003
– This is consistent for all (mini) sodars that have enough altitude data collected
• There is something going on in Oklahoma City at night that seems to create different flow at low altitude vs. higher altitude
– Seems to have a “separated” flow in the city from outside flow– This seems to be consistent for all (mini) sodars that have
enough altitude data collected– Could be similar to changing stability category from
Unstable/Neutral to Stable
Are (mini) Sodars prone to miscalculate winds atlow altitude at night?
4/10/2007-38
Are there exceptions?
• Crane Sonics produce different behavior as low altitude winds are removed
Botanical Gardens mini-Sodar
Crane Sonics
• Crane Sonics wind data itself is different from mini (Sodars)- No high altitude data (above 85 meters)- Altitude data is sparce
4/10/2007-39
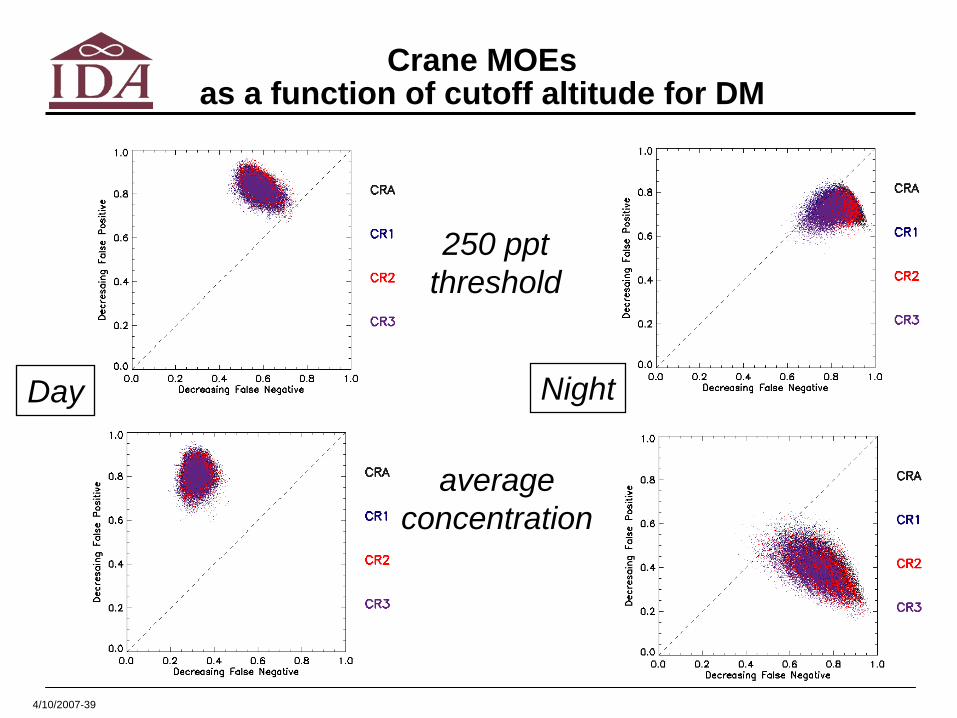
Crane MOEs as a function of cutoff altitude for DM
250 ppt threshold
averageconcentration
Day Night
4/10/2007-40
Future Plans
• Work in progress
• Will try to look at additional wind profile data– Couple of wind profilers, but lowest altitude is ~80 meters
• Would like to see if similar conclusions holds with other urban models
– MESO/RUSTIC– QUIC-URB/QUIC-PLUME
• Will examine Lidar and other sources of real-time data
4/10/2007-41
MEDOC vs PROFILE ALL met input formats
Work in Progress …
4/10/2007-42
CCAM Met
• CCAM is an Australian wind field prediction model developed by the Australia's Commonwealth Scientific and Industrial Research Organisation (CSIRO)
– In 2005, Ralph Gailis (from Defense Science and Technology Organization (DSTO)) asked if we could use CCAM to drive HPAC JU2003 predictions to compare with observations and other wind models
• Received CCAM MET in May 2006– Files are MEDOC files
» Cannot be used with MSS
• Run Urban HPAC predictions using CCAM MET input options
• Observed that predictions based on CCAM behave quite differently from predictions based on other met options
For MET files in MEDOC format HPAC runs very fast
4/10/2007-43
Which MET input Options Should be Used for Comparison with CCAM
• Originally, we wanted to use GCAT (PROFILE ALL) and BAS (nearby airport observations) MET input options for comparison
– Unfortunately, both of these use SWIFT first to obtain mass- consistent winds that could produce significant effects on resulting predictions
» Incidentally, we run “low-resolution” WM and DW configuration for Post Office rooftop met with MC-SCIPUFF instead of SWIFT, and we were quite “surprised” by the results
• Early GCAT files were in MEDOC format, so we decided to compare CCAM predictions to GCAT- MEDOC predictions
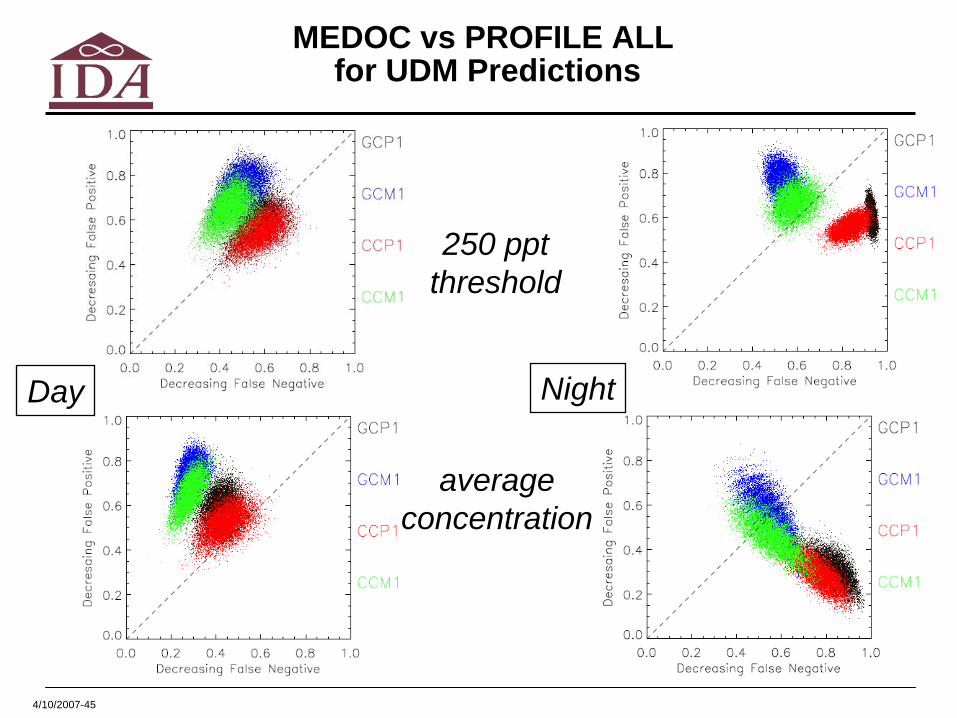
• Interestingly enough, GCAT MEDOC and PROFILE ALL MET input options produce quite differently behaving predictions
– GCAT MEDOC (GCM1) predictions seem to push simulant clouds much faster than GCAT PROFILE ALL (GCP1) predictions
» Observations support slower speeds
4/10/2007-44
MEDOC to PROFILE ALL Converter
• Contacted NGIC to find out what is going on with GCAT
• NGIC contacted GCAT developer (NCAR)
• As part of diagnostic, NCAR wrote a MEDOC to PROFILE ALL met converter and graciously offered source code to us
• We created 4 sets of predictions– GCM1 based on early GCAT MEDOC met input– GCP1 based on converted GCAT MEDOC met input– CCM1 based on CCAM 1 km MEDOC met input– CCP1 based on converted CCAM 1 km MEDOC met input
• Observed that MEDOC predictions are comparable to each other, but different from PROFILE ALL predictions
Note: For GCAT MEDOC files converter is not 1-to-1 because some temperature data was not recorded in the original MEDOC file
4/10/2007-45
MEDOC vs PROFILE ALL for UDM Predictions
250 ppt threshold
averageconcentration
Day Night
4/10/2007-46
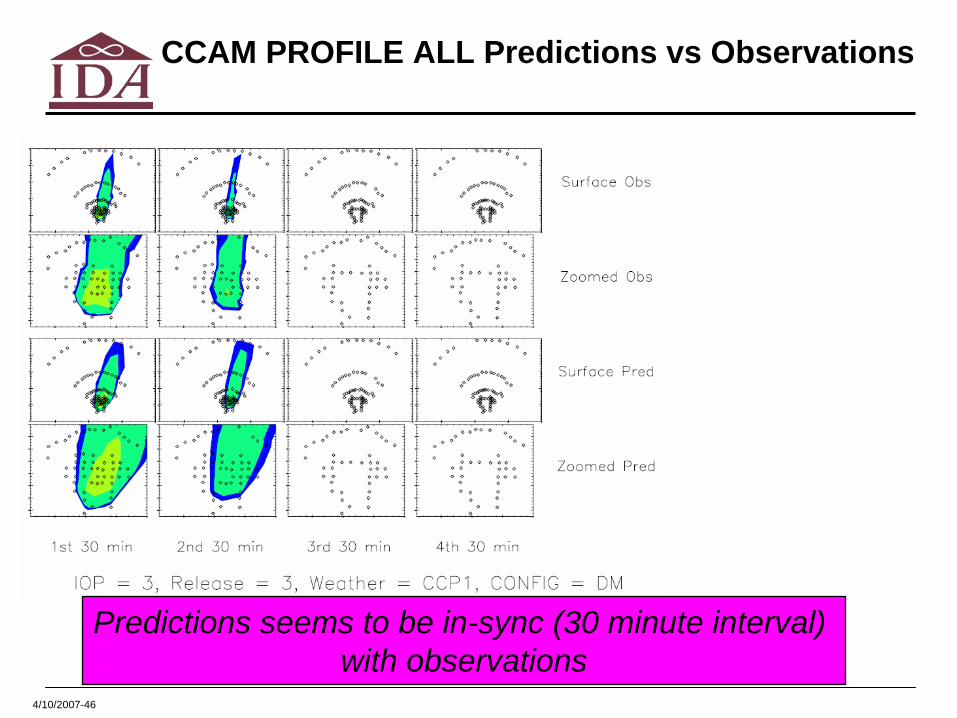
CCAM PROFILE ALL Predictions vs Observations
Predictions seems to be in-sync (30 minute interval) with observations
4/10/2007-47
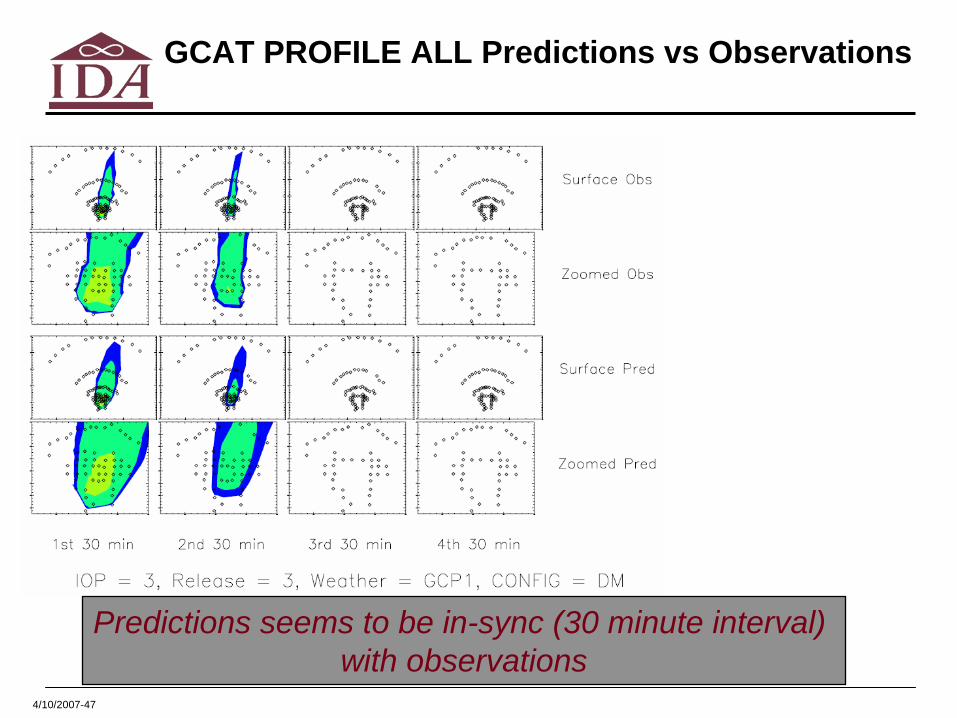
GCAT PROFILE ALL Predictions vs Observations
Predictions seems to be in-sync (30 minute interval) with observations
4/10/2007-48
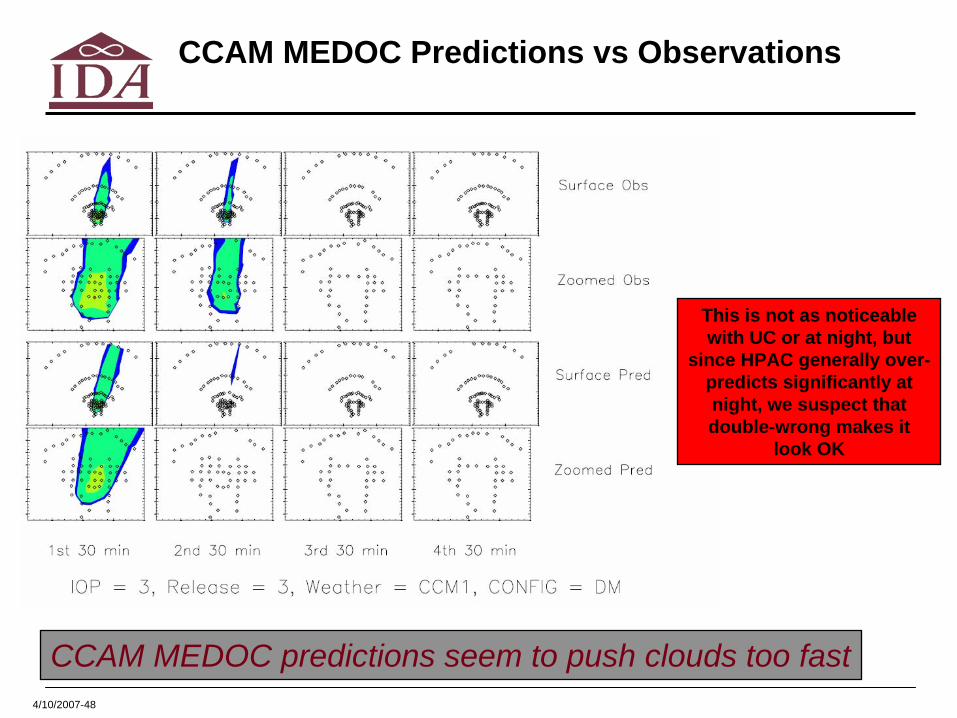
CCAM MEDOC Predictions vs Observations
CCAM MEDOC predictions seem to push clouds too fast
This is not as noticeable with UC or at night, but
since HPAC generally over- predicts significantly at night, we suspect that double-wrong makes it
look OK
4/10/2007-49
GCAT MEDOC Predictions vs Observations
GCAT MEDOC predictions seem to push clouds too fast
This is not as noticeable with UC or at night, but
since HPAC generally over- predicts significantly at night, we suspect that double-wrong makes it
look OK
4/10/2007-50
Conclusions and Future Work
• CCAM MEDOC and GCAT MEDOC winds seems to push clouds too fast
– Compared to SWIFT and MC-SCIPUFF processed MET– Some indications that this is also true for comparison with
observations» Daytime seems to show for 30-minute averaged concentrations» Nighttime is harder to see, but it might be due to compensating errors
• Over-prediction followed by faster “removal”
• GCAT and CCAM MEDOC and GCAT and CCAM PROFILE ALL MET input options produce significantly different predictions
– We really need to understand why this is happening» Does MEDOC MET always have this “problem” that might lead to
seemingly better predictions at night because of compensating errors?» MEDOC MET runs much faster on HPAC, thus there is a great interest in
using this MET for real-time hazard prediction» What does SWIFT (or MC-SCIPUFF) do to slow down T&D?
– Similarly, need to understand differences between SWIFT and MC- SCIPUFF
» MC-SCIPUFF is much faster running than SWIFT making it attractive to real-time hazard prediction
» Incidentally, we run “low-resolution” WM and DW configuration for Post Office rooftop met with MC-SCIPUFF instead of SWIFT, and we were quite “surprised” by the results which we speculate were resulting from compensating errors