Page 1
Page 1 of 16
INSTITUTE OF CHARTERED ACCOUNTANTS GHANA ADVANCED FINANCIAL REPORTING
SOLUTIONS- MAY 2012
Question 1
1 (A) Procedure for recognition and measurement of Impairment loss in a cash generating
unit
i. First t, to reduce the carrying amount of any goodwill
ii. Then to the other assets of the units pro-rata on the basis of the carrying amount of
each asset.
In allocating an impairment loss as stated above, an entity shall not reduce the carrying
amount of an asset below the highest of:
a. its fair value less cost to sell
b. Its value in use and
c. zero
(ii) Calculation of impairment loss
GHS ‘000
Purchase consideration 450
Less Net Asset Acquired (420)
Goodwill 30
Impairment Loss (450 – 405) = 45
Goodwill (30)
Intangible assets (70 – 60) (10)
Impairment loss to Income statement 40
Note: since the assets were valued at fair value less cost to sell (net selling price), they cannot
be reduced below the net selling price. Impairment loss to be recognized is GHS 40,000 of
the total of GHS 45,000
(iii). Net Assets as at August 1, 2011
Property, Plant & Equipment 340
Intangible asset 60
Trade receivables 50
Trade Payables (40)
410
Page 2
Page 2 of 16
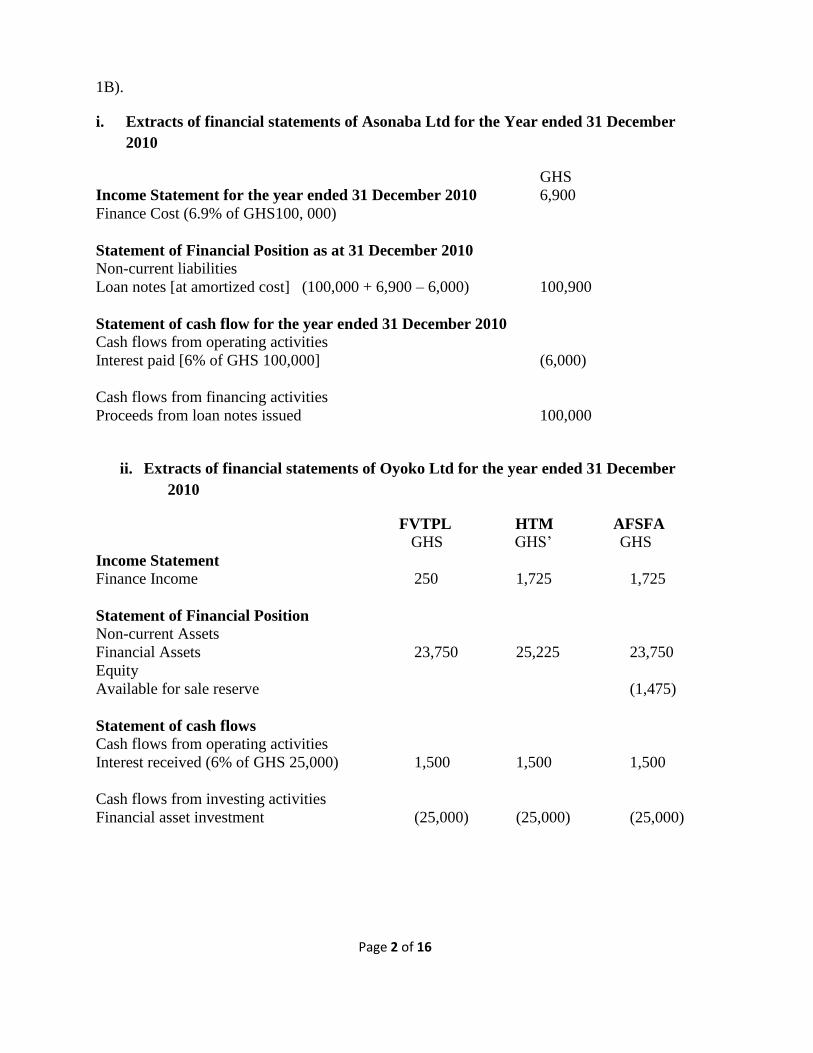
1B).
i. Extracts of financial statements of Asonaba Ltd for the Year ended 31 December
2010
GHS
Income Statement for the year ended 31 December 2010 6,900
Finance Cost (6.9% of GHS100, 000)
Statement of Financial Position as at 31 December 2010 Non-current liabilities
Loan notes [at amortized cost] (100,000 + 6,900 – 6,000) 100,900
Statement of cash flow for the year ended 31 December 2010 Cash flows from operating activities
Interest paid [6% of GHS 100,000] (6,000)
Cash flows from financing activities
Proceeds from loan notes issued 100,000
ii. Extracts of financial statements of Oyoko Ltd for the year ended 31 December
2010
FVTPL HTM AFSFA
GHS GHS’ GHS
Income Statement Finance Income 250 1,725 1,725
Statement of Financial Position Non-current Assets
Financial Assets 23,750 25,225 23,750
Equity
Available for sale reserve (1,475)
Statement of cash flows Cash flows from operating activities
Interest received (6% of GHS 25,000) 1,500 1,500 1,500
Cash flows from investing activities
Financial asset investment (25,000) (25,000) (25,000)
Page 3
Page 3 of 16
Workings
Fair value through profit or loss [FVTPL]
GHS GHS
Interest received (6% of GHS 25,000) 1,500
Initial Amount recognized [250 x GHS100] 25,000
Fair value at year end [250 x GHS 95 (23,750)
Reduction in fair value (1,250)
Amount recognized in profit and loss 250
Held to Maturity [HTM] Initial Amount recognized 25,000
Interest income in profit or loss (6.9% of GHS 250,000) 1,725
Interest income received (6% of GHS 25,000) (1,500) 225
Carrying amount amortized cost at 31 December, 2010 25,225
Available for sale financial asset [AFSFA] Initial Amount recognized 25,000
Interest income in profit or loss (6.9% of GHS 250,000) 1,725
Interest income received (6% of GHS 25,000) (1,500) 225
25,225
Fair value at year end [250 x GHS 95] 23,750
Fair value change in equity (1,475)
Note:
The AFS reserve has a debit balance in equity. If the holder believes that the financial asset is
impaired, then it should be reclassified out of Other Comprehensive Income into profit or
loss.
Page 4
Page 4 of 16
Question 2
PEACE LIMITED GROUP
CONSOLIDATED INCOME STATEMENT FOR THE
YEAR ENDED 31 DECEMBER, 2010
GHS ‘000 GHS ‘000
Turnover (27,675 + 35,438) 63,113
Cost of Sales (18,081 + 28,176) (46,257)
Gross Profit 16,856
Distribution Cost (3,870 + 2,832) (6,702)
Administrative Expenses (4,407 + 945) (5,352)
Depreciation (573 + 630) 1,203
Exchange Difference Gain (workings 8) 1,037
Profit before Tax 4,636
Taxation (585+ 2,839) (3,424)
Profit after Tax 1,212
Non-controlling Interest (40% x 1,053) (421)
Transfer to Income Surplus 791
GROUP INCOME SURPLUS ACCOUNT
GHS ‘000
Balance as at 01/01/2010 (3,033 -555) 2,478
Income Surplus –Love Ltd – post (11,175+ 522 – 450) x 60% 6,748
Transfer from Income Statement 791
Less Dividend paid (549)
Balance as at 31/12/2010 9,468
Page 5
Page 5 of 16
PEACE LIMITED GROUP
CONSOLIDATED STATEMENT OF FINANCIAL POSITION
AS AT 31 DECEMBER, 2010
NON-CURRENT ASSETS GHS ‘000 GHS ‘000
Property, Plant & Equipment (5,295 + 11,550) 16,845
Goodwill Workings 6 15
16,860
CURRENT ASSETS
Inventory (6,735 + 1,470) 8,205
Trade Receivables (1,845 + 750) 2,595
Cash & Bank (468 + 4,050) 4,518 15,318
Total Assets 32,178
EQUITY AND LIABILITIES
Shareholders’ Fund
Ordinary Share Capital 1,800
Income Surplus 9,468
Non-Controlling Interest (40% X 12,225) 4,890 16,158
NON CURRENT LIABILITIES
Long Term Loan (3,690 + 3,720) 7,410
CURRENT LIABILITIES
Trade Payables (3,690 + 3,720) 8,610
Total Equity and Liabilities 32,178
WORKINGS
1. Translation of Peace Income Statement
KA’000 RATE GHS’000
Turnover 283,500 8 35,438
Cost of Sales 189,000 (28,176)
Gross Profit 31,500 7,262
Distribution Cost 22,659 8 (2,832)
Administrative Expenses 7,560 8 (945)
Depreciation 6,300 10 (630)
Exchange Difference -Gain 1,037
Profit before Tax 3,892
Taxation 22,710 8 (2,839)
Profit after Tax 1,053
Dividends (12,600) 8 (1,575)
Transfer to Income Surplus (522)
Page 6
Page 6 of 16
2. Translation of Statement of Financial Position
KA’000 RATE GHS’000
Property, Plant & Equipment 115,500 10 11,550
Inventory 11,025 7.5 1,470
Trade Receivables 5,250 7 750
Cash & Bank 28,350 7 4,050
Trade Payables (13,125) 7 (1,875)
Long Term Loan (26,040) 7 (3,720)
120,960 12,225
Ordinary Share Capital 10,500 10 1,050
Income Surplus 110,460 11,175
120,960 12,225
3. Translation of Opening Balance
KA’000 RATE GHS’000
Ordinary Share Capital 10,500 10 1,050
Income Surplus – pre-acquisition 4,500 10 450
Income Surplus 83,289 10 8,130
98,289 9,630
Property, Plant & Equipment [115,500 +6,300] 121,800 10 12,180
Inventory 14,280 10 1,428
Long Term Loan (26,040) 9.5 (2,741)
Net Monetary Liability (Bal) (11,751) 9.5 (1,237)
98,289 9,630
4. Group Structure
Group share 2, 1000,000 x 100 / 3,500,000 = 60%
Non –controlling Interest = 40%
5. Cost of Sales
KA’000 RATE GHS’000
Opening Inventory 14,280 10 1,428
Purchases (balancing figure) 185,745 8 28,218
Closing Inventory 11,025 7.5 1,470
189,000 28,176
Page 7
Page 7 of 16
6. Goodwill Accounts
Cost of Investment [GH¢915 x KA 10] 9,150
Less Net Assets Acquired
Ordinary Share Capital 10,500
Income Surplus (Pre-Acquisition) 4,500
15,000
Group Share (60% X 15,000) (9,000)
Goodwill 150
Translated to GH¢ at close (150 x 7) = GH¢21.42
Alternative Solution
Cost of Investment [GH¢915 x KA 10] 915
Less Net Assets Acquired
Ordinary Share Capital (10,500/10) 1,050
Income Surplus (Pre-Acquisition) (4,500 /10) 450
1,500
Group Share (60% X 1,500) (900)
Goodwill 15
Re-translated at Balance Sheet date (10/7 x 15) = GH¢21.42
7. Group Income Surplus Accounts
Balance B/d 3,035
Income Surplus [60% x (11,175- 450)] 6,435
Balance c/d 9,468
8. Calculation of Exchange Difference
Shareholders’ Fund at 01/01/2011 workings 3 9,630
Profit before 2010 –Exchange Diff. workings 3 1,559
Balance c/d 11,188
Less Shareholders’ Fund at 31/12/2011 workings 2 12,225
Exchange Gain 1,037
Page 8
Page 8 of 16
9. Calculation of Non-controlling Interest
KA ‘000
Stated Capital 10,500
Income Surplus 110,460
120,960
Non-controlling Interest 40% X 120,960 = 48,348
Translated at 31/12/10 = 48,348/7 = GH¢6,912
Question 3
a. Importance of Corporate Failure Prediction
i. Banks use corporate failure prediction to monitors loans to customers.
ii. Auditors use it to assess the going concern status of a client.
iii. Industrial Companies use it to monitor the creditworthiness of customers
iv. It helps companies to assess whether they are in danger of possible collapse.
v. Local Governments can use it to assess the risks of their suppliers.
Calculation of Z-Score
X1 0.012 x Working Capital x 100
Total Assets
0.012 x 3,445 x 100
27,787
0.15
X2 0.014 x Retained Earnings x 100
Total Assets
0.014 x 5,245 x 100
27,787
0.26
X3 0.033 x Earnings Before Interest & Tax
Total Assets
0.033 x 4,880 x100
27,787
0.59
X4 0.006 x Market Value of Equity x100
Carrying amount of Debts
0.006 x 14,000 x100
3,700
2.28
X5 0.999 x Sales
Total Assets
0.999 x 29,000
27,787
1.04
4.32
Advice: the company is not likely to collapse since the Z-score is above 3
Page 9
Page 9 of 16
Workings
Income Statement GHC’000
Profit before Interest and Tax 4,880
Debenture Interest (185)
Profit before Tax 4,695
Tax (1800)
Profit after Tax 2,895
Income Surplus Accounts
Balance b/f 2,350
Profit after Tax 2,895
Retained Earnings 5,245
Market Value of Equity
Price per Share GHC2.00
Value of Equity 7,700 x 2 / 1.1 = 14,000
Working Capital GHC’000 GHC’000
Current Assets
Inventory / Stocks 5,600
Receivables / Debtors 2,580
Bank 4,200
Investment Income 107 12,487
Current Liabilities
Creditors /Payables 6,300
Debenture Interest 92
Tax (1,800 + 850) 2,650 (9,042)
3,445
Total Assets GHC’000
Current Assets 12,487
Plant & Machinery 5,800
Freehold Premises 8,100
Investments 1,400
27,787
b.
i. Cost of Sales Adjustments
Cost of Sales Adjustments is the difference between the replacement cost and the
historical cost accounting cost of sales. It is necessary to eliminate realized holding gains
from the gross profit.
Page 10
Page 10 of 16
ii. Depreciation Adjustments
This is the difference between the depreciation charge on the gross replacement cost of
the asset and the historical cost of depreciation. Thus if depreciation is provided on the
current cost of an asset each year and the arrears of depreciation caused by continuing
inflation are made good, the entity would have retained the opportunity to replace the
asset at the end of its useful life. Alternatively, the entity can buy other assets of
equivalent value.
iii. Monetary Working Capital adjustments
This is the aggregate of
a. Trade Receivables, Prepayments and Bills Receivable
b. Trade Payables, Accruals and Bills payable
When a company gives or takes credit for the sale or purchase of goods, they are paid for
at the end of the credit period; at the replacement cost, it is at the beginning of the credit
period. If the entity measures profit on the excess of revenue
Trade payables protect the entity because the entity lags behind current prices in the
payment while Receivables would be a burden on profits in a period of rising prices
because Sales receipts always relate to previous months at lower cost profits levels.
iv. Gearing Adjustments
This is computed when operating capacity of a business is financed in part by borrowing.
During a period of rising prices, the non-current assets financed by these borrowings
increase in monetary amount while the amount of the Loan remains unchanged.
Historical Cost accounting Income Statement does not reflect this gain though interest is
charged on the borrowings.
Page 11
Page 11 of 16
Question 4
KUMASI SHOE FACTORY LIMITED
RECONSTRUCTED STATEMENT OF FINANCIAL POSITION
AS AT 31 DECEMBER, 2010
Non-Current Assets GHS GHS’
Property, Plant & Equipment 2,250,000
Current Assets
Inventories 600,000
Accounts Receivables 450,000
Cash & Bank 1,250,000 2,300,000
Total Assets 4,550,000
LIABILITIES & SHAREHOLDERS’ FUND
SHAREHOLDERS’ FUND
Ordinary Share Capital 3,000,000
Capital Surplus 200,000 3,200,000
Non-Current Liabilities
10% Debenture 350,000
Current Liabilities
Accounts Payables 1,000,000
Total Liabilities & Shareholders’ Fund 4,550,000
B). Expected Profit after Tax and EPS
GHC
Expected Profit before Interest 400,000
Interest [10% X 350,000] (35,000)
Profit before Tax 365,000
Tax @ 25% (91,250)
Profit attributable to ordinary shareholder 273,750
Number of share issued after reconstruction = 3,000,000 shares
Earnings Per Share = 273,750 = GHC 0•091
3,000,000
Earnings per Share would be [0•091 X 600,000 shares] amounting to GH¢54,600 per annum.
This might seem a worthwhile return, therefore they should accept the reconstruction.
Page 12
Page 12 of 16
C). Statement of Distribution on Liquidation
Total Proceeds on liquidation 2,250,000
Distribution
Liquidation Expenses 10,000
Secured Creditors – Bank Overdraft 750,000
Unsecured Creditors
15% Debenture holders – 745,000
Accounts Payable – 745,000 1,490,000 (2,250,000)
Nil
Since the unsecured creditors, who are the 15% Debenture holders and the accounts payables
amount to GH¢2,000,000, they would receive GH¢0•745 per GH¢1. [1,490,000/2,000,000]
Workings
Capital Reduction Accounts
Ordinary shares 200,000 Ordinary shares
2,000,000
Ordinary shares 150,000 Pref. Shares
750,000
Prop. Plant & Equip 1,000,000
Inventories 400,000
Prov. - Bad Debts 50,000
Income Surplus 750,000
Capital Surplus 200,000
2,750,000
2,750,000
OR Capital Reduction Accounts
Ordinary shares 150,000 Ordinary shares
1,800,000
Prop. Plant & Equip 1,000,000 Pref. Shares
750,000
Inventories 400,000
Prov. - Bad Debts 50,000
Income Surplus 750,000
Capital Surplus 200,000
2,550,000
2,550,000
Page 13
Page 13 of 16
Stated Capital
Balance c/d 3,000,000 Ordinary shares
200,000
Pref. Shares
150,000
Debenture holders
650,000
Bank
2,000,000
3,000,000
3,000,000
Bank Accounts
Stated
Capital 2,000,000 Bal b/f
750,000
Bal c/d
1,250,000
2,000,000
2,000,000
Page 14
Page 14 of 16
Question 5
A. The Managing Director’s statement is incorrect for a number of reasons:
i. The figures are based on book values. It is more appropriate to use market values in
arriving at a valuation for listing purposes.
ii. The addition of total assets and surpluses is to double count since the surplus
represents one of the sources of finance use to acquire the existing assets.
iii. The liabilities should have been deducted from the total assets figure in order to arrive
at the net asset position of the company.
iv. The issue of 500,000 new shares would bring the total number of shares of the
company to 10,500,000 . If only the new shares are offered on the exchange, this
represents 4.7% of the total number of shares. The minimum percentage that can be
offered in the market is about 25%.
v. In view of the problems with the net assets valuation, and taken into account the
valuation estimates given below, Obuoba is unlikely to achieve the price of GH¢7
per share which would be necessary to raise GH¢3.5 million from 500,000 shares
B
i. Revised Profit (for PE Ratio method) GHS’000
Profit before Tax per draft accounts 12,000
URP on sale or return [30/130 x GHS2.6 m] (600
Depreciation: Land and building (800)
Plant (1,400)
Fair valuation gain of FAFVTPL 160
Embezzlement: current year (500)
Additional interest [amortization] 720-600 (120)
-------
Profit before tax 8,740
Taxation: Current Tax @ 20% 1748
Deferred Tax [20% 500) 100
------- (1,848)
---------
Profit after tax 6,892
=====
ii. Dividend Paid [For Dividend Yield method]
GHS’000
Retained earnings as at 31 December 2010 19,000
Reported profit 9,600
----------
28,600
Balance as at 31 December 2011 (23,000)
-----------
Dividend paid 5,600
=====
Page 15
Page 15 of 16
An alternative is to prepare a revised Income Statement as follows:
GHS’000
Sales (52000-2,600] 49,400
Cost of sales [29,000 – 2,000 + 800+1400] (29,200)
-----------
Gross Profit 20,200
Selling expense (4,500)
Admin (4,500)
Interest [2000+120] (2,120)
Fair valuation gain 160
--------
Profit before tax 8,740
Taxation (1,848)
--------
Net Profit 6,892
====
iii. Revised Net Asset [ For Net Assets Method]
GHS’000
Per the trial balance 24,000
Prior year adjustment [embezzlement] (1,500)
Adjustment to reported profit [9,600 – 6,892] (2,708)
Revaluation surplus – Land and buildings 2,800
--------
22,592
=====
An alternative is to prepare the revised SOFP as follows
GHS’000
Land and buildings 18,000
Plant 5,600
FAFVTPL 2,160
-------
25760
-------
Current assets
Inventory 11,000+ 2000 13,000
Trade receivables [9,000-2,000 -2,600] 4,400
Cash 1,000
--------
18,400
--------
Total assets 44,160
=====
Page 16
Page 16 of 16
Equity
Stated capital 1,000
Revaluation surplus 2,800
Retained earnings [23,000- 1500 - 2708] 18,792
------
22,592
Non-current- liabilities
Long term loans [7,000 + 4120] 11,120
Deferred tax provision 100
Current liabilities
Trade payables 8,600
Current tax 1,748
-------
44,160
i. Price Earnings Ratio
Value per share = EPS X PE ratio
EPS GHS6,892,000/10 million shares = GHS 0. 6892
PE ratio = That of Dadeba as adjusted
= (GHS4.20/GHS0.60) = 7 adjusted to 5.25
Value per share = GHS0.6892 x 5.25 = GHS3.6183
ii. Dividend Yield Method
Value per share = Do/Dividend yield
Do = GHS5,600,000 / 10m shares = GHS0.5600
Dividend yield = That of Dadeba as adjusted
= (GHS0.36/GHS4.20) = 8.57% adjusted to 10.71% or 11.42%
Value per share = GHS0.5600/0.1142 = GHS4.9037 or GHS0.5600/0.1071 = GHS5.228
iii. Net Assets Method
Value /share = Net Assets/No of ordinary shares
=GHS22,592,000/10 million shares
=GHS2.2592


![The Professional Accountant - Institute of Chartered ... · PDF filethe professional accountant official journal of the institute of chartered accountants [ghana] january/march 2015](https://static.documents.pub/doc/80x56/5a772e887f8b9a1b688dca64/the-professional-accountant-institute-of-chartered-the-professional-accountant.jpg)


