70
Institutional Data Book 2017-18

Institutional Data Book 2017-18

INSTITUTIONAL DATA BOOKUNIVERSITY OF MINNESOTA, MORRIS
2017-2018
Prepared by theUMM Office of Institutional Research
October 2018
The University of Minnesota shall provide equal access to and opportunity in its programs, facilities, and employmentwithout regard to race, color, creed, religion, national origin, gender, age, marital status, disability, public assistance status,veteran status, sexual orientation, gender identity, or gender expression.
URL: reports.morris.umn.edu

TABLE OF CONTENTS
ORGANIZATIONAL STRUCTURE
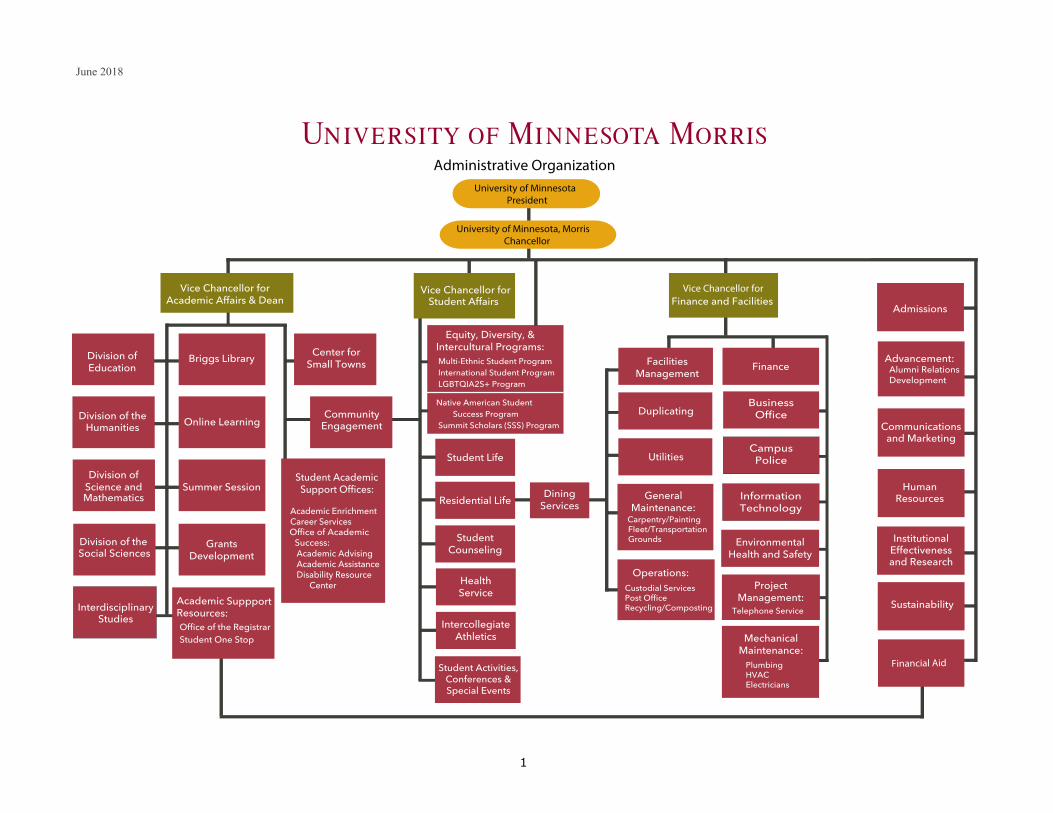
UMM Organizational Chart as of June 2018. . . . . . . . . . . . . . . . . . . . . . . . . . . . . . . . . . . . . . . . . . . . . . . . . . . . . . . . . . . . . . . . . . . . . . . . . . . . . . . . . .1
FINANCIAL AND STAFFING INFORMATION
Most Recent Expenditures of General Operations and Maintenance Funds, 2017-18. . . . . . . . . . . . . . . . . . . . . . . . . . . . . . . . . . . . . . . . . . . . . . . . . . . . . . . . . . . . . . . . . . . . . . . . . . . . . . . . . .3
Trends in Expenditures of General Operations and Maintenance Funds Devoted to the Academic
Divisions, Academic Support Services, and Administrative Services, 2013-18 (Graphic). . . . . . . . . . . . . . . . . . . . . . . . . . . . . . . . . . . . . . . . . . . . . . . . . . . . . . . . . . . . . . . . . . . . . . . . . . . .4
Five-Year Summary of Total Expenditures of General Operations and Maintenance (O&M) Funds, 2013-2018. . . . . . . . . . . . . . . . . . . . . . . . . . . . . . . . . . . . . . . . . . . . . . . . . . . . . . . . . . . . . . . . . . .5
Five-Year Summary of Expenditures for Compensation from the General O&M Funds, 2013-2018 . . . . . . . . . . . . . . . . . . . . . . . . . . . . . . . . . . . . . . . . . . . . . . . .6
Five-Year Summary of Supplies, Expense, and Equipment Expenditures from the General O&M Funds, 2013-2018. . . . . . . . . . . . . . . . . . . . . . . . .7
Trends in Total Expenditures of General Operations and Maintenance Funds, 2007-2018 (Graphic). . . . . . . . . . . . . . . . . . . . . . . . . . . . . . . . . . . . . . . . . . . . . . . . . . . . . . . . . . . . . . . . . . . . . . . . .8
Revenues and Expenditures from IPEDS Reports Supplied by Central Administration, 2012-2017 . . . . . . . . . . . . . . . . . . . . . . . . . . . . . . . . . . . . . . . . . . . . . . . . . . . . . . . . . . . . . . . . . . . . . . . .9
Glossary of Revenues and Expenditures Terms from IPEDS Reports. . . . . . . . . . . . . . . . . . . . . . . . . . . . . . . . . . . . . . . . . . . . . . . . . . . . . . . . . . . . . . . . . . . . . . . .10-12
Five-Year Summary of Financial Aid Distributed, 2012-2017. . . . . . . . . . . . . . . . . . . . . . . . . . . . . . . . . . . . . . . . . . . . . . . . . . . . . . . . . . . . . . . . . . . . . . . . . . . . . . . . . . . . . . . . . . . .13
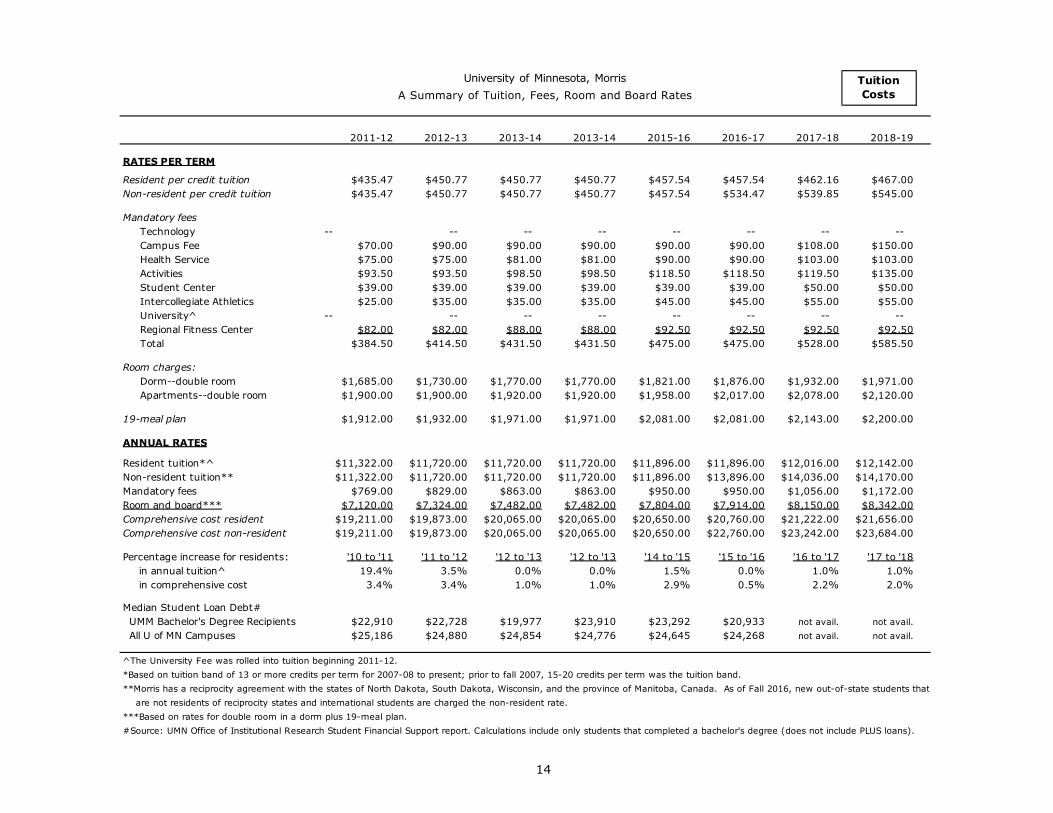
Tuition, Fees, Room and Board Rates, 2009-2019. . . . . . . . . . . . . . . . . . . . . . . . . . . . . . . . . . . . . . . . . . . . . . . . . . . . . . . . . . . . . . . . . . . . . . . . . . . . . . . . . .14
Trends in Fund Raising and Endowment Growth, 2000-2017. . . . . . . . . . . . . . . . . . . . . . . . . . . . . . . . . . . . . . . . . . . . . . . . . . . . . . . . . . . . . .15
Trends in Level of Funded Research, 2012-2017. . . . . . . . . . . . . . . . . . . . . . . . . . . . . . . . . . . . . . . . . . . . . . . . . . . . . . . . . . . . . . . . . . . . . . . . . . . . . . . . . . . . . . . . . . . . .16
Most Recent Academic, Civil Service, and Bargaining Unit Staffing, 2017-18. . . . . . . . . . . . . . . . . . . . . . . . . . . . . . . . . . . . . . . . . . . . . . . . . . . . . . . . . . . . . . . . . . . . . . . . . . . . . . . . . .17
Distribution of Faculty and Staff, 2017-2018 (Graphic). . . . . . . . . . . . . . . . . . . . . . . . . . . . . . . . . . . . . . . . . . . . . . . . . . . . . . . . . . . . . . . . . . . . . . . . . . . . . . . . . . . . . . . . . . . . .18
Five-Year Summary of Academic, Civil Service, and Bargaining Unit Staffing by Occupational Classification, 2013-2018. . . . . . . . . . . . . . . . . . . . . . . . . . . . . . . . . . . . . . . . . . . . . . . . . . . . . . . . . . . . . . . . . . . . . . . . . .19
Five-Year Summary of Academic, Civil Service, and Bargaining Unit Staffing by Functional Unit, 2013-2018. . . . . . . . . . . . . . . . . . . . . . . . . . . . . . . . . . . . . . . . . . . . . . . . . . . . . . . .20
Ten-Year Staffing Trends (Part 1), 2009-2018 (Graphic). . . . . . . . . . . . . . . . . . . . . . . . . . . . . . . . . . . . . . . . . . . . . . . . . . . . . . . . . . . . . . . . . . . . . . . . . . . . . . . . . . . . . . . . . . . . . . . . . . . . . . .21
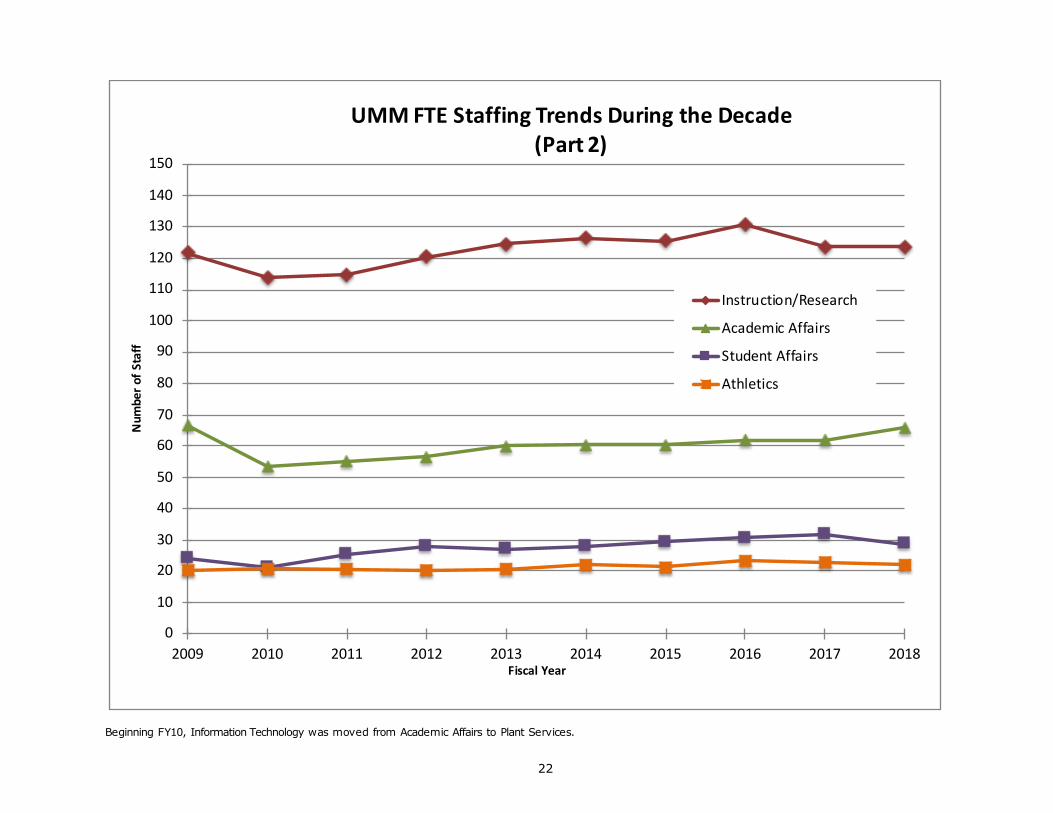
Ten-Year Staffing Trends (Part 2), 2009-2018 (Graphic) . . . . . . . . . . . . . . . . . . . . . . . . . . . . . . . . . . . . . . . . . . . . . . . . . . . . . . . . . . . . . . . . . . . . . . . . . . . . . . . . . . . . . . . . . . . . . . . . . . . .22
Trends in Staffing in Instruction and Research and Academic Affairs Staff, 2002-2018. . . . . . . . . . . . . . . . . . . . . . . . . . . . . . . . . . 23
STUDENT INFORMATION
Summary of Enrollment, ACT Scores, and Demographic Information for the UMM Student Body, 2008-2018. . . . . . . . . . . . . . . . . . . . . . . . . . . . . . . . . . . . . . . . . . . . . . . . . . . . . . . . . . . . . . . . . . . . . . . . . . .25
Comparison of UMM Freshman ACT Scores to National Averages, 2013-2018 . . . . . . . . . . . . . . . . . . . . . . . . . . . . . . . . . . . . . . . . . . . . . . . . . . . . . . . . . . . . . . . . . . . . . . . . . . . . .26
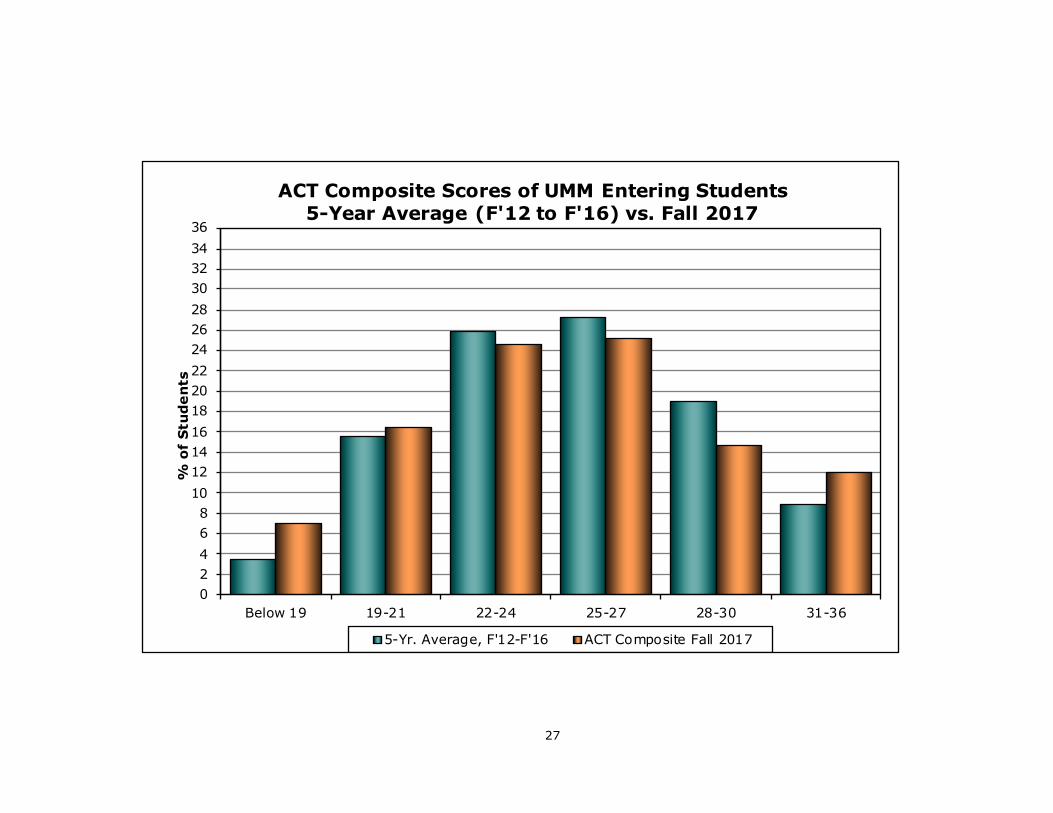
Comparison of Fall 2017 Freshman ACT Composite Scores to 5-Year Average, Fall 2012-2016 (Graphic) . . . . . . . . . . . . . . . . . . . . . . . . . . . . . . . . . . . . . . . . . . . . . . . . . . . . . . . . . . . . . . . . . . . . . . . . . . . . .27
Origin of the Fall 2018 Student Body (Graphic). . . . . . . . . . . . . . . . . . . . . . . . . . . . . . . . . . . . . . . . . . . . . . . . . . . . . . . . . . . . . . . . . . . . . . . . . . . . . . . . . . . . . . . . . . . . . . . . . . . . .28
- i -

STUDENT INFORMATION (Continued)
Five-Year Summary of Headcount (Fall 2014-19) and Full-Year Equivalent (2013-18) Enrollment for the U of Minnesota System. . . . . . . . . . . . . . . . . . . . . . . . . . . . . . . . . . . . . . . . . . .29
Fall Headcount Enrollments from 1985 to 2018 (Graphic). . . . . . . . . . . . . . . . . . . . . . . . . . . . . . . . . . . . . . . . . . . . . . . . . . . . . . . . . . . . . . . . . . . . . . . . . . . . . . . 30
Five-Year Summary of Fall Headcount of Students of Color for the University of Minnesota System, 2014-2019. . . . . . . . . . . . . . . . . . . . . . . . . . . .31
UMM Fall Headcount Trend by Ethnic Background for Degree-seeking Undergraduates and Entire Student Body, 1995-2018. . . . . . . . . . . . . . . . . . . . . . . . . . . . . . . . . . . . . . . . . . . . . . . . .32
UMM Fall Headcount Trend by Ethnic Background for New High School Students and Transfer Students, 1995-2018. . . . . . . . . . . . . . . . . . . . . . . . . . . . . . . . . . . . . . . . . . . . . . . . .33
Official Fall Enrollments for UMM, 2001-2018. . . . . . . . . . . . . . . . . . . . . . . . . . . . . . . . . . . . . . . . . . . . . . . . . . . . . . . . . . . . . . . . . . . . . . . . . . . . . . . . . . . . . . . . . . . . . . . . . . . . .34
Out-of-State and International Student Enrollments, Fall 2014-2018 . . . . . . . . . . . . . . . . . . . . . . . . . . . . . . . . . . . . . . . . . . . . . . . . . . . . . . . . . . . . . . . . . . . . . . . . . . . . . . . . . . . . . . . . . . . . . . . 35
UMM Student Study Abroad Enrollments, 2011-2018. . . . . . . . . . . . . . . . . . . . . . . . . . . . . . . . . . . . . . . . . . . . . . . . . . . . . . . . . . . . . . . . . . . . . . . . . . . . . . . . . . . . . . . . . . . . . . . . . . . . . . . . . . . . . . . . . . . . . .36
National Survey of Student Engagement (NSSE) 2017 Selected Senior Responses. . . . . . . . . . . . . . . . . . . . . . . . . . . . . . . . . . . . . . . .37-38
Cohort Retention/Graduation Rates for UMM Entering Freshmen, Fall 1999-2016 Cohorts . . . . . . . . . . . . . . . . . . . . . . . . . . . . . . . . . . . . . . . . . . . . . . . . . . . . . . . . . . . . . . . . . . . . . . . . . . . . . . .39
UMM Graduation Rates within the University of Minnesota System, 1985-2013 Cohorts (Graphic). . . . . . . . . . . . . . . . . . . . . . . . . . . . . . . . . . . . . . . . . . . . . . . . 40
Cohort Retention/Graduation Rates for Entering Freshmen for Students of Color, Fall 2007-2016 Cohorts . . . . . . . . . . . . . . . . . . . . . . . . . . . . . . . . . . . . . . . . . . . . . . . . . . . . . . . . . . . . . . . . . . . . . . . . . . . . . . .41
ACADEMIC PROGRAM INFORMATION
Declared Majors of the UMM Student Body, 2014-2018. . . . . . . . . . . . . . . . . . . . . . . . . . . . . . . . . . . . . . . . . . . . . . . . . . . . . . . . . . . . . . 43-44
Trends in Percentage of Declared Majors by Division, 2012-2018 (Graphic). . . . . . . . . . . . . . . . . . . . . . . . . . . . . . . . . . . . . . . . . . . . . . . . . . . . . . . . . . . . . . . . . . . . . . . . . . . . . . . . . . . . . . .45
Declared Minors of the UMM Student Body, 2014-2018. . . . . . . . . . . . . . . . . . . . . . . . . . . . . . . . . . . . . . . . . . . . . . . . . . . . . . . . . . . . . . 46-47
Degrees Granted by Major, 2013-2018. . . . . . . . . . . . . . . . . . . . . . . . . . . . . . . . . . . . . . . . . . . . . . . . . . . . . . . . . . . . . . . . . . . . . . . . . . . . . . . . .48-49
Degrees Granted by Minor, 2012-2018. . . . . . . . . . . . . . . . . . . . . . . . . . . . . . . . . . . . . . . . . . . . . . . . . . . . . . . . . . . . . . . . . . . . . . . . . . . . . . . . .50-51
Student:Faculty Ratios by Division and Discipline, 2017-18. . . . . . . . . . . . . . . . . . . . . . . . . . . . . . . . . . . . . . . . . . . . . . . . . . . . . . . . . . . . . . . . . .52-53
Student Enrollments in Courses Offered by Each Academic Division, 2005-2018 (Graphic) . . . . . . . . . . . . . . . . . . . . . . . . . . . . . . . . . . . . . . . . . . . . . . . . . . . . . . . . . . . . . . . . . . .54
Full-Time Equivalent (FTE) Faculty by Division, 2002-2018 (Graphic). . . . . . . . . . . . . . . . . . . . . . . . . . . . . . . . . . . . . . . . . . . . . . . . . . . . . . . . . . . . . . . . . . . . . . . . . . . . . . . . . . . . . .55
Statistics by Discipline on Enrollment, Classes, and Faculty, 2017-18. . . . . . . . . . . . . . . . . . . . . . . . . . . . . . . . . . . . . . . . . . . . . . . . . . . . . . . . . . . . . . . . . .56-57
Faculty Full-Time Equivalent (FTE) Teaching Positions, 2013-2018. . . . . . . . . . . . . . . . . . . . . . . . . . . . . . . . . . . . . . . . . . . . . . . . . . . . . . . . . . . . . . . . . . . . . . . .58-59
FTE Faculty Positions by Appointment Type, 2012-2018 (Graphic). . . . . . . . . . . . . . . . . . . . . . . . . . . . . . . . . . . . . . . . . . . . . . . . . . . . . . . . . . . . . . . . . . . . . . . . . . . . . .60
FTE Faculty Positions by Appointment Type and Division, 2012-2018 (Graphic). . . . . . . . . . . . . . . . . . . . . . . . . . . . . . . . . . . . . . . . . . . . . . . . . . . . . . . . . . . . . . . . . . . . . . . . . . . . . .61
Average Salary for Full-Time Teaching Faculty by Rank and Gender, 2013-2018. . . . . . . . . . . . . . . . . . . . . . . . . . . . . . . . . . . . . . . . . . . . . . . . . . . . . . . . . . . . . . . . .62
Average Salary for Full-Time Teaching Faculty by Rank, Gender, and Years of Service, 2017-2018. . . . . . . . . . . . . . . . . . . . . . . . . . . . . . . . . . . . . . . . . . . . . . . . . . . . . . . . . . . . . . . . .63
Percentage of Faculty Who are Female, Faculty of Color, or Tenured, 1971-2018. . . . . . . . . . . . . . . . . . . . . . . . . . . . . . . . . . . . . . . . . . . . . . . . . . . . . . . . . . . . . . . . . . .64
Percentage of Faculty Who are Tenured, Women, or Faculty of Color, Fall 2003-2017 (Graphics). . . . . . . . . . . . . . . . . . . . . . . . . . . . . . . . . . . . . . . . . . . . . . . . . . . . . . . . . . . . . . . . . . . . . . . . .65
- ii-
Instructions:From Illustrator document, make a PDF. Insertthe entire PDF into this page, then adjustsize using the crop tool in Excel, and adjust the Page Setup for theright cells to print.
Vice Chancellor for Student Affairs
Student Activities,Conferences &Special Events
Vice Chancellor forAcademic Affairs & Dean
Online LearningDivision of theHumanities
Division ofScience andMathematics
Division of theSocial Sciences
Financial Aid
InstitutionalEffectivenessand Research
Advancement: Alumni Relations Development
University of Minnesota, MorrisChancellor
University of MinnesotaPresident
Administrative Organization
June 2018
Division ofEducation
Student Academic Support Offices:
Academic Enrichment Career Services
Academic Advising Academic Assistance Disability Resource Center
HumanResources
CommunityEngagement
Student Life
Center forSmall Towns
Academic SuppportResources:Office of the RegistrarStudent One Stop
Vice Chancellor forFinance and Facilities
Sustainability
Office of Academic Success:
Multi-Ethnic Student Program International Student Program LGBTQIA2S+ Program
Equity, Diversity, &Intercultural Programs:
Summer Session
Admissions
DiningServicesResidential Life
StudentCounseling
HealthService
IntercollegiateAthletics
Finance
BusinessOffice
CampusPolice
InformationTechnology
EnvironmentalHealth and Safety
Custodial Services Post Office Recycling/Composting
Operations:
Utilities
Duplicating
FacilitiesManagement
Communicationsand Marketing
Carpentry/Painting Fleet/Transportation Grounds
GeneralMaintenance:
PlumbingHVACElectricians
MechanicalMaintenance:
Telephone Service
ProjectManagement:
Native American Student Success Program Summit Scholars (SSS) Program
GrantsDevelopment
Briggs Library
InterdisciplinaryStudies
1

2
FINANCIAL AND STAFFING INFORMATION
Information is provided on the expenditure of the general operations and maintenance fund and any legislative specialappropriations for that particular year. The table shows actual expenditures, a more accurate financial indicator than the annualbudget. Five-year summaries of that same information are also provided showing the total amount and separate summaries forcompensation and supplies, expense, and equipment expenditures. It should be noted that the financial information may show onlya rough correspondence to that provided by the central administration for the University as a whole because of differences inmethods of collection and aggregation of the data. Revenue and expenditure data from the most recent IPEDS reports prepared bythe central administration is also included. The financial charts show that, over the past five years, total college expenditureshave increased by 0.3%, salaries and fringe benefits have risen by 3.0%, and supplies, expense, and equipment (SE&E) expenditures havedeclined by 5.7%. The proportion of total expenditures alloted to SE&E expenditures was 23.9% in 2013-14 and was 22.5% in 2017-18.The line chart indicates the proportion of expenditures most directly related to the academic program in comparison to thosefor administrative support.
Financial aid information for the past five years shows the actual distribution of aid including the number of eligible recipients and theaverage award per student. The information comes from the annual report from the Financial Aid Office. A table showing trends intuition, fees, room and board is included.
A financial table is provided showing fund raising and endowment growth from 2000 to 2017. Endowment values have increased 40% over the past ten years with commitments averaging $2,469,492 per year for the past five years. Another financial table shows trendsin the level of funded research at UMM. Over the past five years, funded research has averaged 16 awards annually for an average total of$1,423,248 per year.
Staffing counts include part-time, temporary staff, but do not include student employment. Teaching faculty are shown under the categoryof "Instruction and Research," with additional administrative faculty appearing under the categories of "Academic Affairs," "ExecutiveManagement," and "Support Professionals."
The reader is encouraged to study the definitions on the tables in order to understand which units are included under each of the categoriesshown. The information in the five-year summaries is broken down, first, by occupational classification and, secondly, by the principalfunction performed by the employees.

University of Minnesota, Morris 10022017-2018 Expenditures from the General Operations and Maintenance Fund Expenditures
and State Legislative Special Appropriations 2017-18
Fringe Item Salaries Benefits SE&E* Total
SUPPORT SERVICESAdministration $1,794,015 $548,523 $509,429 $2,851,968Student Services $2,223,251 $648,700 $4,786,497 $7,658,448Intercollegiate Athletics $668,079 $218,802 $560,087 $1,446,969Facilities Management $2,653,778 $724,743 $988,161 $4,366,683
$7,339,124 $2,140,769 $6,844,175 $16,324,068ACADEMIC SERVICES
Administration $842,184 $252,392 $75,392 $1,169,968Information Technology $371,615 $112,448 $96,286 $580,348Continuing Education-Morris $199,270 $65,341 $4,572 $269,183Library/Media Services $723,560 $218,437 $545,054 $1,487,051
$2,136,629 $648,618 $721,304 $3,506,550ACADEMIC DIVISIONS
Interdisciplinary & General $43,079 $13,187 $152,266 $208,533Education $716,359 $235,599 $34,261 $986,219Humanities $2,938,068 $971,850 $170,015 $4,079,933Science & Math $2,808,493 $925,739 $212,029 $3,946,262Social Sciences $2,489,703 $823,406 $109,772 $3,422,881
$8,995,703 $2,969,781 $678,344 $12,643,828
Cost Pools and Enterprise Taxes $4,187,001
GRAND TOTALS $18,471,457 $5,759,167 $8,243,822 $36,661,446
--Support Services Administration includes Chancellor's Office, Communications and Marketing, Business Office, VC Finance, and Post Office. --Academic Services Administration includes Vice Chancellor for Academic Affairs Office.--Continuing Education items are part of the UMM budget base.--Academic Divisions/Interdisciplinary and General item includes unassigned instruction from all four divisions, Educational
Development Program, interdisciplinary courses, faculty recruiting and travel support.*Depreciation Expense is included in SE&E expenses starting in FY09.
3

16171819202122232425262728293031323334353637
--Support Services includes Administration, Student Affairs, Intercollegiate Athletics, and Facilities Management.--Academic Divisions includes the four academic divisions, interdisciplinary, Educational Development Program, faculty recruiting and travel support.--Academic Services includes the VCAA Office, Information Technology, Continuing Ed-Morris, and Library/Media Services.
Support Services Academic Divisions Academic Services Cost Pools/Enterprise Tax
2013-14 $16,949,318 $11,733,275 $3,592,902 $4,261,678
2014-15 $16,672,673 $12,085,849 $3,394,386 $4,116,9002015-16 $17,447,644 $13,068,810 $3,471,199 $4,163,2742016-17 $16,358,018 $12,711,720 $3,272,431 $4,161,1242017-18 $16,324,068 $12,643,828 $3,506,550 $4,187,001
$0
$2,000,000
$4,000,000
$6,000,000
$8,000,000
$10,000,000
$12,000,000
$14,000,000
$16,000,000
$18,000,000
$20,000,000
Expe
nditu
res
UMM O&M Expenditures, 2013-2018
4

University of Minnesota, Morris TotalA Five-Year Summary of Total Expenditures from the Expenditures
General Operations and Maintenance Fund and 2013-18State Legislative Special Appropriations
2013-2014 2014-2015 2015-2016 2016-2017 2017-2018SUPPORT SERVICES
Administration $2,642,416 $2,725,148 $2,952,759 $2,916,220 $2,851,968Student Services $8,594,691 $8,411,416 $8,579,010 $8,066,613 $7,658,448Inter. Athletics $1,029,079 $1,044,471 $1,110,155 $1,013,824 $1,446,969Facilities Management $4,683,132 $4,491,637 $4,805,720 $4,361,361 $4,366,683
$16,949,318 $16,672,673 $17,447,644 $16,358,018 $16,324,068ACADEMIC SERVICES
Administration $1,201,379 $1,048,881 $1,165,618 $950,192 $1,169,968Information Technology $662,155 $642,819 $561,433 $481,524 $580,348Continuing Ed-Morris $304,419 $316,277 $302,482 $301,886 $269,183Library/Media Services $1,424,949 $1,386,409 $1,441,666 $1,538,829 $1,487,051
$3,592,902 $3,394,386 $3,471,199 $3,272,431 $3,506,550ACADEMIC DIVISIONS
Interdisc. & General $250,851 $240,442 $393,667 $394,126 $208,533Education $1,124,795 $1,015,562 $1,235,724 $994,552 $986,219Humanities $3,771,249 $3,915,736 $4,314,361 $4,163,880 $4,079,933Science & Math $3,695,496 $3,822,406 $3,925,275 $3,863,257 $3,946,262Social Sciences $2,890,884 $3,091,702 $3,199,784 $3,295,905 $3,422,881
$11,733,275 $12,085,849 $13,068,810 $12,711,720 $12,643,828
Cost Pools and Enterprise Taxes $4,261,678 $4,116,900 $4,163,274 $4,161,124 $4,187,001
GRAND TOTALS $36,537,173 $36,269,808 $38,150,927 $36,503,293 $36,661,446
--Support Services Administration includes Chancellor's Office, Communications and Marketing, Business Office, VC Finance, and Post Office.--Academic Services Administration includes Vice Chancellor for Academic Affairs Office. Continuing Education is part of the UMM budget base.--Academic Divisions/Interdisciplinary and General item includes unassigned instruction from all four divisions, Educational Development Program, interdisciplinary courses, faculty recruiting and travel support.--Depreciation Expense is included in SE&E expenses starting in FY09.
5

University of Minnesota, MorrisA Five-Year Summary of Expenditures for Compensation from the
General Operations and Maintenance Fund and State Legislative Special Appropriations
2013-14 2014-15 2015-16 2016-17 2017-18
SUPPORT SERVICES Administration $2,212,586 $2,190,549 $2,443,464 $2,471,191 $2,342,539 Student Services $2,910,244 $2,936,141 $3,005,853 $3,022,087 $2,871,951 Inter. Athletics $643,818 $683,916 $719,247 $668,454 $886,882 Facilities Management $3,797,603 $3,545,943 $3,471,893 $3,537,920 $3,378,521
$9,564,251 $9,356,549 $9,640,458 $9,699,652 $9,479,893
ACADEMIC SERVICES Administration* $1,096,056 $963,748 $999,109 $858,923 $1,094,577 Information Technology $610,837 $568,212 $521,932 $427,372 $484,062 Continuing Ed-Morris** $300,128 $312,249 $295,578 $297,890 $264,611 Library/Media Services $989,907 $950,816 $1,010,626 $1,003,652 $941,997
$2,996,928 $2,795,024 $2,827,245 $2,587,838 $2,785,247
ACADEMIC DIVISIONS Interdisc. & General $65,881 $70,946 $103,393 $227,223 $56,266 Education $1,068,129 $973,474 $1,157,732 $955,089 $951,958 Humanities $3,612,541 $3,747,479 $4,172,143 $4,001,908 $3,909,918 Science & Math $3,434,537 $3,618,129 $3,763,952 $3,693,841 $3,734,233 Social Sciences $2,790,859 $3,015,584 $3,130,547 $3,195,414 $3,313,109
$10,971,947 $11,425,612 $12,327,768 $12,073,475 $11,965,484
GRAND TOTALS $23,533,126 $23,577,186 $24,795,470 $24,360,965 $24,230,624
--Support Services Administration includes Chancellor's Office, Communications and Marketing, Business Office, VC Finance, and Post Office.--Academic Services Administration includes Vice Chancellor for Academic Affairs Office. Continuing Education is part of the UMM budget base. --Academic Divisions/Interdisciplinary and General item includes unassigned instruction from all four divisions, Educational Development Program, interdisciplinary courses, faculty recruiting and travel support.*Includes Center for Small Towns budget. **Includes Summer Session salaries.
Compensation
6

University of Minnesota, MorrisA Five-Year Summary of Supplies, Expense, and Equipment Expenditures from the
General Operations and Maintenance Fund and State Legislative Special Appropriations
2013-14 2014-15 2015-16 2016-17 2017-18
SUPPORT SERVICESAdministration $429,829 $534,599 $509,295 $445,029 $509,429Student Services $5,684,447 $5,475,275 $5,573,157 $5,044,526 $4,786,497Inter. Athletics $385,262 $360,556 $390,908 $345,370 $560,087Facilities Management $885,529 $945,695 $1,333,826 $823,441 $988,161
$7,385,067 $7,316,124 $7,807,186 $6,658,365 $6,844,175
ACADEMIC SERVICESAdministration* $105,323 $85,133 $166,509 $91,269 $75,392Information Technology $51,318 $74,607 $39,501 $54,152 $96,286Continuing Ed-Morris $4,291 $4,028 $6,904 $3,996 $4,572Library/Media Services $435,041 $435,593 $431,040 $535,177 $545,054
$595,973 $599,362 $643,954 $684,595 $721,304
ACADEMIC DIVISIONSInterdisc. & General $184,970 $169,496 $290,274 $166,903 $152,266Education $56,666 $42,087 $77,992 $39,463 $34,261Humanities $158,709 $168,257 $142,218 $161,973 $170,015Science & Math $260,959 $204,278 $161,323 $169,416 $212,029Social Sciences $100,025 $76,119 $69,236 $100,491 $109,772
$761,329 $660,236 $741,043 $638,246 $678,344
GRAND TOTALS $8,742,369 $8,575,722 $9,192,183 $7,981,206 $8,243,822
--Support Services Administration includes Chancellor's Office, Communications and Marketing, Business Office, VC Finance, and Post Office.--Academic Services Administration includes Vice Chancellor for Academic Affairs Office. Beginning 2003-04, Continuing Education is part of the UMM budget base. --Academic Divisions/Interdisciplinary and General item includes unassigned instruction from all four divisions, Educational
Development Program, interdisciplinary courses, faculty recruiting and travel support.*Includes Center for Small Towns budget
SE&E
7

$0
$2,000,000
$4,000,000
$6,000,000
$8,000,000
$10,000,000
$12,000,000
$14,000,000
$16,000,000
$18,000,000
$20,000,000
$22,000,000
$24,000,000
$26,000,000
$28,000,000
'09 '10 '11 '12 '13 '14 '15 '16 '17 '18
Fiscal Year
UMM Expenditures, O&M Fund
SE&E Expenditures Salaries & Fringe
8

University of Minnesota, Morris Revenues and ExpendituresFrom IPEDS Reports Supplied by Central Administration
Fourth FY Prior Third FY Prior Second FY Prior First FY Prior Last Completed FY2012-2013 2013-2014 2014-2015 2015-2016 2016-2017
REVENUESTuition and fees $18,401,269 $18,460,524 $17,488,185 $17,094,712 $16,789,990Federal appropriations $0 $0 $0 $0 $0State appropriations $18,755,613 $19,158,275 $19,502,982 $20,038,851 $20,828,491Local appropriations $0 $0 $0 $0 $0Grants and contracts $6,644,286 $7,689,169 $6,596,887 $7,262,352 $7,165,209Endowment income $919,965 $1,412,452 $1,226,240 $1,266,079 $1,263,452Sales & services of educational activities $190,224 $205,365 $353,505 $143,788 $187,739Auxiliary enterprises $7,161,328 $8,916,279 $9,011,447 $9,224,614 $8,975,474Other $4,434,658 $2,919,203 $1,764,657 $339,214 $614,415
Total Revenues $56,507,343 $58,761,267 $55,943,903 $55,369,610 $55,824,770EDUCATIONAL & GENERALEXPENDITURES AND TRANSFERSEducational Instruction $12,133,712 $12,422,613 $13,158,815 $13,632,007 $13,792,713and Research $919,235 $1,097,883 $1,010,182 $727,879 $736,965General Public services $520,568 $745,942 $1,087,756 $957,568 $1,428,367
Academic support $4,794,363 $4,571,166 $4,137,114 $4,068,056 $4,028,327includes library expenditures: NA NA NA NA NA
Student services $4,552,816 $4,512,440 $4,764,559 $4,774,856 $5,055,738Institutional support $3,154,834 $2,933,013 $2,848,053 $2,975,237 $2,995,455Operation & maintenance of plant $6,261,323 $6,561,033 $4,592,085 $6,520,764 $5,571,008Scholarships and fellowships $10,324,587 $11,115,247 $10,680,541 $11,061,555 $10,780,851Nonmandatory transfers $4,156,473 $4,256,543 $4,125,576 $4,153,483 $4,619,976Mandatory transfers $0 $0 $0 $0 $0
Total Educational and General $46,817,911 $48,215,880 $46,404,681 $48,871,405 $49,009,400AUXILIARY ENTERPRISESAuxiliary Expenditures $6,946,039 $8,948,675 $8,363,537 $8,124,984 $8,791,497Enterprises Mandatory transfer $0 $0 $0 $0 $0
Nonmandatory transfer $0 $0 $0 $0 $0Total Auxiliary Enterprises $6,946,039 $8,948,675 $8,363,537 $8,124,984 $8,791,497
HOSPITALS $0 $0 $0 $0 $0INDEPENDENT OPERATIONS $0 $0 $0 $0 $0TOTAL CURRENT FUNDSEXPENDITURES AND TRANSFERS $53,763,950 $57,164,555 $54,768,218 $56,996,389 $57,800,897Note: A glossary of IPEDS terms is available on the following pages.
Based on IPEDSFinancial Data
9

Glossary of Terms Used in IPEDS Revenues and Expenditures Report
REVENUES:Tuition and fees: The amount of tuition and required fees covering a full academic year most frequently charged to students. These valuesrepresent what a typical student would be charged and may not be the same for all students at an institution. If tuition is charged on aper-credit-hour basis, the average full-time credit hour load for an entire academic year is used to estimate average tuition. Required feesinclude all fixed sum charges that are required of such a large proportion of all students that the student who does not pay the charges is anexception.
Federal, state, and local appropriations: Revenues received by an institution through acts of a legislative body, except grants and contracts.These funds are for meeting current operating expenses and not for specific projects or programs. The most common example is a state'sgeneral appropriation. Appropriations primarily to fund capital assets are classified as capital appropriations.
Grants and contracts: Revenues from governmental agencies and nongovernmental parties that are for specific research projects, other typesof programs , or for general institutional operations (if not government appropriations). Examples are research projects, training programs,student financial assistance, and similar activities for which amounts are received or expenses are reimbursable under the terms of a grant orcontract, including amounts to cover both direct and indirect expenses. Includes Pell Grants and reimbursement for costs of administering federalfinancial aid programs. Grants and contracts should be classified to identify the governmental level - federal, state, or local - funding the grant orcontract to the institution; grants and contracts from other sources are classified as nongovernmental grants and contracts. GASB institutions arerequired to classify in financial reports such grants and contracts as either operating or nonoperating.
Endowment income: includes: (1) the unrestricted income of endowment and similar funds; (2) restricted income of endowment and similarfunds to the extent expended for current operating purposes, and (3) income from funds held in trust by others under irrevocable trusts.Excludes capital gains or losses unless the institution has adopted a spending formula by which it expends not only the yield but also a prudentportion of the appreciation of the principal. Does not include gains spent for current operations, which are treated as transfers.
Sales & services of educational activities: Revenues from the sales of goods or services that are incidental to the conduct of instruction,research or public service. Examples include film rentals, sales of scientific and literary publications, testing services, university presses, dairyproducts, machine shop products, data processing services, cosmetology services, and sales of handcrafts prepared in classes.
Auxiliary enterprises: Revenues generated by or collected from the auxiliary enterprise operations of the institution that exist to furnish aservice to students, faculty, or staff, and that charge a fee that is directly related to, although not necessarily equal to, the cost of the service.Auxiliary enterprises are managed as essentially self-supporting activities. Examples are residence halls, food services, student health services,intercollegiate athletics, college unions, college stores, and movie theaters.
Other: Other sources of revenues not covered elsewhere in the collection of IPEDS Finance data from schools reporting under the pre GASB34/35 Standards. Examples are interest income and gains (net of losses) from investments of unrestricted current funds, miscellaneous rentalsand sales, expired term endowments, and terminated annuity or life income agreements, if not material. Also includes revenues resulting fromthe sales and services of internal service departments to persons or agencies external to the institution (e.g., the sale of computer time).
EDUCATIONAL & GENERAL EXPENDITURES AND TRANSFERSInstruction: A functional expense category that includes expenses of the colleges, schools, departments, and other instructional divisions ofthe institution and expenses for departmental research and public service that are not separately budgeted. Includes general academicinstruction, occupational and vocational instruction, community education, preparatory and adult basic education, and regular, special, andextension sessions. Also includes expenses for both credit and non-credit activities. Excludes expenses for academic administration where theprimary function is administration (e.g., academic deans). Information technology expenses related to instructional activities if the institution
10

separately budgets and expenses information technology resources are included (otherwise these expenses are included in academic support).Institutions include actual or allocated costs for operation and maintenance of plant, interest, and depreciation.
Research: A functional expense category that includes expenses for activities specifically organized to produce research outcomes andcommissioned by an agency either external to the institution or separately budgeted by an organizational unit within the institution. The categoryincludes institutes and research centers, and individual and project research. This function does not include nonresearch sponsored programs(e.g., training programs). Also included are information technology expenses related to research activities if the institution separately budgetsand expenses information technology resources (otherwise these expenses are included in academic support.) Institutions include actual orallocated costs for operation and maintenance of plant, interest, and depreciation.
Public services: A functional expense category that includes expenses for activities established primarily to provide noninstructional servicesbeneficial to individuals and groups external to the institution. Examples are conferences, institutes, general advisory service, reference bureaus,and similar services provided to particular sectors of the community. This function includes expenses for community services, cooperativeextension services, and public broadcasting services. Also includes information technology expenses related to the public service activities if theinstitution separately budgets and expenses information technology resources (otherwise these expenses are included in academic support).GASB institutions include actual or allocated costs for operation and maintenance of plant and depreciation.
Academic support: A functional expense category that includes expenses of activities and services that support the institution's primarymissions of instruction, research, and public service. It includes the retention, preservation, and display of educational materials (for example,libraries, museums, and galleries); organized activities that provide support services to the academic functions of the institution (such as ademonstration school associated with a college of education or veterinary and dental clinics if their primary purpose is to support theinstructional program); media such as audiovisual services; academic administration (including academic deans but not departmentchairpersons); and formally organized and separately budgeted academic personnel development and course and curriculum developmentexpenses. Also included are information technology expenses related to academic support activities; if an institution does not separately budgetand expense information technology resources, the costs associated with the three primary programs will be applied to this function and theremainder to institutional support. Institutions include actual or allocated costs for operation and maintenance of plant, interest, anddepreciation.
Student services: A functional expense category that includes expenses for admissions, registrar activities, and activities whose primarypurpose is to contribute to students emotional and physical well-being and to their intellectual, cultural, and social development outside thecontext of the formal instructional program. Examples include student activities, cultural events, student newspapers, intramural athletics,student organizations, supplemental instruction outside the normal administration, and student records. Intercollegiate athletics and studenthealth services may also be included except when operated as self-supporting auxiliary enterprises. Also may include information technologyexpenses related to student service activities if the institution separately budgets and expenses information technology resources(otherwisethese expenses are included in institutional support.) Institutions include actual or allocated costs for operation and maintenance of plant,interest, and depreciation.
Institutional support: A functional expense category that includes expenses for the day-to-day operational support of the institution. Includesexpenses for general administrative services, central executive-level activities concerned with management and long range planning, legal andfiscal operations, space management, employee personnel and records, logistical services such as purchasing and printing, and public relationsand development. Also includes information technology expenses related to institutional support activities. If an institution does not separatelybudget and expense information technology resources, the IT costs associated with student services and operation and maintenance of plant willalso be applied to this function.
Operation and maintenance of plant: An expense category that includes expenses for operations established to provide service andmaintenance related to campus grounds and facilities used for educational and general purposes. Specific expenses include utilities, fireprotection, property insurance, and similar items. This expense does include amounts charged to auxiliary enterprises, hospitals, and
11

independent operations. Also includes information technology expenses related to operation and maintenance of plant activities if the institutionseparately budgets and expenses information technology resources (otherwise these expenses are included in institutional support).
Scholarships and fellowships: That portion of scholarships and fellowships granted that exceeds the amount applied to institutional chargessuch as tuition and fees or room and board. The amount reported as expense excludes allowances and discounts.
Nonmandatory transfers: Transfers from current funds to other fund groups made at the discretion of the governing board to serve a varietyof objectives, such as additions to loan funds, funds functioning as endowment (quasi-endowment), general or specific plant additions, voluntaryrenewals and replacement of plant, and prepayments on debt principal.
Mandatory transfers: Those transfers that must be made to fulfill a binding legal obligation of the institution. Includes mandatory debt-serviceprovisions relating to academic and administrative buildings, including (1) amounts set aside for debt retirement and interest; and (2) requiredprovisions for renewal and replacements to the extent not financed from other sources. Also includes the institutional matching portion forPerkins loans when the source of funds is current revenue.
AUXILIARY ENTERPRISESExpenditures: Expenses for essentially self-supporting operations of the institution that exist to furnish a service to students, faculty, or staff,and that charge a fee that is directly related to, although not necessarily equal to, the cost of the service. Examples are residence halls, foodservices, student health services, intercollegiate athletics (only if essentially self-supporting), college unions, college stores, faculty and staffparking, and faculty housing. Institutions include actual or allocated costs for operation and maintenance of plant, interest and depreciation.
Source: https://surveys.nces.ed.gov/ipeds/Downloads/Forms/IPEDSGlossary.pdf
12

University of Minnesota, Morris A Five-Year Summary of Financial Aid Distributed
Amount DistributedPrograms 2012-13 2013-14 2014-15 2015-16 2016-17
STATE OF MINNESOTA PROGRAMSMinnesota State Grant $2,181,393 $2,552,589 $2,401,001 $2,560,850 $2,696,749State Work Study $143,603 $146,649 $159,852 $149,280 $176,734Minnesota Student Educational Loan Fund (SELF) Program $416,575 $386,434 $400,124 $348,692 $163,041Other State of MN Programs* $26,248 $20,792 $19,834 $10,875 $35,743Total State of Minnesota Programs $2,767,819 $3,106,464 $2,980,811 $3,069,697 $3,072,267
FEDERAL PROGRAMSPell Grant $2,287,092 $2,350,917 $2,267,313 $2,394,639 $2,330,676Supplemental Educational Opportunity Grant (SEOG) $656,052 $656,052 $656,052 $656,052 $656,052Federal Work Study $413,221 $403,100 $385,905 $359,084 $369,204Federal Subsidized/Unsubsidized Loans $5,696,890 $5,760,535 $5,319,043 $4,945,396 $4,625,513Federal Perkins Loan $167,234 $144,591 $111,892 $179,918 $108,237Federal Parent Loan for Undergraduate Students (PLUS) $301,152 $383,513 $302,822 $329,800 $1,054,395Other Federal Programs# $57,500 $37,792 $23,784 $18,540 $18,754Total Federal Programs $9,579,141 $9,736,500 $9,066,811 $8,883,429 $9,162,831
INSTITUTIONAL PROGRAMSInstitutional Scholarships $2,628,966 $2,584,446 $2,397,236 $2,662,786 $2,402,435Institutional Donor Funded Scholarships $465,008 $629,992 $921,730 $664,719 $753,511University Grant $91,377 $221,132 $257,233 $263,637 $93,860U of MN Promise Scholarship $1,813,885 $1,784,642 $1,576,596 $1,568,042 $1,532,893American Indian Tuition Waiver $3,081,756 $3,290,447 $3,487,603 $3,447,081 $3,492,892Institutional Stipends $350,872 $212,754 $240,067 $207,497 $152,174International Student Scholarship $4,000 $4,900 $4,000 $10,000 $28,500Institutional Student Employment $438,524 $578,184 $588,196 $596,587 $538,041Total Institutional Programs $8,874,388 $9,306,497 $9,472,661 $9,420,349 $8,994,306
OUTSIDE ASSISTANCE/PROGRAMSOutside Scholarships $497,539 $454,940 $413,904 $388,341 $416,134Bureau of Indian Affairs/Tribal Funding $136,621 $120,972 $129,630 $149,997 $148,980Alternative Loans $1,393,871 $2,180,746 $2,031,536 $1,610,119 $953,732Multicultural Excellence Program $3,274 $0 $0 $0 $0Other Outside Assistance/Programs^ $147,186 $91,989 $112,091 $208,584 $195,452 TOTAL OUTSIDE ASSISTANCE/PROGRAMS $2,178,491 $2,848,647 $2,687,161 $2,357,041 $1,714,298
GRAND TOTALS $23,399,839 $24,998,108 $24,207,444 $23,730,516 $22,943,702
Unduplicated Recipients 1,794 1,678 1,674 1,564 1,436 Average Aid Per Student $16,276 $16,178 $12,973 $15,069 $12,851Cost of Tuition/Fees/Room and Board (Resident) $19,874 $20,066 $20,210 $20,650 $20,760Cost of Tuition/Fees/Room and Board (Non-Resident) $19,874 $20,066 $20,210 $20,650 $22,760Percentage of Student Body Receiving Aid 91% 88% 89% 87% 96%
aivers.*Includes MN Post Secondary Child Care Grant, MN Public Safety Officers Grant, MN GI Bill, MN Indian Scholarship Program, MN DREAM Act, and State of MN Tuition Waivers. #Other Federal Programs include Teacher Education Assistance for College and Higher Education Grant (TEACH).^Other Outside Assistance/Programs include Federal Tuition Assistance (Veterans), Vocational Rehabilitation, Wisconsin Reciprocity Grant, and AmeriCorps.
FinancialAid
13
2011-12 2012-13 2013-14 2013-14 2015-16 2016-17 2017-18 2018-19
RATES PER TERM
Resident per credit tuition $435.47 $450.77 $450.77 $450.77 $457.54 $457.54 $462.16 $467.00Non-resident per credit tuition $435.47 $450.77 $450.77 $450.77 $457.54 $534.47 $539.85 $545.00
Mandatory feesTechnology -- -- -- -- -- -- -- -- Campus Fee $70.00 $90.00 $90.00 $90.00 $90.00 $90.00 $108.00 $150.00Health Service $75.00 $75.00 $81.00 $81.00 $90.00 $90.00 $103.00 $103.00Activities $93.50 $93.50 $98.50 $98.50 $118.50 $118.50 $119.50 $135.00Student Center $39.00 $39.00 $39.00 $39.00 $39.00 $39.00 $50.00 $50.00Intercollegiate Athletics $25.00 $35.00 $35.00 $35.00 $45.00 $45.00 $55.00 $55.00University^ -- -- -- -- -- -- -- -- Regional Fitness Center $82.00 $82.00 $88.00 $88.00 $92.50 $92.50 $92.50 $92.50Total $384.50 $414.50 $431.50 $431.50 $475.00 $475.00 $528.00 $585.50
Room charges:Dorm--double room $1,685.00 $1,730.00 $1,770.00 $1,770.00 $1,821.00 $1,876.00 $1,932.00 $1,971.00Apartments--double room $1,900.00 $1,900.00 $1,920.00 $1,920.00 $1,958.00 $2,017.00 $2,078.00 $2,120.00
19-meal plan $1,912.00 $1,932.00 $1,971.00 $1,971.00 $2,081.00 $2,081.00 $2,143.00 $2,200.00
ANNUAL RATES
Resident tuition*^ $11,322.00 $11,720.00 $11,720.00 $11,720.00 $11,896.00 $11,896.00 $12,016.00 $12,142.00Non-resident tuition** $11,322.00 $11,720.00 $11,720.00 $11,720.00 $11,896.00 $13,896.00 $14,036.00 $14,170.00Mandatory fees $769.00 $829.00 $863.00 $863.00 $950.00 $950.00 $1,056.00 $1,172.00Room and board*** $7,120.00 $7,324.00 $7,482.00 $7,482.00 $7,804.00 $7,914.00 $8,150.00 $8,342.00Comprehensive cost resident $19,211.00 $19,873.00 $20,065.00 $20,065.00 $20,650.00 $20,760.00 $21,222.00 $21,656.00Comprehensive cost non-resident $19,211.00 $19,873.00 $20,065.00 $20,065.00 $20,650.00 $22,760.00 $23,242.00 $23,684.00
Percentage increase for residents: '10 to '11 '11 to '12 '12 to '13 '12 to '13 '14 to '15 '15 to '16 '16 to '17 '17 to '18 in annual tuition^ 19.4% 3.5% 0.0% 0.0% 1.5% 0.0% 1.0% 1.0% in comprehensive cost 3.4% 3.4% 1.0% 1.0% 2.9% 0.5% 2.2% 2.0%
Median Student Loan Debt# UMM Bachelor's Degree Recipients $22,910 $22,728 $19,977 $23,910 $23,292 $20,933 not avail. not avail. All U of MN Campuses $25,186 $24,880 $24,854 $24,776 $24,645 $24,268 not avail. not avail.
^The University Fee was rolled into tuition beginning 2011-12.*Based on tuition band of 13 or more credits per term for 2007-08 to present; prior to fall 2007, 15-20 credits per term was the tuition band.**Morris has a reciprocity agreement with the states of North Dakota, South Dakota, Wisconsin, and the province of Manitoba, Canada. As of Fall 2016, new out-of-state students that are not residents of reciprocity states and international students are charged the non-resident rate.***Based on rates for double room in a dorm plus 19-meal plan.#Source: UMN Office of Institutional Research Student Financial Support report. Calculations include only students that completed a bachelor's degree (does not include PLUS loans).
University of Minnesota, MorrisA Summary of Tuition, Fees, Room and Board Rates
Tuition Costs
14

Fiscal Year CommitmentsEndowment
Values
2000 $2,112,306 $6,044,254
2001 $1,023,515 $5,561,333
2002 $1,642,570 $5,495,890
2003 $1,212,462 $5,554,352
2004 $255,865 $6,621,750
2005 $1,099,993 $7,792,072
2006 $1,104,893 $8,821,696
2007 $1,201,081 $10,619,831
2008 $1,487,703 $10,382,079
2009 $1,853,707 $8,173,097
2010 $952,747 $8,713,415
2011 $2,142,676 $10,086,825
2012 $1,346,680 $10,183,215
2013 $2,272,737 $11,044,799
2014 $1,623,879 $12,565,640
2015 $1,183,390 $12,661,923
2016 $3,126,999 $12,754,774
2017 $4,140,453 $14,559,774
Source: FY02-FY17 from University of Minnesota Foundation Donor Management System (DMS) ExecutiveReports. FY00-FY01 data from query of DMS production and receipted tables. Commitments are outright gifts,pledge obligations, deferred obligations and dollars to be matched. Endowment values are the 6/30 marketvalues of both true and quasi endowments held by both UMM and by the University of MinnesotaFoundation. A true endowment is a fund in which the principal balance cannot be spent; only the availablebalance can be spent, which is approximately 4.5% (this figure subject to change) of a trailing average ofthe principal fund balance. A quasi endowment is a fund that earns market return like a true endowment butits principal balance can be spent.
University of Minnesota, MorrisTrends in Fund Raising and Endowment Growth
from 2000 to 2017
Fund Raising
15

No. Amount No. Amount No. Amount No. Amount No. Amount No. Amount
Proposals Submitted 22 $5,481,004 22 $3,630,642 32 $8,282,285 23 $1,375,973 11 $3,663,328 22 $4,486,646
Awards Received 26 $2,057,548 15 $1,009,673 12 $2,181,691 15 $1,018,245 12 $849,085 16 $1,423,248
Sponsored Expenditures -- $882,000 -- $1,108,000 -- $1,340,896 -- $1,257,000 -- $1,539,000 -- $1,225,379
Source: Electronic Grants Management System (EGMS) Database, UM Data Warehouse, and PeopleSoft Data Modules.
2013-14 2014-15 2015-16 5-Year Average2016-17
University of Minnesota, MorrisTrends in Level of Sponsored Support
2012-13
AwardsReceived
16

University of Minnesota, MorrisAcademic, Civil Service, and Bargaining Unit Staffing
Full-time Equivalent Counts for 2017-18
Instructionand Academic Chancellor's Intercol. Student Business Plant Auxiliary
Research Affairs Office Athletics Affairs Services Services Enterprises Total
Teaching Faculty 123.6 4.0 - 3.7 - - - - 131.3
Executive Management - 1.0 1.0 - 1.0 - 1.0 - 4.0
Support Professionals - 26.6 20.8 17.5 22.2 0.6 9.8 1.0 98.5
Technical Employees - 10.6 - - - - 4.3 1.0 15.9
Office/Clerical - 23.6 18.3 1.0 5.5 5.0 6.6 4.3 64.1
Crafts/Trades - - - - - - 17.0 - 17.0
Service Employees - 0.3 - - - - 16.5 34.6 51.3
Total 123.6 66.0 40.1 22.2 28.7 5.6 55.1 40.9 382.1
Staffing by Dept.2017-18
Definitions:--Instruction and Research includes the academic divisions. The division chairs are counted as 0.5 under Instruction and Research and 0.5 under Academic Affairs.--Academic Affairs includes the Vice Chancellor's Office, Library, Instructional and Media Technologies, Advising, Academic Assistance and Disability Services, Registrar's Office, Online Learning and Summer Session, Career Services, Grants Development, and divisional offices. Center for Small Towns staff are shown under Auxiliary Enterprises.--Chancellor's Office includes Communications and Marketing, Alumni Relations, Fund Development, Human Resources, Sustainability, Institutional Effectiveness and Research, Admissions, and Financial Aid.--Student Affairs includes the Vice Chancellor's Office, Counseling, Health Service, Residential Life office staff, Student Activities, and Equity, Diversity, and Multi-cultural Programs. Residential Life custodial staff are shown under Auxiliary Enterprises.--Business Services includes the Finance director and Business Office. Food Services and the Bookstore are shown under Auxiliary Enterprises.--Plant Services includes Information Technology, Post Office, Campus Police, Planning, Telephone, General and Custodial Maintenance, Building Trades, Grounds, and Transportation. Duplicating and Vending are shown under Auxiliary Enterprises.--Auxiliary Enterprises includes Food Service, Vending, Duplicating, Bookstore, Residential Life custodial staff, and Center for Small Towns.--Counts do not include faculty leave replacements, student employment, nor part-time faculty or staff employed less than 25% time.--For 2017-18, 1.16 FTE staff and .66 FTE faculty were paid by grant funds in Academic Affairs and 7.87 FTE staff were paid by grant funds in Student Affairs.
17

0 10 20 30 40 50 60 70 80 90 100 110 120 130 140
Business Services
Inter. Athletics
Student Affairs
Chancellor's Office
Auxiliary Enterprises
Plant Services
Academic Affairs
Instruction/Research
Distribution of Full-Time Equivalent Counts of Faculty/Staff for 2017-2018
18

University of Minnesota, Morris A Five-Year Summary of the Academic, Civil Service, and Bargaining Unit Staffing
by Occupational ClassificationFull-time Equivalent Counts for 2013-2018
Classification 2013-14 2014-15 2015-16 2016-17 2017-18
Teaching Faculty 131.7 132.0 136.4 130.2 131.3
Executive Management 4.7 4.0 4.0 4.0 4.0
Support Professionals 94.1 95.8 97.0 99.6 98.5
Technical Employees 16.2 15.9 16.0 15.4 15.9
Office/Clerical 64.9 62.8 65.1 65.7 64.1
Crafts/Trades 21.9 21.8 22.0 21.4 17.0
Service Employees 49.5 48.0 50.6 48.6 51.3
Total 383.0 380.2 391.1 384.7 382.1
Most temporary and continuing part-time employees are counted on a percentage basis (faculty on leave are counted but not theirreplacements).
Definitions:--Teaching Faculty category includes instructional faculty and division chairs.--Executive Management category includes the chancellor and vice chancellors.--Support Professionals category includes Academic and Student Affairs directors, librarians, coaches, police, nurse, trainer, etc.--Technical Employees category includes junior engineer, landscape supervisor, computer specialists, electronic technicians, etc.--Office and Clerical category includes Clerical and Office supervisory staff and assistant administrators.--Crafts and Trades category includes bargaining unit staff in skilled trades such as carpenters, electricians, plumbers, etc.--Service Employees category includes primarily bargaining unit staff in custodial and Food Service positions.
Staffing by Class.
2013-18
19

University of Minnesota, MorrisA Five-Year Summary of the Academic, Civil Service, and Bargaining Unit Staffing
by Functional UnitFull-time Equivalent Counts for 2013-2018
Unit 2013-14 2014-15 2015-16 2016-17 2017-18
Instruction/Research 126.5 125.6 130.7 123.8 123.6
Academic Affairs 60.4 60.5 61.9 58.9 66.0
Chancellor's Office 36.8 37.6 38.2 41.5 40.1
Inter. Athletics 22.1 21.2 23.5 22.8 22.2
Student Affairs 27.8 29.4 30.7 34.8 28.7
Business Services 7.0 7.0 7.0 7.0 5.6
Plant Services 64.7 63.4 62.7 56.5 55.1
Auxiliary Enterprises 37.8 35.5 36.4 39.4 40.9
Total 383.0 380.2 391.1 384.7 382.1
Staffing byUnit
2013-18
--Instruction and Research includes the academic Divisions and all Continuing Education faculty. Staff with athletic responsibilities are split between Instruction and Intercollegiate Athletics; Division Chairs are split between Instruction and Academic Affairs.--Academic Affairs includes the Vice Chancellor's Office, Divisional Offices, Library, Instructional and Media Technologies, Advising, Academic Assistance and Disability Services, Registrar's Office, Online Learning and Summer Session, Career Services, Grants Development, and Continuing Education.--Chancellor's Office also includes Communications and Marketing, Alumni Relations, Fund Development, Human Resources, Sustainability, Institutional Effectiveness and Research, Admissions, and Financial Aid.--Student Affairs includes the Vice Chancellor's Office, Counseling, Health Service, Residential Life office staff, Student Activities, and Equity, Diversity, and Multicultural Programs. Residential Life custodial staff are shown under Auxiliary Services.--Business Services includes the Finance Mgr. and Business Office. Food Services and Bookstore are shown under Auxiliary Enterprises.--Plant Services includes Information Technology, Post Office, Campus Police, Planning, Telephone, General and Custodial Maintenance, Building Trades, Grounds, and Transportation. Duplicating and Vending are shown under Auxiliary Enterprises.--Auxiliary Enterprises includes Food Services, Vending, Duplicating, Bookstore, Residential Life custodial staff, and Center for Small Towns.
20
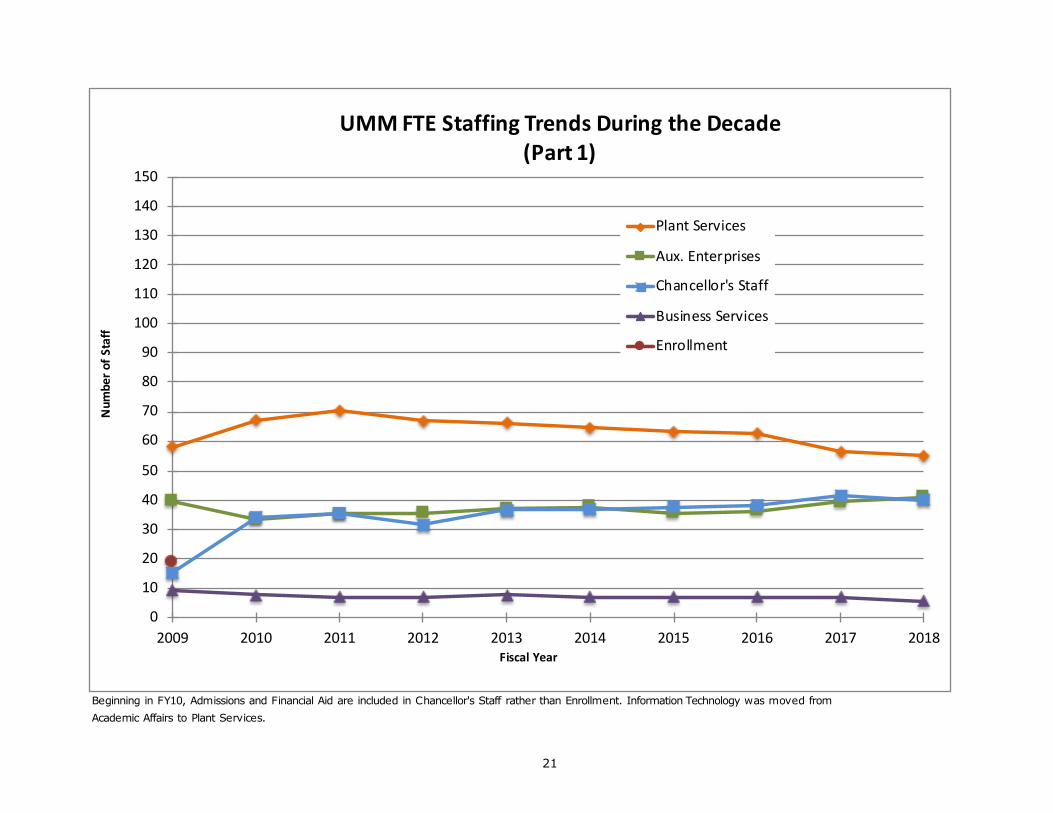
Beginning in FY10, Admissions and Financial Aid are included in Chancellor's Staff rather than Enrollment. Information Technology was moved from Academic Affairs to Plant Services.
0
10
20
30
40
50
60
70
80
90
100
110
120
130
140
150
2009 2010 2011 2012 2013 2014 2015 2016 2017 2018
Num
ber o
f Sta
ff
Fiscal Year
UMM FTE Staffing Trends During the Decade(Part 1)
Plant Services
Aux. Enterprises
Chancellor's Staff
Business Services
Enrollment
21
DONE
Beginning FY10, Information Technology was moved from Academic Affairs to Plant Services.
0
10
20
30
40
50
60
70
80
90
100
110
120
130
140
150
2009 2010 2011 2012 2013 2014 2015 2016 2017 2018
Num
ber o
f Sta
ff
Fiscal Year
UMM FTE Staffing Trends During the Decade(Part 2)
Instruction/Research
Academic Affairs
Student Affairs
Athletics
22

CERP is Continuing Education and Regional Programs. FTE is Full-time Equivalent.*Paid by UMM; in prior years CERP staff were paid by the central U of MN Continuing Education and Extension. UMM Institutional Research
0
130
260
390
520
650
780
910
1040
1170
1300
1430
1560
1690
1820
1950
0
10
20
30
40
50
60
70
80
90
100
110
120
130
140
150
2002 2003 2004 2005 2006 2007 2008 2009 2010 2011 2012 2013 2014 2015 2016 2017 2018
Deg
ree-
seek
ing
Stud
ent H
eadc
ount
(gra
y lin
e)
FTE
Coun
t of S
taff
Fiscal Year
UMM Staffing Trends FY 2002-2018FTE Employees in Instruction/Research and Academic Affairs Staff
Instruction/Research minus CERP
Academic Affairs Staff minus CERP
CERP Instructional Staff*
CERP Academic Affairs Staff*
Degree-seeking Student Headcount
23

STUDENT INFORMATION
Information provided in this section has been selected primarily because it relates to enrollment and retention. The summary sheet"Student Body Information" provides a brief profile of each successive freshman class as well as certain demographic information regarding the
student body as a whole. The map of Minnesota shows the distribution of Minnesota students within the student body. Changes inACT scores over the past five years are shown. Included are a table and charts showing study abroad activity of UMM students.
The five-year summaries of headcount, full-year equivalent enrollment, and student-of-color enrollment show not only data for UMM but for the
University system as a whole and are the official figures provided by the central administration. Fall term headcount enrollment uses the standard
definition: students registered for one or more credits at the end of the second week of the fall term. Full-year equivalent (FYE) enrollments are
determined by dividing the total student credit hours by the full-time credit enrollment for one year and are compiled at the end of the academic year. The charts related to enrollment show fall term headcounts at UMM. The data showing the numbers of students from other states is based on the home location of students at the time of application.
A chart shows cohort retention and graduation rates for UMM freshmen who remained at UMM and, in addition, those who transferred to any other college within the University of Minnesota system.
The tables provided show only a small amount of the profile, enrollment, demographic, aptitude, student demand, grade, and follow-up
information available on the UMM student body. In many instances, considerable data is available with University-wide, state, and national comparisons as well. Contact the UMM Institutional Research Office for more information.
24

2010-11 2011-12 2012-13 2013-14 2014-15 2015-16 2016-17 2017-18
ENROLLMENT Fall New Freshmen* 419 465 413 469 413 416 376 356 Fall New Transfers 132 126 111 99 119 109 101 92 Fall Total Headcount 1,811 1,932 1,896 1,946 1,899 1,856 1,771 1,627 FYE Students** 1,898 1,898 1,876 1,859 1,807 1,755 1,688 1,560 Male:Female Ratio (%) 44:56 45:55 46:54 45:55 46:54 46:54 44:56 44:56
FRESHMAN APTITUDE Median HSR 80 80 80 80 78 78 75 74 Upper 25% HSR 59% 61% 60% 59% 55% 55% 52% 49% Upper 5% HSR 16% 14% 17% 16% 17% 12% 11% 12% Median ACT English 25 25 24 25 24 24 24 24 Median ACT Mathematics 24 25 25 25 25 25 25 25 Median ACT Composite 25 25 25 25 25 25 25 25
FRESHMAN APPLICATIONS Number of Applicants 2,312 2,397 2,374 2,649 2,900 3,621 3,414 3,211 % Offered Admission 64% 61% 59% 58% 63% 58% 58% 64% % Accepted Who Enrolled 28% 32% 29% 31% 23% 19% 19% 17%
TRANSFER APPLICATIONS Number of Applicants 298 435 387 399 404 382 303 312 % Offered Admission 58% 43% 46% 43% 46% 46% 48% 44% % Accepted Who Enrolled 76% 68% 62% 58% 64% 62% 70% 67%
STUDENT ORIGIN Minnesota Students 84% 82% 81% 80% 78% 77% 76% 74% Out of State Students 11% 10% 9% 11% 12% 13% 13% 15% International Students 6% 9% 10% 9% 10% 10% 11% 12% Surrounding Counties 11% 10% 8% 8% 7% 6% 8% 7% 7 County Metro Area 35% 34% 34% 33% 33% 31% 29% 28% Live On Campus 46% 49% 46% 48% 50% 52% 53% 52%
STUDENT:FACULTY FTE Faculty 114.6 120.1 125.3 128.2 128.5 127.9 127.8 123.1 Student:Faculty Ratio 14.9:1 15.2:1 14.5:1 14.5:1 14.5:1 13.7:1 13.2:1 12.7:1
*The "Fall New Freshmen" figure excludes PSEO enrolled students.**FYE (Full-Year Equivalent) student count is calculated by adding full-time students plus 1/3 part-time students.
University of Minnesota, MorrisStudent Body Information
25

A Five-Year Summary of Average ACT ScoresUMM New Freshman Scores
Means: Fall of Academic YearACT Score 2013-14 2014-15 2015-16 2016-17 2017-18
Composite Morris 25.3 25.0 25.1 24.9 24.9 25.0Nationwide 20.9 21.0 21.0 20.8 21.0 20.9
English Morris 24.9 24.3 24.3 24.1 24.0 24.3Nationwide 20.2 20.3 20.4 20.1 20.3 20.3
Mathematics Morris 24.7 24.4 24.5 24.2 24.3 24.4Nationwide 20.9 20.9 20.8 20.6 20.7 20.8
Reading Morris 26.3 25.9 26.2 25.8 25.8 26.0Nationwide 21.1 21.3 21.4 21.3 21.4 21.3
Science Morris 24.7 24.7 24.7 24.8 24.8 24.7Nationwide 20.7 20.8 20.9 20.8 21.0 20.8
National norms show the mean of the high school graduating class for the prior spring.
5-YearAverage
Compared to National NormsACT Scores
26
ACT data on OIR website under New Student Characteristics heading
DONE
02468
1012141618202224262830323436
Below 19 19-21 22-24 25-27 28-30 31-36
% o
f S
tud
en
tsACT Composite Scores of UMM Entering Students
5-Year Average (F'12 to F'16) vs. Fall 2017
5-Yr. Average, F'12-F'16 ACT Composite Fall 2017
27

44Wright
8Winona
37Washington
3Traverse
50Sherburne
16Scott
82Ramsey
10Nicollet
12Mille Lacs
11Mcleod
3Le Sueur
1Lac Qui Parle
1Kittson
9Kanabec
9Itasca
139Hennepin
8Goodhue
48Dakota
1Cook
13Chippewa
19Carver
4Big Stone
10Beltrami
100Anoka
10Yellow Medicine
1Wilkin
1Watonwan
5Waseca
3Wadena
13Todd
6Swift
64Stevens
2Steele
57Stearns
4Sibley
17Saint Louis
3Rock
11Rice
3Renville
8Redwood
12Pope
5Polk
5Pipestone
3Pine
3Pennington
28Otter Tail
17Olmsted
3Norman
9Nobles
1Mower
8Morrison
12Meeker
5Martin
1Marshall
2Mahnomen
8Lyon
1Lake
1Koochiching
25Kandiyohi
4Jackson
11Isanti
6Hubbard
9Grant
1Freeborn
2Fillmore
19Douglas
5Dodge
10Crow Wing
8Cottonwood
9Clay
17Chisago
7Cass
11Carlton
7Brown
15Blue Earth
11Benton
13Becker
2Aitkin
Minnesota for Data Book
1 139
Map based on Longitude (generated) and Latitude (generated). Color shows sum of Number of Records. The marks are labeled by sum of Number of Records and Home Loc Descr. Details are shown for Home Loc Descr and State. The view is filtered on State, which keeps Minnesota.
MINNESOTA Counties 79 Students 1,162 (74.8%)
OUT-OF-STATE States 32 Students 229 (14.7%)
INTERNATIONAL Countries 23 Students 163 (10.5%)
TOTAL STUDENTS 1,554
Origin of the UMM Student BodyFall 2018
0Murray
0Faribault
0Lincoln
0Houston
0Clearwater
0Roseau 0
Lake ofthe Woods
0Red Lake
0Wabasha
28

University of Minnesota, MorrisA Five-Year Summary of Fall Headcount Enrollment
for the University of Minnesota System
Fall of Academic YearCampus 2014-15 2015-16 2016-17 2017-18 2018-19
Crookston 2,850 2,823 2,676 2,834 2,810 -0.8% -1.4%Duluth 11,093 10,878 11,018 11,168 11,040 -1.1% -0.5%Morris 1,899 1,856 1,771 1,627 1,554 -4.5% -18.2%Rochester 488 416 435 472 533 12.9% 9.2%Twin Cities 51,147 50,678 51,580 51,848 50,943 -1.7% -0.4%
TOTAL 67,477 66,651 67,480 67,949 66,880 -1.6% -0.9%
University of Minnesota, MorrisA Five-Year Summary of Full-Year Equivalent Enrollment
in Regular Instruction for the University of Minnesota System
Academic YearCampus 2013-14 2014-15 2015-16 2016-17 2017-18
Crookston 1,904 1,914 1,890 1,827 1,810 -0.9% -4.9%Duluth 10,595 10,461 10,238 10,349 10,520 1.6% -0.7%Morris 1,909 1,830 1,781 1,716 1,633 -4.8% -14.5%Twin Cities 50,510 50,636 50,425 51,147 51,775 1.2% 2.5%
TOTAL 64,917 64,840 64,334 65,038 65,738 1.1% 1.3%
Note: Totals for each FY (fiscal year) ending June 30. Rochester FYE included with Twin Cities.
Percent of ChangeFall 2017 to 2018
Fall 2014 to 2015
Percent of ChangeFY 2017to 2018
FY 2014to 2018
HeadcountEnrollment
FYEEnrollment
29

Note: Non-degree headcount consists of new and continuing non-degree students. New non-degree counts include non-degree intercampus transfers, readmits and PSEO students.
0100200300400500600700800900
100011001200130014001500160017001800190020002100220023002400
'85 '87 '89 '91 '93 '95 '97 '99 '01 '03 '05 '07 '09 '11 '13 '15 '17
Num
ber o
f Stu
dent
s
Year
UMM Headcount EnrollmentFall 1985 to 2018
Degree-seeking Headcount Non-degree Headcount
30

University of Minnesota, MorrisA Five-Year Summary of Fall Headcount of Students of Color (SOC)*
for All Students within the University of Minnesota System
Academic YearCampus 2014-15 2015-16 2016-17 2017-18 2018-19
Crookston SOC 283 298 280 300 332 11.8%Non-SOC 2,567 2,525 2,396 2,534 2,478 88.2%
Duluth SOC 1,159 1,216 1,269 1,353 1,397 12.7%Non-SOC 9,934 9,662 9,749 9,815 9,643 87.3%
Morris SOC 485 480 482 484 459 29.5%Non-SOC 1,414 1,376 1,289 1,143 1,095 70.5%
Rochester SOC 94 87 115 130 171 32.1%Non-SOC 394 329 320 342 362 67.9%
Twin Cities SOC 8,759 9,107 9,677 10,214 10,678 21.0%Non-SOC 42,388 41,571 41,903 41,634 40,265 79.0%
TOTAL SOC 10,780 11,188 11,823 12,481 13,037 19.5%Non-SOC 56,697 55,463 55,657 55,468 53,843 80.5%
*Students of Color (SOC). Includes all non International students who identify their primary ethnic background as AfricanAmerican, American Indian, Asian/Pacific, Hawaiian, or Hispanic.Non Students of Color (Non-SOC). Includes all International students and others who do not fit into the Student of Color category.
2018-19 SOC as %of Total Campus
Headcount
Studentsof Color
31

Degree-seeking Undergraduates
American Indian 77 4.0% 108 6.1% 142 9.3% 213 12.6% 311 17.9% 311 18.5% 320 20.6% 306 20.6%Asian 74 3.8% 48 2.7% 46 3.0% 54 3.2% 65 3.7% 65 3.9% 65 4.2% 56 3.8%Hawaiian+ NA NA NA 1 0.1% 2 0.1% 1 0.1% 3 0.2% 3 0.2%African American 83 4.3% 103 5.9% 32 2.1% 43 2.5% 41 2.4% 43 2.6% 41 2.6% 36 2.4%Hispanic 30 1.5% 25 1.4% 22 1.4% 31 1.8% 55 3.2% 53 3.2% 51 3.3% 49 3.3%Subtotal Students of Color* 264 13.6% 284 16.2% 242 15.8% 342 20.2% 474 27.2% 473 28.2% 480 30.9% 450 30.2%
White 1651 84.9% 1439 81.9% 1241 81.0% 1222 72.3% 1078 61.9% 1009 60.1% 899 57.9% 870 58.5%International 18 0.9% 6 0.3% 17 1.1% 100 5.9% 184 10.6% 191 11.4% 171 11.0% 160 10.8%Unknown 11 0.6% 29 1.6% 33 2.2% 26 1.5% 5 0.3% 7 0.4% 4 0.3% 8 0.5%
Total Headcount 1944 100% 1758 100% 1533 100% 1690 100% 1741 100% 1680 100% 1554 100% 1488 100%
Entire Student Body
American Indian 77 3.9% 109 5.9% 148 8.8% 221 12.2% 317 17.1% 315 17.8% 321 19.7% 312 20.1%Asian 74 3.8% 48 2.6% 46 2.7% 56 3.1% 65 3.5% 68 3.8% 65 4.0% 57 3.7%Hawaiian+ NA NA NA 1 0.1% 2 0.1% 1 0.1% 3 0.2% 3 0.2%African American 83 4.3% 103 5.6% 32 1.9% 43 2.4% 41 2.2% 43 2.4% 41 2.5% 36 2.3%Hispanic 30 1.5% 25 1.4% 23 1.4% 33 1.8% 55 3.0% 55 3.1% 55 3.4% 51 3.3%Subtotal Students of Color* 264 13.5% 285 15.5% 249 14.8% 354 19.5% 480 25.9% 482 27.2% 485 29.8% 459 29.5%
White 1659 85.0% 1501 81.5% 1313 78.0% 1306 72.1% 1170 63.0% 1072 60.5% 943 58.0% 909 58.5%International 18 0.9% 6 0.3% 19 1.1% 100 5.5% 193 10.4% 201 11.3% 188 11.6% 163 10.5%Unknown 11 0.6% 50 2.7% 103 6.1% 51 2.8% 13 0.7% 16 0.9% 11 0.7% 23 1.5%
Total Headcount 1952 100% 1842 100% 1684 100% 1811 100% 1856 100% 1771 100% 1627 100% 1554 100%*Does not include international students of color.+Hawaiian students included with Asian prior to F09. Source: UMM Institutional Research extract of OIR-TC official fall stix file
Fall 2000Fall 1995 Fall 2018Fall 2005 Fall 2015Fall 2010 Fall 2017Fall 2016
UMM Fall Headcount by Ethnic Background
Degree-seeking Undergraduate Headcount and Entire Student Body Headcount
Fall 2015 Fall 2017 Fall 2018Fall 2005 Fall 2010Fall 2000Fall 1995 Fall 2016
EthnicBackground
32

New High School(NHS) Students
American Indian 17 3.2% 22 4.6% 41 11.5% 71 16.9% 71 17.1% 76 20.2% 83 23.3% 91 24.6%Asian 18 3.4% 16 3.4% 14 3.9% 18 4.3% 19 4.6% 14 3.7% 24 6.7% 13 3.5%Hawaiian+ NA NA NA 0 0.0% 1 0.2% 0 0.0% 1 0.3% 0 0.0%African American 33 6.2% 20 4.2% 7 2.0% 15 3.6% 14 3.4% 11 2.9% 15 4.2% 10 2.7%Hispanic 5 0.9% 6 1.3% 6 1.7% 10 2.4% 14 3.4% 14 3.7% 17 4.8% 17 4.6%Subtotal Students of Color* 73 13.7% 64 13.5% 68 19.0% 114 27.2% 119 28.6% 115 30.6% 140 39.3% 131 35.4%
White 453 84.8% 393 82.9% 278 77.7% 297 70.9% 275 66.1% 243 64.6% 208 58.4% 225 60.8%International 1 0.2% 2 0.4% 3 0.8% 6 1.4% 22 5.3% 14 3.7% 6 1.7% 10 2.7%Unknown 7 1.3% 15 3.2% 9 2.5% 2 0.5% 0 0.0% 4 1.1% 2 0.6% 4 1.1%
Total Headcount 534 100% 474 100% 358 100% 419 100% 416 100% 376 100% 356 100% 370 100.0%
New Advanced Standing**(NAS) Students
American Indian 4 5.5% 11 11.7% 10 17.9% 16 12.1% 19 17.4% 16 15.8% 15 16.3% 18 25.0%Asian 3 4.1% 3 3.2% 0 0.0% 1 0.8% 6 5.5% 1 1.0% 1 1.1% 0 0.0%Hawaiian+ NA NA NA 0 0.0% 0 0.0% 0 0.0% 1 1.1% 1 1.4%African American 6 8.2% 11 11.7% 0 0.0% 0 0.0% 2 1.8% 0 0.0% 0 0.0% 2 2.8%Hispanic 2 2.7% 3 3.2% 0 0.0% 1 0.8% 2 1.8% 3 3.0% 0 0.0% 1 1.4%Subtotal Students of Color* 15 20.5% 28 29.8% 10 17.9% 18 13.6% 29 26.6% 20 19.8% 17 18.5% 22 30.6%
White 51 69.9% 59 62.8% 38 67.9% 65 49.2% 31 28.4% 23 22.8% 22 23.9% 17 23.6%International 6 8.2% 0 0.0% 3 5.4% 48 36.4% 48 44.0% 58 57.4% 53 57.6% 33 45.8%Unknown 1 1.4% 7 7.4% 5 8.9% 1 0.8% 1 0.9% 0 0.0% 0 0.0% 0 0.0%
Total Headcount 73 100% 94 100% 56 100% 132 100% 109 100% 101 100% 92 100% 72 100.0%*Does not include international students of color.**Transfer students +Hawaiian students included with Asian prior to F09. Source: UMM Institutional Research extract of OIR-TC official fall stix file
Fall 2000Fall 1995
Fall 2000
Fall 2018Fall 2005 Fall 2017Fall 2015Fall 2010
Fall 1995
Fall 2016
New High School Student Headcounts and Transfer Student HeadcountsUMM Fall Headcount by Ethnic Background
Fall 2018Fall 2017Fall 2010 Fall 2015Fall 2005 Fall 2016
EthnicBackground
33

University of Minnesota, MorrisOfficial Student Enrollment Statistics for Fall 2001-2018
New Freshmen
New Advanced
Readmit, ICT, NA
TotalNew Cont. Total New Cont. Total
Not Avail.
Total Headcount
Total FYE
Actual EnrollmentFall 2001 480 82 17 579 1233 1812 97 17 114 94.0% / 5.9% 1 1927 1932Fall 2002 477 67 8 552 1235 1787 95 26 121 93.6% / 6.3% 2 1910 1898Fall 2003 412 74 9 495 1231 1726 112 21 133 92.7% / 7.1% 2 1861 1872Fall 2004 387 63 14 464 1216 1680 132 22 154 91.4% / 8.4% 5 1839 1794Fall 2005 358 56 9 423 1109 1532 128 23 151 91.0% / 9.0% 1 1684 1673Fall 2006 380 106 12 498 1065 1563 161 19 180 89.5% / 10.3% 4 1747 1681Fall 2007 363 101 17 481 1062 1543 120 23 143 91.5% / 8.5% 0 1686 1681Fall 2008 374 79 18 471 1019 1490 73 24 97 92.7% / 6.0% 20 1607 1611Fall 2009 405 103 19 527 1071 1598 80 26 106 93.7% / 6.2% 1 1705 1686Fall 2010 419 132 34 585 1105 1690 93 28 121 93.3% / 6.7% 0 1811 1751Fall 2011 465 126 17 608 1214 1822 83 27 110 94.3% / 5.7% 0 1932 1898Fall 2012 413 111 13 537 1251 1788 76 32 108 94.3% / 5.7% 0 1896 1876Fall 2013 469 99 7 575 1271 1846 75 25 100 94.9% / 5.1% 0 1946 1909Fall 2014 413 119 9 541 1262 1803 76 20 96 94.9% / 5.1% 0 1899 1830
Fall 2015 416 109 19 544 1197 1741 92 23 115 93.8% / 6.2% 0 1856 1781Fall 2016 376 101 14 491 1189 1680 58 33 91 94.9% / 5.1% 0 1771 1716Fall 2017 356 92 7 455 1099 1554 51 22 73 95.5% / 4.5% 0 1627 1633Fall 2018 370 72 9 451 1037 1488 49 17 66 95.8% / 4.2% 0 1554 1493
FYE from official University of Minnesota Institutional Research report or query.
Notes: "ICT" refers to Inter-Campus Transfers; "Cont." refers to continuing students; "FYE" to Full-Year Equivalent. Continuing students enrolled at UMM the previous year are
labeled as "Same Unit" in official reports. New non-degree counts include non-degree ICT and readmits. PSEO students are counted in "New Non-Degree" counts.
Year
Degree-Seeking (DS) Students
%-ageDS / ND
Non-Degree (ND) Students
Official Enrollment
34

University of Minnesota, MorrisOut-of-State and International Student Enrollments*
Home State No. %-age No. %-age No. %-age No. %-age No. %-age
North Dakota 21 1.1% 18 1.0% 15 0.8% 18 1.1% 29 1.9%
South Dakota 80 4.2% 75 4.0% 74 4.2% 76 4.7% 75 4.8%
Wisconsin 31 1.6% 37 2.0% 33 1.9% 43 2.6% 39 2.5%
Other States (Not Minn.) 96 5.1% 100 5.4% 90 5.1% 102 6.3% 86 5.5%
Total Out-of-State 228 12.0% 230 12.4% 212 12.0% 239 14.7% 229 14.7%
International 177 9.3% 195 10.5% 207 11.7% 193 11.9% 163 10.5%
Not reported 43 2.3% 47 2.5% 37 2.1% 1 0.1% 0 0.0%
Total UMM Headcount 1,899 1,856 1,771 1,627 1,554
*Data is based on the home county, state, or country that students indicated when first applying to UMM.
Fall 2018Fall 2014 Fall 2015 Fall 2016 Fall 2017
Out-of-StateStudents
35

Destination/RegionEurope 83 54 68 93 66 88 70Latin America/Caribbean 8 9 9 12 7 11 28Asia, Pacific, Africa 16 11 15 18 16 10 7Australia, New Zealand, Canada 20 81 27 4 26 59 1Multiple Regions 0 0 0 1 1 0 0Total 127 155 119 128 116 168 106
DurationAcademic or Calendar Year 3 4 8 5 5 3 2Quarter or Semester (10-15 wks) 50 27 21 30 25 27 30Summer (4-10 weeks) 42 41 19 7 17 31 30Short-term (3 weeks) 32 83 71 86 69 107 44Total 127 155 119 128 116 168 106
Academic LevelFreshman 5 13 16 6 8 9 0Sophomore 12 30 28 27 18 18 18Junior 24 31 29 40 39 38 28Senior 86 81 45 55 51 103 59Other 0 0 1 0 0 0 1Total 127 155 119 128 116 168 106
GenderFemale 87 117 90 92 90 123 81Male 40 38 29 36 26 45 25Total 127 155 119 128 116 168 106
UMM StudentsTotal Travelling Abroad-UMM 98 152 119 128 116 168 106As % of Total Enrollment 5.1% 8.0% 7.1% 7.9% 7.5% 11.3% 7.7%As % of Degrees Granted 29.0% 44.2% 32.0% 34.1% 33.0% 45.7% 31.4%
Beginning with 2013-14, this data includes only degree-seeking students at UMM who are U.S. citizens or permanent residents.
University of Minnesota, MorrisStudent Study Abroad Enrollments
2011-12 2012-13 2013-14 2014-15 2015-16 2016-17 2017-18
36

Through its student survey, NSSE annually collects information at hundreds of four-year colleges and universities about first-year and seniorstudents' participation in programs and activities that institutions provide for their learning and personal development. The results provide anestimate of how undergraduates spend their time and what they gain from attending college. Survey items represent empirically confirmed "goodpractices" in undergraduate education. That is, they reflect behaviors by students and institutions that are associated with desired outcomes ofcollege. NSSE doesn’t assess student learning directly, but survey results point to areas where colleges and universities are performing well andaspects of the undergraduate experience that could be improved.
NSSE is administered during spring semester. UMM's 2017 response rate for first-year students was 47% and for senior students was 51%.This compares with average response rates at other Baccalaurate Liberal Arts institutions of 35% for first-year students and 38% for seniors.UMM participates in the NSSE survey every three years.
Which of the following have you done or do you plan to do before you graduate?
Participate in a study abroad program
Have not decided 13 7% 507 10% 789 5% 30,892 12%Do not plan to do 84 51% 3,465 70% 8,877 53% 180,808 67%Plan to do or Done 79 42% 971 20% 7,612 43% 61,375 21%Total 176 100% 4,943 100% 17,278 100% 273,075 100%
Work with a faculty member on a research project
Have not decided 14 8% 593 12% 1,027 6% 39,768 15%Do not plan to do 73 41% 2,337 46% 6,994 40% 133,997 49%Plan to do or Done 90 52% 2,011 41% 9,214 53% 98,855 35%Total 177 100% 4,941 100% 17,235 100% 272,620 100%
Complete a culminating senior experience (capstone course, senior project or thesis, comprehensive exam, portfolio, etc.)
Have not decided 4 2% 321 7% 414 3% 24,347 10%Do not plan to do 9 5% 772 16% 2,068 12% 55,731 21%Plan to do or Done 163 94% 3,847 77% 14,787 85% 192,574 69%Total 176 100% 4,940 100% 17,269 100% 272,652 100%
Hold a formal leadership role in a student organization or group
Have not decided 4 2% 450 9% 724 4% 29,829 12%Do not plan to do 59 34% 2,215 45% 4,510 27% 118,549 45%Plan to do or Done 114 63% 2,298 46% 12,077 69% 125,210 43%Total 177 100% 4,963 100% 17,311 100% 272,588 100%
(Continued next page)
Senior Students
Morris COPLAC1 BAC-LA2 NSSE3
National Survey of Student Engagement (NSSE)2017 UMM Student Responses: Seniors
Morris COPLAC1 BAC-LA2 NSSE3
Senior Students
Morris COPLAC1 BAC-LA2
Morris COPLAC1 BAC-LA2
Senior StudentsNSSE3
NSSE3
Senior Students
37

National Survey of Student Engagement (NSSE)2017 UMM Student Responses: Seniors
How much does your institution emphasize the following?
Attending campus activities and events (performing arts, athletic events, etc.)
Very little 6 3% 581 13% 1,180 8% 41,140 18%Some 48 28% 1,374 29% 4,549 27% 76,912 29%Quite a bit 80 45% 1,738 37% 6,770 40% 89,040 33%Very much 42 24% 1,037 21% 4,247 25% 53,324 20%Total 176 100% 4,730 100% 16,746 100% 260,416 100%
About how many hours do you spend in a typical 7-day week doing the following?
0 hrs 31 17% 1,844 39% 2,407 15% 105,077 43%1-10 hrs 98 57% 2,072 44% 8,883 52% 108,829 40%11-20 hrs 35 20% 552 12% 3,661 22% 32,419 12%More than 20 hrs 12 7% 249 6% 1,709 10% 13,343 5%Total 176 100% 4,717 100% 16,660 100% 259,668 100%
Working for pay on campus
0 hrs 65 37% 3,127 67% 6,967 44% 180,577 72%1-10 hrs 95 53% 776 15% 6,524 37% 36,745 12%11-20 hrs 15 9% 647 13% 2,632 15% 32,948 12%More than 20 hrs 2 1% 174 4% 578 5% 9,612 4%Total 177 100% 4,724 100% 16,701 100% 259,882 100%
2BAC-LA is a group of 143 baccalaureate colleges with an arts and sciences focus who participated in NSSE 2017.3The NSSE group includes 961 U.S. colleges who participated in NSSE 2016 and/or 2017.Note: Column percentages are weighted by institution-reported sex and enrollment status (and institution size for comparison groups). Percentages may not sumto 100 due to rounding. Counts are unweighted; column percentages cannot be replicated from counts.
Senior Students
1COPLAC is the Council of Public Liberal Arts Colleges, consisting of 30 colleges and universities in 28 states and one Canadian province; 23 of these colleges participated in NSSE 2017.
Participating in co-curricular activities (organizations, campus publications, student government, fraternity or sorority, intercollegiate or intramural sports, etc.)
Morris COPLAC1 BAC-LA2 NSSE3
Morris COPLAC1 BAC-LA2 NSSE3
Senior Students
NSSE3
Senior StudentsMorris COPLAC1 BAC-LA2
38

University of Minnesota, MorrisCohort Retention/Graduation Rates for UMM Freshmen
Returned for Subsequent Year GraduatedEntered Soph Year Jr Year Sr Year In 4 Yrs In 5 Yrs In 6 Yrs To Date
Fall 1999 UMM Only 76.2% 64.7% 59.4% 38.4% 52.3% 54.7% 56.3%N=453 UMM in All-UM 80.4% 69.3% 66.0% 40.2% 55.8% 58.9% 60.5%Fall 2000 UMM Only 82.4% 66.3% 61.8% 39.9% 53.4% 57.5% 58.8%N=467 UMM in All-UM 85.0% 71.7% 68.5% 41.0% 57.1% 62.2% 64.4%Fall 2001 UMM Only 79.1% 65.8% 63.4% 43.8% 55.4% 57.9% 58.8%N=473 UMM in All-UM 82.7% 70.2% 68.1% 44.4% 57.7% 61.1% 62.4%Fall 2002 UMM Only 77.3% 71.6% 64.2% 46.1% 60.0% 62.7% 63.8%N=475 UMM in All-UM 79.6% 74.1% 67.6% 47.4% 62.5% 65.9% 67.6%Fall 2003 UMM Only 83.7% 70.3% 65.9% 43.6% 58.2% 59.6% 61.6%N=411 UMM in All-UM 86.6% 76.4% 72.7% 45.0% 63.0% 66.4% 68.9%Fall 2004 UMM Only 81.2% 74.9% 70.5% 53.5% 64.2% 65.8% 66.6%N=383 UMM in All-UM 85.6% 80.7% 77.3% 56.1% 68.7% 71.8% 72.6%Fall 2005 UMM Only 79.9% 67.1% 63.7% 48.4% 59.2% 60.3% 62.2%N=353 UMM in All-UM 83.0% 73.7% 71.1% 50.7% 65.2% 67.1% 69.0%Fall 2006 UMM Only 81.1% 68.6% 64.9% 47.6% 58.2% 60.6% 62.0%N=376 UMM in All-UM 84.0% 72.6% 68.6% 49.7% 62.0% 64.4% 66.8%Fall 2007 UMM Only 84.6% 74.6% 68.2% 50.3% 60.6% 63.4% 64.5%N=358 UMM in All-UM 87.4% 79.3% 74.3% 51.7% 64.0% 68.7% 70.4%Fall 2008 UMM Only 85.5% 74.3% 70.8% 53.6% 65.4% 66.8% 68.1%N=373 UMM in All-UM 87.4% 79.9% 77.5% 57.4% 71.8% 73.5% 75.1%Fall 2009 UMM Only 81.2% 73.3% 70.3% 51.0% 63.9% 65.3% 65.8%N=404 UMM in All-UM 83.2% 76.2% 73.8% 53.2% 66.3% 68.1% 69.1%Fall 2010 UMM Only 82.5% 71.3% 67.2% 50.5% 62.2% 63.9% 64.6%N=418 UMM in All-UM 86.4% 77.0% 72.5% 53.3% 67.0% 69.1% 69.9%Fall 2011 UMM Only 78.4% 68.2% 65.2% 49.6% 57.4% 58.7%N=462 UMM in All-UM 81.4% 73.2% 71.0% 52.6% 62.1% 64.1%Fall 2012 UMM Only 87.0% 75.3% 70.9% 52.1% 64.1%N=409 UMM in All-UM 88.0% 79.0% 75.8% 54.5% 68.0%Fall 2013 UMM Only 78.8% 66.7% 63.7% 46.6%N=468 UMM in All-UM 81.2% 71.8% 68.6% 48.9%Fall 2014 UMM Only 77.1% 67.2% 63.3%N=411 UMM in All-UM 80.3% 72.3% 69.3%Fall 2015 UMM Only 77.8% 66.7%N=414 UMM in All-UM 81.4% 71.7%Fall 2016 UMM Only 80.3%N=375 UMM in All-UM 81.9%3-Year UMM Only 78.4% 66.8% 65.9% 49.4% 61.2% 62.6% 66.2%Average UMM in All-UM 81.2% 71.9% 71.2% 52.0% 65.7% 67.1% 71.4%
Note: Beginning fall 2000, retention statistics are based on revised cohort definitions.Rates are shown first for freshmen who entered UMM and remained on the Morris campus, and second, for freshmen who entered UMM and remained or graduated from any campus within the University of Minnesota system.Cohort retention shows the percentage of the entering freshmen returning for their sophomore year and so on for each subsequent year. Includes students retained or who graduated in less than 4 years. Data from the University of Minnesota Undergraduate Retention Report.
StudentRetention
39

Morris Graduation Rates: Within UM System
Four-, five-, and six-year graduation rates of first-time, full-time undergraduate students who entered theUniversity of Minnesota, Morris, and graduated anywhere within the University of Minnesota system.
31.2%
41.0% 45.3%
41.0%
50.7% 49.7% 51.7% 57.4%
53.2% 53.3% 52.6% 54.5% 48.9%
60.0%
17.8%
21.5% 13.7% 16.1%
14.5% 12.3%
12.3%
14.4%
13.1% 13.7% 9.5%
13.5%
15.0%
2.0%
4.0%
2.4% 5.1%
1.9% 2.4%
4.7%
1.7%
1.8% 2.1%
2.0%
5.0%
0%
5%
10%
15%
20%
25%
30%
35%
40%
45%
50%
55%
60%
65%
70%
75%
80%
85%
Gra
du
ati
on
Rate
Year of Matriculation
4-year graduation rate 5-year graduation rate 6-year graduation rate
Goals
40

Returned for Subsequent YearEntered N Soph Year Jr Year Sr Year In 4 Yrs In 5 Yrs In 6 Yrs To Date
American Indian Students, Students of Color*, Non Students of Color, All UMM Freshmen
Graduated
University of Minnesota, MorrisCohort Retention/Graduation Rates for Freshmen
StudentRetention
Fall 2007 AmerIndian 29 79.3% 65.5% 58.6% 34.5% 44.8% 55.2% 58.6%SOC 30 90.0% 76.7% 76.7% 43.3% 56.7% 63.3% 63.3%White 281 89.0% 82.2% 76.5% 55.9% 67.6% 71.9% 73.0%All UMM 358 87.4% 79.3% 74.3% 51.7% 64.0% 68.7% 70.4%
Fall 2008 AmerIndian 38 86.8% 71.1% 60.5% 34.2% 44.7% 52.6% 55.3%SOC 29 93.1% 82.8% 86.2% 51.7% 75.9% 75.9% 82.8%White 286 86.7% 80.1% 78.3% 60.8% 74.1% 75.2% 76.2%All UMM 373 87.4% 79.9% 77.5% 57.4% 71.8% 73.5% 75.1%
Fall 2009 AmerIndian 58 70.7% 55.2% 51.7% 19.0% 37.9% 43.1% 46.6%SOC 22 77.3% 68.2% 72.7% 59.1% 63.6% 68.2% 68.2%White 315 85.7% 80.6% 78.1% 59.4% 72.1% 73.0% 73.7%All UMM 404 83.2% 76.2% 73.8% 53.2% 66.3% 68.1% 69.1%
Fall 2010 AmerIndian 71 78.9% 67.6% 57.7% 39.4% 52.1% 56.3% 56.3%SOC 43 88.4% 74.4% 72.1% 46.5% 62.8% 62.8% 62.8%White 296 87.8% 79.7% 75.7% 58.1% 71.6% 73.3% 74.0%All UMM 418 86.4% 77.0% 72.5% 53.3% 67.0% 69.1% 69.9%
Fall 2011 AmerIndian 70 70.0% 62.9% 54.3% 42.9% 51.4% 51.4%SOC 35 74.3% 62.9% 60.0% 28.6% 45.7% 48.6%White 345 83.8% 76.2% 74.5% 57.4% 66.4% 68.7%All UMM 462 81.4% 73.2% 71.0% 52.6% 62.1% 64.1%
Fall 2012 AmerIndian 75 80.0% 69.3% 60.0% 40.0% 57.3%SOC 39 84.6% 61.5% 61.5% 33.3% 51.3%White 281 90.7% 84.3% 81.9% 62.3% 73.7%All UMM 409 88.0% 79.0% 75.8% 54.5% 68.0%
Fall 2013 AmerIndian 70 80.0% 68.6% 58.6% 30.0%SOC 47 85.1% 74.5% 72.3% 44.7%White 343 81.0% 72.6% 70.6% 53.6%All UMM 468 81.2% 71.8% 68.6% 48.9%
Fall 2014 AmerIndian 80 76.3% 60.0% 55.0%SOC 47 78.7% 72.3% 68.1%White 273 81.7% 75.5% 73.3%All UMM 411 80.3% 72.3% 69.3%
Fall 2015 AmerIndian 71 78.9% 74.6%SOC 48 77.1% 60.4%White 273 82.4% 72.5%All UMM 414 81.4% 71.7%
Fall 2016 AmerIndian 76 80.3%SOC 39 71.8%White 242 84.7%All UMM 375 81.9%
AmerIndian 74.4 79.1% 67.1% 57.1% 34.3% 48.7% 51.7% 54.2%5-Year SOC 44.0 79.5% 66.3% 66.8% 42.4% 59.9% 63.8% 69.3%Average White 282.4 84.1% 76.2% 75.2% 58.2% 71.6% 72.4% 74.2%
All UMM 415.4 82.6% 73.6% 71.4% 52.5% 67.0% 68.7% 71.1%*Students of Color (SOC) for this table do not include American Indian students.Rates are shown first for freshmen who entered UMM and remained or graduated from any campus within the University of Minnesota system. Cohort retention shows the percentage of the entering freshmen returning for their sophomore year and so on for each subsequent year. Includes students retained or who graduated in less than 4 years. Data from the University of Minnesota Student Retention Report of 2017.
41

for
ACADEMIC PROGRAM INFORMATION
Five-year summaries of the declared majors and minors for the entire student body as well as degrees granted by major and minor are provided as an indication of student interest and demand for programs offered at UMM. A line chart shows the change in the pattern of declared majors of the student body from spring 2014 to 2018. The table showing student:faculty ratios also contains a column for Full-Year Equivalent (FYE) students which represents a student demand for the courses of that discipline. This statistic is determined by dividing the academic year total student credit hours taught in a given discipline by the standard full-time credit load for a single student.
The student:faculty ratio table also indicates Full-Time Equivalent (FTE) faculty which is based upon the actual teaching loads ofboth the full- and part-time faculty or instructional staff in that discipline for the given year. The current student:faculty ratios are shown as well as the five-year average. Two related charts show the distribution of course enrollments expressed as FYE students among the four divisions and the distribution of instructional resources expressed as FTE faculty among those same divisions. The charts illustrate both student demand and the allocation of faculty resources. An additional table is provided showing the annualtotal of student credit hours taught, total enrollment in all courses offered, number of upper and lower division classes (including multiple sections), and FTE faculty for each discipline. The data represent some of the more conventional indices of discipline teaching load.
One of the tables shows FTE teaching positions for the most recent five years. During the past several years, UMM has shiftedsome civil service and faculty positions into the Academic Professional and Administrative (P&A) staff category; these instructional staff positions are included in the FTE teaching count. The FTE calculation prorates the equivalent of full-time teaching positions committed to instruction in that discipline. Part-time positions are added in proportion to the number of credits taught. Teaching faculty with administrative responsibilities have a portion of their position deducted in like fashion (division chairs and sport studies and athletics staff with coaching responsibilities are examples).
The table showing faculty salaries includes nine- and ten-month faculty with full-time teaching responsibilities. Division chairs and faculty members with primarily administrative responsibilities have been excluded. Ten-month salaries have been converted toshow their nine-month equivalent. Finally, the percentage of the total faculty who are tenured, who are women, or who are facultyof color is shown. The final chart shows the change in the percentages of tenured faculty, women faculty, and faculty of color over the years.
Elaborate academic profile and planning data covering nearly every facet of faculty characteristics, salaries, student demand, work load, cost and productivity statistics are maintained. Most have been collected annually in a consistent fashion for severaldecades. In addition, University-wide information is available on many of these same characteristics provided by the central administration. The UMM Institutional Research Office is the best single source for this data.
42

University of Minnesota, MorrisDeclared Majors of the Student Body
as of Spring Term
Declared Major 2014 2015 2016 2017 2018EDUCATION DIVISION Elementary Education 105 96 92 81 79 Secondary Education* 118 114 101 84 80 Sport Management 56 60 64 54 51
Subtotal: 279 270 257 219 210HUMANITIES DIVISION Art History 11 11 10 11 11 Art Studio 56 42 42 42 52 Communication, Media, and Rhetoric 61 59 46 49 42 English 130 111 104 101 75 French 22 23 15 16 13 German/German Studies 12 12 13 11 9 Medieval Studies -- -- -- -- 9 Music 35 30 28 27 22 Philosophy 30 25 16 11 17 Spanish 60 39 50 47 31 Theatre Arts 30 25 35 28 22
Subtotal: 447 377 359 343 303SCIENCE & MATH DIVISION Biology 263 294 290 283 272 Chemistry 126 127 118 104 93 Computer Science 98 103 103 111 115 Environmental Science 46 49 60 54 48 Geology 28 33 28 19 14 Mathematics 74 69 61 62 61 Physics 40 32 25 23 26 Statistics 47 35 46 57 60
Subtotal: 722 742 731 713 689SOCIAL SCIENCE DIVISION Anthropology 31 31 35 36 40 Economics 141 143 113 89 97 History 64 61 46 52 58 Human Services 63 53 59 67 55 Management@ 160 139 125 127 110 Political Science 66 57 48 45 51 Psychology 212 206 212 193 170 Social Science 24 24 21 19 24 Sociology 28 24 27 43 42 Gender,Women,Sexuality Studies 11 5 7 7 4
Subtotal: 800 743 693 678 651
(Continued next page)
Majors
43

University of Minnesota, MorrisDeclared Majors of the Student Body
as of Spring Term
Declared Major 2014 2015 2016 2017 2018
INTERDISCIPLINARY Environmental Studies 37 45 50 43 48 Latin Amer. Studies 7 8 6 6 7 Native American & Indigenous Studies 20 19 18 18 18 Misc./Area/Option 26 22 23 18 10
Subtotal: 90 94 97 85 83
PREPROFESSIONAL PROGRAMS Pre-Dentistry# 13 11 8 5 8 Pre-Engineering 29 26 31 31 23 Pre-Law# 23 22 19 15 16 Pre-Medicine# 112 96 104 94 103 Pre-Nursing 12 15 21 11 11 Pre-Pharmacy 15 15 14 19 15 Pre-Physical Therapy 21 30 22 22 11 Pre-Vet Medicine# 25 29 35 32 31 Other Pre-Professional 0 0 0 0 0
Subtotal: 250 244 254 229 218
TOTAL DECLARED MAJORS 2,470 2,356 2,290 2,183 2,074 UNDECIDED 61 46 55 58 29 HONORS PROGRAM 84 62 38 51 66 HIGH SCHOOL (PSEO) 23 28 44 37 26 NON-DEGREE STUDENT HEADCOUNT 17 17 40 14 21 OFFICIAL SPRING ENROLLMENT 1,782 1,711 1,694 1,594 1,526
*Secondary education is a licensure program, not a major.@Mgmt includes students admitted to the Mgmt program and any other students who declare Mgmt as their major.#Four-year bachelor of arts programs.Information from UM Management Reporting Student Roster Detail Report.
44

Note: Education Division percentages include secondary education licensure students.
Trends in Percentage of Declared Majors by Division
0%
5%
10%
15%
20%
25%
30%
35%
2012 2013 2014 2015 2016 2017 2018
Science & Math
Social Sciences
Humanities
Education
Preprofessional
Interdisc.
45

University of Minnesota, MorrisDeclared Minors of the Student Body
as of Spring Term
Declared Minor 2014 2015 2016 2017 2018
EDUCATION DIVISION Sport Management 10 10 3 4 2
Subtotal: 10 10 3 4 2
HUMANITIES DIVISION Art History 16 11 14 12 4 Art Studio 12 16 11 5 9 Communication, Media, and Rhetoric 22 23 23 18 25 English 21 19 16 12 13 Creative Writing Minor for non-English Majors -- -- 4 10 9 French 9 10 6 4 6 German/German Studies 4 3 4 5 5 Medieval Studies -- -- -- -- 0 Music 20 15 12 10 18 Philosophy 8 11 8 8 8 Spanish 28 18 15 17 32 Theatre Arts 9 5 7 3 9
Subtotal: 149 131 120 104 138
SCIENCE & MATH DIVISION Biology 42 45 60 46 39 Chemistry 34 32 25 27 22 Computer Science 6 7 13 13 6 Geology 4 3 5 7 3 Mathematics 50 43 49 44 37 Physics 1 7 4 5 4 Statistics 30 28 37 21 25
Subtotal: 167 165 193 163 136
SOCIAL SCIENCE DIVISION Anthropology 8 9 8 6 8 Economics 23 10 18 10 6 Gender,Women,Sexuality Studies 10 6 10 10 5 History 27 28 27 16 13 Management 25 19 21 24 25 Political Science 18 22 22 14 13 Psychology 32 25 27 25 27 Sociology 9 8 15 14 7
Subtotal: 152 127 148 119 104
(Continued next page)
Minors
46

University of Minnesota, MorrisDeclared Minors of the Student Body
as of Spring Term
Declared Minor 2014 2015 2016 2017 2018
INTERDISCIPLINARY African and Black American Studies 2 0 0 1 4 Latin American Area Studies -- 2 2 0 0 Native American & Indigenous Studies 9 14 18 19 15 Misc./Area/Option 8 3 3 11 11
Subtotal: 19 19 23 31 30
TOTAL DECLARED MINORS 497 452 487 421 410 INDIVIDUAL STUDENTS WITH MINORS 439 405 416 364 364 OFFICIAL SPRING ENROLLMENT 1,782 1,711 1,694 1,594 1,526
Information from UM Management Reporting Student Roster Detail Report.
47

University of Minnesota, MorrisNumber of Bachelor of Arts Degrees
Granted by Major
5 Yr. Major 2013-14 2014-15 2015-16 2016-17 2017-18 Average
EDUCATION DIVISIONElementary Education 24 24 15 21 17 20.2Secondary Education1 18 16 13 12 9 13.6Sport Management 9 9 11 16 13 11.6Subtotal 51 49 39 49 39 45.4
HUMANITIES DIVISIONArt History 6 3 3 3 4 3.8Art Studio 16 9 8 10 8 10.2Communication, Media, & Rhetoric 15 16 11 12 11 13.0English 32 32 18 40 18 28.0French 6 9 2 5 4 5.2German2 1 1 2 0 0 0.8German Studies3 2 1 0 5 0 1.6Medieval Studies NA NA NA NA 3 3.0Music 8 5 4 4 1 4.4Philosophy 3 9 2 2 5 4.2Spanish 17 6 10 14 8 11.0Theatre Arts 6 3 5 5 3 4.4Subtotal 112 94 65 100 65 87.2
SCIENCE & MATH DIVISIONBiology 45 41 54 37 56 46.6Chemistry 16 21 22 21 22 20.4Computer Science 12 20 29 22 21 20.8Environmental Science 6 7 8 7 9 7.4Geology 2 10 10 8 8 7.6Mathematics 12 11 12 8 11 10.8Physics 6 8 5 2 3 4.8Statistics 14 14 10 12 12 12.4Subtotal 113 132 150 117 142 130.8
(Continued next page)
B.A. Degree
48

University of Minnesota, MorrisNumber of Bachelor of Arts Degrees
Granted by Major
5 Yr. Major 2013-14 2014-15 2015-16 2016-17 2017-18 Average
SOCIAL SCIENCE DIVISIONAnthropology 7 14 5 12 8 9.2Economics 22 28 47 25 9 26.2Gender,Women,Sexuality 2 3 0 3 0 1.6History 11 15 12 11 13 12.4Human Services4 NA NA NA 2 17 9.5Lib. Arts Human Services5 14 21 10 17 3 13.0Management 33 39 30 29 23 30.8Political Science 21 11 14 10 14 14.0Psychology 44 51 44 52 49 48.0Social Science 11 10 9 4 6 8.0Sociology 17 4 1 17 10 9.8Subtotal 182 196 172 182 152 176.8
INTERDISCIPLINARYEnvironmental Studies 16 6 9 7 13 10.2European Studies2 1 0 0 0 0 0.2Latin Amer. Studies 2 1 4 2 5 2.8Native American & Indigenous St.6 6 6 2 2 8 4.8Area of Concentration 8 11 7 11 8 9.0Subtotal 33 24 22 22 34 27.0
TOTAL GRADUATES 372 375 351 368 338 360.8
TOTAL MAJORS OF GRADS 473 479 435 458 423 453.6
Note: Graduates with multiple majors counted more than once.1Licensure program--secondary education is not a major.2This major discontinued; last term to be admitted was Spring 2011; last term to graduate is approximately Spring 2018.3New major; first term admitting students was Fall 2011.4New major; first term admitting students was Fall 2015.5Discontinued major; last term to be admitted is Spring 2015; last term to graduate is approximately Spring 2022.6Title of major changed from American Indian Studies as of 2017-18.
49
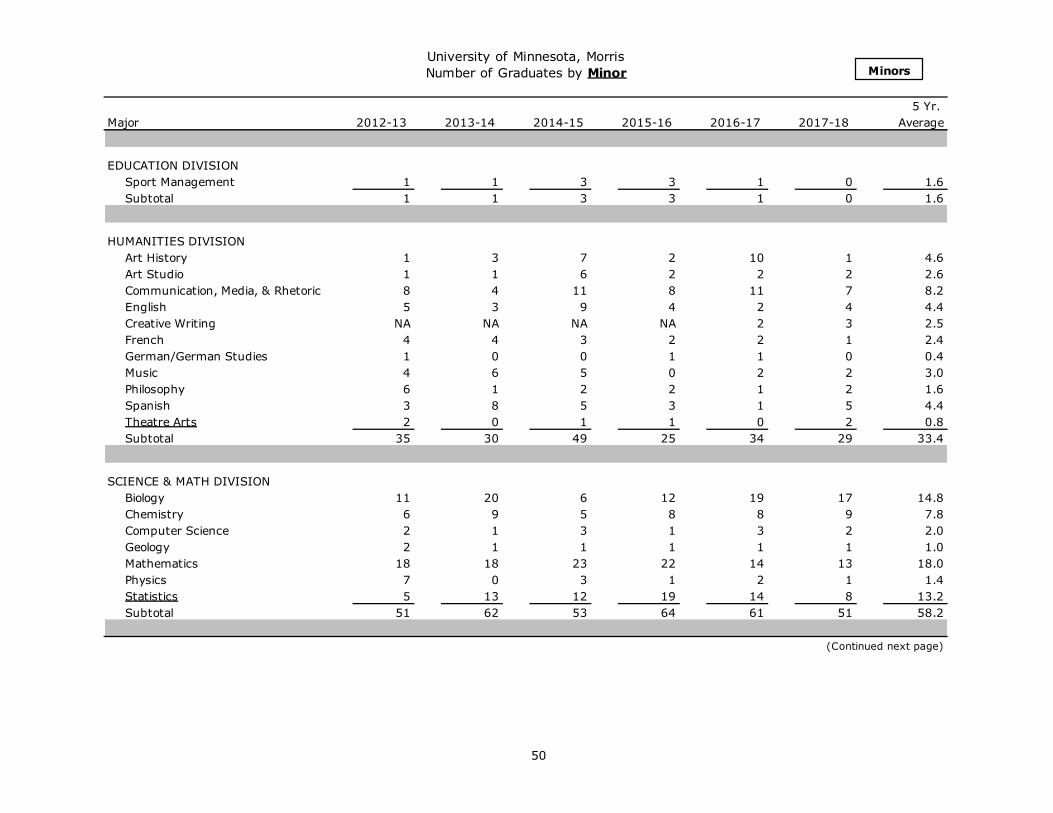
University of Minnesota, MorrisNumber of Graduates by Minor
5 Yr. Major 2012-13 2013-14 2014-15 2015-16 2016-17 2017-18 Average
EDUCATION DIVISIONSport Management 1 1 3 3 1 0 1.6Subtotal 1 1 3 3 1 0 1.6
HUMANITIES DIVISIONArt History 1 3 7 2 10 1 4.6Art Studio 1 1 6 2 2 2 2.6Communication, Media, & Rhetoric 8 4 11 8 11 7 8.2English 5 3 9 4 2 4 4.4Creative Writing NA NA NA NA 2 3 2.5French 4 4 3 2 2 1 2.4German/German Studies 1 0 0 1 1 0 0.4Music 4 6 5 0 2 2 3.0Philosophy 6 1 2 2 1 2 1.6Spanish 3 8 5 3 1 5 4.4Theatre Arts 2 0 1 1 0 2 0.8Subtotal 35 30 49 25 34 29 33.4
SCIENCE & MATH DIVISIONBiology 11 20 6 12 19 17 14.8Chemistry 6 9 5 8 8 9 7.8Computer Science 2 1 3 1 3 2 2.0Geology 2 1 1 1 1 1 1.0Mathematics 18 18 23 22 14 13 18.0Physics 7 0 3 1 2 1 1.4Statistics 5 13 12 19 14 8 13.2Subtotal 51 62 53 64 61 51 58.2
(Continued next page)
Minors
50

University of Minnesota, MorrisNumber of Graduates by Minor
5 Yr. Major 2012-13 2013-14 2014-15 2015-16 2016-17 2017-18 Average
SOCIAL SCIENCE DIVISIONAnthropology 4 0 4 0 2 2 1.6Economics 4 11 6 3 6 3 5.8Gender,Women,Sexuality 1 1 2 3 5 0 2.2History 8 11 9 10 6 6 8.4Management 9 11 10 3 7 9 8.0Political Science 4 7 6 9 5 5 6.4Psychology 5 8 8 8 7 5 7.2Sociology 2 6 1 1 4 4 3.2Subtotal 37 55 46 37 42 34 42.8
INTERDISCIPLINARYAfrican American and Black Studies 0 2 0 0 0 1 0.6Latin American Area Studies* -- -- 1 1 0 0 0.5Native American & Indigenous St. 2 1 3 4 3 4 3.0Area of Emphasis 5 4 6 1 9 12 6.4Subtotal 7 7 10 6 12 17 10.4
TOTAL GRADUATES 344 372 375 351 368 338 360.8
TOTAL MINORS OF GRADS 131 155 161 135 150 131 146.4
PERCENTAGE OF GRADS WITH MINORS 33% 37% 39% 33% 35% 34% 36%
Note: Graduates with multiple minors counted more than once.
51
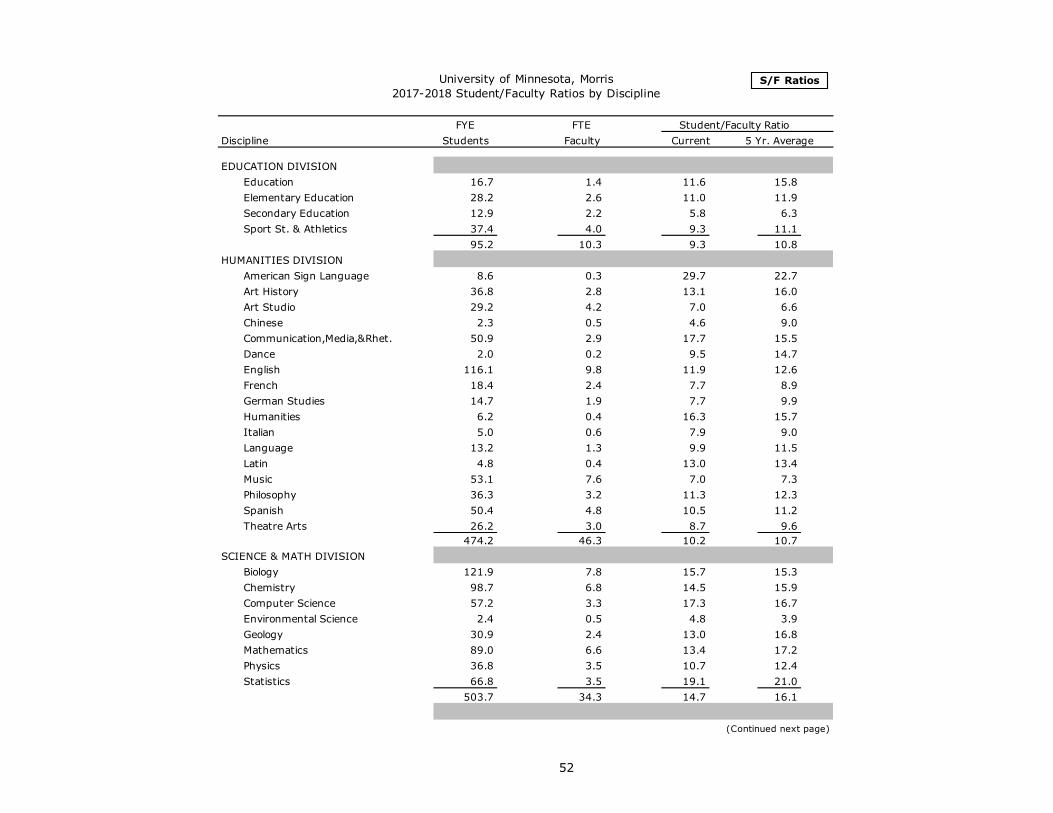
University of Minnesota, Morris2017-2018 Student/Faculty Ratios by Discipline
FYE FTE Student/Faculty RatioDiscipline Students Faculty Current 5 Yr. Average
EDUCATION DIVISIONEducation 16.7 1.4 11.6 15.8Elementary Education 28.2 2.6 11.0 11.9Secondary Education 12.9 2.2 5.8 6.3Sport St. & Athletics 37.4 4.0 9.3 11.1
95.2 10.3 9.3 10.8HUMANITIES DIVISION
American Sign Language 8.6 0.3 29.7 22.7Art History 36.8 2.8 13.1 16.0Art Studio 29.2 4.2 7.0 6.6Chinese 2.3 0.5 4.6 9.0Communication,Media,&Rhet. 50.9 2.9 17.7 15.5Dance 2.0 0.2 9.5 14.7English 116.1 9.8 11.9 12.6French 18.4 2.4 7.7 8.9German Studies 14.7 1.9 7.7 9.9Humanities 6.2 0.4 16.3 15.7Italian 5.0 0.6 7.9 9.0Language 13.2 1.3 9.9 11.5Latin 4.8 0.4 13.0 13.4Music 53.1 7.6 7.0 7.3Philosophy 36.3 3.2 11.3 12.3Spanish 50.4 4.8 10.5 11.2Theatre Arts 26.2 3.0 8.7 9.6
474.2 46.3 10.2 10.7SCIENCE & MATH DIVISION
Biology 121.9 7.8 15.7 15.3Chemistry 98.7 6.8 14.5 15.9Computer Science 57.2 3.3 17.3 16.7Environmental Science 2.4 0.5 4.8 3.9Geology 30.9 2.4 13.0 16.8Mathematics 89.0 6.6 13.4 17.2Physics 36.8 3.5 10.7 12.4Statistics 66.8 3.5 19.1 21.0
503.7 34.3 14.7 16.1
(Continued next page)
S/F Ratios
52

University of Minnesota, Morris2017-2018 Student/Faculty Ratios by Discipline
FYE FTE Student/Faculty RatioDiscipline Students Faculty Current 5 Yr. Average
S/F Ratios
SOCIAL SCIENCE DIVISIONAnthropology 38.4 2.3 16.9 16.2Economics 56.8 3.6 15.7 17.9Gender,Women,Sexuality 3.9 0.3 13.0 15.9History 78.0 5.1 15.4 16.1Human Services 4.0 0.2 20.0 20.5Management 39.1 2.5 15.9 17.6Political Science 44.4 3.2 13.9 13.4Psychology 106.6 6.6 16.1 16.5Sociology 36.5 2.4 15.3 14.5
407.8 26.1 15.6 16.2INTERDISCIPLINARY STUDIES
Environmental Studies 22.3 1.2 18.1 13.9Interdisciplinary Studies 25.2 1.9 13.2 13.2Latin American Area Studies 1.3 0.4 3.5 3.1Native American & Indigenous St. 13.4 1.3 10.3 11.9
62.2 4.8 12.9 12.4
ACADEMIC DIVISIONS/INTERDISC 1543.1 121.8 12.7 13.5
ONLINE 26.1 1.3 20.4 14.7
GRAND TOTALS 1569.2 123.1 12.8 13.5
FYE Student = SCH/30; FTE Faculty based on actual teaching load of full- and part-time faculty. Note: FYE and FTEdo not include summer counts.
53

0
100
200
300
400
500
600
700
2006-07 2007-08 2008-09 2009-10 2010-11 2011-12 2012-13 2013-14 2014-15 2015-16 2016-17 2017-18
Num
ber
of F
YE S
tude
nts
Year
Full-Year Equivalent (FYE) Student Course Enrollment by Division
SSci Hum S&M Educ
54

FTE is the Full-time-Equivalent faculty count. Note: Beginning 2011-12, Online Learning was counted as a separate catgory; before that time, online courses werecounted with regular classroom courses in the Division.
0
5
10
15
20
25
30
35
40
45
50
55
'02-'03 '03-'04 '04-'05 '05-'06 '06-'07 '07-'08 '08-'09 '09-'10 '10-'11 '11-'12 '12-'13 '13-'14 '14-'15 '15-'16 '16-'17 '17-'18
Num
ber o
f FTE
Fac
ulty
Full-Time Equivalent (FTE) Faculty by Division
Humanities Science & Math Social Sciences Education Interdisciplinary Online Learning
55

Final No. of Classes Aver. Class Size FTEDiscipline SCH Enrollment LD UD LD UD All Faculty ICH/FTEEDUCATION DIVISION
Education 524 235 7 2 19.4 15.0 18.4 1.44 19.4Elementary Education 884 277 0 16 NA 13.3 13.3 2.56 21.1Secondary Education 391 101 0 16 NA 6.3 6.3 2.24 21.0Sport Studies & Athletics 1,170 677 21 7 16.4 9.7 14.8 4.01 19.8
2,969 1,290 28 41 17.2 10.0 12.9 10.25 20.3HUMANITIES DIVISION
American Sign Language 260 65 2 0 32.5 NA 32.5 0.29 27.6Art History 1,169 286 8 7 26.9 9.4 18.7 2.80 19.3Art Studio 873 363 13 11 11.8 11.7 11.8 4.15 16.6Chinese 68 23 2 0 5.5 NA 5.5 0.50 16.0Communication, Media, Rhetoric 1,558 410 10 7 30.4 11.9 22.8 2.87 23.3Dance 62 44 0 1 NA 8.0 8.0 0.21 28.6English 3,600 881 43 11 16.9 13.3 16.2 9.78 21.9French 562 168 8 7 12.8 9.0 11.0 2.40 20.0German Studies 442 117 7 4 13.3 4.8 10.2 1.92 21.9Humanities 189 67 3 0 14.7 NA 14.7 0.38 23.7Italian 154 45 3 0 13.7 NA 13.7 0.63 15.9Language 557 177 9 0 16.7 NA 16.7 1.34 18.7Latin 143 41 2 0 17.0 NA 17.0 0.37 21.6Music 1,762 1,149 13 6 15.0 7.3 12.6 7.63 29.9Philosophy 1,136 272 12 4 19.4 9.8 17.0 3.20 20.0Spanish 1,584 424 15 13 18.4 11.2 15.0 4.80 20.0Theatre Arts 789 240 9 7 15.0 6.7 11.4 3.00 22.0
14,908 4,772 159 78 17.5 10.1 15.1 46.27 22.1SCIENCE & MATH DIVISION
Biology 3,673 1,092 20 28 20.4 16.0 17.8 7.75 19.8Chemistry 3,031 880 22 12 21.6 12.2 18.3 6.81 18.1Computer Science 1,731 446 6 11 34.2 20.5 25.3 3.30 19.2Environmental Science 71 30 1 0 11.0 NA 11.0 0.50 4.0Geology 978 239 10 2 20.4 12.0 19.0 2.37 24.2Mathematics 2,673 673 26 8 20.8 12.8 18.9 6.62 20.1Physics 1,107 237 15 6 13.8 3.7 10.9 3.45 20.8Statistics 2,169 521 13 5 33.9 18.4 29.6 3.50 19.4
15,433 4,118 113 72 22.1 14.7 19.2 34.30 19.6
(Continued next page)
University of Minnesota, Morris2017-2018 Statistics on
Enrollment, Classes, and Faculty
56
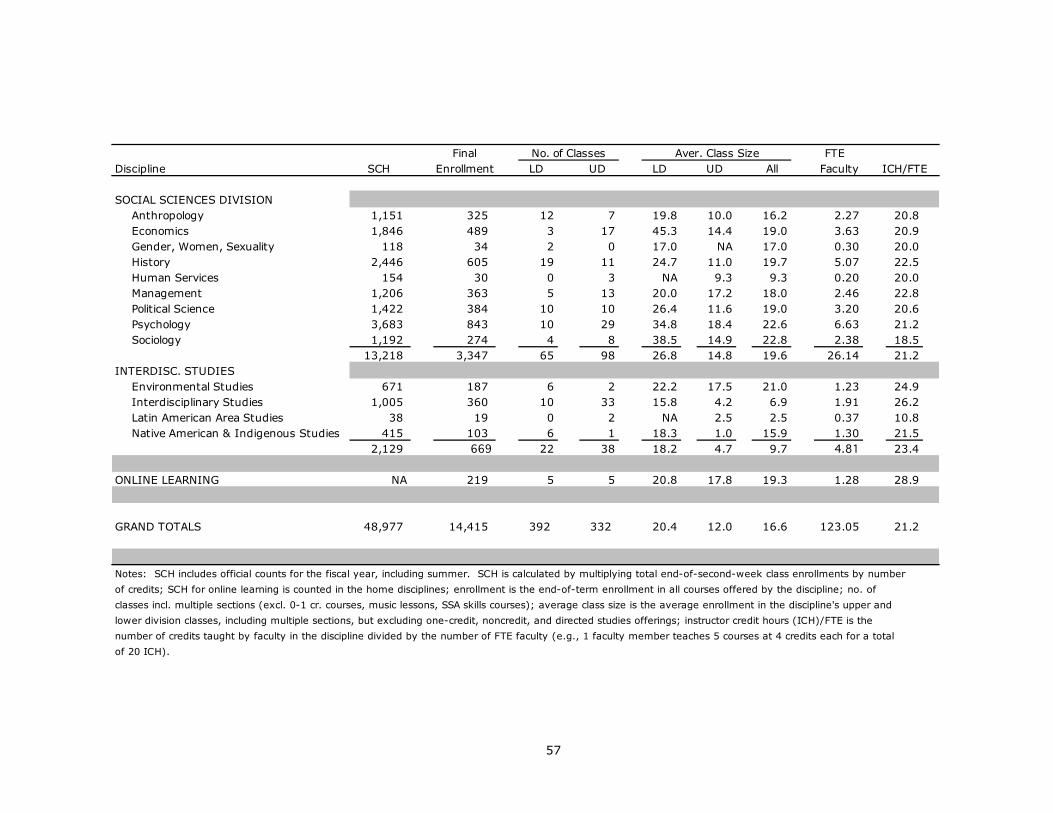
Final No. of Classes Aver. Class Size FTE Discipline SCH Enrollment LD UD LD UD All Faculty ICH/FTE
SOCIAL SCIENCES DIVISIONAnthropology 1,151 325 12 7 19.8 10.0 16.2 2.27 20.8Economics 1,846 489 3 17 45.3 14.4 19.0 3.63 20.9Gender, Women, Sexuality 118 34 2 0 17.0 NA 17.0 0.30 20.0History 2,446 605 19 11 24.7 11.0 19.7 5.07 22.5Human Services 154 30 0 3 NA 9.3 9.3 0.20 20.0Management 1,206 363 5 13 20.0 17.2 18.0 2.46 22.8Political Science 1,422 384 10 10 26.4 11.6 19.0 3.20 20.6Psychology 3,683 843 10 29 34.8 18.4 22.6 6.63 21.2Sociology 1,192 274 4 8 38.5 14.9 22.8 2.38 18.5
13,218 3,347 65 98 26.8 14.8 19.6 26.14 21.2INTERDISC. STUDIES
Environmental Studies 671 187 6 2 22.2 17.5 21.0 1.23 24.9Interdisciplinary Studies 1,005 360 10 33 15.8 4.2 6.9 1.91 26.2Latin American Area Studies 38 19 0 2 NA 2.5 2.5 0.37 10.8Native American & Indigenous Studies 415 103 6 1 18.3 1.0 15.9 1.30 21.5
2,129 669 22 38 18.2 4.7 9.7 4.81 23.4
ONLINE LEARNING NA 219 5 5 20.8 17.8 19.3 1.28 28.9
GRAND TOTALS 48,977 14,415 392 332 20.4 12.0 16.6 123.05 21.2
Notes: SCH includes official counts for the fiscal year, including summer. SCH is calculated by multiplying total end-of-second-week class enrollments by numberof credits; SCH for online learning is counted in the home disciplines; enrollment is the end-of-term enrollment in all courses offered by the discipline; no. ofclasses incl. multiple sections (excl. 0-1 cr. courses, music lessons, SSA skills courses); average class size is the average enrollment in the discipline's upper andlower division classes, including multiple sections, but excluding one-credit, noncredit, and directed studies offerings; instructor credit hours (ICH)/FTE is thenumber of credits taught by faculty in the discipline divided by the number of FTE faculty (e.g., 1 faculty member teaches 5 courses at 4 credits each for a totalof 20 ICH).
57

University of Minnesota, MorrisFull-Time Equivalent (FTE) Faculty Counts
by Discipline and Division
5 Yr. Division/Discipline 2013-14 2014-15 2015-16 2016-17 2017-18 Average
EDUCATION DIVISIONEducation 1.18 1.57 1.87 1.38 1.44 1.49Elementary Education 2.73 2.77 2.88 2.25 2.56 2.64Secondary Education 2.98 2.18 1.90 2.32 2.24 2.32Sport Studies & Athletics 4.42 4.03 3.88 3.94 4.01 4.06Subtotal 11.31 10.55 10.53 9.89 10.25 10.51
HUMANITIES DIVISIONArt History 3.00 3.00 2.30 2.20 2.80 2.66Art, Studio 4.70 5.32 4.93 4.53 4.15 4.73American Sign Language 0.29 0.29 0.29 0.29 0.29 0.29Chinese 0.00 0.29 0.57 0.57 0.50 0.39Comm, Media, Rhetoric 3.00 3.00 3.00 3.17 2.87 3.01Dance 0.18 0.25 0.21 0.21 0.21 0.21English 11.85 11.27 10.59 11.23 9.78 10.94French 2.44 1.87 2.50 2.40 2.40 2.32German Studies 1.81 2.00 1.83 2.00 1.92 1.91Humanities 0.14 0.30 0.61 0.27 0.38 0.34Italian 0.55 0.63 0.50 0.63 0.63 0.59Language 0.75 0.70 0.94 0.97 1.34 0.94Latin 0.33 0.40 0.40 0.00 0.37 0.30Music 8.60 8.69 7.54 8.22 7.63 8.14Philosophy 3.16 2.66 3.63 2.80 3.20 3.09Spanish 4.33 4.62 5.00 4.80 4.80 4.71Theatre Arts 3.00 2.29 2.90 2.81 3.00 2.80Subtotal 48.13 47.58 47.74 47.10 46.27 47.36
SCIENCE & MATH DIVISIONBiology 8.05 8.03 7.41 8.25 7.75 7.90Chemistry 5.68 6.66 6.71 6.72 6.81 6.52Computer Science 2.61 3.06 3.54 3.54 3.30 3.21Environmental Science 0.40 0.35 0.36 0.31 0.50 0.38Geology 2.80 3.33 2.67 2.88 2.37 2.81Mathematics 6.04 6.12 6.42 6.62 6.62 6.36Natural Science 0.00 0.00 0.00 0.00 0.00 0.00Physics 3.90 3.90 3.87 3.62 3.45 3.75Statistics 3.17 3.40 3.50 3.20 3.50 3.35Subtotal 32.65 34.85 34.48 35.14 34.30 34.28
(Continued next page)
FTE Faculty
58

University of Minnesota, MorrisFull-Time Equivalent (FTE) Faculty Counts
by Discipline and Division
5 Yr. Division/Discipline 2013-14 2014-15 2015-16 2016-17 2017-18 Average
SOCIAL SCIENCE DIVISIONAnthropology 2.44 2.58 1.80 2.60 2.27 2.34Economics 4.28 4.36 4.03 4.43 3.63 4.15Gender, Women, Sexuality Studies 0.27 0.22 0.20 0.20 0.30 0.24Geography* [.20] [.20] [.20] [.20] [.20] [.20]History 6.05 5.60 6.18 6.09 5.07 5.80Human Services NA NA 0.17 0.20 0.20 0.19Management 2.41 2.61 2.66 2.76 2.46 2.58Political Science 3.73 3.70 2.60 3.06 3.20 3.26Psychology 8.33 6.83 7.16 6.80 6.63 7.15Sociology 2.25 3.40 3.38 2.80 2.38 2.84Subtotal 29.76 29.30 28.18 28.94 26.14 28.46
INTERDISCIPLINARY STUDIES1.83 1.50 1.86 1.78 1.23 1.640.45 0.30 0.38 0.40 0.37 0.380.76 1.34 1.07 1.04 1.30 1.100.76 0.70 0.99 0.96 0.61 0.801.74 1.48 1.42 1.25 1.30 1.44
Environmental StudiesLatin American Area StudiesNative American & Indigenous Studies Interdisc. (IS) HonorsMisc. IS CoursesSubtotal 5.54 5.32 5.72 5.43 4.81 5.36
ONLINE LEARNING 0.85 0.85 1.26 1.28 1.28 1.10
CAMPUS FTE FACULTY 128.24 128.45 127.91 127.78 123.05 127.09
FULL-YEAR EQUIVALENT (FYE) STUDENTS 1859 1807 1755 1688 1777
FYE STUDENTS/FTE FACULTY RATIO 14.49 14.07 13.72 13.21 13.87
*Beginning 2011-12, Geography courses were taught through Online Learning; the FTE attributed to the online Geography courses is listed inbrackets. The FTE faculty count includes all instructional staff--ranked faculty along with P&A lecturers and teaching specialists. For this table, FYEstudents are calculated by adding full-time student headcount to 1/3 of part-time student headcount.
59

2012-13 2013-14 2014-15 2015-16 2016-17 2017-18Temporary/P&A 47.04 52.16 44.73 46.22 47.29 43.19Tenured/Ten-Track 78.22 76.08 83.72 81.69 80.49 79.86
0
10
20
30
40
50
60
70
80
90
100
110
120
130
140
Num
ber o
f FTE
Fac
ulty
and
In
stru
ctio
nal S
taff
FTE Faculty and Instructional Staff by Appointment TypeUniversity of Minnesota, Morris
60

FTE Faculty and Instructional Staff by Appointment Type and Division
'12-13 '13-14 '14-15 '15-16 '16-17 '17-18Temporary/P&A 5.69 6.38 6.12 6.40 7.56 7.45Tenured/Ten-Track 3.93 4.93 4.43 4.13 2.33 2.80
0
5
10
15
20
25
30
35
40
45
50
Num
ber o
f FTE
Fac
ulty
and
In
stru
ctio
nal S
taff
EDUCATION DIVISION
'12-13 '13-14 '14-15 '15-16 '16-17 '17-18Temporary/P&A 22.10 23.80 19.27 18.61 22.07 20.44Tenured/Ten-Track 24.13 24.33 28.31 29.13 25.03 25.83
0
5
10
15
20
25
30
35
40
45
50
Num
ber o
f FTE
Fac
ulty
and
In
stru
ctio
nal S
taff
HUMANITIES DIVISION
'12-13
'13-14
'14-15
'15-16
'16-17
'17-18
Temporary/P&A 5.40 5.50 4.42 5.05 6.51 6.20Tenured/Ten-Track 27.60 27.15 30.43 29.43 28.63 28.10
0
5
10
15
20
25
30
35
40
45
50
Num
ber o
f FTE
Fac
ulty
and
In
stru
ctio
nal S
taff
SCIENCE & MATH DIVISION
'12-13 '13-14 '14-15 '15-16 '16-17 '17-18Temporary/P&A 11.40 12.48 11.30 12.18 7.44 6.14Tenured/Ten-Track 19.93 17.28 18.00 16.00 21.50 20.00
0
5
10
15
20
25
30
35
40
45
50
Num
ber o
f FTE
Fac
ulty
and
Inst
ruct
iona
l Sta
ff
SOCIAL SCIENCES DIVISION
61

University of Minnesota, MorrisAverage Salary for Full-time Teaching Faculty
by Rank & Gender
2013-14 2014-15 2015-16 2016-17 2017-18
MEN:
Professors $79,212 (15) $79,254 (18) $80,823 (20) $84,351 (20) $86,448 (21)
Associates $63,215 (22) $65,168 (18) $66,373 (19) $66,921 (16) $67,997 (16)
Assistants $52,988 (17) $54,121 (17) $54,976 (17) $56,543 (17) $57,154 (19)
Instructors $48,000 (1) $49,572 (3) $52,020 (2) $56,000 (1) $56,784 (1)
All Ranks $64,140 (55) $65,506 (56) $67,520 (58) $69,907 (54) $70,983 (57)
WOMEN:
Professors $75,800 (9) $77,906 (10) $80,229 (9) $80,360 (11) $82,080 (11)
Associates $63,384 (26) $64,978 (26) $67,383 (26) $69,936 (23) $70,822 (23)
Assistants $54,033 (8) $53,783 (8) $53,216 (10) $54,539 (9) $54,035 (12)
Instructors (0) (0) (0) (0) (0)
All Ranks $64,243 (43) $65,881 (44) $66,804 (45) $69,380 (43) $69,135 (46)
TOTAL:
Professors $77,933 (24) $78,772 (28) $80,639 (29) $82,935 (31) $84,946 (32)
Associates $63,307 (48) $65,056 (44) $66,957 (45) $68,699 (39) $69,663 (39)
Assistants $53,322 (25) $54,013 (25) $54,324 (27) $55,849 (26) $55,946 (31)
Instructors $48,000 (1) $49,572 (3) $52,020 (2) $56,000 (1) $56,784 (1)
All Ranks $64,185 (98) $65,671 (100) $67,207 (103) $69,673 (97) $70,158 (103)
Figure in parentheses indicates the number of individuals in each category. 9-month and "10-month converted to 9-month" salaries only. Chancellor/vice chancellor salaries are excluded.
FacultySalaries
62

AllProf Assoc Asst Instr Ranks
Men $86,448 $67,997 $57,154 $56,784 $70,983Years at UMM 21.9 16.9 4.3 2.0 14.3No. 21 16 19 1 57
Women $82,080 $70,822 $54,035 NA $69,135Years at UMM 23.6 15.9 3.7 NA 14.5No. 11 23 12 0 46
Faculty of Color* $84,336 $67,695 $57,426 $56,784 $65,811Years at UMM 20.7 24.0 2.7 2.0 10.7No. 3 2 6 1 12
Total $84,946 $69,663 $55,946 $56,784 $70,158Years at UMM 22.4 16.3 4.1 2.0 14.4No. 32 39 31 1 103
9-month salaries (10-mo converted to 9-mo); Chancellor and Vice Chancellor salaries are excluded;Sabbatical/LOA included plus replacements.*International faculty are not included in faculty of color counts.
University of Minnesota, MorrisAverage Faculty Salaries by Rank & Gender
2017-2018
63

University of Minnesota, MorrisThe Percent of Full-time Ranked Faculty Who AreFemale, Tenured, Temporary, or Faculty of Color
Academic Faculty Percent of FacultyYear Count Female Faculty of Color Tenured Temporary
1971-72 85 NA 9.4% 48.2% 9.4%
1975-76 93 17.2% 12.9% 62.4% 14.0%
1980-81 96 19.8% 10.4% 60.9% 16.7%
1985-86 106 27.5% 13.3% 55.5% 21.8%
1990-91 118 25.4% 16.1% 55.1% 26.3%
1995-96 123 36.6% 20.3% 49.6% 31.7%
2000-01 126 41.3% 15.1% 48.4% 18.3%
2005-06 126 42.1% 17.5% 52.4% 11.1%
2010-11 102 45.1% 7.8% 79.4% 3.9%
2013-14 98 43.9% 8.2% 71.4% 4.1%
2014-15 100 44.0% 11.0% 70.3% 4.0%
2015-16 103 43.7% 8.7% 70.9% 2.9%
2016-17 97 44.3% 10.3% 71.1% 3.1%
2017-18 103 44.7% 11.7% 68.0% 2.9%
Faculty count includes full-time faculty only at the ranks of professor, associate professor, assistant professor,and instructor; does not include administrative faculty. It does include faculty on leave or sabbatical and theirreplacements. Temporary refers to appointments which are full-time and non-tenure-track.
Female andFacultyof Color
64

DONE
UMM Full-time Ranked Faculty Characteristics
0%
10%
20%
30%
40%
50%
60%
70%
80%
90%
100%
2003 2004 2005 2006 2007 2008 2009 2010 2011 2012 2013 2014 2015 2016 2017
Fall Term
Percentage of Faculty Who are Tenured
0%
10%
20%
30%
40%
50%
60%
70%
80%
90%
100%
2003 2004 2005 2006 2007 2008 2009 2010 2011 2012 2013 2014 2015 2016 2017
Fall Term
Percentage of Faculty Who are Female
0%
10%
20%
30%
40%
50%
60%
70%
80%
90%
100%
2003 2004 2005 2006 2007 2008 2009 2010 2011 2012 2013 2014 2015 2016 2017
Fall Term
Percentage of Faculty Who are Faculty of Color
65

Nancy Helsper, Director of Institutional Research309c Behmler HallUniversity of Minnesota, Morris600 East Fourth StreetMorris, Minnesota 56267320-589-6012 • [email protected]
The University of Minnesota is committed to the policy that all persons shall haveaccess to its programs, facilities, and employment without regard to race,color, creed, religion, national origin, sex, age, marital status, disability,
public assistance status, veteran status, or sexual orientation.


