CIBC World Markets does and seeks to do business with companies covered in its research reports. As a result, investors should be aware that the firm may have a conflict of interest that could affect the objectivity of this report. Investors should consider this report as only a single factor in making their investment decision.
See "Important Disclosures" section at the end of this report for important required disclosures, including potential conflicts of interest. See "Price Target Calculation" and "Key Risks to Price Target" sections at the end of this report, or at the end of each section hereof, where applicable.
CIBC World Markets Inc.
Canadian Research Review - March 08, 2010
2
Canadian Research Review - March 08, 2010
3
Table Of Contents In This Issue Institutional Conferences............................................................................ 3 Index Of Companies .................................................................................. 4 Economics ................................................................................................ 6 New Issue Update.................................................................................... 13
Stats & Estimates By Sector Business & Professional Services ............................................................... 16 Business Trusts ....................................................................................... 19 Chemicals & Fertilizers ............................................................................. 20 Communications & Media.......................................................................... 22 Financial Institutions –
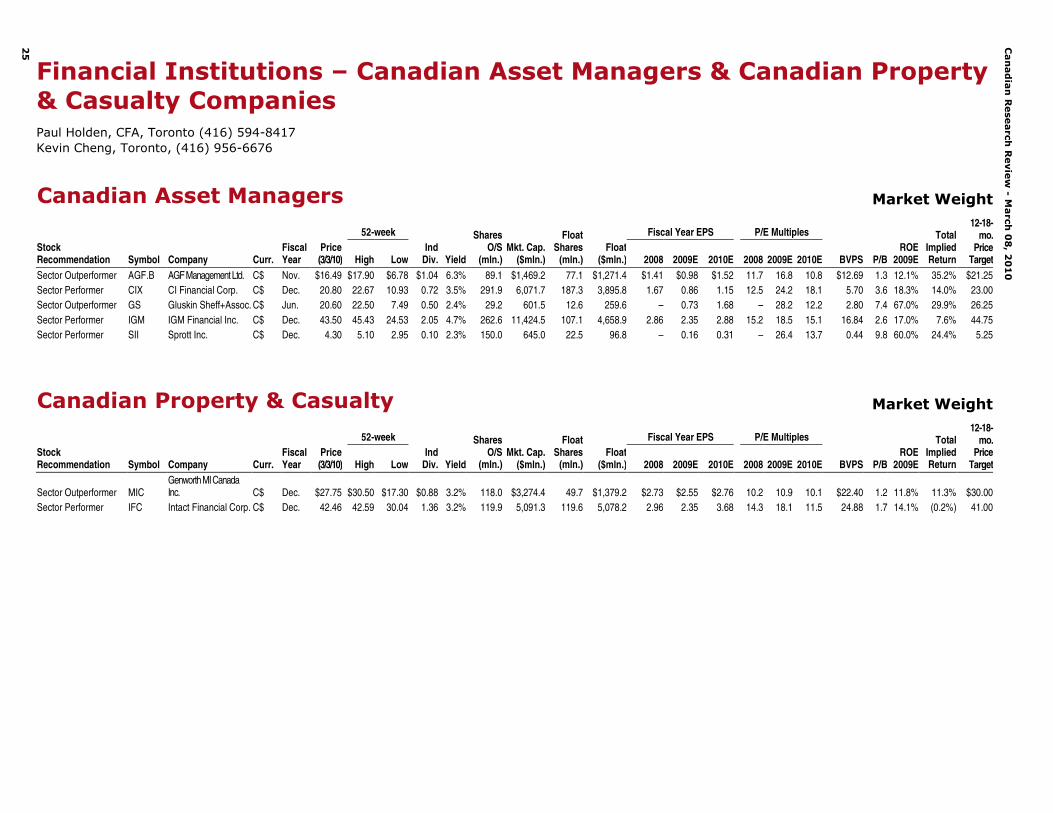
Canadian Asset Managers & Canadian Property & Casualty Companies ........ 25 Industrial Products
Alternative Energy ................................................................................ 26 Auto Parts Suppliers.............................................................................. 27 Capital Equipment................................................................................. 28 Steel ................................................................................................... 29
Institutional Conferences Date Conference Conference LocationApril 8 15th Annual North American Real Estate Equities Conference Toronto, ONApril 20–21 Energy Conference Toronto, ON
For further information on these upcoming conferences, please contact your CIBC World Markets Inc. institutional sales representative.
This schedule is subject to change.
Canadian Research Review - March 08, 2010
4
Index Of Companies Symbol Company Rating Pag
eVNP 5N Plus, Incorporated SO 30ABWTQ AbitibiBowater Inc. R 45ARE Aecon Group Inc. SO 17AFN Ag Growth International Inc. SO 21AGF.B AGF Management Limited SO 25AEM Agnico-Eagle Mines Limited SP 39AGU Agrium Inc. SP 21AGI Alamos Gold Inc. SO 39AMC Alexis Minerals Corporation SO* 39ATD.B Alimentation Couche-Tard Inc. SP 33AP.UN Allied Properties REIT SO 51ALA.UN AltaGas Income Trust SP 47AIF.UN Altus Group Income Fund SO 51AND Andean Resources Ltd. SO 39AXL Anderson Energy Ltd. SO 42NGL Angle Energy Inc. SO 42ARF.UN Armtec Infrastructure Income Fund SO 19AX.UN Artis Real Estate Investment Trust R 51ACM.A Astral Media Inc. SO 23ACO.X Atco Ltd. SP 47ATA ATS Automation Tooling Systems Inc. SP 30ARZ Aurizon Mines Ltd. SO 39BIM Baffinland Iron Mines Corporation SO* 35BAN Bannerman Resources Ltd. SO 35ABX Barrick Gold Corporation SP 39BCE BCE Inc. SP 57BA.UN Bell Aliant Regional Comm. IF SP 57BDT.UN Bird Construction Income Fund SP 17BEI.UN Boardwalk REIT SP 51BPP BPO Properties Ltd. SO 51BWC Bridgewater Systems Corp. SP 55BAM Brookfield Asset Management SO 51BPO Brookfield Properties Corporation SP 51BRE.UN Brookfield Real Estate Services Fund SO 19BRC.UN Brookfield Renewable Power Fund SP 30CFW Calfrac Well Services Ltd. SP 41CWT.UN Calloway REIT SO 51CCO Cameco Corporation SP 35CAR.UN Canadian Apartment Properties REIT SU 51CNR Canadian National Railway Co. SO 49CP Canadian Pacific Railway Ltd. SP 49REF.UN Canadian REIT SP 51CTC.A Canadian Tire Corporation, Ltd. SP 33CU Canadian Utilities Ltd. SP 47CUS.UN Canexus Income Fund SP 21CFP Canfor Corporation SP 45CFX.UN Canfor Pulp Income Fund SP 45CS Capstone Mining Corporation SO 35CAS Cascades Inc. SP 45CTL Catalyst Paper Corporation SP 45CET Cathedral Energy Services SP 41CLS Celestica Inc. SO 53CG Centerra Gold Inc. SP 39GIB.A CGI Group Inc. SO 17CRH.UN Charter Real Estate Investment Trust SP 51CSH.UN Chartwell Seniors Housing REIT SP 51CHE.UN Chemtrade Logistics Income Fund SO 21
Symbol Company Rating Page
CUQ Churchill Corporation SO 17CIX CI Financial Corp. SP 25CGX.UN Cineplex Galaxy Income Fund SO 23CRJ Claude Resources Inc. SU 39CDE Coeur d'Alene Mines Corp. SO 39CCA Cogeco Cable Inc. SO 57CGO Cogeco Inc. SP 23CDV COM DEV International Ltd. SO 55CUF.UN Cominar Real Estate Investment Trust SP 51CLM Consolidated Thompson Iron Mines Ltd.SP 35CSU Constellation Software Inc. SO 55CJR.B Corus Entertainment Inc. SP 23COT Cott Corporation SO 33CRR.UN Crombie REIT SO 51DSA DALSA Corporation SP 53DHF.UN Davis + Henderson Income Fund R 19DML Denison Mines Corp. SP 35DSGX Descartes Systems Group Inc. SP 55DOL Dollarama Inc. SO 33UFS Domtar Corp. SP 45DWI DragonWave Incorporated SO 53D.UN Dundee REIT R 51EGO Eldorado Gold Corporation SO 39EMA Emera Inc. SP 47EMP.A Empire Company Limited SO 33ENB Enbridge Inc. SO 47EDR Endeavour Silver Corp. SP 39ESI Ensign Energy Services Inc. SP 41EQN Equinox Minerals Limited SO 35EET Etruscan Resources Inc. SP 39EXE.UN Extendicare REIT SP 51FTT Finning International Inc. SP 30FCR First Capital Realty Inc. SO 51FR First Majestic Silver Corp. SP 39FM First Quantum Minerals Ltd. SO 35FSV FirstService Corporation SP 17FLEX Flextronics International Ltd. SP 53FES Flint Energy Services Ltd. SO 41FNX FNX Mining Company Inc. SO 35FAR Foraco International SA SP 35FCE.UN Fort Chicago Energy Partners, L.P. SP 47FTS Fortis Inc. SO 47FVI Fortuna Silver Mines Inc. SO 39FNV Franco-Nevada Corporation SO 39GAM Gammon Gold Inc. SP 39GMO General Moly, Inc. SO 35GWI Genesis Worldwide Inc. SU 17GNV.UN GENIVAR Income Fund SO 17GND Gennum Corporation SU 53MIC Genworth MI Canada Inc. SO 25WN George Weston Limited SO 33GNA Gerdau Ameristeel Corp. SO 31GIL Gildan Activewear Inc. SP 33GS Gluskin Sheff + Associates Inc. SO 25GLW Gold Wheaton Gold Corp. SP 39GG Goldcorp Inc. SO 39AER Groupe Aeroplan Inc. SO 33
Symbol Company Rating Page
HR.UN H&R REIT SO 51HF Hanfeng Evergreen Inc. SP 21HL Hecla Mining Company SU 39HBM HudBay Minerals Inc. SO 35IAG IAMGOLD Corporation SO 39IBG.UN IBI Income Fund SO 17IGM IGM Financial Inc. SP 25IMN Inmet Mining Corporation SP 35IEF.UN Innergex Power Income Fund SO 30INE Innergex Renewable Energy Inc. R 30INN.UN InnVest REIT SP 51IFC Intact Financial Corp. SP 25IPL.UN Inter Pipeline Fund, L.P. SO 47IFP.A International Forest Products Limited SO 45IVN Ivanhoe Mines Ltd. SP 35JBL Jabil Circuit, Inc. SP 53PJC.A Jean Coutu Group (PJC) Inc. SO 33JE.UN Just Energy Income Fund SO 19KMP Killam Properties Inc. R 51KGC Kinross Gold Corporation SP 39LIF.UN Labrador Iron Ore Royalty Income Fund SP 35LNR Linamar Corporation SP 30L Loblaw Companies Limited SO 33LPX Louisiana-Pacific Corp. SP 45MDA MacDonald, Dettwiler and Assoc. Ltd. SP 17MGA Magna International Inc. SO 30MDI Major Drilling Group International Inc. SP 35MBT Manitoba Telecom Services Inc. SP 57MN March Networks Corp. SO 53MRE Martinrea International Inc. SO 30MCG Melco China Resorts SP* 51ML Mercator Minerals Ltd. SO 35MERC Mercer International Inc. SP 45MEOH Methanex Corporation SO 21MRU.A Metro Inc. SO 33MGO Migao Corporation SO 21MFL Minefinders Corporation Ltd. SO 39MDM Mineral Deposits Limited SO 39MT Miranda Technologies Inc. SP 53MRT.UN Morguard REIT SU 51MSD MOSAID Technologies Incorporated SO* 53MTL Mullen Group SO 41NGD New Gold Inc. SP 39NML New Millennium Capital Corp. SO* 35NAL Newalta Inc. SP 41NEM Newmont Mining Corporation SP 39NBD Norbord Inc. SO 45NRTLQ Nortel Networks Corporation SU 53NOA North American Energy Partners SP 30NWF.UN North West Company Fund SO 33NPR.UN Northern Property REIT SP 51NXG Northgate Minerals Corporation SO 39NUE Nucor Corporation SU 31OCX Onex Corporation SO 51OTEX Open Text Corporation SO 55OGD Orbit Garant Drilling Inc. SO 35ORE Orezone Gold Corporation SP 39
Canadian Research Review - March 08, 2010
5
Symbol Company Rating Page
PDN Paladin Energy Ltd. SO 35PAAS Pan American Silver Corp. SO 39PSI Pason Systems Inc. SP 41PIF.UN Pembina Pipeline Income Fund SP 47 PHX.UN Phoenix Technology Income Fund SP 41POT Potash Corporation SP 21PD.UN Precision Drilling Trust SO 41PMZ.UN Primaris Retail REIT SO 51PVE.UN Provident Energy Trust SP 42QUA Quadra Mining Ltd. R 35QBR.B Quebecor Inc. SP 23RBI Red Back Mining Inc. SO 39RDL Redline Communications Inc. SP 53RIMM Research In Motion Limited SO 53RMM.UN Retrocom Mid-Market REIT SP 51REI.UN RioCan REIT SO 51RBA Ritchie Bros Auctioneers SU 30RCI.B Rogers Communications Inc. SO 57RON RONA Inc. SP 33RGLD Royal Gold, Inc. SP 39RYL.UN Royal Host REIT SU 51RCM RuggedCom Inc. SO 53RUS Russel Metals Inc. SU 31SVC Sandvine Corporation SO 53SANM Sanmina-SCI Corporation SP 53SAP Saputo Inc. SP 33SVY Savanna Energy Services Corp. SP 41SRQ.UN Scott's Real Estate Investment Trust SP 51SDC Seacliff Construction Corporation SO 17SMF Semafo Inc. SO 39SFK.UN SFK Pulp Fund SP 45SJR.B Shaw Communications Inc. SO 57SC Shoppers Drug Mart Corporation SP 33SWIR Sierra Wireless Inc. SO 53SSRI Silver Standard Resources Inc. SU 39SLW Silver Wheaton Corp. SO 39SVM Silvercorp Metals Inc. SP 39TRE Sino-Forest Corporation SP 45SNC SNC-Lavalin Group Inc. SO 17SE Spectra Energy Corp SP 47SII Sprott Inc. SP 25STN Stantec Inc. SP 17SPB Superior Plus Corp. R 19SXP.UN Supremex Income Fund SP 45TKO Taseko Mines Limited SO 35TCK.B Teck Resources Limited SO 35T TELUS Corporation SO 57TMB Tembec Inc. SU 45TGO TeraGo Inc. SP 57FGL The Forzani Group Ltd. SO 33MOS The Mosaic Company SP 21TCM Thompson Creek Metals Company, Inc. SP 35THI Tim Hortons, Inc. SP 33TWF.UN TimberWest Forest Corp. SP 45
Symbol Company Rating Page
TIH Toromont Industries SP 41TS.B Torstar Corporation SP 23TOT Total Energy Services SO 41TA TransAlta Corporation SP 47TRP TransCanada Corp. SO 47TCL.A Transcontinental Inc. R 23TCW Trican Well Service Ltd. SP 41TDG Trinidad Drilling Ltd. SO 41TVA.B TVA Group Inc. SP 23UEC Uranium Energy Corp. SO 35UUU Uranium One Inc. R 35VCM Vecima Networks SO 53VIC.UN Vicwest Income Fund SP 19VT Viterra Inc. SP 21WFT West Fraser Timber Co. Ltd. SO 45WPT Westport Innovations Inc. SP 30WTE.UN Westshore Terminals Income Fund SP 19WRK.UN Whiterock Real Estate Investment Trust SO* 51WIN Wi-LAN Inc. SO* 53AUY Yamana Gold Inc. SU 39YLO.UN Yellow Pages Income Fund SO 23
Symbol Company Rating Page
Share prices, estimates, price targets and ratings in this report are as of March 3. Our latest research, published since this report was priced, is available on the CIBC World Markets Inc. Equity Research web site, http://researchcentral.cibcwm.com/.SO – Sector Outperformer: Stock is expected to outperform the sector during the next 12–18 months; SP – Sector Performer: Stock is expected to perform in line with the sector during the next 12–18 months; SU –Sector Underperformer: Stock is expected to underperform the sector during the next 12–18 months; NR — Not Rated; R – Restricted; * – Speculative
Economics Avery Shenfeld, Toronto (416) 594-7356 Meny Grauman, Toronto (416) 956-6527
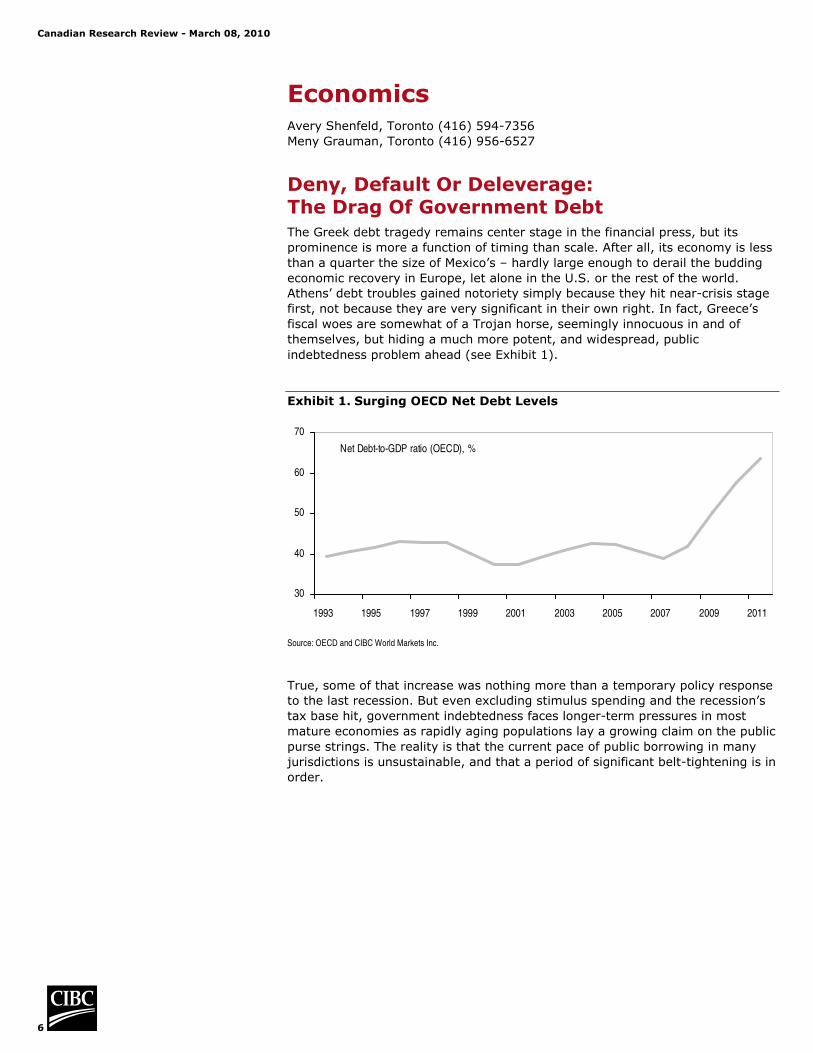
Deny, Default Or Deleverage: The Drag Of Government Debt The Greek debt tragedy remains center stage in the financial press, but its prominence is more a function of timing than scale. After all, its economy is less than a quarter the size of Mexico’s – hardly large enough to derail the budding economic recovery in Europe, let alone in the U.S. or the rest of the world. Athens’ debt troubles gained notoriety simply because they hit near-crisis stage first, not because they are very significant in their own right. In fact, Greece’s fiscal woes are somewhat of a Trojan horse, seemingly innocuous in and of themselves, but hiding a much more potent, and widespread, public indebtedness problem ahead (see Exhibit 1).
Exhibit 1. Surging OECD Net Debt Levels
30
40
50
60
70
1993 1995 1997 1999 2001 2003 2005 2007 2009 2011
Net Debt-to-GDP ratio (OECD), %
Source: OECD and CIBC World Markets Inc.
True, some of that increase was nothing more than a temporary policy response to the last recession. But even excluding stimulus spending and the recession’s tax base hit, government indebtedness faces longer-term pressures in most mature economies as rapidly aging populations lay a growing claim on the public purse strings. The reality is that the current pace of public borrowing in many jurisdictions is unsustainable, and that a period of significant belt-tightening is in order.
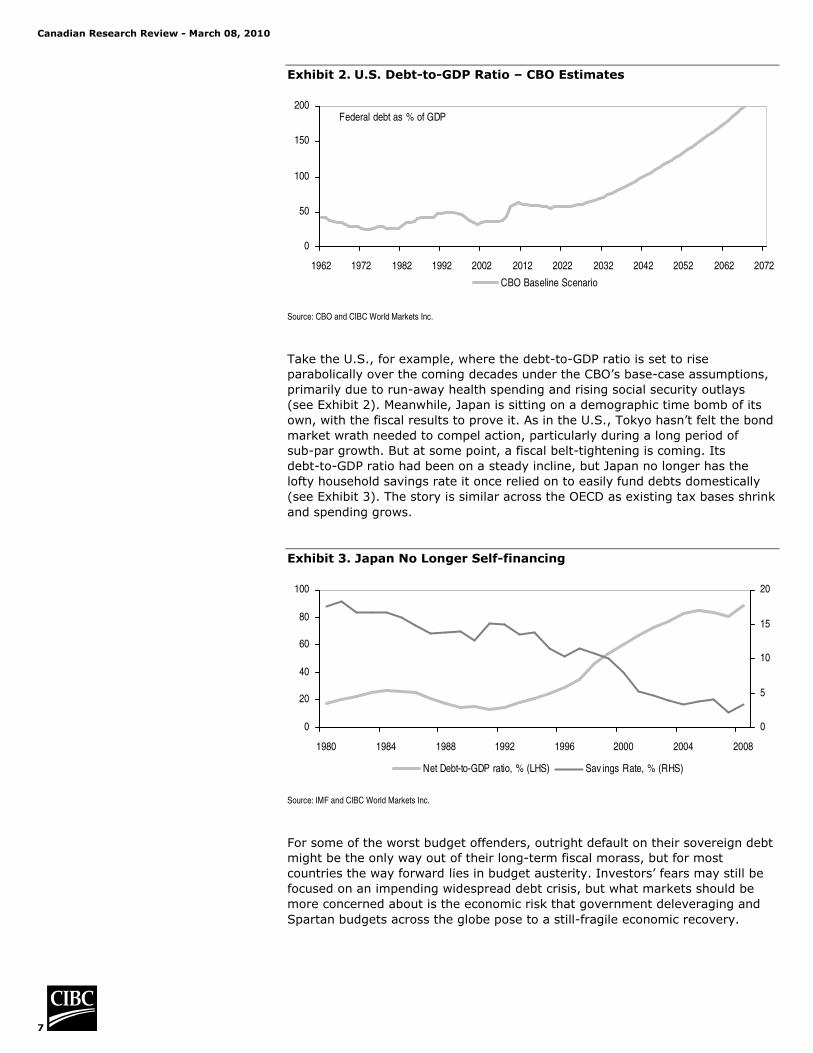
Take the U.S., for example, where the debt-to-GDP ratio is set to rise parabolically over the coming decades under the CBO’s base-case assumptions, primarily due to run-away health spending and rising social security outlays (see Exhibit 2). Meanwhile, Japan is sitting on a demographic time bomb of its own, with the fiscal results to prove it. As in the U.S., Tokyo hasn’t felt the bond market wrath needed to compel action, particularly during a long period of sub-par growth. But at some point, a fiscal belt-tightening is coming. Its debt-to-GDP ratio had been on a steady incline, but Japan no longer has the lofty household savings rate it once relied on to easily fund debts domestically (see Exhibit 3). The story is similar across the OECD as existing tax bases shrink and spending grows.
Exhibit 3. Japan No Longer Self-financing
0
20
40
60
80
100
1980 1984 1988 1992 1996 2000 2004 2008
0
5
10
15
20
Net Debt-to-GDP ratio, % (LHS) Sav ings Rate, % (RHS)
Source: IMF and CIBC World Markets Inc.
For some of the worst budget offenders, outright default on their sovereign debt might be the only way out of their long-term fiscal morass, but for most countries the way forward lies in budget austerity. Investors’ fears may still be focused on an impending widespread debt crisis, but what markets should be more concerned about is the economic risk that government deleveraging and Spartan budgets across the globe pose to a still-fragile economic recovery.
Canadian Research Review - March 08, 2010
8
Dominos And Default A default was the proximate risk for Greece, where politics makes fiscal austerity a challenge (Greece has failed to deliver on EU budget targets for many years), and where technical default through inflationary money printing isn’t an option due to euro membership. In terms of near-term default risks, the domino theory has historical precedent. After all, defaults tend to cluster, as was seen in Latin America in the early 1980s and Eastern Europe in the 1990s. And while Greece is a tiny economy, Thailand isn’t exactly huge, and its baht plunge marked the start of a larger Asian crisis in the late 1990s.
The threat of contagion in Europe though is still low, both due to political considerations on the part of the EU as a whole, and the wide fiscal performance gap between Greece and some of the other so-called “PIIGS” economies (see Exhibit 4). While Greece could plausibly reach for the default parachute if domestic politics prevent the implementation of deep spending cuts or tax hikes (as well as increased enforcement), that isn’t yet a serious risk elsewhere in the eurozone. Across the Channel, or across the Atlantic, deficits aren’t far from Greek levels in both the U.S. and the U.K. But debt-to-GDP levels are still below where Canada’s stood in the 1990s, and the debt is owed in domestic currency. There are cases of domestic currency debt restructurings that amounted to technical defaults, most recently in Jamaica. But that’s not a realistic scenario for major economies over the next few years.
Exhibit 4. How The PIIGS Stack Up
-15 -10 -5 0
Italy
Eurozone
Portugal
Spain
Greece
Ireland
Budget balance % of GDP (2010F)Gross
Debt/GDP
75
122
61
80
83
117
Source: European Commission and CIBC World Markets Inc.
The Hard Way Out
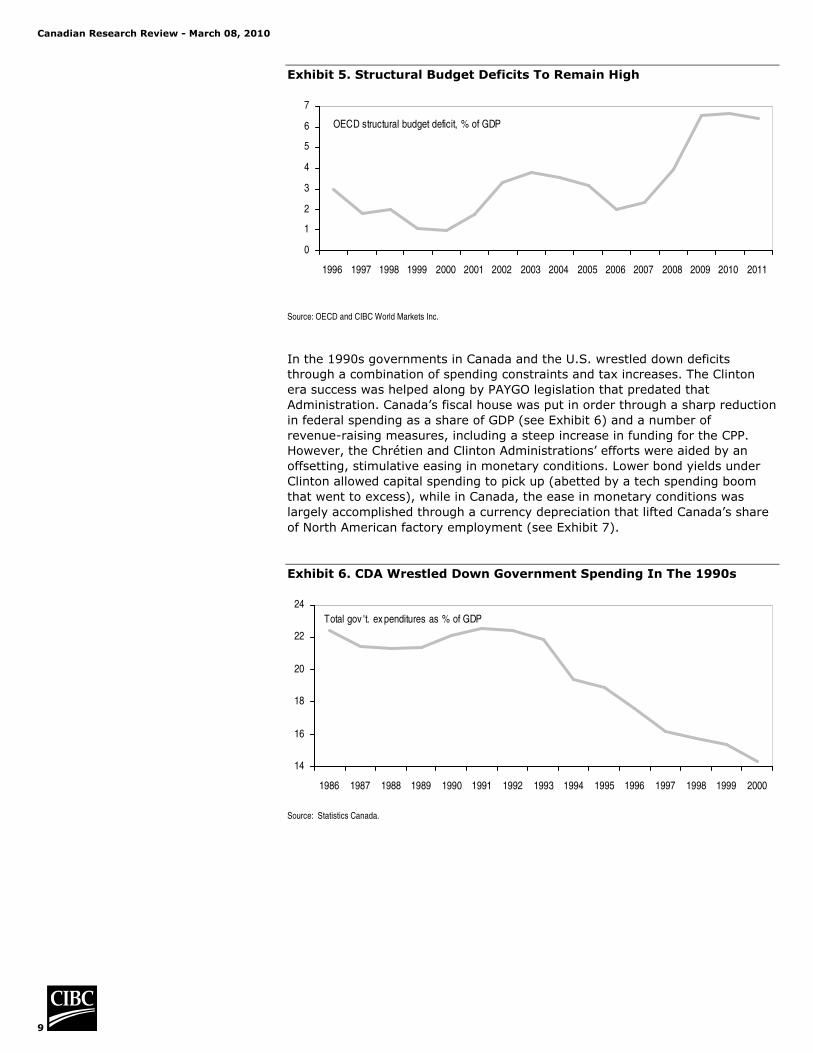
Government debts are on an unsustainable path in the U.S., Japan and many parts of Europe and default is not a viable solution. Growth alone will also not resolve things, especially since this recovery will be slower than normal across most of the globe. At the same time structural deficits – those which by definition would remain even upon a return to full employment – are now over 6% of GDP for the OECD as a whole, after averaging less than 2.5% for the 10 years prior to the last recession (see Exhibit 5).
Canadian Research Review - March 08, 2010
9
Exhibit 5. Structural Budget Deficits To Remain High
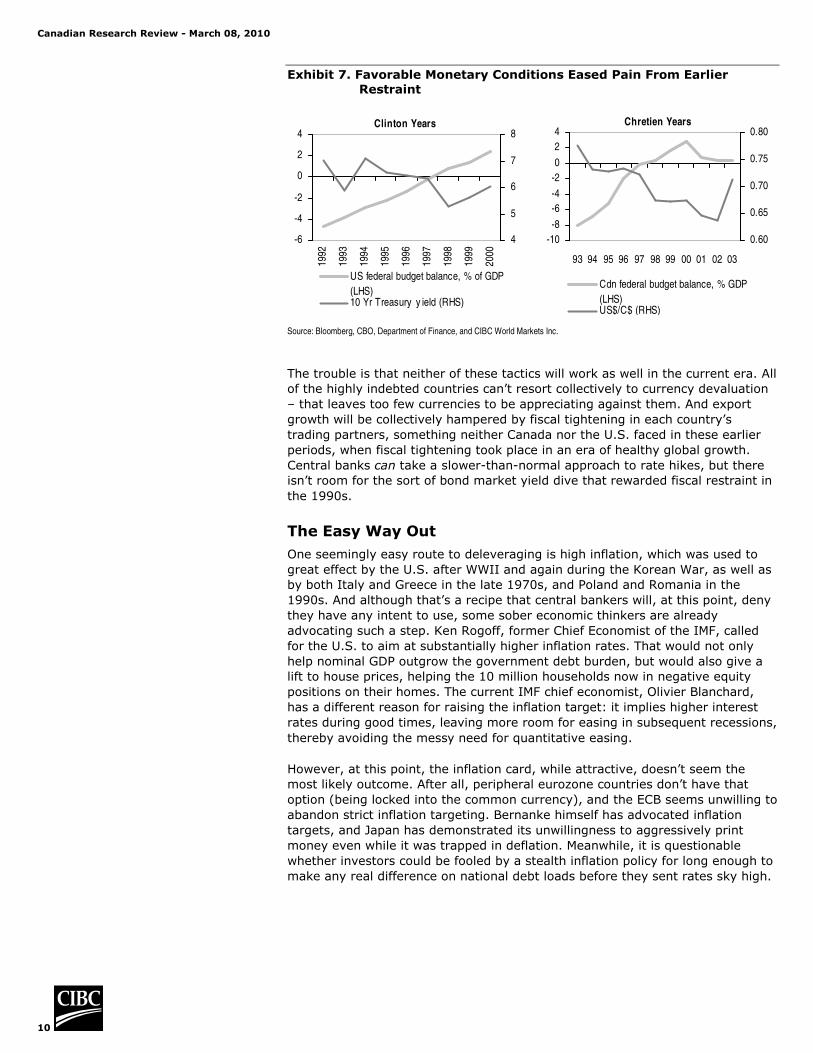
In the 1990s governments in Canada and the U.S. wrestled down deficits through a combination of spending constraints and tax increases. The Clinton era success was helped along by PAYGO legislation that predated that Administration. Canada’s fiscal house was put in order through a sharp reduction in federal spending as a share of GDP (see Exhibit 6) and a number of revenue-raising measures, including a steep increase in funding for the CPP. However, the Chrétien and Clinton Administrations’ efforts were aided by an offsetting, stimulative easing in monetary conditions. Lower bond yields under Clinton allowed capital spending to pick up (abetted by a tech spending boom that went to excess), while in Canada, the ease in monetary conditions was largely accomplished through a currency depreciation that lifted Canada’s share of North American factory employment (see Exhibit 7).
Exhibit 6. CDA Wrestled Down Government Spending In The 1990s
Exhibit 7. Favorable Monetary Conditions Eased Pain From Earlier Restraint
Clinton Years
-6
-4
-2
0
2
4
1992
1993
1994
1995
1996
1997
1998
1999
2000
4
5
6
7
8
US federal budget balance, % of GDP(LHS)10 Yr Treasury y ield (RHS)
Chretien Years
-10-8
-6-4
-20
24
93 94 95 96 97 98 99 00 01 02 03
0.60
0.65
0.70
0.75
0.80
Cdn federal budget balance, % GDP(LHS)US$/C$ (RHS)
Source: Bloomberg, CBO, Department of Finance, and CIBC World Markets Inc.
The trouble is that neither of these tactics will work as well in the current era. All of the highly indebted countries can’t resort collectively to currency devaluation – that leaves too few currencies to be appreciating against them. And export growth will be collectively hampered by fiscal tightening in each country’s trading partners, something neither Canada nor the U.S. faced in these earlier periods, when fiscal tightening took place in an era of healthy global growth. Central banks can take a slower-than-normal approach to rate hikes, but there isn’t room for the sort of bond market yield dive that rewarded fiscal restraint in the 1990s.
The Easy Way Out
One seemingly easy route to deleveraging is high inflation, which was used to great effect by the U.S. after WWII and again during the Korean War, as well as by both Italy and Greece in the late 1970s, and Poland and Romania in the 1990s. And although that’s a recipe that central bankers will, at this point, deny they have any intent to use, some sober economic thinkers are already advocating such a step. Ken Rogoff, former Chief Economist of the IMF, called for the U.S. to aim at substantially higher inflation rates. That would not only help nominal GDP outgrow the government debt burden, but would also give a lift to house prices, helping the 10 million households now in negative equity positions on their homes. The current IMF chief economist, Olivier Blanchard, has a different reason for raising the inflation target: it implies higher interest rates during good times, leaving more room for easing in subsequent recessions, thereby avoiding the messy need for quantitative easing.
However, at this point, the inflation card, while attractive, doesn’t seem the most likely outcome. After all, peripheral eurozone countries don’t have that option (being locked into the common currency), and the ECB seems unwilling to abandon strict inflation targeting. Bernanke himself has advocated inflation targets, and Japan has demonstrated its unwillingness to aggressively print money even while it was trapped in deflation. Meanwhile, it is questionable whether investors could be fooled by a stealth inflation policy for long enough to make any real difference on national debt loads before they sent rates sky high.
Canadian Research Review - March 08, 2010
11
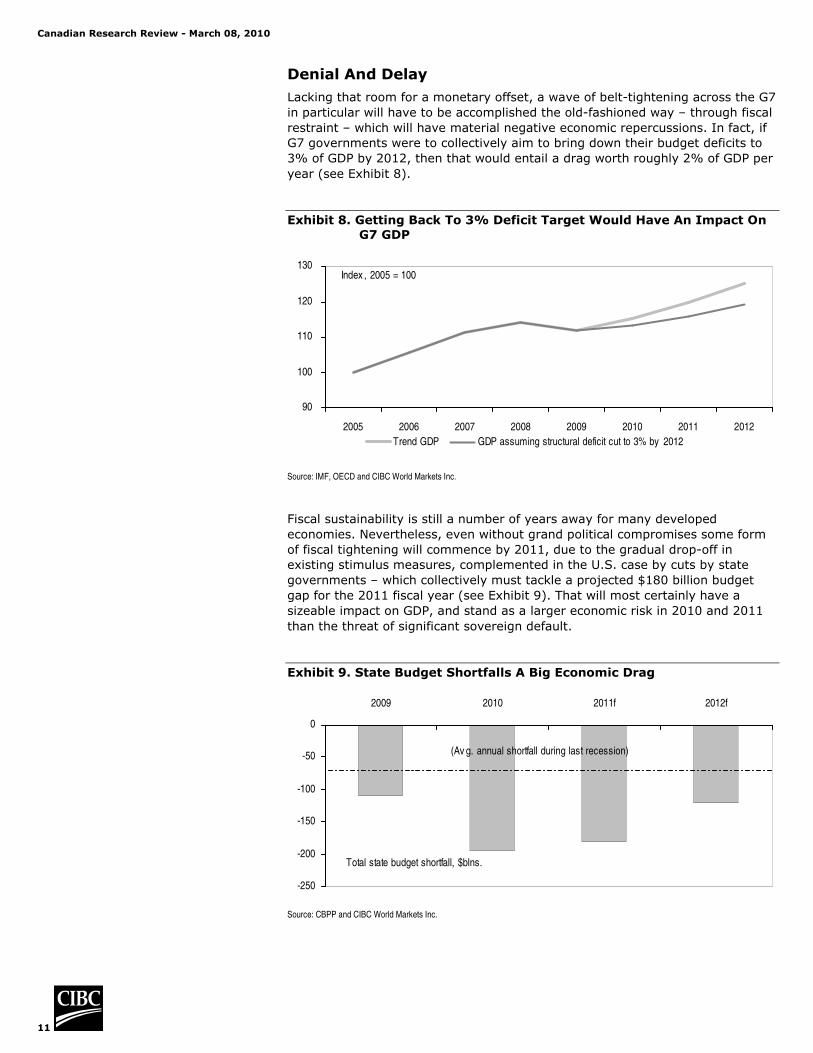
Denial And Delay Lacking that room for a monetary offset, a wave of belt-tightening across the G7 in particular will have to be accomplished the old-fashioned way – through fiscal restraint – which will have material negative economic repercussions. In fact, if G7 governments were to collectively aim to bring down their budget deficits to 3% of GDP by 2012, then that would entail a drag worth roughly 2% of GDP per year (see Exhibit 8).
Exhibit 8. Getting Back To 3% Deficit Target Would Have An Impact On G7 GDP
90
100
110
120
130
2005 2006 2007 2008 2009 2010 2011 2012Trend GDP GDP assuming structural deficit cut to 3% by 2012
Index , 2005 = 100
Source: IMF, OECD and CIBC World Markets Inc.
Fiscal sustainability is still a number of years away for many developed economies. Nevertheless, even without grand political compromises some form of fiscal tightening will commence by 2011, due to the gradual drop-off in existing stimulus measures, complemented in the U.S. case by cuts by state governments – which collectively must tackle a projected $180 billion budget gap for the 2011 fiscal year (see Exhibit 9). That will most certainly have a sizeable impact on GDP, and stand as a larger economic risk in 2010 and 2011 than the threat of significant sovereign default.
Exhibit 9. State Budget Shortfalls A Big Economic Drag
-250
-200
-150
-100
-50
0
2009 2010 2011f 2012f
Total state budget shortfall, $blns.
(Av g. annual shortfall during last recession)
Source: CBPP and CIBC World Markets Inc.
Canadian Research Review - March 08, 2010
12
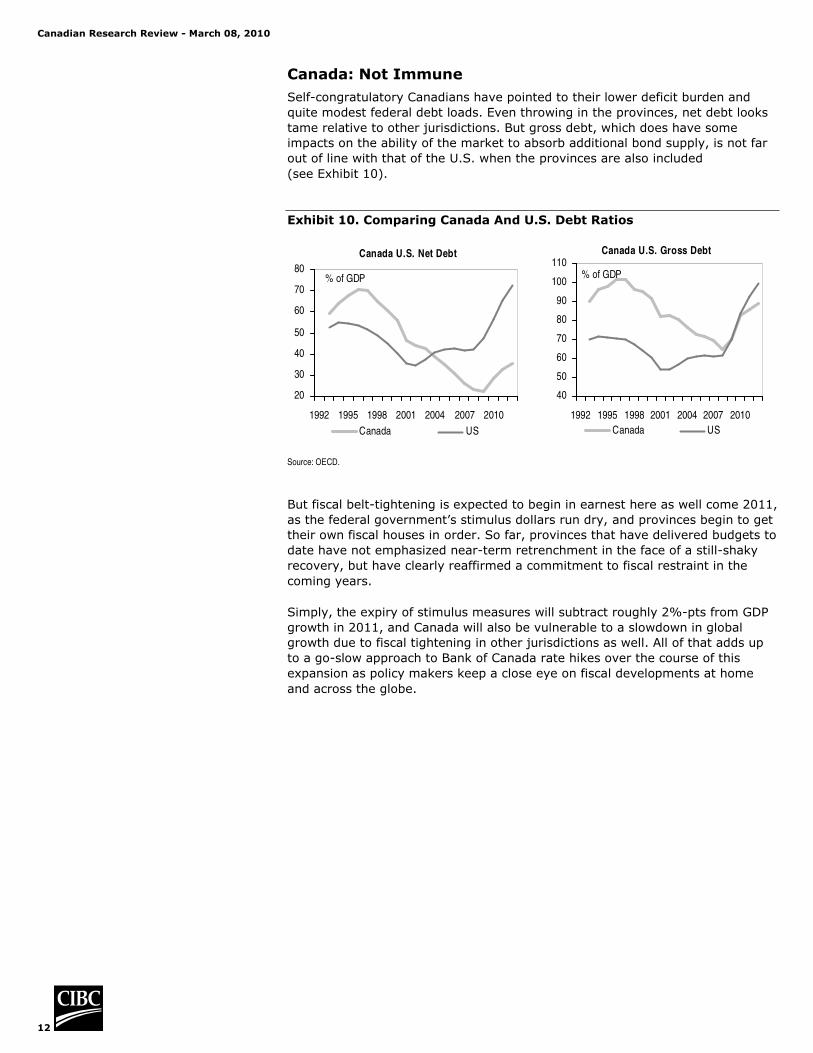
Canada: Not Immune Self-congratulatory Canadians have pointed to their lower deficit burden and quite modest federal debt loads. Even throwing in the provinces, net debt looks tame relative to other jurisdictions. But gross debt, which does have some impacts on the ability of the market to absorb additional bond supply, is not far out of line with that of the U.S. when the provinces are also included (see Exhibit 10).
Exhibit 10. Comparing Canada And U.S. Debt Ratios
Canada U.S. Net Debt
20
30
40
50
60
70
80
1992 1995 1998 2001 2004 2007 2010
Canada US
% of GDP
Canada U.S. Gross Debt
40
50
60
70
80
90
100
110
1992 1995 1998 2001 2004 2007 2010 Canada US
% of GDP
Source: OECD.
But fiscal belt-tightening is expected to begin in earnest here as well come 2011, as the federal government’s stimulus dollars run dry, and provinces begin to get their own fiscal houses in order. So far, provinces that have delivered budgets to date have not emphasized near-term retrenchment in the face of a still-shaky recovery, but have clearly reaffirmed a commitment to fiscal restraint in the coming years.
Simply, the expiry of stimulus measures will subtract roughly 2%-pts from GDP growth in 2011, and Canada will also be vulnerable to a slowdown in global growth due to fiscal tightening in other jurisdictions as well. All of that adds up to a go-slow approach to Bank of Canada rate hikes over the course of this expansion as policy makers keep a close eye on fiscal developments at home and across the globe.
Canadian Research Review - March 08, 2010
13
New Issue Update Toronto Roman Dubczak, Toronto (416) 594-7015 Scott Smith, Toronto (416) 594-7750 Daniel Nowlan, Toronto (416) 956-6261 Michelle Khalili, Toronto (416) 594-7190 Tyler Swan, Toronto (416) 956-3731 Joe Kostandoff, Toronto (416) 594-7915 Valerie Tan, Toronto (416) 956-3976
New York Julie Harbey (212) 856-3731
Equity Issuance Activity All figures in Canadian dollars, unless otherwise stated.
For the month of February 2010, Canadian equity new issuance volume totaled $3.3 billion across almost 50 deals. North American equity markets saw a rebound in February, erasing some of January’s losses, with most indices closing nearly flat on a year-to-date basis. While the S&P/TSX was down 1.0% year to date at month-end, the majority of Canadian index stocks were still trading above their 200-day moving averages. Investors also continued to deploy excess cash into equity market investments. Canadian investable cash levels have declined 30% since peaking in March 2009, yet remain elevated when compared to historical norms. Investors have now become increasingly more comfortable with a higher level of equity risk in their portfolios and are solving for a low interest rate environment, which has driven demand for higher-yielding equity securities.
Despite a strong start to the year, this month’s new issue volume represented a 40% decrease from that of February 2009 due to the absence of a number of the large “re-capitalization” deals launched in the depths of the market crisis last year. New equity raised in the Canadian market continues to be dominated by yield-oriented product and resource-based offerings. Two small IPOs were priced in the month of February, the first IPOs priced in 2010. Rio Novo Gold Inc. raised $40 million in units and ISE Limited (ISE–TSX) raised $20 million in common shares. Athabasca Oil Sands filed a prospectus this month for a $750 million IPO of common shares. Notable transactions during the month included Progress Energy Resources’ (PRQ–TSX) $250 million subscription receipt offering. Concurrent with this offering, CPP Investment Board purchased $350 million on a private placement basis at the same price as the bought deal financing. Other large offerings were Uranium One’s $250 million convertible debenture offering and Brookfield Renewable Power Income Fund’s $175 million 5.25% preferred share offering, which was upsized to $250 million.
Canadian Research Review - March 08, 2010
14
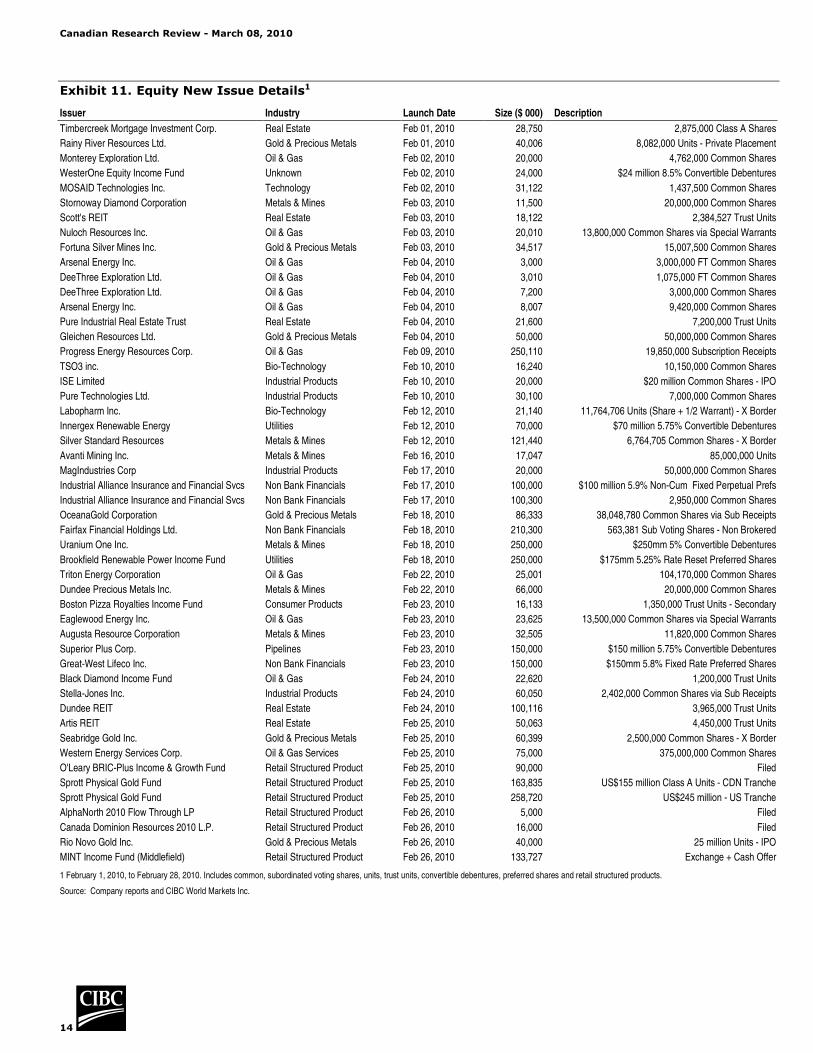
Exhibit 11. Equity New Issue Details1
Issuer Industry Launch Date Size ($ 000) DescriptionTimbercreek Mortgage Investment Corp. Real Estate Feb 01, 2010 28,750 2,875,000 Class A SharesRainy River Resources Ltd. Gold & Precious Metals Feb 01, 2010 40,006 8,082,000 Units - Private PlacementMonterey Exploration Ltd. Oil & Gas Feb 02, 2010 20,000 4,762,000 Common SharesWesterOne Equity Income Fund Unknown Feb 02, 2010 24,000 $24 million 8.5% Convertible DebenturesMOSAID Technologies Inc. Technology Feb 02, 2010 31,122 1,437,500 Common SharesStornoway Diamond Corporation Metals & Mines Feb 03, 2010 11,500 20,000,000 Common SharesScott's REIT Real Estate Feb 03, 2010 18,122 2,384,527 Trust UnitsNuloch Resources Inc. Oil & Gas Feb 03, 2010 20,010 13,800,000 Common Shares via Special WarrantsFortuna Silver Mines Inc. Gold & Precious Metals Feb 03, 2010 34,517 15,007,500 Common SharesArsenal Energy Inc. Oil & Gas Feb 04, 2010 3,000 3,000,000 FT Common SharesDeeThree Exploration Ltd. Oil & Gas Feb 04, 2010 3,010 1,075,000 FT Common SharesDeeThree Exploration Ltd. Oil & Gas Feb 04, 2010 7,200 3,000,000 Common SharesArsenal Energy Inc. Oil & Gas Feb 04, 2010 8,007 9,420,000 Common SharesPure Industrial Real Estate Trust Real Estate Feb 04, 2010 21,600 7,200,000 Trust UnitsGleichen Resources Ltd. Gold & Precious Metals Feb 04, 2010 50,000 50,000,000 Common SharesProgress Energy Resources Corp. Oil & Gas Feb 09, 2010 250,110 19,850,000 Subscription ReceiptsTSO3 inc. Bio-Technology Feb 10, 2010 16,240 10,150,000 Common SharesISE Limited Industrial Products Feb 10, 2010 20,000 $20 million Common Shares - IPOPure Technologies Ltd. Industrial Products Feb 10, 2010 30,100 7,000,000 Common SharesLabopharm Inc. Bio-Technology Feb 12, 2010 21,140 11,764,706 Units (Share + 1/2 Warrant) - X BorderInnergex Renewable Energy Utilities Feb 12, 2010 70,000 $70 million 5.75% Convertible DebenturesSilver Standard Resources Metals & Mines Feb 12, 2010 121,440 6,764,705 Common Shares - X BorderAvanti Mining Inc. Metals & Mines Feb 16, 2010 17,047 85,000,000 UnitsMagIndustries Corp Industrial Products Feb 17, 2010 20,000 50,000,000 Common SharesIndustrial Alliance Insurance and Financial Svcs Non Bank Financials Feb 17, 2010 100,000 $100 million 5.9% Non-Cum Fixed Perpetual PrefsIndustrial Alliance Insurance and Financial Svcs Non Bank Financials Feb 17, 2010 100,300 2,950,000 Common SharesOceanaGold Corporation Gold & Precious Metals Feb 18, 2010 86,333 38,048,780 Common Shares via Sub ReceiptsFairfax Financial Holdings Ltd. Non Bank Financials Feb 18, 2010 210,300 563,381 Sub Voting Shares - Non BrokeredUranium One Inc. Metals & Mines Feb 18, 2010 250,000 $250mm 5% Convertible DebenturesBrookfield Renewable Power Income Fund Utilities Feb 18, 2010 250,000 $175mm 5.25% Rate Reset Preferred SharesTriton Energy Corporation Oil & Gas Feb 22, 2010 25,001 104,170,000 Common SharesDundee Precious Metals Inc. Metals & Mines Feb 22, 2010 66,000 20,000,000 Common SharesBoston Pizza Royalties Income Fund Consumer Products Feb 23, 2010 16,133 1,350,000 Trust Units - SecondaryEaglewood Energy Inc. Oil & Gas Feb 23, 2010 23,625 13,500,000 Common Shares via Special WarrantsAugusta Resource Corporation Metals & Mines Feb 23, 2010 32,505 11,820,000 Common SharesSuperior Plus Corp. Pipelines Feb 23, 2010 150,000 $150 million 5.75% Convertible DebenturesGreat-West Lifeco Inc. Non Bank Financials Feb 23, 2010 150,000 $150mm 5.8% Fixed Rate Preferred SharesBlack Diamond Income Fund Oil & Gas Feb 24, 2010 22,620 1,200,000 Trust UnitsStella-Jones Inc. Industrial Products Feb 24, 2010 60,050 2,402,000 Common Shares via Sub ReceiptsDundee REIT Real Estate Feb 24, 2010 100,116 3,965,000 Trust UnitsArtis REIT Real Estate Feb 25, 2010 50,063 4,450,000 Trust UnitsSeabridge Gold Inc. Gold & Precious Metals Feb 25, 2010 60,399 2,500,000 Common Shares - X BorderWestern Energy Services Corp. Oil & Gas Services Feb 25, 2010 75,000 375,000,000 Common SharesO'Leary BRIC-Plus Income & Growth Fund Retail Structured Product Feb 25, 2010 90,000 FiledSprott Physical Gold Fund Retail Structured Product Feb 25, 2010 163,835 US$155 million Class A Units - CDN TrancheSprott Physical Gold Fund Retail Structured Product Feb 25, 2010 258,720 US$245 million - US Tranche AlphaNorth 2010 Flow Through LP Retail Structured Product Feb 26, 2010 5,000 FiledCanada Dominion Resources 2010 L.P. Retail Structured Product Feb 26, 2010 16,000 FiledRio Novo Gold Inc. Gold & Precious Metals Feb 26, 2010 40,000 25 million Units - IPOMINT Income Fund (Middlefield) Retail Structured Product Feb 26, 2010 133,727 Exchange + Cash Offer
1 February 1, 2010, to February 28, 2010. Includes common, subordinated voting shares, units, trust units, convertible debentures, preferred shares and retail structured products.
Source: Company reports and CIBC World Markets Inc.
Canadian Research Review - March 08, 2010
15
This page left blank intentionally.
Canadian Research Review - March 08, 2010
16
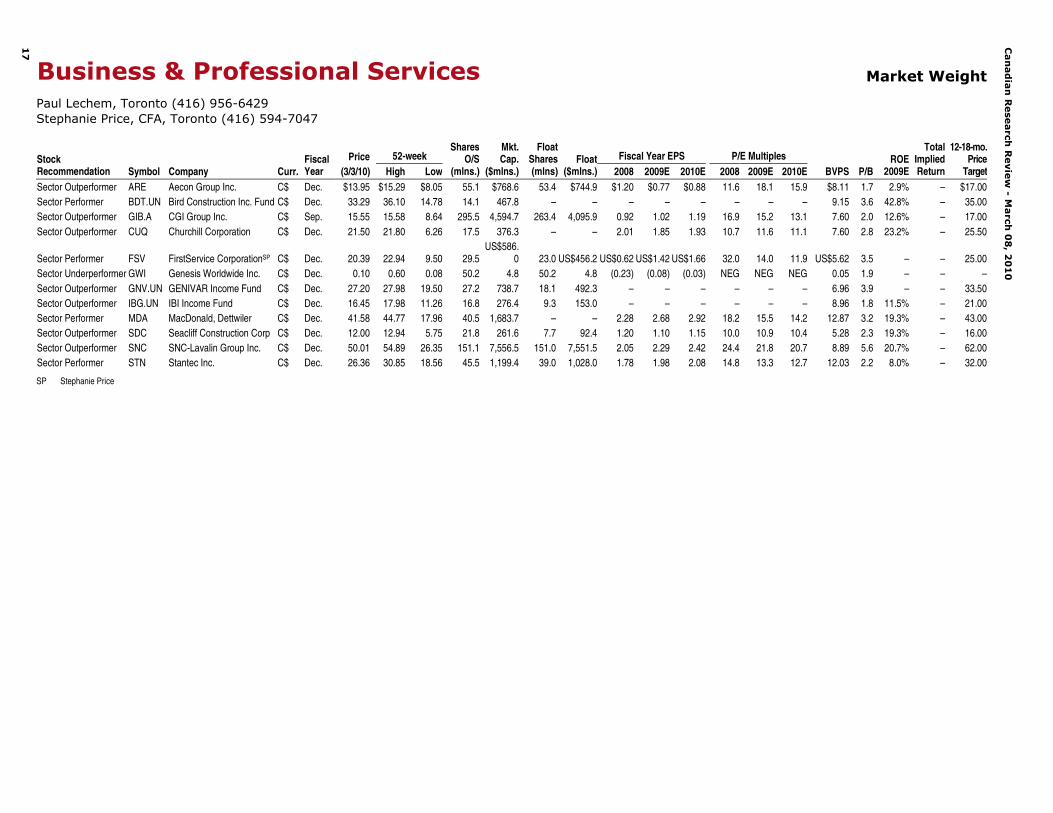
Business & Professional Services Market Weight
Paul Lechem, Toronto (416) 956-6429 Stephanie Price, Toronto (416) 594-7047
Show Me The (Stimulus) Money! All figures in Canadian dollars, unless otherwise stated.
Our Stance On The Sector
We believe the Canadian engineering and construction (E&C) sector is poised for another leg of growth in 2010. After seeing backlogs stagnate or even decline through 2009, we expect government stimulus money to benefit the sector over the coming year. In addition, a number of public-private partnership (P3) projects are expected to be awarded in 2010, further benefiting the Canadian E&C market.
While much of the stimulus funds have been directed to infrastructure (in Canada, about 40% of the total), very little until now has actually been spent, as infrastructure projects have very long lead times. This situation is about to change, as many projects are in the final stretch of the bidding phase, and we expect to see projects start to reach the award stage in the coming months. Indeed, we expect initial contract awards to be seen in Q4/Q1, and the number of such project awards to accelerate through 2010. Consequently, we expect a material increase in new project awards to translate into strong backlog growth in the coming months – and drive further strength in sector stock prices.
Update On The Fundamentals
Quarterly results remained weak in Q3/2009, with sector average revenue and earnings growth dropping from 20%+ in the 2006–2008 period to negative year-over-year growth in Q2/2009 and Q3/2009. Our outlook for Canadian E&C companies in Q4 is for initial signs of strengthening industry backlogs as stimulus projects are awarded, although we expect: 1) backlog growth to accelerate more in 2010; and, 2) revenues and earnings growth to lag backlog growth by six to 12 months. Commentary around Q4 results (and especially the initial 2010 outlook) from the U.S. E&C sector is quite poor, with most companies expecting lower revenues and earnings in 2010. However, there is a significant disparity emerging between the Canadian and U.S. outlook for 2010, given a better Canadian economic environment and (in relative terms) a much more significant stimulus boost.
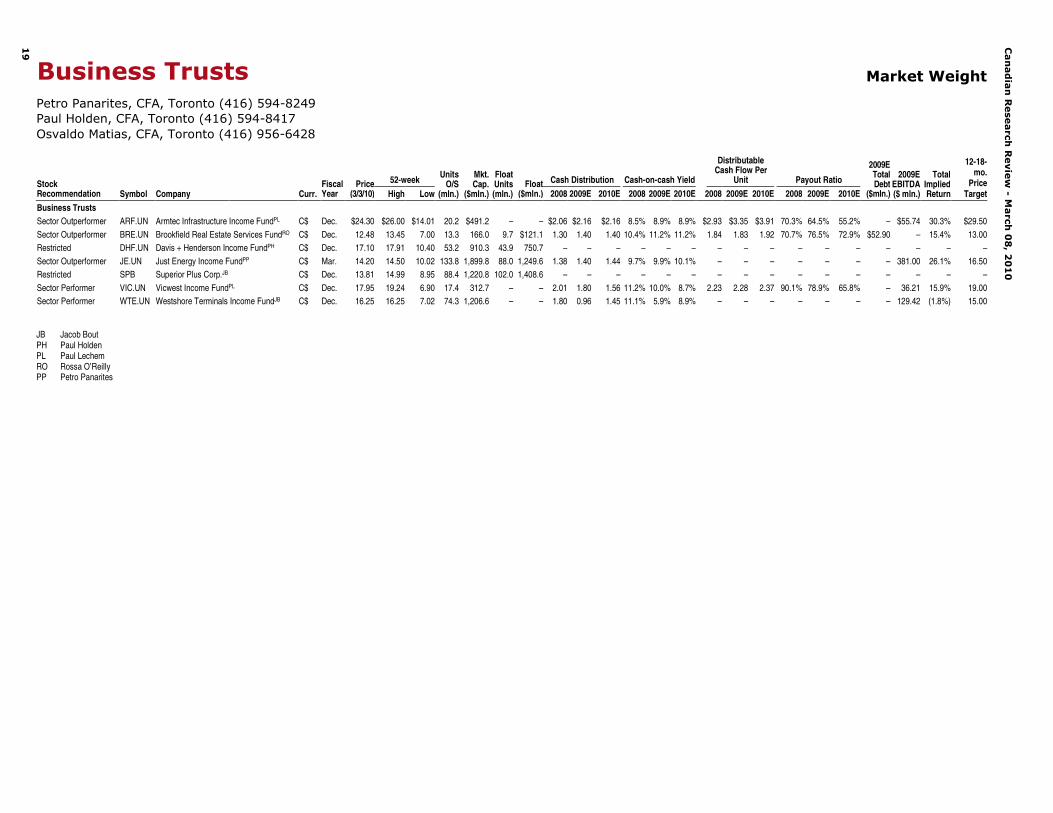
Our Top Picks Our preferred E&C stocks are those with strong backlogs, strong balance sheets, diversified operations (geographically and by end-market), and a focus on infrastructure but limited exposure to the weakest markets (residential, commodity). These companies include Aecon, Armtec Infrastructure,Churchill, GENIVAR, IBI, Seacliff and SNC-Lavalin.
Outside the E&C segment, we also recommend IT services and business process outsourcing provider CGI, which has many of the characteristics of the companies noted above (solid balance sheet, high degree of recurring revenues, diversified business), and satellite parts manufacturer COM DEV, whose end-markets are largely funded by military and government agencies or are benefiting from technological issues (HDTV-driven demand, replacement cycles).
Our Market Weight sector weighting reflects the balance between economic/financial/commodity risks and ongoing infrastructure spending.
Our favorite stocks include Aecon, Armtec Infrastructure, Churchill, GENIVAR, IBI, Seacliff, SNC, CGI and COM DEV.
Can
ad
ian
Rese
arch
Revie
w -
March
08
, 20
10
17
Business & Professional Services Market Weight
Paul Lechem, Toronto (416) 956-6429Stephanie Price, CFA, Toronto (416) 594-7047
52-week Fiscal Year EPS P/E MultiplesStock Recommendation Symbol Company Curr.
JB Jacob BoutPH Paul HoldenPL Paul Lechem RO Rossa O’Reilly PP Petro Panarites
Canadian Research Review - March 08, 2010
20
Chemicals & Fertilizers Market Weight
Jacob Bout, CFA, Toronto (416) 956-6766 Kevin Chiang, Toronto (416) 594-7198 Shereen Zahawi, Toronto (416) 594-7289
Fertilizers/Chemicals Outlook All figures in U.S. dollars, unless otherwise stated.
Our Stance On The Sector
Our Market Weight sector weighting reflects the diversity of commodities in the sector. Outlook for nitrogen and phosphate is positive but remains mixed for potash. Methanol prices are on the rise helped by rising oil and Chinese thermal coal prices along with supply disruptions. Sulphur prices have surged on increased phosphate fertilizer production.
Update On The Fundamentals
Potash demand has improved, with suppliers having modestly increased pricing over the past month to ~$400/t CFR. All eyes remain on India though and its upcoming MOP contract. We view this as the next major development in the potash market, one that will help shape pricing moving forward. While an Indian buying consortium recently signed a contract through June 2010 at $370/t CFR, recent comments out of India indicate that buyers will not accept an annual contract above $350/t CFR [where the 2010 BPC/Chinese (and likely Canpotex) MOP contract settled].
The outlook for phosphate fertilizers remains stable. DAP prices have risen 20%–30% over the past couple of months on improving international demand fundamentals and rising input costs. In the U.S. expectations of rising feedstock costs in H1/2010, particularly for ammonia and sulphur, will help support DAP prices over the coming months.
Outlook for ammonia remains robust as tight supply conditions, especially out of Eastern Europe, are forcing buyers to secure product at a higher level. Tampa March prices settled at $450/t CFR, up $85/t month over month.
The tightening in the sulphur market has pushed sulphur prices higher and spot prices are north of $200/t CFR in some regions. Strong demand from phosphate fertilizer producers and little prospect of new supply coming online are contributing to the higher pricing levels.
Methanol prices continue their rise due to ongoing supply disruptions, rising oil prices, and an elevated Chinese thermal coal price. In addition, with Chinese methanol operating rates hovering at ~50%, we expect net import levels to remain elevated. Methanex raised its Asian March contract price by $15/t to $365/t.
Our Top Picks
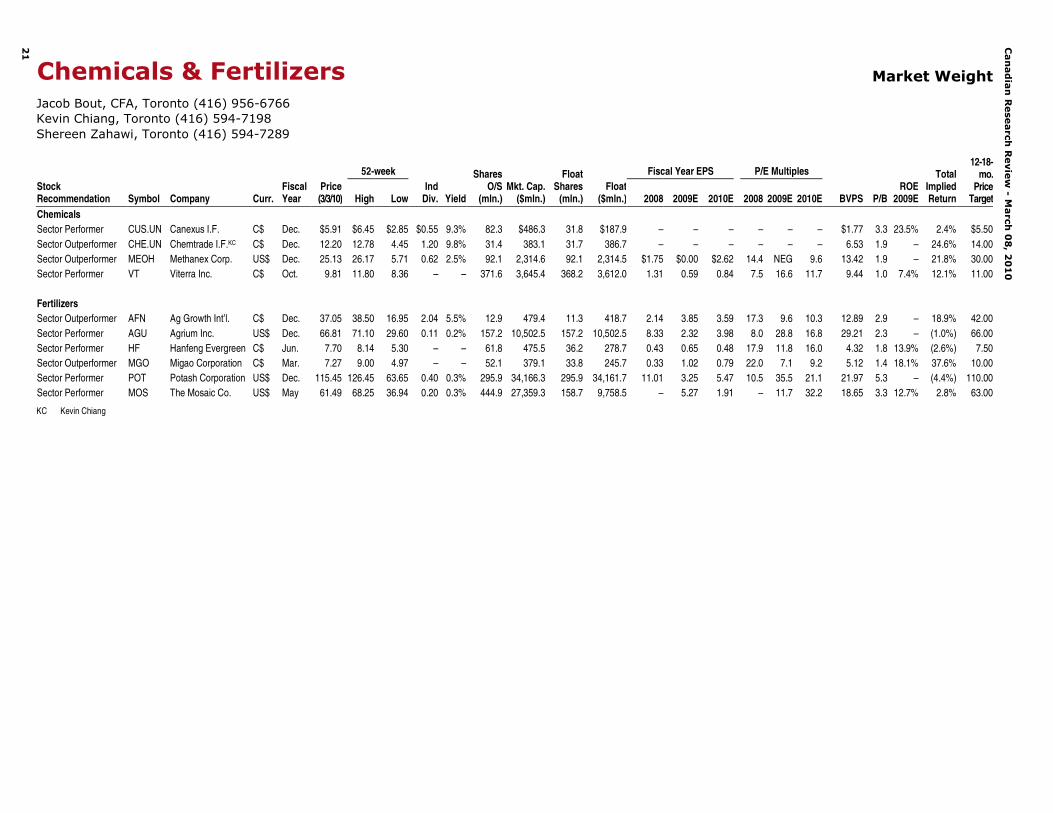
We prefer fertilizer/agricultural stocks over chemical stocks given our outlook for a prolonged agricultural versus chemical cycle. Our top pick in the agriculture space is Ag Growth as it should benefit from bumper U.S. grain production. Among the chemical companies we cover, Methanex is our top pick given its organic growth story and a rising methanol price environment. We expect Chemtrade Logistics Income Fund to benefit from improving sulphur product market fundamentals.
All eyes on India’s 2010 MOP contract.
DAP outlook stable.
Ammonia prices surging on lack of supply.
Sulphur markets tightening.
Methanol prices continue their rise.
Ag Growth and Methanex are our top picks.
Can
ad
ian
Rese
arch
Revie
w -
March
08
, 20
10
21
Chemicals & Fertilizers Market Weight
Jacob Bout, CFA, Toronto (416) 956-6766Kevin Chiang, Toronto (416) 594-7198Shereen Zahawi, Toronto (416) 594-7289
52-week Fiscal Year EPS P/E MultiplesStock Recommendation Symbol Company Curr.
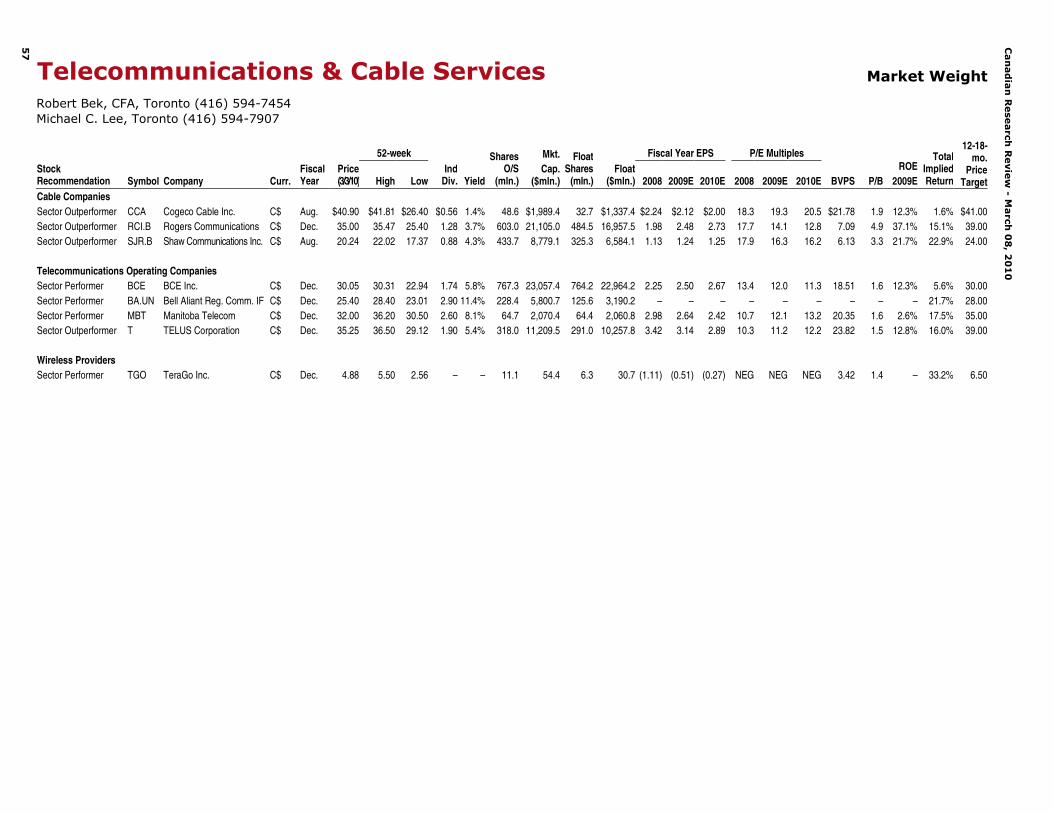
Bob Bek, CFA, Toronto (416) 594-7454 Michael C. Lee, Toronto (416) 594-7907
Ad Market Rebound Key Focus In 2010 All figures in Canadian dollars, unless otherwise stated.
Our Stance On The Sector
Since our last sector update, media valuations continue to edge higher, reflecting more encouraging signs of stabilization in macroeconomic trends. Accordingly, many of the more cyclical names under our coverage have outperformed the broader market index from the trough made back in March, as investors have viewed these equity names as a play on a recovery. Although our expectations are for a more positive 2010, the environment is still uncertain and we believe investors should approach the sector with cautious optimism. The ad recovery will be slow, in our opinion, and the debate over how much of the industry’s decline is structural versus cyclical remains to be seen, although we should get some clarity on this issue this year as conditions strengthen.
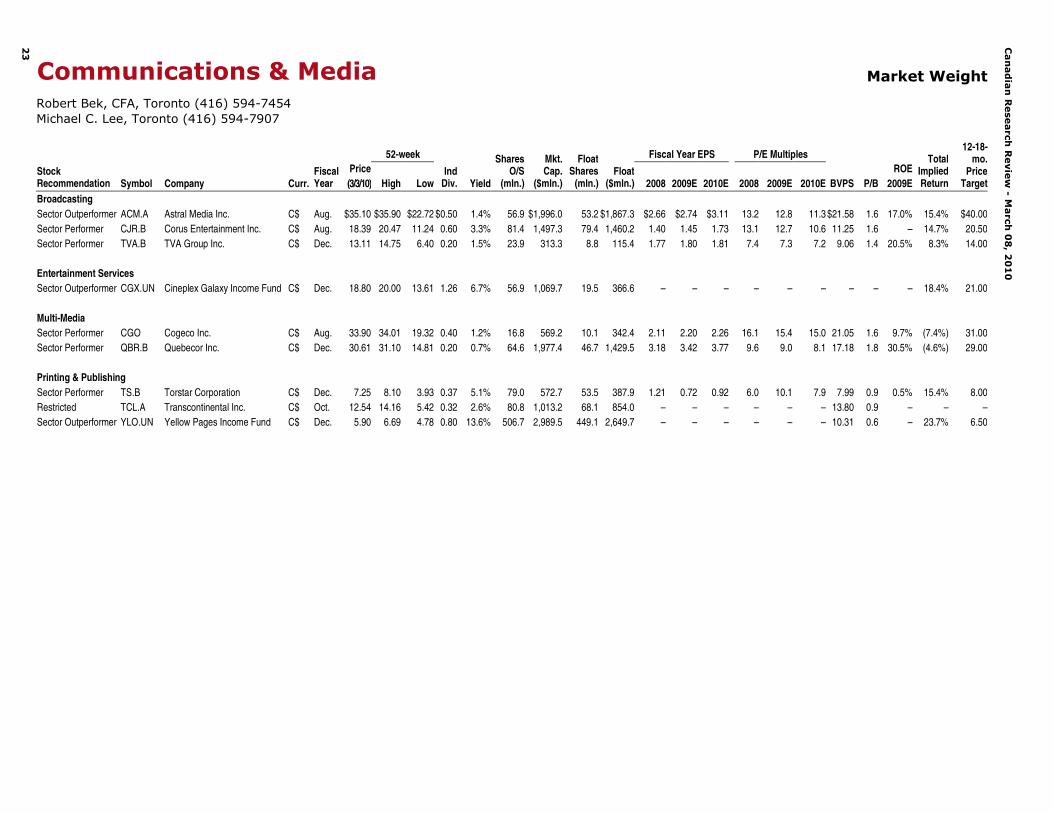
We continue to recommend that investors focus on media companies that have demonstrated the ability to manage this downturn and/or have a more diversified and stable revenue mix outside of traditional media assets. These equities include Astral Media, Corus Entertainment, and Cineplex Galaxy.
Update On The Fundamentals
We continue to believe that cost cutting will remain a primary focus in the sector, with difficult revenue trends likely persisting through the first half of the year. That being said, we are seeing encouraging trends materializing in most businesses as the economy rebounds and advertisers become more receptive, and we remain cautiously optimistic that 2010 will be a year of stabilization for the industry, returning to more sustainable growth rates in the second half of the year.
Our Top Pick
Cineplex Galaxy is our top pick, and remains a defensive name in the sector. The company continues to report strong results on all key fronts, reaffirming our thesis that the exhibition industry is well positioned to weather the economic slowdown. The Canadian box office recorded a stellar fourth quarter of growth, up over 25% driven by the success of 3D films (re: Avatar), which should translate into another good quarter for Cineplex. With an attractive 7.3% yield and solid balance sheet, downside risks remain minimal, in our opinion. We rate Cineplex Sector Outperformer.
Although we expect a more positive 2010, the environment is still uncertain and we believe investors should approach the sector with cautious optimism.
We are seeing encouraging trends materialize as the economy rebounds and advertisers become more receptive.
Cineplex is our top media pick, and remains a defensive name in the sector.
Can
ad
ian
Rese
arch
Revie
w -
March
08
, 20
10
23
Communications & Media Market Weight
Robert Bek, CFA, Toronto (416) 594-7454Michael C. Lee, Toronto (416) 594-7907
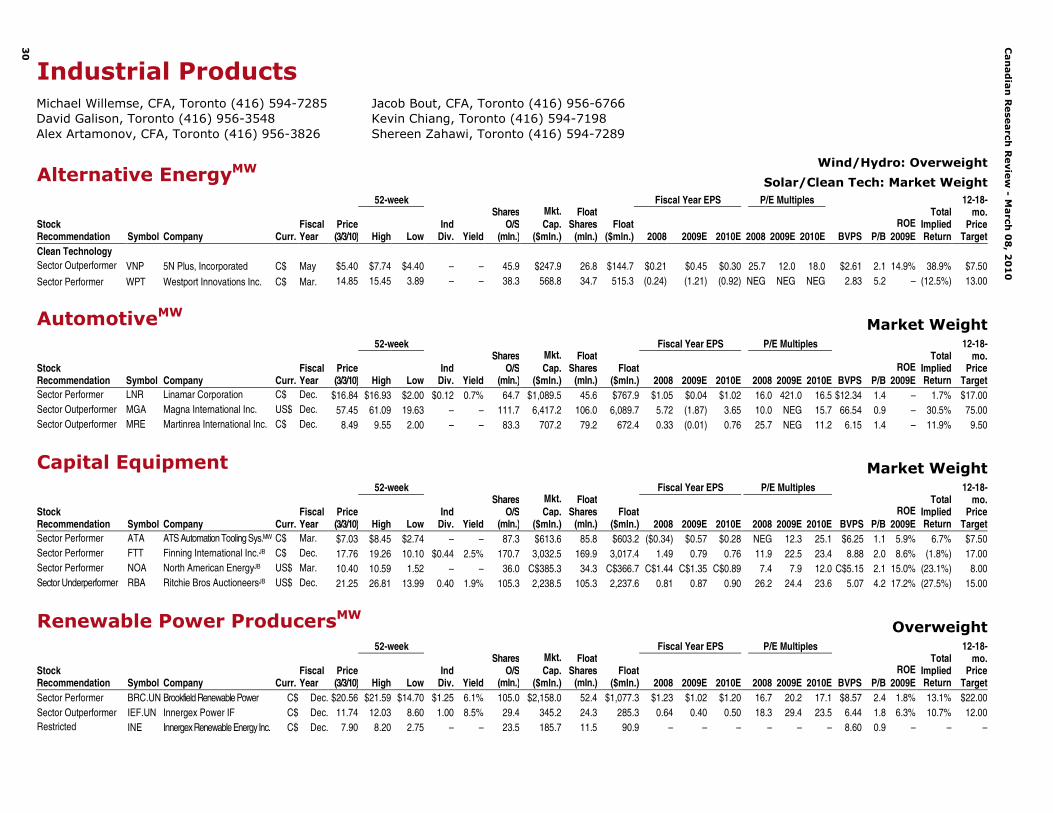
Industrial Products – Alternative Energy Wind/Hydro: Overweight
Solar/Clean Tech: Market Weight
Michael Willemse, CFA, Toronto (416) 594-7285 David Galison, MBA, Toronto (416) 956-3548 Alex Artamonov, CFA, Toronto (416) 956-3826
Cautious Near Term, Positive Long Term All figures in U.S. dollars, unless otherwise stated.
Our Stance On The Sector(s)
Wind/Hydro Sectors: The recent improvement in global credit markets and the recently launched Ontario “Green Energy Act” should favorably impact the solar and wind/hydro industries. The key elements of the “Green Energy Act” include: 1) established the Renewable Energy Facilitation Office; 2) contains domestic content requirements; and, 3) introduces a feed-in tariff program. The Green Energy Act should expedite the growth in renewable power generation in Canada (such as wind, solar, hydro, biomass and biogas).
Clean Technology: In August 2009 the U.S. Department of Energy announced the selection of 25 cost-share projects from proposals submitted under the Clean Cities Program for approximately US$300 million in funding from the American Recovery and Reinvestment Act. The projects will support more than 9,000 light-, medium- and heavy-duty vehicles and establish 542 alternative fuel refueling stations across the U.S. The vehicles and infrastructure include applications for natural and renewable gas, propane, ethanol, biodiesel, electricity, and hybrid technologies.
Based on the program awards, funding will be provided for approximately 500 LNG trucks and 2,300 CNG vehicles, significantly above the initial 400 vehicle estimate. The larger-than-expected number of NGVs under the Clean Cities Program should positively impact the longer-term outlook for NGVs. The awards represent a strong commitment by the Obama administration to influence growth in natural gas medium- and heavy-duty vehicles.
Environmental-related incentive programs for CNG/LNG vehicles (such as the “Nat Gas Act” and the DOE “Clean Cities Program”) should help to stimulate demand for natural gas vehicles in 2010 and 2011. In addition, the recent increase in crude oil prices to over $70/Bbl could also result in an increase in interest for natural gas engine and alternative fuel technologies.
Our Top Picks 5N Plus continues to work on diversifying its customer base with other thin-film solar suppliers. With the acquisition of Firebird Technologies in December 2009, manufacturing of indium should provide 5N Plus with exposure to thin-film photovoltaic applications-based CIGS. Potential benefits at Westport from the California Clean Trucks Program will be less than originally anticipated, although appear to be offset by the larger-than-expected potential from the Clean Cities Program. Brookfield Power Income Fund is also one of the less volatile alternative energy-related equities since the company generates stable cash flows and a favorable dividend yield.
The Clean Cities awards for NGVs represent a strong commitment by the Obama administration to influence growth in natural gas medium- and heavy-duty vehicles.
The recent improvement in global credit markets and the implementation of the Ontario “Green Energy Act” favorably impact the wind/hydro industry and support growth in Canada.
We rate 5N Plus Sector Outperformer.
Canadian Research Review - March 08, 2010
27
Industrial Products — Auto Parts Suppliers Market Weight
Michael Willemse, CFA, Toronto (416) 594-7285 David Galison, Toronto (416) 956-3548
U.S. Auto Sales Remain Below Scrap Rates All figures in U.S. dollars, unless otherwise stated.
Our Stance On The Sector
U.S. light vehicle sales in February were 10.34 million units (SAAR) versus 10.76 million in January and 9.10 million in February 2009. February sales results were essentially in line with the consensus estimate of 10.3 million vehicles. On a SAAR basis, light vehicle sales declined by 3.9% (increased by 11.7% on a units basis) versus January 2010 and increased 13.1% (increased 13.3% on a units basis) versus February 2009. Year over year, GM sales rose 12.2% versus consensus expectations of a 20% increase, Ford (F–NYSE) sales increased 43.5% versus consensus expectations of a 33% increase, and Chrysler sales increased 0.6% versus consensus expectations of an 18% decline.
March U.S. light vehicle sales should benefit from aggressive incentive programs offered by Toyota (TM–NYSE) and GM. Auto sales should also continue to benefit from stable credit markets, low interest rates, strong used vehicle values and a continued increase in replacement demand. As long as U.S. light vehicle sales remain below scrap rates (recall that in 2009 the U.S. scrapped 14 million light vehicles) the bias for light vehicle sales will be positive in the near term as sales increase toward replacement demand.
In addition to rising U.S. light vehicle sales, auto suppliers should also benefit from a return to inventory restocking. Production cuts taken in 2009 have resulted in inventories declining to 10-year lows. As per WardsAuto.com, U.S. light vehicle inventories in January were at 71 days supply (2.059 million units), up versus 53 days supply (1.93 million units) in December 2009 and 121 days (3.383 million units) in January 2009. Domestic U.S. light vehicle inventories were 1.577 million units versus 1.467 million in December 2009 and 2.281 million in January 2009. January 10-year average levels are 85 days (3.588 million units). We estimate that February 2010 U.S. domestic light vehicle inventories will remain below 10-year averages. The continuation of U.S. light vehicle inventory levels below 10-year averages is encouraging.
Our Top Picks
Magna is well capitalized and has managed costs effectively. The company should benefit from cost reductions completed in H1/2009 as auto production ramps up. In addition, the company is making significant investments in the Electronics/Electric Drive, which should eventually provide further upside.
Both Martinrea and Linamar have successfully reduced cost structures during the recent downturn. While the outlook for Linamar's Powertrain/Driveline business appears encouraging due to the ramp-up of takeover business and new program launches, we remain somewhat concerned that Linamar may be at risk of a continued downturn in non-residential construction markets through the company’s Skyjack operations. Additionally, heavy truck engine shipments are expected to decline by approximately 50% in H1/2010 versus Q4/2009 levels.
As one of the top three suppliers of metal stamping and fluid management systems in North America, Martinrea is well positioned to assume a significant amount of business as supplier consolidation continues.
February U.S. light vehicle sales were 10.34 million units (SAAR) versus 10.76 million in January and 9.10 million in February 2009.
As long as U.S. light vehicle sales remain below replacement demand, the bias for auto sales is positive in the near term.
We rate Martinrea and Magna Sector Outperformer.
Canadian Research Review - March 08, 2010
28
Industrial Products — Capital Equipment Market Weight
Jacob Bout, CFA, Toronto (416) 956-6766 Kevin Chiang, Toronto (416) 594-7198 Shereen Zahawi, Toronto (416) 594-7289
A Moderate Recovery Under Way All figures in U.S. dollars, unless otherwise stated.
Our Stance On The Sector Our Market Weight sector weighting reflects the complexity of the underlying drivers of this group. The rebound in oil and base metals prices from their lows has been a positive catalyst for demand but natural gas prices continue to trend at historical lows. Government stimulus packages, including large infrastructure spend components, remain the bright spot for the heavy equipment group.
Update On The Fundamentals Our outlook for the heavy equipment sector has improved given the rebound in commodity prices. Finning’s key growth market remains the Canadian oil sands, while North American Energy Partners (NOA) is the largest contractor in the region. Both companies should benefit from expectations of improving activity levels in the oil sands. While a global economic slowdown should increase volumes for Ritchie Bros., depressed pricing for used equipment could pressure gross auction sales and rates moving forward.
The CIBC Metals & Minerals team is forecasting a copper price of $3.21/lb. in 2010 and $3.00/lb. in 2011. Its long-term copper price assumption is $2.00/lb. but that is not expected to materialize until 2013 at the earliest.
The CIBC Oil & Gas team is forecasting 2010 and 2011 WTI oil prices of $78/Bbl and $82.50/Bbl, respectively, while its 2010 and 2011 AECO natural gas price forecasts are C$5.75/Mcf and C$6.50/Mcf. Natural gas prices are being impacted by relatively high storage levels.
Governments around the world are pushing through infrastructure projects as a primary method to stimulate the economy and create jobs. The stimulus packages in general, which raise the total to be spent on construction expenditure, are a positive for heavy equipment dealers and contractors. It is likely that the number of shovel-ready projects is optimistic, but the majority of the benefits from the growth infrastructure spend should begin to materialize in 2010.
Our Market Weight sector weighting reflects the complexity of the underlying drivers of this group.
Our outlook for the heavy equipment group has improved with the rebound in commodity prices.
The CIBC Metals & Minerals team is forecasting a copper price of $3.21/lb. in 2010 and $3.00/lb. in 2011.
The CIBC Oil & Gas team is forecasting a WTI crude oil price of $78/Bbl for 2010, $82.50/Bbl for 2011.
Government stimulus packages should be a positive for equipment demand and contractors.
Canadian Research Review - March 08, 2010
29
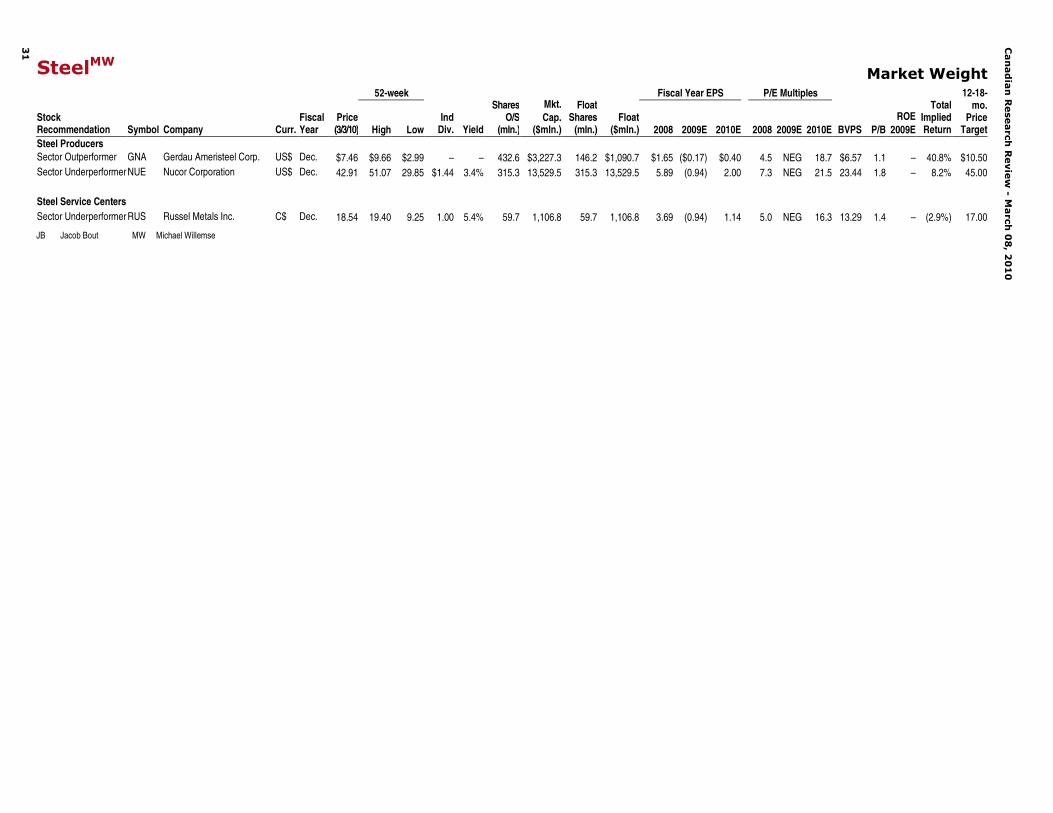
Industrial Products — Steel Market Weight
Michael Willemse, CFA, Toronto (416) 594-7285 David Galison, Toronto (416) 956-3548
Utilization Improving, But Not At Favorable Levels Yet All figures in U.S. dollars, unless otherwise stated.
Our Stance On The Sector
North American steel prices have been on a rising trend since December 2009. North American hot-rolled coil prices bottomed out in late November at $502/ton and have rebounded to $608/ton as of February 22 (Steelbenchmarker). Most of the increase in steel prices has related to rising raw material prices, and some seasonal improvement in demand. North American HMS#1 scrap prices have increased to approximately $298/ton from $209/ton in early November. Recent press reports are suggesting a significant escalation in global benchmark iron ore and metallurgical coal prices in 2010 versus 2009. AME is forecasting iron ore prices (fines) to rise by approximately 25%, while metallurgical coal prices are expected to increase by approximately 32%. Other sources have suggested increases by as much as 50% for iron ore and 86% for metallurgical coal. These cost increases could push an integrated steel producer’s cost of producing steel to approximately $535/ton–$600/ton, suggesting that hot-rolled coil prices in the $600/ton–$650/ton range are possible over the next few months. However, we believe this rally would be short-lived as capacity utilization would increase and prices would likely begin to trend lower again in mid-2010.
U.S. capacity utilization remains below 80% (which is generally necessary for producers to attain material pricing power); however, U.S. weekly steel production has been on an upward trend since mid-April, with U.S. capacity utilization currently at 69%. We do not expect steel producers to hold material pricing power until 2011, at which time capacity utilization should increase to approximately 80% or higher.
We continue to expect the steel industry to be challenging in 2010, although we expect end-market demand will at least be stable. Service center inventories remain at relatively low levels (the service center sector represents the largest end-user for the steel producers at approximately 40% of shipments). The latest inventory data provided by MSCI indicates that U.S. finished steel service center inventories in January were 6.26 million tons, up 2.0% versus December 2009 and down 26.2% versus January 2009. Months’ shipments on hand declined to 2.43x versus 2.74x in December 2009. The average daily shipment rate increased in January to 128.8 tons versus 102.0 tons in December 2009 and 123.9 tons in January 2009. Total U.S. service center shipments increased 14.9% versus December 2009, but declined 0.9% versus January 2009.
Our Top Picks
We continue to find the valuation of Gerdau compelling, particularly versus replacement cost and peers. Gerdau should benefit from the significant cost-cutting initiatives combined with a still favorable product mix once the steel sector recovers from the current downturn. We expect Q1/2010 demand to rebound from seasonal weakness in Q4/2009 and that Gerdau will likely start to see some infrastructure activity in H2/2010. Nucor’s near-term earnings should benefit from the completed consumption of high-cost scrap purchased in mid-2008. We believe Russel Metals has the best opportunity to grow through acquisitions given the relatively fragmented North American service.
We rate Gerdau Ameristeel Sector Outperformer.
Can
ad
ian
Rese
arch
Revie
w -
March
08
, 20
10
30
Industrial ProductsMichael Willemse, CFA, Toronto (416) 594-7285 Jacob Bout, CFA, Toronto (416) 956-6766David Galison, Toronto (416) 956-3548 Kevin Chiang, Toronto (416) 594-7198Alex Artamonov, CFA, Toronto (416) 956-3826 Shereen Zahawi, Toronto (416) 594-7289
Alternative EnergyMW Wind/Hydro: Overweight
Solar/Clean Tech: Market Weight52-week Fiscal Year EPS P/E Multiples
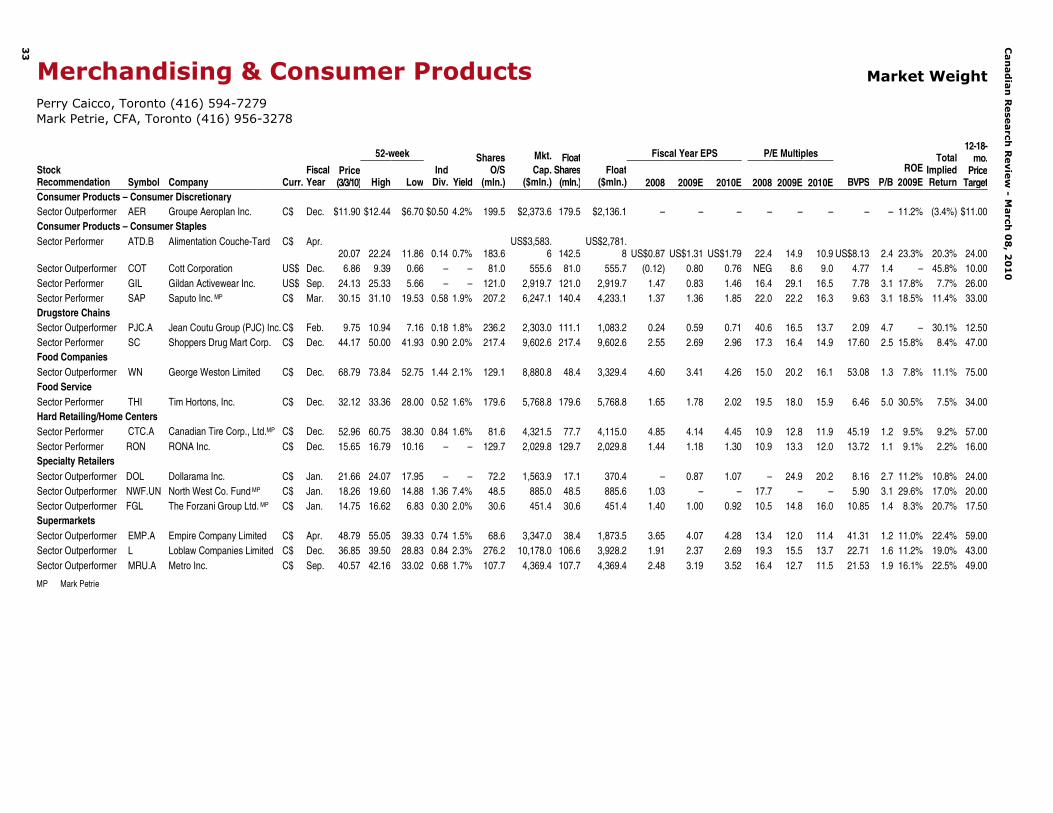
Perry Caicco, Toronto | Mark Petrie, CFA, Toronto (416) 594-7279 (416) 956-3278
Alive And Well All figures in Canadian dollars, unless otherwise stated.
Our Stance On The Sector
Predictions that hundreds of Canadian retailers would bite the dust during the 2009 recession turned out to be patently wrong. Most Canadian retailers came into the recession with strong balance sheets, chose a specific consumer strategy and then just rode it out with minimal nicks and scrapes. Some pulled back promotions and cut costs; some invested heavily to drive business; everyone managed inventories and labor carefully. Despite a sharp downturn in sales and a general flattening of earnings, just about everyone came out alive.
Focus Now: Margins; Focus Later: Growth
To this point, the consumer recovery and margin expansion have driven most of the share price growth in the retail and consumer sector. However, as margin expansions inevitably slow down, shares may stall. In order to reignite shares, multiples must expand, and that usually comes from strong prospects for growth. A few companies will accomplish top-line growth through acquisitions, a few from international expansion, but most companies in our coverage universe have yet to figure out where long-term growth is coming from. As 2010 unfolds, and as margin expansion slows, Canadian retail and consumer companies will be under pressure to develop and communicate longer-term plans for revenue growth.
The Forzani Group – Productivity Will Drive Earnings.
Forzani is Canada’s leading sporting goods and apparel retailer, operating nationwide, with annual sales of nearly $1.6 billion. Its store network includes corporate and franchise stores, operating under numerous banners, including Sport Chek, Sports Experts, Intersport, Sport Mart and Atmosphere. Since going public in 1993, the company has grown sales by 21% annually (CAGR), which has been driven primarily by numerous acquisitions, but also supported by organic network and same-store sales (SSS) growth.
We are forecasting only modest recovery in consumer health in 2010, with unemployment remaining elevated and consumer confidence edging upward, but still weak relative to historical levels. Even if sales do not come roaring back at Forzani, however, we still believe there is the possibility for margin expansion, particularly as G&A expenses are held in check and potentially reduced. Free cash flow should continue to be positive, leaving room for share buybacks or dividend increases.
Our Top Picks
We rate Metro, Empire, Loblaw, Cott, Dollarama, Groupe Aeroplan, Jean Coutu, Forzani, George Weston and North West Company Fund as Sector Outperformer.
We continue to rate the sector as Market Weight.
When considering the cash-generation capabilities within the Forzani operations and the likelihood of a resumption of share buyback activity and a potential dividend increase, we feel like the shares represent good value at current levels.
They came out breathing, but not unchanged. Emerging from the downturn many companies altered their views of their own businesses, thought more carefully about their customers, and began adopting new strategies and tactics.
Can
ad
ian
Rese
arch
Revie
w -
March
08
, 20
10
33
Merchandising & Consumer Products Market Weight
Perry Caicco, Toronto (416) 594-7279Mark Petrie, CFA, Toronto (416) 956-3278
Alec Kodatsky, Toronto (416) 594-7284 Ian Parkinson, Toronto (416) 956-6169 Terry K.H. Tsui, CFA, Toronto (416) 956-3287 Matthew Gibson, Toronto (416) 956-6729
Positioning For Another Prosperous Year All figures in U.S. dollars, unless otherwise stated.
Our Stance On The Sector
Despite a volatile period of trading, commodities and related equities ended higher in February. Optimism on physical metals demand won over the negative market sentiment generated by the European sovereign credit crisis and concerns of tightening, or at best “less loose” monetary policy from China and the U.S. Market participants appear to have looked through the seasonally weaker first quarter and taken advantage of the recent pullback to reposition for the anticipated strong return in metals demand when manufacturing activities return to normal after the long Chinese New Year holidays.
While investors may have shifted their focus towards commodity and company fundamentals, we believe short-term price movements will continue to be dictated by the anticipated direction of the U.S. dollar and economic news flow. The abnormally high (from a historical context) metals inventory positions in exchanges remain the swing factor for metals prices. We expect that as long as constructive economic news flow continues, traditional metals price fundamentals will be less important to price. However, the emergence of any weakness in the global recovery thesis could prove the catalyst for another period of swift profit-taking. Similarly, indications that other major global economies begin to “stall” as the impact of prior stimulus spending lessens would likely prove detrimental to commodity prices. As we had expected, changes to banking policies within China weighed negatively on overall sentiment for the base metals complex. Also, metals price movements in the past few months continue to suggest the investment link between commodities (“hard assets”) and the U.S. dollar remains in place.
For the month of February, aluminum, copper, lead, nickel and zinc were up 1.3%, 4.2%, 5.3%, 15.4% and 1.6%, respectively. The broad mining sector indexes, FTSE Mining Index and S&P/TSX Materials Index, were up 2.0% and 2.3% for the month, respectively.
Update On The Fundamentals
While the higher commodity prices will likely encourage some mines to re-open and increase supply, there is little slack in terms of inventories (with the exception of aluminum and nickel) to chew through if a sustainable recovery in the global economy emerges in the medium term. In the longer term, we continue to believe the secular bull-run for metals remains unbroken as 50% of the world population looks to industrialize. We believe aluminum continues to have the weakest fundamentals, while copper and zinc retain the best on tight supply outlooks and low inventories on a historical basis.
Our Top Picks
Our favored stocks focus on well-capitalized companies with a solid, low-cost operational base. Our preferred names are Capstone, First Quantum, FNX,Mercator, Taseko, and Teck.
Market Weight sector weighting is based on a belief that metals are already pricing in some of the economic recovery. Growth of the metals sector will rely on a sustainable recovery.
Longer-term fundamentals look positive given a tight supply outlook, but we are cautious of near-term consolidation given the significant price appreciation from the bottom.
Can
ad
ian
Rese
arch
Revie
w -
March
08
, 20
10
35
Mining — Metals & Minerals Market Weight
Alec Kodatsky, Toronto (416) 594-7284Ian Parkinson, Toronto (416) 956-6169Terry K.H. Tsui, CFA, Toronto (416) 956-3287Matthew Gibson, Toronto (416) 956-6729
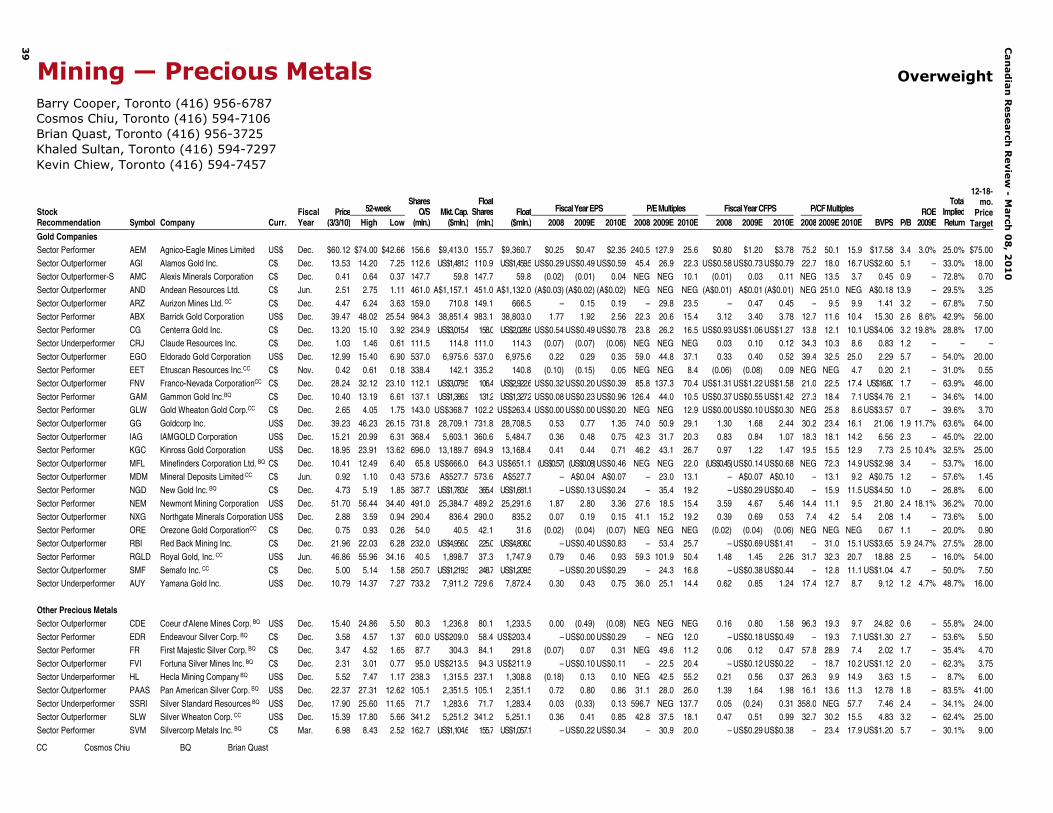
52-week Fiscal Year EPS P/E Multiples Fiscal Year CFPS P/CF MultiplesStock Recommendation Symbol Company Curr.
Barry Cooper, Toronto (416) 956-6787 Cosmos Chiu, Toronto (416) 594-7106 Khaled Sultan, Toronto (416) 594-7297 Kevin Chiew, Toronto (416) 594-7457
Fundamentals Remain Strong All figures in U.S. dollars, unless otherwise stated.
Our Stance On The Sector
Gold is not expensive. Last year, despite it reaching all-time highs, most other commodities well outperformed it. Even looking at long-term averages, bullion is trading at premiums that are little different from other benchmarks such as copper and oil. We think that strength in gold pricing will remain over the next two years.
Gold has been exhibiting significant correlation to the U.S. dollar, yet we believe other fundamentals will also support continued strong performance of the metal, including stronger investment demand, the market's need for a safe haven investment, and the absence of growing mine supply.
Update On The Fundamentals
Over this year and the next, we expect gold to continue a steady ascent towards $1,400/oz., albeit at the cost of added volatility, which we consider normal and, arguably, healthy. Furthermore, we would not be surprised if the rate of increase was at a faster pace than we have forecasted. In a +$1,100/oz. gold price environment, we think there will be new parameters driving the sector, among them renewed talks of margin expansion and higher assumption of political risk as the thirst for reserves intensifies.
Our Top Picks
We believe that smaller producers will outperform bigger ones as the bull market continues and believe that over the 18-month period these companies combine a good balance between risk and shareholder reward. Our top picks are Eldorado Gold, Northgate Minerals, Red Back Mining, and Semafo.Eldorado offers twice the growth of others in 2011 among our coverage universe, while Northgate has the highest leverage for rising gold prices in the intermediate space. Red Back provides a combination of production and reserve growth unlike many of its peers, while Semafo presents a complementary portfolio of operating assets to deliver expansion potential and leverage to gold.
Among the explorers we favor Andean. The company continues to report excellent drill results from the Bajo Negro zone at its Cerro Negro project in Argentina. The recent discovery of the San Marcos zone further underscores the company’s ability to find more high-grade deposits on the same property. We believe that more discoveries will be forthcoming. We further believe that Andean is positioned as an attractive takeout target in the current environment.
Our top pick of the royalty companies is Franco-Nevada. The company has a strong balance sheet, with close to $800 million in available capital and no debt. The company is also expected to generate in excess of $180 million in free cash flow in 2010 and over $230 million in 2011. With over 75% of its revenue generated from gold royalties, Franco-Nevada provides exposure to upswings in the gold price while exhibiting defensive attributes given its high margins.
We believe the longer-term fundamentals are still in place for gold to remain strong.
We favor Eldorado, Northgate, Red Back and Semafo among the producers; Andean is likely to become a takeout target; Franco-Nevada stands out as the best royalty play for risk-averse holdings.
Canadian Research Review - March 08, 2010
38
Mining — Precious Metals –Silver Overweight
Brian Quast, Toronto (416) 956-3725 Cosmos Chiu, Toronto (416) 594-7106 Barry Cooper, Toronto (416) 956-6787 Kevin Chiew, Toronto (416) 594-7457
Early 2010 Correction Should Be Short-lived All figures in U.S. dollars, unless otherwise stated.
Our Stance On The Sector
The gold/silver ratio is trading in the 60s. Our gold price expectations, coupled with an expected constant gold/silver ratio for 2010, would indicate that silver should participate fully in rising gold prices. After a tremendous year in 2009, silver prices have seen a mild correction in early 2010. We view this as a brief pause before silver performance picks up again. We believe silver fundamentals remain strong and should support silver prices as seen in late 2009.
Update On The Fundamentals In our opinion, the silver market is close to equilibrium, but with silver production rising over the next five years, additional demand is required to maintain the upward trajectory in silver prices. We believe this additional demand will likely come in the form of “safe harbor” investment in the event of an economic correction. We maintain our silver price estimates (2010E: $18.00/oz.; 2011E: $20.00/oz.; long term: $15.00/oz.) in the belief that there will be a period of safe haven buying in the relatively near future. Base metals pricing has remained strong, which should benefit those companies with base metals exposure.
Our Top Picks
Our top pick among large-cap silver companies is Pan American Silver. With the Aquiline transaction, Pan American has addressed the issue of production growth. As Pan American works through permitting and as a new feasibility study for the project is put in place, we expect to see these positive catalysts reflected in Pan American shares. The company has a track record of making accretive acquisitions and a mine-building team second to none in the industry.
We also like Fortuna Silver, which offers investors exposure to silver production at low cash costs in politically safe jurisdictions with an attractive growth profile. We believe an experienced management team and a solid operations track record instill confidence that production growth plans can come to fruition. While valuation against its peer group of junior producers reveals that it is currently undervalued, we believe Fortuna is deserving of higher multiples than many other junior silver producers due to its production growth profile and operations track record.
We recommend Silver Wheaton as a unique investment vehicle that provides investors with exposure to a silver operation with limited operating risks. Silver Wheaton added considerable growth to an already impressive royalty portfolio with its new Pascua-Lama stream agreement signed with Barrick Gold. Pascua-Lama, along with the Peñasquito stream, will form cornerstone assets for Silver Wheaton, providing much of its future growth profile. We believe Silver Wheaton has a solid business model and that it should trade in line with other royalty companies in terms of a premium.
We believe strong silver prices are supported by relative gold pricing and long-term fundamentals.
Pan American, Fortuna Silver, and Silver Wheaton are our top picks in the silver group.
Can
ad
ian
Rese
arch
Revie
w -
March
08
, 20
10
39
Mining — Precious Metals Overweight
Barry Cooper, Toronto (416) 956-6787Cosmos Chiu, Toronto (416) 594-7106Brian Quast, Toronto (416) 956-3725Khaled Sultan, Toronto (416) 594-7297Kevin Chiew, Toronto (416) 594-7457
52-week Fiscal Year EPS P/E Multiples Fiscal Year CFPS P/CF MultiplesStock Recommendation Symbol Company Curr.
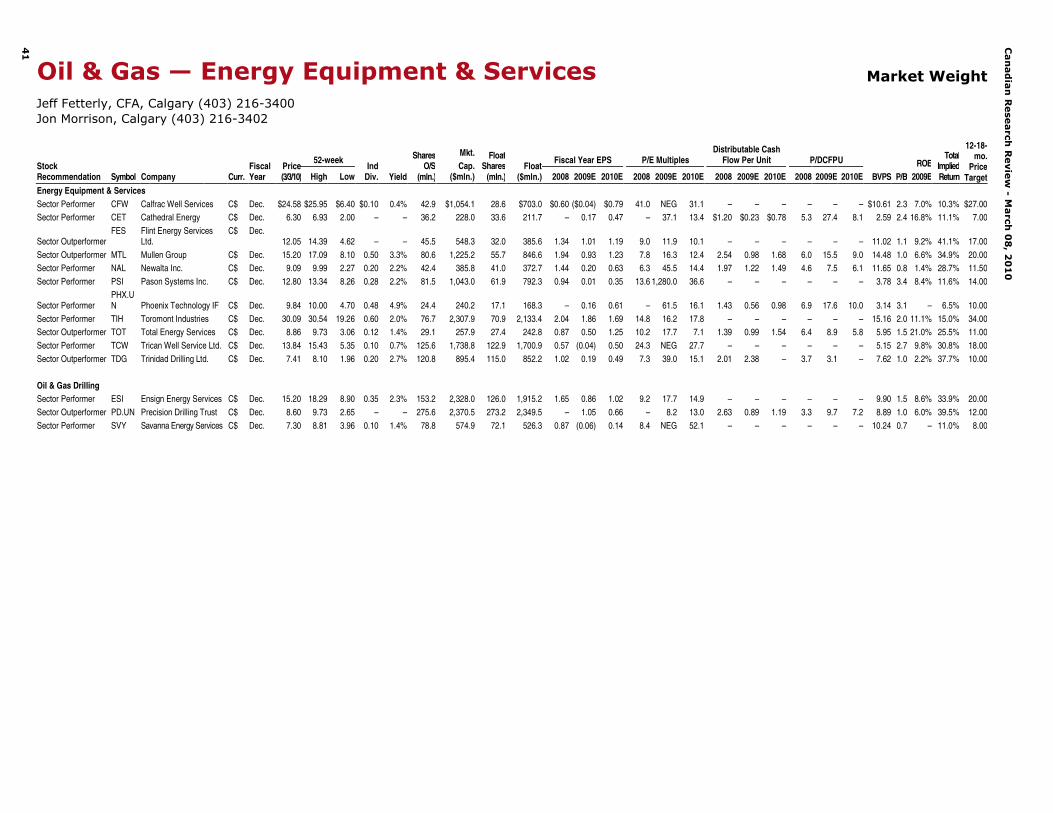
Oil & Gas — Energy Equipment & Services Market Weight
Jeff Fetterly, CFA, Calgary (403) 216-3400 Jon Morrison, Calgary (403) 216-3402
Initial Signs Of Momentum Set Stage For 2010 All figures in Canadian dollars, unless otherwise stated.
Our Stance On The Sector
Although 2009 proved to be one of the most challenging years on record for the oilfield services sector, we believe the industry showed initial signs of momentum in Q4/2009. Activity thus far in Q1/2010 has improved meaningfully year over year and we believe the improved winter drilling season sets the foundation for continued strengthening of activity levels in H2/2010.
Overall, we believe key resource plays will remain the drivers of North American activity, with the Montney, Horn River and Bakken plays figuring prominently in Western Canadian Sedimentary Basin (WCSB) activity. However, in our view, the recent emergence of brownfield development opportunities such as the Cardium and Viking light oil plays and the resource play potential provided by these and other emerging plays (Notikewin, Amaranth, etc.) also have the potential to meaningfully impact WCSB activity in 2010 and 2011. Given that these emerging opportunities are likely to be developed in a similar fashion to established resource plays (i.e., long-reach horizontal drilling, intensive fracturing, challenging logistics, etc.), we believe the greatest net benefit is likely to accrue to companies weighted toward directional drilling, deeper contract drilling, pressure pumping, rentals and transportation.
Although valuations for oilfield services equities have, for the most part, expanded to levels that we believe are appropriate for the initial stages of a recovery (i.e., early-cycle earnings), in our view the market continues to discount a more “normalized” operating environment for the sector. As a result, we believe that as investors begin to incorporate 2011 performance into their valuation, which we are forecasting to be a mid-cycle operating environment, we foresee further upside for services equities.
Our Top Picks
Overall, we believe investors should favor names: 1) with above-average exposure to key and emerging North American resource plays; 2) that maintain a strong balance sheet and will have the financial flexibility to expand and capitalize on selective growth opportunities in the coming quarters; and, 3) that trade at attractive valuations relative to their peer group. Our top picks are: Flint Energy Services, Mullen Group, Precision Drilling Trust, Total Energy Services and Trinidad Drilling.
Activity thus far in Q1/2010 has improved meaningfully Y/Y and we believe the improved winter drilling season sets the foundation for continued strengthening in H2/2010.
As investors begin to incorporate 2011 performance into their valuation, we foresee further upside for services equities.
Can
ad
ian
Rese
arch
Revie
w -
March
08
, 20
10
41
Oil & Gas — Energy Equipment & Services Market Weight
Jeff Fetterly, CFA, Calgary (403) 216-3400Jon Morrison, Calgary (403) 216-3402
52-week Fiscal Year EPS P/E MultiplesDistributable Cash
Flow Per Unit P/DCFPUStock Recommendation Symbol Company Curr.
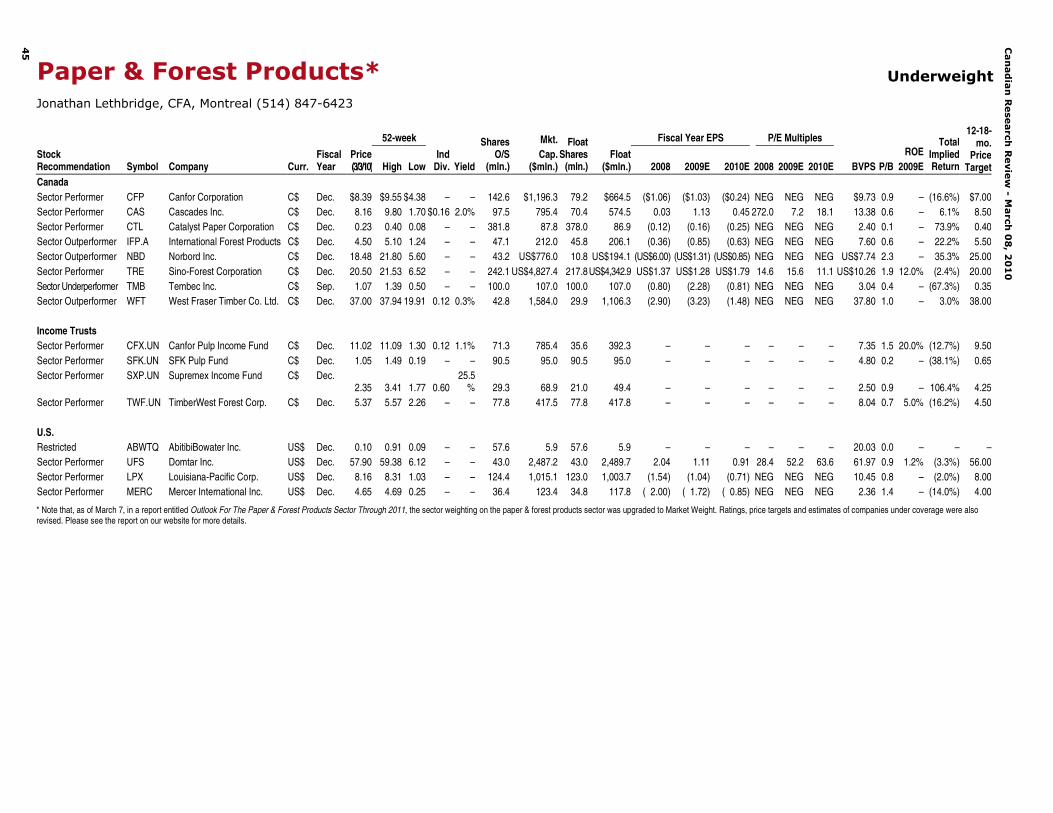
Strong Moves In Commodities Largely Reflected In Stock Prices All figures in Canadian dollars, unless otherwise stated.
Our Stance On The Sector
We rate the paper & forest products sector as Underweight for the following reasons:
• Although most paper and packaging prices are experiencing upward momentum as demand fundamentals improve, we expect cost-push pressure from rising fiber, energy and transportation costs to continue to partially offset profits accruing to producers. In addition, the Canadian dollar remains strong and continues to place significant pressure on the sector.
• Despite the recent rally, we think building materials prices will fall back to cash cost levels following the spring building season, given that the U.S. housing market remains very weak. While most solidwood companies have strong balance sheets, most of them are only just starting to turn a profit at the EBITDA level.
Pulp markets continue to rally, underpinned by strong demand from developing nations like China. Global statistics for January show demand is up 13% year over year and inventory levels continue to favor producers; however, those inventories are on the rise. We don’t think pulp prices can get much higher on a sustained basis, given that they are getting very expensive in U.S. dollar and euro terms.
Update On The Fundamentals North American markets for the major paper grades showed some signs of life in January, although we think the secular trend in demand is still negative. North American demand for uncoated woodfree paper (UWF) was up 5% year over year in January, while containerboard consumption declined by 4% over the same period. U.S. newsprint consumption remains the industry’s biggest problem child, with demand down 15% in January. We expect the secular rate of decline in demand for the main paper grades will likely ease somewhat as the economy recovers. However, offsetting this benefit is the likelihood that strong near-term commodity prices may delay the implementation of much-needed capacity closures. As demand for paper shrinks, the demand for market pulp within North America has remained under pressure. However, due to significant amounts of market-related downtime and strong buying from China, pulp producers have driven down inventories and put upward pressure on prices.
Building products prices have rebounded from the unsustainably low levels of 2009, although this has been due mainly to supply shortages and an inventory build rather than higher consumption. Overall, building products demand continues to suffer from historically low construction levels and we expect prices to remain subdued until there is a material improvement in U.S. housing starts.
Our Top Picks
On a relative basis, our top picks for the early stages of a recovery are International Forest Products and Norbord.
The North American market for the major paper grades showed some signs of life in January, but the secular trend is still negative.
* Note that, as of March 7, in a report entitled Outlook For The Paper & Forest Products Sector Through 2011, the sector weighting on the paper & forest products sector was upgraded to Market Weight. Ratings, price targets and estimates of companies under coverage were also revised. Please see the report on our website for more details.
Canadian Research Review - March 08, 2010
46
Pipelines, Utilities & Power Overweight
Petro Panarites, CFA, Toronto (416) 594-8249 Osvaldo Matias, CFA, Toronto (416) 956-6428 Alex Artamonov, CFA Toronto (416) 956-3826
Exceptional Long-term Value All figures in Canadian dollars, unless otherwise stated.
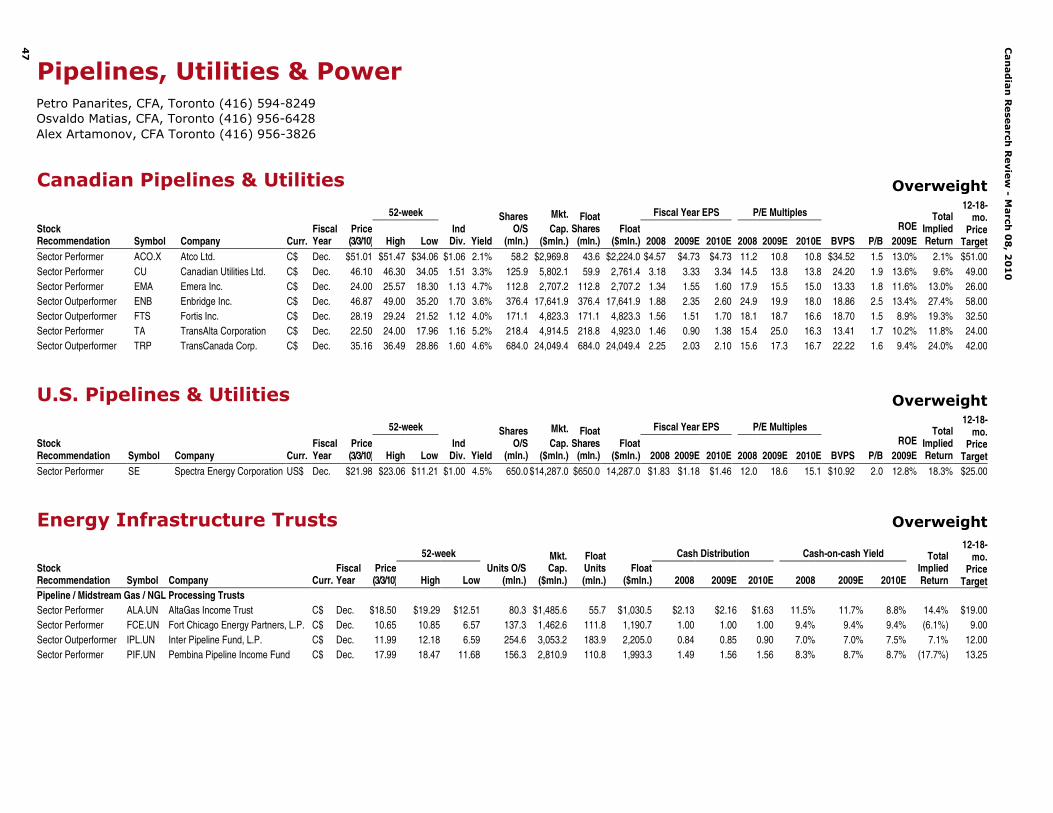
Our Stance On The Sector A-rated corporate bond spreads have stabilized at around 130 basis points (bps), very close to their historical average of 120 bps, and well off their credit crisis-induced peak of 500 bps. Meanwhile, Canadian money market holdings as a proportion of total Canadian mutual fund holdings have plunged from peak levels in early 2009. These metrics reflect a sharp return of liquidity and risk tolerance to the equity markets over the past year. Other measures, however, have remained considerably far from “normal.” Pipeline and utility dividend yield spreads to A-rated corporate bond yields remain stubbornly at historical highs, as capital inflows have bypassed more defensive sectors for higher-beta segments of the market. We continue to view this situation as an extraordinary opportunity from a longer-term standpoint. Pipeline and utility stocks offer a compelling risk/reward for investors concerned about the pace and extent of the recent recovery in more economically sensitive sectors of the market.
Update On The Fundamentals • Power Prices: Power prices in key North American markets rebounded in
the back half of 2009 and have remained stable through early 2010, but remain depressed compared with prior years. Coal-fired merchant exposure continues to feel the greatest pinch, while the impact on gas-fired generation has been partly mitigated by low gas prices. Companies with related exposure include TransAlta and, to a lesser extent, TransCanada, ATCO and Canadian Utilities.
• Frac Spreads: Higher oil prices along with weakness in gas prices resulted in a sharp rebound in frac spreads through 2009 and into the beginning of 2010. Inter Pipeline, Fort Chicago, and Spectra Energy are the companies within our universe that benefit the most from stronger frac spreads.
• Regulatory: Following the National Energy Board’s (NEB) decision to drop the generic ROE formula, positive related developments at the provincial level have also come to fruition in Alberta and B.C. Within our coverage universe, Fortis is expected to gain the most from these developments.
Our Top Picks • Enbridge remains a favorite with the strongest and most visible EPS
growth profile within our coverage universe.
• TransCanada likely offers among the best longer-term value and growth characteristics, although patience is required, as EPS growth in 2010 is expected to remain modest, but should pick up significantly in 2011.
• Fortis remains our top utilities pick, and a good defensive alternative given strong rate base growth and positive regulatory developments in Alberta and British Columbia that are expected to contribute to EPS growth over the investment horizon.
Defensive attributes and attractive valuations suggest a compelling opportunity.
Can
ad
ian
Rese
arch
Revie
w -
March
08
, 20
10
47
Pipelines, Utilities & PowerPetro Panarites, CFA, Toronto (416) 594-8249Osvaldo Matias, CFA, Toronto (416) 956-6428Alex Artamonov, CFA Toronto (416) 956-3826
Jacob Bout, CFA, Toronto (416) 956-6766 Kevin Chiang, Toronto (416) 594-7198 Shereen Zahawi, Toronto (416) 594-7289
Volumes Have Bottomed All figures in U.S. dollars, unless otherwise stated.
Our Stance On The Sector
As the transporter of all things commercial, residential and industrial, historically, the Canadian rails’ performance has mirrored economic conditions. However, given the sector-specific issues facing the trucking industry (highway congestion, higher fuel costs for trucks versus rails, and increased regulations), we expect the Canadian rails to capture a disproportionate amount of the freight volume growth (at the expense of trucks) over the longer term.
Update On The Fundamentals
Since freight volume is a derived demand, and a function of the overall health of the economy, the recent positive economic data seems to be contributing to the rebound of carload volumes. According to recently released AAR data, North American originating carloads are showing an upward trend. Canadian National (CN) and Canadian Pacific (CP) volumes have increased 11.7% and 4.5%, respectively, year over year through Week 7. To date, the North American Class 1 volumes of commodity groups have been mixed, with strong increases in automotives and metals and minerals volumes partially offset by steep declines in U.S. thermal coal and building materials volumes.
Intermodal traffic received a lift last quarter mainly due to inventory restocking by retailers, which boosted shipments in North America, according to the Intermodal Association of North America. The association noted that this was the first year-over-year increase in domestic intermodal traffic in more than a year as shippers rebuilt depleted stocks. North American domestic intermodal shipments rose by 0.8% versus Q4/2008 to 1.484 million loads. Expectations are for overall intermodal growth in 2010 of 1.5%–2.5% year over year.
The U.S. rail regulatory bill has passed the Senate Commerce, Science and Transportation Committee and now moves to Congress for debate, which could take most of 2010. Railroads and some lawmakers are already speaking against the proposed bill, stating that it goes too far to please shippers and is unbalanced. The bill is expected to increase the regulatory power of the Surface Transportation Board and introduce more shipper-friendly clauses.
We remain proponents of the long-term fundamentals of the rail industry. We expect the Canadian rails to outperform their U.S. peers given: 1) higher exposure to commodities; 2) less exposure to thermal coal, which is expected to represent a major headwind for the U.S. rails and is its largest bulk commodity; and, 3) less risk exposure to the proposed U.S. rail bill. As long as pricing holds, the rails should be a relatively defensive sector. Our top pick is CN given: 1) its proven track record and expectations that the EJ&E acquisition and improvements at Harrison Yard will drive further cost cutting; 2) its greater leverage to a recovering economy; and, 3) its more attractive valuation.
Year to date (to Week 7), North American Class 1 originating carloads were up 2.3% year over year.
Intermodal traffic gets a boost in last quarter.
U.S. rail bill headed for Congress.
CN is our top pick.
Can
ad
ian
Rese
arch
Revie
w -
March
08
, 20
10
49
Railroads Market Weight
Jacob Bout, CFA, Toronto (416) 956-6766Kevin Chiang, Toronto (416) 594-7198Shereen Zahawi, Toronto (416) 594-7289
Rossa O’Reilly, CFA, Toronto (416) 594-7296 Alex Avery, CFA, Toronto (416) 594-8179 Brad Sturges, CFA, Toronto (416) 594-7399 Troy MacLean, Toronto (416) 956-3643
Mortgage Rates Ease, Industrial Vacancies Decline, Housing Resales Rise All figures in Canadian dollars, unless otherwise stated.
Our Stance On The Sector Canadian REITs have returned +2% in 2010 year to date versus +0% for both the S&P/TSX Composite Index and the Bloomberg U.S. REIT Index. Canadian REITs (excluding the cyclical hotel sector) are trading at a modest 9.7x 2010E FFO and are yielding close to 8% on average. REITs’ prices are 8% above estimated net asset values (NAVs) on average, but if cap rates decline by 50 basis points (bps) in 2010 (as we believe is feasible), REITs’ NAVs would increase by 16% on average. We expect total returns averaging 15% and we recommend overweighting the sector.
Update On The Fundamentals
On average, we expect FFO for Canadian REITs (ex-hotels) to decline a modest 1% in 2009 and to rise 2% in 2010. Commercial mortgage rates have declined 20 bps–50 bps in the past two months and are currently 4.6%–5.0% for five-year terms, availability is good (although lenders remain selective on quality and size of loan), and more REITs have raised equity capital, enhancing their financial flexibility. REITs with newly raised capital are making acquisitions and cap rates are declining, with positive implications for REITs’ NAVs. MLS housing resales were very strong again in January: +89.3% in dollar volume with unit volume up 58.3% and average price up 19.6%, providing continuing support to consumer confidence and retailing prospects. Shopping center REITs are benefitting from the inherent strengths of their property asset classes, which have sustained them through past economic recessions with relative stability. Canadian shopping center REITs’ high degree of concentration in unenclosed and community power centers affords them significant protection since these centers tend to sell basic necessities (groceries, hardware, fast food, discount items) and collect contractual fixed rents rather than rents based on tenant sales.
Canadian office vacancies at 8.5% are, on average, at levels that still reflect near balance between supply and demand, while industrial vacancies have declined by 0.2% to 6.8% in the past quarter, the first decline since 2005. Commercial property REITs have rental rates embedded in leases written five to 10 years ago that are on average below current market rents. Under these circumstances, erosion in market rents for office and industrial space should not preclude stable to positive rental rate adjustments on lease turnovers/rollovers. However, hotel REITs are more vulnerable and their RevPAR (–12.4% in 2009) and FFO trends have continued to decline in 2009 and 2010 and to date. Hotels continue to suffer from recessionary pressures, transborder travel complexities and a high Canadian dollar.
Our Top Picks
Among REITs/REOCs we regard as particularly attractive at current levels are the large-cap, blue-chip issues Calloway, H&R and thinly traded BPO Properties and among the medium- and smaller-cap issuers Allied Properties, and Crombie.
REITs offer high sustainable yields averaging close to 8%.
On average, REITs (ex-hotels) are trading at only 9.7x 2010E FFO, are experiencing stable FFO trends, and should see growth in NAVs in 2010.
Can
ad
ian
Rese
arch
Revie
w -
March
08
, 20
10
51 Real Estate
Rossa O’Reilly, CFA, Toronto (416) 594-7296 Alex Avery, CFA, Toronto (416) 594-8179Brad Sturges, CFA, Toronto (416) 594-7399 Troy MacLean, CFA, Toronto (416) 956-3643
Income Property Companies Overweight52-week FFO P/FFO
Paul Lechem, Toronto (416) 956-6429 Stephanie Price, Toronto (416) 594-7047
Who Would Have Thought Software Companies Would Become “Defensive”? All figures in Canadian dollars, unless otherwise stated.
Our Stance On The Sector
The heady days of “dot.com” mania with excessive valuations and unworkable business plans are long gone. The software sector has returned to fundamentals, with almost all public companies generating profits (some very significantly), even those in earlier-stage growth mode. Furthermore, with highly stable customer bases generating roughly half of revenues for more mature companies, the software sector has become, dare we say it, stable and predictable.
The age of “growth at any cost” has been replaced with disciplined management and control over expenses and investments. Sector consolidation still plays a strong role, with tuck-in acquisitions proving to be highly accretive for those companies with an established infrastructure. All these qualities suggest that the software sector has become a “defensible” one for investors – and, we believe, a sector that presents several appealing investment opportunities, especially as we do not believe valuations are accurately reflecting the sector’s solid growth/low risk profile.
Update On The Fundamentals Many of the remaining independent software vendors have built healthy, profitable businesses underpinned by a large base of recurring revenues. As such, it appears that software spending is less volatile than expected, with software vendors already highly focused on delivering solutions that improve productivity and deliver proven returns on investment.
Nevertheless, given the economic slowdown, we remain cautious on organic license growth, and expect software companies to focus on maintaining profitability and use excess cash for accretive acquisitions. Organic license growth could remain modestly negative into 2010. In addition, given the economic climate for 2009 it is unclear the extent of the typical year-end (Q4) IT “budget flush.”
Our Top Picks We suggest that investors focus on the most financially viable, profitable software vendors. Organic growth is likely to remain under pressure into 2010. We, therefore, continue to prefer vendors that are using excess cash to pursue tuck-in acquisitions, especially those that can realize significant cost synergies. Such vendors include Constellation Software, Descartes and Open Text.
The software sector has returned to fundamentals, with almost all public companies generating profits (some very significantly), even those in earlier-stage growth mode.
The age of “growth at any cost” has been replaced with disciplined management and control over expenses and investments.
Can
ad
ian
Rese
arch
Revie
w -
March
08
, 20
10
55
Technology — SoftwarePaul Lechem, Toronto (416) 956-6429Stephanie Price, CFA, Toronto (416) 594-7047
Canadian Enterprise Software Market Weight
52-week Fiscal Year EPS P/E MultiplesStock Recommendation Symbol Company Curr.
HardwareSector Outperformer CDV COM DEV International Ltd. C$ Oct. $3.35 $4.15 $2.52 73.6 $246.4 73.4 $245.9 $0.18 $0.21 $0.28 18.6 16.0 12.0 $2.14 1.6 11.9% 49.3% $5.00
Canadian Research Review - March 08, 2010
56
Telecom & Cable Services Market Weight
Bob Bek, CFA, Toronto (416) 594-7454 Michael C. Lee, Toronto (416) 594-7907
Modest Q4 Across Industry; Cautious 2010 Guidance Could Lead To Positive Surprises All figures in Canadian dollars, unless otherwise stated.
Our Stance On The Sector
The Canadian telecom industry has reported modest results in recent quarters, and Q4 is largely continuing this trend. While financial and operating results largely met expectations – and in some cases (e.g., TELUS, MTS) previously reduced guidance – it was clear that Q4 continued to be weighed down by the lingering effects of economic events and pricing pressure on wireless. Still, the results overall were somewhat encouraging as the results confirmed that the industry has now stabilized after a difficult 2008/2009.
As evidenced in Q4, asset mix still matters when investing in the telecom sector. Those companies with more favorable exposure to cable (Shaw, Cogeco Cable, Rogers) and wireless (Rogers, BCE) continue to outperform those with exposure to wireline (MTS, Bell Aliant), showing more robust operational and cash flow growth. In fact, one of the key takeaways from the quarter continued to be the decline of residential wireline, as line losses remained elevated across all the incumbents, pressured by cable telephony competition and growing wireless substitution at the margin.
The industry on the whole has provided preliminary 2010 guidance that could aptly be characterized conservative (e.g., Rogers, MTS). The guidance range is also fairly wide at most places, likely due to the prevailing economic uncertainty and competitive pressures. Still with the bar being set very low and the macro backdrop improving, we could see some positive surprises in the coming year.
Update On The Fundamentals
While the challenging operating environment has created near-term risks and uncertainty within the industry (with the weak economy, reduced consumer sentiment, and AWS entrant risks), the long-term fundamentals remain solid, in our opinion. Despite a major shift in consumer-spending habits, digital TV, home Internet and wireless have emerged as the “new utilities,” considered to be essential services to consumers. Although service downsizing and take-up of new services like wireless data remain short-term concerns, the long-term resiliency and fundamental aspects of the industry are intact. Given our bullish thesis on the space, we believe that current valuations are not adequately reflecting the long-term growth potential in the industry, particularly for wireless.
Our Top Pick Shaw Communications remains our top pick in the sector, and continues to leverage its cable network in Western Canada to drive stable EBITDA growth and strong EBITDA margins – among the highest in North America. Subscriber growth in all key services remains solid, even with robust penetration. Given Shaw’s strong fundamental position and shareholder-friendly policies, we believe the stock remains a solid buy-and-hold story for long-term investors looking for a low-risk investment vehicle in the Canadian cable space.
Results have stabilized, but Canadian telcos issue cautious guidance for 2010.
Wireless is still the place to be, especially if the economy recovers into 2010.
Shaw is our top pick, and remains a strong buy-and-hold story.
Can
ad
ian
Rese
arch
Revie
w -
March
08
, 20
10
57
Telecommunications & Cable Services Market Weight
Robert Bek, CFA, Toronto (416) 594-7454Michael C. Lee, Toronto (416) 594-7907
52-week Fiscal Year EPS P/E MultiplesStock Recommendation Symbol Company Curr.
Analyst Certification: Each CIBC World Markets research analyst named on the front page of this research report, or at the beginning of any subsection hereof, hereby certifies that (i) the recommendations and opinions expressed herein accurately reflect such research analyst's personal views about the company and securities that are the subject of this report and all other companies and securities mentioned in this report that are covered by such research analyst and (ii) no part of the research analyst's compensation was, is, or will be, directly or indirectly, related to the specific recommendations or views expressed by such research analyst in this report.
Potential Conflicts of Interest: Equity research analysts employed by CIBC World Markets are compensated from revenues generated by various CIBC World Markets businesses, including the CIBC World Markets Investment Banking Department. Research analysts do not receive compensation based upon revenues from specific investment banking transactions. CIBC World Markets generally prohibits any research analyst and any member of his or her household from executing trades in the securities of a company that such research analyst covers. Additionally, CIBC World Markets generally prohibits any research analyst from serving as an officer, director or advisory board member of a company that such analyst covers.
In addition to 1% ownership positions in covered companies that are required to be specifically disclosed in this report, CIBC World Markets may have a long position of less than 1% or a short position or deal as principal in the securities discussed herein, related securities or in options, futures or other derivative instruments based thereon.
Recipients of this report are advised that any or all of the foregoing arrangements, as well as more specific disclosures set forth below, may at times give rise to potential conflicts of interest.
Canadian Research Review - March 08, 2010
59
Important Disclosure Footnotes for Companies Mentioned in this Report that Are Covered by CIBC World Markets Inc.:
Stock Prices as of 03/08/2010: 5N Plus, Incorporated (2g) (VNP-TSX, C$5.29, Sector Outperformer)
AbitibiBowater Inc. (2a, 2e, 2g, 7) (ABWTQ-OTC, US$0.10, Restricted) Aecon Group Inc. (2a, 2c, 2e, 2g) (ARE-TSX, C$13.48, Sector Outperformer)
Ag Growth International Inc. (2a, 2c, 2e, 2g, 7) (AFN-TSX, C$37.17, Sector Outperformer) AGF Management Limited (2g, 13) (AGF.B-TSX, C$16.97, Sector Outperformer)
Angle Energy Inc. (2a, 2c, 2e, 2g) (NGL-TSX, C$8.16, Sector Outperformer) Armtec Infrastructure Income Fund (2g) (ARF.UN-TSX, C$25.20, Sector Outperformer)
Artis Real Estate Investment Trust (2a, 2c, 2e, 2g) (AX.UN-TSX, C$11.36, Restricted) Astral Media Inc. (2g, 7, 12, 13) (ACM.A-TSX, C$34.92, Sector Outperformer)
Atco Ltd. (7, 13) (ACO.X-TSX, C$51.29, Sector Performer) ATS Automation Tooling Systems Inc. (2g) (ATA-TSX, C$6.93, Sector Performer)
Canadian Utilities Ltd. (7, 13) (CU-TSX, C$46.58, Sector Performer) Canexus Income Fund (2a, 2c, 2e, 2g) (CUS.UN-TSX, C$5.95, Sector Performer)
Canfor Corporation (2g) (CFP-TSX, C$8.60, Sector Performer) Canfor Pulp Income Fund (2g) (CFX.UN-TSX, C$12.33, Sector Outperformer)
Canadian Research Review - March 08, 2010
60
Important Disclosure Footnotes for Companies Mentioned in this Report that Are Covered by CIBC World Markets Inc.: (Continued) Stock Prices as of 03/08/2010: Capstone Mining Corporation (CS-TSX, C$2.89, Sector Outperformer) Cascades Inc. (2a, 2b, 2c, 2e, 2g, 4a, 4b) (CAS-TSX, C$8.20, Sector Performer)
Flextronics International Ltd. (6a) (FLEX-NASDAQ, US$7.28, Sector Performer)
Canadian Research Review - March 08, 2010
61
Important Disclosure Footnotes for Companies Mentioned in this Report that Are Covered by CIBC World Markets Inc.: (Continued) Stock Prices as of 03/08/2010: Flint Energy Services Ltd. (2g) (FES-TSX, C$12.06, Sector Outperformer) FNX Mining Company Inc. (2g) (FNX-TSX, C$15.09, Sector Outperformer)
Foraco International SA (3a, 3c) (FAR-TSX, C$2.71, Sector Performer) Fort Chicago Energy Partners, L.P. (2a, 2c, 2e, 2g, C96) (FCE.UN-TSX, C$10.36, Sector Performer)
Jean Coutu Group (PJC) Inc. (2g, 7, 12) (PJC.A-TSX, C$9.75, Sector Outperformer) Just Energy Income Fund (2a, 2e, 2g, 3a) (JE.UN-TSX, C$14.14, Sector Outperformer)
MacDonald, Dettwiler and Associates Ltd. (2g) (MDA-TSX, C$42.31, Sector Performer) Magna International Inc. (2g, 7, 12) (MGA-NYSE, US$58.49, Sector Outperformer)
Major Drilling Group International Inc. (MDI-TSX, C$28.48, Sector Performer)
Canadian Research Review - March 08, 2010
62
Important Disclosure Footnotes for Companies Mentioned in this Report that Are Covered by CIBC World Markets Inc.: (Continued) Stock Prices as of 03/08/2010: Manitoba Telecom Services Inc. (2a, 2c, 2e, 2g, 7) (MBT-TSX, C$32.35, Sector Performer) March Networks Corp. (2g) (MN-TSX, C$3.88, Sector Outperformer)
Martinrea International Inc. (2g) (MRE-TSX, C$8.63, Sector Outperformer) Melco China Resorts (2g, 7) (MCG-V, C$0.37, Sector Performer - Speculative)
Mercator Minerals Ltd. (2g) (ML-TSX, C$2.89, Sector Outperformer) Mercer International Inc. (2a, 2e, 2g) (MERC-NASDAQ, US$5.11, Sector Outperformer)
Methanex Corporation (2g, 3a) (MEOH-NASDAQ, US$25.63, Sector Outperformer) Metro Inc. (2g, 7, 12) (MRU.A-TSX, C$42.33, Sector Outperformer)
Important Disclosure Footnotes for Companies Mentioned in this Report that Are Covered by CIBC World Markets Inc.: (Continued) Stock Prices as of 03/08/2010: Rogers Communications Inc. (2a, 2c, 2e, 2g, 3a, 3c, 7, 13) (RCI.B-TSX, C$34.27, Sector Outperformer) RONA Inc. (2a, 2c, 2e, 2g, 7) (RON-TSX, C$15.34, Sector Performer)
Royal Gold, Inc. (2g) (RGLD-NASDAQ, US$46.59, Sector Performer) Royal Host REIT (2g) (RYL.UN-TSX, C$2.78, Sector Underperformer)
RuggedCom Inc. (2g, 7) (RCM-TSX, C$20.71, Sector Outperformer) Russel Metals Inc. (2g, 7) (RUS-TSX, C$18.99, Sector Underperformer)
Transcontinental Inc. (2a, 2c, 2e, 2g, 12) (TCL.A-TSX, C$13.17, Restricted) Trican Well Service Ltd. (2g) (TCW-TSX, C$14.97, Sector Performer)
Trinidad Drilling Ltd. (2a, 2c, 2e, 2g) (TDG-TSX, C$7.75, Sector Outperformer) TVA Group Inc. (2g, 13) (TVA.B-TSX, C$13.29, Sector Performer)
Uranium Energy Corp. (2g) (UEC-AMEX, US$3.65, Sector Outperformer)
Canadian Research Review - March 08, 2010
64
Important Disclosure Footnotes for Companies Mentioned in this Report that Are Covered by CIBC World Markets Inc.: (Continued) Stock Prices as of 03/08/2010: Uranium One Inc. (2g) (UUU-TSX, C$2.92, Restricted) Vecima Networks (2g, 3a) (VCM-TSX, C$6.88, Sector Outperformer)
Vicwest Income Fund (2g, 7) (VIC.UN-TSX, C$17.90, Sector Performer) Viterra Inc. (2a, 2e, 2g) (VT-TSX, C$10.10, Sector Performer)
West Fraser Timber Co. Ltd. (2g) (WFT-TSX, C$37.20, Sector Outperformer) Westport Innovations Inc. (2g) (WPT-TSX, C$14.67, Sector Performer)
Westshore Terminals Income Fund (2g, 7) (WTE.UN-TSX, C$15.98, Sector Performer) Whiterock Real Estate Investment Trust (2a, 2c, 2e, 2g) (WRK.UN-TSX, C$14.79, Sector Outperformer - Speculative)
Yellow Pages Income Fund (2a, 2c, 2e, 2g, 7) (YLO.UN-TSX, C$6.15, Sector Outperformer)
Companies Mentioned in this Report that Are Not Covered by CIBC World Markets Inc.: Stock Prices as of 03/08/2010: Arsenal Energy Inc. (AEI-TSX, C$0.90, Not Rated) Augusta Resource Corporation (AZC-TSX, C$2.73, Not Rated)
AVANTI MINING INC (AVT-V, C$0.20, Not Rated) Black Diamond Group Limited (BDI-TSX, C$19.89, Not Rated)
Boston Pizza Royalties Income Fund (BPF.UN-TSX, C$11.91, Not Rated) DeeThree Exploration Inc. (DTX-V, C$2.35, Not Rated)
Dundee Precious Metals Inc. (DPM-TSX, C$3.30, Not Rated) Eaglewood Energy Inc. (EWD-V, C$1.73, Not Rated)
Fairfax Financial Holdings (FFH-TSX, C$371.24, Not Rated) Ford Motor Company (F-NYSE, US$13.00, Not Rated)
Gleichen Resources Ltd. (GRL-TSX, C$1.01, Not Rated) Great-West Lifeco Inc. (GWO-TSX, C$26.87, Not Rated)
Industrial Alliance Insurance And Financial Services Inc. (IAG-TSX, C$33.82, Not Rated) ISE Limited (ISE-TSX, C$5.70, Not Rated)
Labopharm Inc. (DDS-TSX, C$1.53, Not Rated) MagIndustries Corp. (MAA-TSX, C$0.44, Not Rated)
MINT Income Fund (MID.UN-TSX, C$9.49, Not Rated) Monterey Exploration Ltd. (MXL-TSX, C$4.49, Not Rated)
NuLoch Resources Inc. (NLR.A-V, C$1.59, Not Rated) OceanaGold Corporation (OGC-TSX, C$2.40, Not Rated)
Progress Energy Resources Corp. (PRQ-TSX, C$12.68, Not Rated) Pure Industrial Real Estate Trust (AAR.UN-V, C$3.45, Not Rated)
Pure Technologies Ltd. (PUR-V, C$4.30, Not Rated) Rainy River Resources Ltd. (RR-TSX, C$5.15, Not Rated)
Seabridge Gold Inc. (SEA-TSX, C$23.56, Not Rated) Sprott Physical Gold Trust (PHY.UN-TSX, C$10.05, Not Rated)
Stella-Jones Inc. (SJ-TSX, C$26.55, Not Rated) Stornoway Diamond Corporation (SWY-TSX, C$0.50, Not Rated)
Timbercreek Mortgage Investment Corp. (TMC-TSX, C$10.19, Not Rated) Toyota Motor Corp. (TM-NYSE, US$76.94, Not Rated)
Canadian Research Review - March 08, 2010
65
Companies Mentioned in this Report that Are Not Covered by CIBC World Markets Inc.: (Continued) Stock Prices as of 03/08/2010: Triton Energy Corporation (TEZ-V, C$0.22, Not Rated) TSO3 (TOS-TSX, C$1.59, Not Rated)
Western Energy Services Corp. (WRG-V, C$0.39, Not Rated) WesternOne Equity Income Fund (WEQ.UN-TSX, C$4.35, Not Rated)
Important disclosure footnotes that correspond to the footnotes in this table may be found in the "Key to Important Disclosure Footnotes" section of this report.
Canadian Research Review - March 08, 2010
66
Key to Important Disclosure Footnotes: 1 CIBC World Markets Corp. makes a market in the securities of this company. 2a This company is a client for which a CIBC World Markets company has performed investment banking services
in the past 12 months. 2b CIBC World Markets Corp. has managed or co-managed a public offering of securities for this company in the
past 12 months. 2c CIBC World Markets Inc. has managed or co-managed a public offering of securities for this company in the
past 12 months. 2d CIBC World Markets Corp. has received compensation for investment banking services from this company in
the past 12 months. 2e CIBC World Markets Inc. has received compensation for investment banking services from this company in the
past 12 months. 2f CIBC World Markets Corp. expects to receive or intends to seek compensation for investment banking services
from this company in the next 3 months. 2g CIBC World Markets Inc. expects to receive or intends to seek compensation for investment banking services
from this company in the next 3 months. 3a This company is a client for which a CIBC World Markets company has performed non-investment banking,
securities-related services in the past 12 months. 3b CIBC World Markets Corp. has received compensation for non-investment banking, securities-related services
from this company in the past 12 months. 3c CIBC World Markets Inc. has received compensation for non-investment banking, securities-related services
from this company in the past 12 months. 4a This company is a client for which a CIBC World Markets company has performed non-investment banking,
non-securities-related services in the past 12 months. 4b CIBC World Markets Corp. has received compensation for non-investment banking, non-securities-related
services from this company in the past 12 months. 4c CIBC World Markets Inc. has received compensation for non-investment banking, non-securities-related
services from this company in the past 12 months. 5a The CIBC World Markets Corp. analyst(s) who covers this company also has a long position in its common
equity securities. 5b A member of the household of a CIBC World Markets Corp. research analyst who covers this company has a
long position in the common equity securities of this company. 6a The CIBC World Markets Inc. fundamental analyst(s) who covers this company also has a long position in its
common equity securities. 6b A member of the household of a CIBC World Markets Inc. fundamental research analyst who covers this
company has a long position in the common equity securities of this company. 7 CIBC World Markets Corp., CIBC World Markets Inc., and their affiliates, in the aggregate, beneficially own 1%
or more of a class of equity securities issued by this company. 8 A partner, director or officer of CIBC World Markets Inc. or any analyst involved in the preparation of this
research report has provided services to this company for remuneration in the past 12 months. 9 A senior executive member or director of Canadian Imperial Bank of Commerce ("CIBC"), the parent company
to CIBC World Markets Inc. and CIBC World Markets Corp., or a member of his/her household is an officer, director or advisory board member of this company or one of its subsidiaries.
10 Canadian Imperial Bank of Commerce ("CIBC"), the parent company to CIBC World Markets Inc. and CIBC World Markets Corp., has a significant credit relationship with this company.
11 The equity securities of this company are restricted voting shares. 12 The equity securities of this company are subordinate voting shares.
13 The equity securities of this company are non-voting shares. 14 The equity securities of this company are limited voting shares.
C94 CIBC World Markets Inc. is acting as financial advisor to Descartes Systems Group in its proposed acquisition of Zemblaz NV (formerly Porthus NV).
C96 CIBC acted as advisor to Fort Chicago in the acquisition of Glen Park (Hydro Park).
Canadian Research Review - March 08, 2010
67
CIBC World Markets Inc. Price Chart
For price and performance information charts required under NYSE and NASD rules, please visit CIBC on the web at http://apps.cibcwm.com/sec2711 or write to CIBC World Markets Inc., Brookfield Place, 161 Bay Street, 4th Floor, Toronto, Ontario M5J 2S8, Attn: Research Disclosure Chart Request.
CIBC World Markets Inc. Stock Rating System
Abbreviation Rating Description
Stock Ratings
SO Sector Outperformer Stock is expected to outperform the sector during the next 12-18 months.
SP Sector Performer Stock is expected to perform in line with the sector during the next 12-18 months.
SU Sector Underperformer Stock is expected to underperform the sector during the next 12-18 months.
NR Not Rated CIBC World Markets does not maintain an investment recommendation on the stock.
R Restricted CIBC World Markets is restricted*** from rating the stock.
Sector Weightings**
O Overweight Sector is expected to outperform the broader market averages.
M Market Weight Sector is expected to equal the performance of the broader market averages.
U Underweight Sector is expected to underperform the broader market averages.
NA None Sector rating is not applicable.
**Broader market averages refer to the S&P 500 in the U.S. and the S&P/TSX Composite in Canada. "Speculative" indicates that an investment in this security involves a high amount of risk due to volatility and/or liquidity issues. ***Restricted due to a potential conflict of interest.
Ratings Distribution*: CIBC World Markets Inc. Coverage Universe
(as of 08 Mar 2010) Count Percent Inv. Banking Relationships Count Percent
Monthly Canadian Common Stock Universe Sector includes the following tickers: (none).
*Although the investment recommendations within the three-tiered, relative stock rating system utilized by CIBC World Markets Inc. do not correlate to buy, hold and sell recommendations, for the purposes of complying with NYSE and NASD rules, CIBC World Markets Inc. has assigned buy ratings to securities rated Sector Outperformer, hold ratings to securities rated Sector Performer, and sell ratings to securities rated Sector Underperformer without taking into consideration the analyst's sector weighting.
Important disclosures required by IIROC Rule 3400, including potential conflicts of interest information, our system for rating investment opportunities and our dissemination policy can be obtained by visiting CIBC World Markets on the web at http://researchcentral.cibcwm.com under 'Quick Links' or by writing to CIBC World Markets Inc., Brookfield Place, 161 Bay Street, 4th Floor, Toronto, Ontario M5J 2S8, Attention: Research Disclosures Request.
This report is issued and approved for distribution by (i) in Canada, CIBC World Markets Inc., a member of the Investment Industry Regulatory Organization of Canada (“IIROC”), the Toronto Stock Exchange, the TSX Venture Exchange and CIPF, (ii) in the United Kingdom, CIBC World Markets plc, which is regulated by the Financial Services Authority ("FSA"), and (iii) in Australia, CIBC Australia Limited, a member of the Australian Stock Exchange and regulated by the ASIC (collectively, "CIBC World Markets"). This report is distributed in the United States by CIBC World Markets Inc. and has not been reviewed or approved by CIBC World Markets Corp., a member of FINRA. This report is intended for distribution in the United States only to Major Institutional Investors (as such term is defined in SEC 15a-6 and Section 15 of the Securities Exchange Act of 1934, as amended) and is not intended for the use of any person or entity that is not a major institutional investor. Major Institutional Investors receiving this report should effect transactions in securities discussed in the report through CIBC World Markets Corp. This report is provided, for informational purposes only, to institutional investor and retail clients of CIBC World Markets in Canada, and does not constitute an offer or solicitation to buy or sell any securities discussed herein in any jurisdiction where such offer or solicitation would be prohibited. This document and any of the products and information contained herein are not intended for the use of private investors in the United Kingdom. Such investors will not be able to enter into agreements or purchase products mentioned herein from CIBC World Markets plc. The comments and views expressed in this document are meant for the general interests of wholesale clients of CIBC Australia Limited.
The securities mentioned in this report may not be suitable for all types of investors. This report does not take into account the investment objectives, financial situation or specific needs of any particular client of CIBC World Markets. Recipients should consider this report as only a single factor in making an investment decision and should not rely solely on investment recommendations contained herein, if any, as a substitution for the exercise of independent judgment of the merits and risks of investments. The analyst writing the report is not a person or company with actual, implied or apparent authority to act on behalf of any issuer mentioned in the report. Before making an investment decision with respect to any security recommended in this report, the recipient should consider whether such recommendation is appropriate given the recipient's particular investment needs, objectives and financial circumstances. CIBC World Markets suggests that, prior to acting on any of the recommendations herein, Canadian retail clients of CIBC World Markets contact one of our client advisers in your jurisdiction to discuss your particular circumstances. Non-client recipients of this report who are not institutional investor clients of CIBC World Markets should consult with an independent financial advisor prior to making any investment decision based on this report or for any necessary explanation of its contents. CIBC World Markets will not treat non-client recipients as its clients by virtue of their receiving this report. Past performance is not a guarantee of future results, and no representation or warranty, express or implied, is made regarding future performance of any security mentioned in this report. The price of the securities mentioned in this report and the income they produce may fluctuate and/or be adversely affected by exchange rates, and investors may realize losses on investments in such securities, including the loss of investment principal. CIBC World Markets accepts no liability for any loss arising from the use of information contained in this report, except to the extent that liability may arise under specific statutes or regulations applicable to CIBC World Markets.