INSTITUTIONAL OWNERSHIP AND LONG-TERM INVESTMENTS ACROSS THE CORPORATE LIFE CYCLE By Bryant William Demeré A DISSERTATION Submitted to Michigan State University in partial fulfillment of the requirements for the degree of Business Administration—Doctor of Philosophy 2017
Transcript
INSTITUTIONAL OWNERSHIP AND LONG-TERM INVESTMENTS
ACROSS THE CORPORATE LIFE CYCLE
By
Bryant William Demeré
A DISSERTATION
Submitted to
Michigan State University
in partial fulfillment of the requirements
for the degree of
Business Administration—Doctor of Philosophy
2017
ABSTRACT
INSTITUTIONAL OWNERSHIP AND LONG-TERM INVESTMENTS
ACROSS THE CORPORATE LIFE CYCLE
By
Bryant William Demeré
Motivated by concerns about managerial myopia, I examine how the effects of
institutional ownership on firms’ long-term investments vary across life cycle stages. I find that
the effects of institutional ownership on long-term investments in both capital and research and
development (R&D) are more positive in transitory life cycle stages relative to sustainable life
cycle stages. These results indicate that life cycle patterns explain important variation in the
relation between institutional ownership and long-term investments and highlight the importance
of firms’ life cycles in measuring governance effects. I also find that having a large number of
institutional owners with relatively small ownership stakes has a more positive effect than having
a smaller number of institutional owners with relatively large ownership stakes. Using the
discontinuity between the Russell 1000 and 2000 indexes as an identification strategy, I also
provide evidence in support of a causal effect of institutional ownership on firms’ long-term
investments. Additional tests indicate my results are not driven by firms that are more likely to
over-invest.
iii
ACKNOWLEDGMENTS
I am deeply grateful to my dissertation chair, Karen Sedatole, who has been a truly
exceptional advisor. By having faith in me, providing guidance and direction, and promoting
good academic discussion, I developed into a stronger and more passionate researcher. She gave
me opportunities to learn and provided insights that made my academic journey far more fruitful
than it otherwise would have been. I appreciate her support, guidance, and encouragement, and
know that she has been instrumental in the completion of my degree and my success.
My other committee members also graciously provided feedback and supported me
through the dissertation process. Ryan Bowles helped me to re-think what I thought I knew about
measurement. His methodological insights also improved my dissertation analysis. Charlie
Hadlock provided great insight and expertise from a finance perspective, and my dissertation was
made much stronger by his suggestions. Ranjani Krishnan provided much encouragement and a
positive outlook that proved to be helpful at many points throughout my PhD program.
It is a great benefit to have pursued a PhD concurrently with my brother, Paul Demeré.
He exhibited a passion for research, for being knowledgeable about prior research, and for
developing strong analytical skills. Sharing research ideas, providing comments to each other,
and understanding the challenges that each other faced made this process more manageable and
enjoyable. I see great things in his future as an accounting professor and am proud to be entering
this profession together.
My grandfather, Larry Killough, was very influential in my decision to pursue a PhD in
accounting. It was an honor to have been his student for two classes, to have spent time with him
while working on my bachelor’s and master’s degrees, and to have worked with him as faculty at
Virginia Tech. He never pushed me toward accounting or becoming a professor, but through his
iv
passion, his lifestyle, and the visible impact he had on students, he had a strong indirect influence
on my decision to pursue a PhD in accounting.
I greatly appreciate my parents, Bill and Margaret, and my sisters, Andrea and Eliza.
Their love and encouragement throughout the years have been instrumental in shaping who I am
today. Many of my friends have supported me through the tough times and the good ones, and I
am immensely grateful to Alissa Baker, Jake Baker, Sarah Bodbyl, Kara Moberg, Steve Roels,
Lori Steenwyk, and Karen Warren. Many of my fellow PhD students supported and encouraged
me through this process, and I am glad to have shared this experience with them. In particular, I
benefited from many fruitful discussions about my dissertation with Susanna Gallani, Andy
Imdieke, Miles Romney, Sarah Stuber, Anh Persson, and Philip Wang. I also greatly appreciate
support from the administrative staff in the Department of Accounting and Information Systems
who made my experience much smoother: Karla Bauer, Cody Beebe, Joyce Hengesbach, Jane
Lott, and Katie Trinklein.
I also thank Sarah Bodbyl, Joe Burke, Clara Chen, Paul Demeré, Victoria Dickinson,
Peter Easton, Gary Hecht, Mike Kender, Melissa Martin, Leslie Papke, Anh Persson, Steve
Roels, Mario Schabus, Sarah Stuber, and seminar participants at the University of Illinois at
Chicago, University of Illinois at Urbana-Champaign, Miami University, Michigan State
University, University of Missouri, University of Notre Dame, and Virginia Tech for helpful
comments and discussions. I thank FTSE Russell for providing index membership data, and
acknowledge financial support from a Broad College of Business Dissertation Completion
Fellowship and from the MSU Department of Accounting and Information Systems.
v
TABLE OF CONTENTS
LIST OF TABLES ...................................................................................................................... vii
LIST OF FIGURES ................................................................................................................... viii
Figure 1: Life Cycle Stage Classifications .................................................................................... 50
Figure 2: Institutional Ownership and Long-Term Investments across
Life Cycle Stages .......................................................................................................................... 51
Figure 3: Effects of Institutional Ownership on Long-Term Investments
by Life Cycle Stage ....................................................................................................................... 52
Figure 4: Effects of Institutional Ownership on Deciles of Long-Term
Investments by Life Cycle Stage .................................................................................................. 53
1
CHAPTER 1: INTRODUCTION
I examine how the effects of institutional ownership on firms’ long-term investments
vary across the corporate life cycle. Prior literature provides mixed evidence on the extent to
which governance mechanisms mitigate managerial myopia (i.e., a sacrifice of long-term value
to achieve short-term goals), and finds some instances in which governance mechanisms may
actually induce myopia (e.g., He and Tian 2013). Managerial myopia can lead to under-
investment as long-term investments increase current expenses, which reduces earnings and
potentially affects stock prices. Reducing long-term investments can have serious implications
for future profitability and growth, however, and governance mechanisms should help to
alleviate this problem by promoting appropriate long-term investments and long-term value
creation.
As owners are a fundamental driver of governance, I focus on large, sophisticated
investors (i.e., institutional investors). Given their large ownership stakes, institutional investors
have incentives to engage in governance activities to promote long-term value. Through voting
and activism activities, as well as through their threat of exit, institutional investors can exert
influence on managers’ decisions, including long-term investment decisions (Edmans 2014).
Further, given their greater sophistication, institutional investors can better identify the long-term
value associated with firms’ long-term investments. These advantages allow institutional
investors to shelter managers from short-term earnings and stock price effects resulting from
long-term investments (Bushee 1998), and thus promote long-term value creation. I examine this
relation in the context of the corporate life cycle.
As firms change throughout their life cycle, they face different internal and external
operating environments, investment opportunities, agency costs, and governance challenges. In
2
particular, certain stages in the corporate life cycle are transitory, and are characterized by
negative operating cash flows and low profitability. These life cycle stages represent critical
“make or break” points in which firms either move to a more sustainable stage, or face failure
(Dickinson 2011; Greiner 1972). Given the additional short-term pressure stemming from
negative operating results, managers may be hesitant to make appropriate long-term investments.
Failure to make necessary investments can impair a firm’s ability to move into a more
sustainable life cycle stage, thus inhibiting long-term value and growth. I argue that institutional
investors are well positioned to address this challenge by providing managers the flexibility they
need to pursue long-term value creation even if the short-term implications appear negative. I
also show that institutional ownership tends to be lowest during transitory life cycle stages,
which implies that the marginal benefit of institutional ownership should be greater in these
stages. Thus, I predict that institutional investors encourage greater long-term investments, and
this effect is most pronounced among firms in transitory life cycle stages.
To conduct my analyses, I create institutional ownership scores using data reduction
techniques that allow me to differentiate between different types of institutional investors from
the firm’s perspective. These scores capture two distinct types of institutional ownership: broad
ownership (a large number of institutional owners with relatively small ownership stakes) and
concentrated ownership (a smaller number of institutional owners with relatively large
ownership stakes). Using these scores, I examine how the effects of institutional ownership on
long-term investments vary across the corporate life cycle, and I focus on two types of long-term
investments: research and development (R&D) and capital (i.e., plant, property, and equipment).
Consistent with my prediction, I find that the effects of institutional ownership on firms’
capital and R&D investments are more positive in transitory life cycle stages relative to
3
sustainable life cycle stages. These results indicate that life cycle patterns explain important
variation in the relation between institutional ownership and firms’ long-term investments. On
average (i.e., aggregating across life cycle stages), I also show that concentrated institutional
ownership is negatively associated with capital investments, while broad institutional ownership
is positively associated with both capital and R&D investments. Thus, I also show that the effect
of institutional ownership on firms’ investment behavior differs substantially depending on the
type of institutional ownership.
To rule out the possibility that the effects I document are driven by institutional investors
focusing on firms with particular investment profiles, I identify a setting to provide evidence
suggestive of a causal relation between institutional ownership and firms’ long-term investments.
I use the annual reconstitution of the Russell indexes as an identification strategy to examine
firms near the cutoff between the Russell 1000 and the Russell 2000 indexes. Index weights are
assigned to firms within these indexes based on their relative market capitalizations, so firms at
the bottom of the Russell 1000 index have substantially smaller index weights than firms at the
top of the Russell 2000 index. As both index funds and actively managed funds often benchmark
against these indexes, firms at the top of the Russell 2000 index have discontinuously higher
institutional ownership relative to firms at the bottom of the Russell 1000 index (Crane et al.
2016; Chang et al. 2015). For a number of reasons, it is difficult for firms to manage their market
capitalization and float to achieve classification in one index versus the other. When the indexes
are reconstituted annually, firms that are re-classified from one index to the other experience an
exogenous shock to institutional ownership that is unrelated to firm characteristics, including
investments in capital and R&D. Using an instrumental variable approach with index inclusion
as an instrument for institutional ownership, I test for a causal link between institutional
4
ownership and firms’ long-term investments (Crane et al. 2016; Appel et al. 2016; Boone and
White 2015). The results of this approach show, across life cycle stages, that broad institutional
ownership is positively related to R&D investments, providing evidence in support of a causal
relation between broad institutional ownership and long-term investments.
An additional concern is that a positive effect of institutional ownership on long-term
investments might reflect institutional owners promoting value-decreasing investment, or
investment above an optimal level (i.e., over-investment). I address this concern by examining
firms which are more likely to over-invest, and find that my results are not driven by these firms.
Thus, based on my primary findings, I show that broad institutional ownership promotes efficient
long-term investment, while concentrated ownership may actually lead to inefficient reductions
in firms’ long-term investment activity. Finally, within each life cycle stage, I also find that the
effects of institutional ownership on firms’ long-term investment are most pronounced for firms
with lower levels of investment.
My study contributes to literature examining the effects of governance on firm outcomes,
particularly long-term investments (Aghion et al. 2013; Wahal and McConnell 2000; Bushee
1998), by documenting that the effects of governance on firms’ investment behavior vary across
the corporate life cycle. Given that firms in transitory life cycle stages face greater short-term
pressure, and generally have lower investment levels and lower institutional ownership levels, I
show that institutional ownership has a more positive effect on firms’ long-term investment
behavior in these stages. Further, I show that the effects of institutional ownership may actually
be negative in more sustainable stages, and thus considering a firm’s life cycle stage is important
in identifying the effects of institutional ownership.
I also contribute to the literature examining the governance role of institutional investors,
5
by developing innovative new measures that capture multiple dimensions of institutional
ownership. Previous approaches classify institutional investors based on characteristics of the
investor’s portfolio (i.e., from the investor’s perspective) (Bushee 1998). In contrast, I measure
and classify institutional ownership from the firm’s perspective. Specifically, I use data reduction
techniques and incorporate multiple dimensions of institutional ownership to identify two
general types of institutional ownership that firms face: broad and concentrated ownership. My
results indicate that different concentrations of institutional ownership have very different
implications for firms’ long-term investment behavior. In particular, after addressing concerns of
over-investment, I find that broad institutional ownership fulfils a positive governance role by
promoting efficient investment. In contrast, concentrated institutional ownership may actually
lead to inefficient reductions in firms’ long-term investments. Thus, I show that different
concentrations of ownership lead to differences in firms’ investment behavior.
Finally, I contribute to a growing literature that finds the corporate life cycle provides
additional explanatory power for a variety of phenomena of interest to accounting academics,
including accrual-based earnings management (Chang and Li 2016), relative performance
evaluation (Drake and Martin 2016), executive compensation (Drake and Martin 2015), and the
pricing of cash flows and accruals (Hribar and Yehuda 2015). My findings add to these studies
by enhancing our understanding of how a firm’s life cycle stage can yield valuable insights into
governance effects and firms’ investment behavior.
The paper proceeds as follows. In Chapter 2, I provide background on managerial myopia
and long-term investments, institutional ownership, and the corporate life cycle, and I develop
my hypothesis. In Chapter 3, I describe the data, the measurement of institutional ownership and
life cycle stages, and present descriptive statistics. In Chapter 4, I describe my research design
6
and present the results of my baseline models and hypothesis tests. In Chapter 5, I use the
discontinuity between the Russell 1000 and 2000 indexes as an identification strategy to address
endogeneity concerns. In Chapter 6, I examine the potential for over-investment within my
setting. In Chapter 7, I present additional sensitivity tests. In Section 8, I conclude with a
discussion of my results and their implications.
7
CHAPTER 2: THEORY AND HYPOTHESIS DEVELOPMENT
2.1. Managerial myopia
Managerial myopia has been defined as an “underinvestment in long-term intangible
projects […] for the purposes of meeting short-term goals” (Bushee 1998, 306), or as a “desire to
achieve a high stock price by inflating current earnings at the expense of long-term growth”
(Chen et al. 2015, 44). Thus, managerial myopia is the sacrifice of long-term value to achieve
short-term earnings or stock price goals, and can be triggered by a variety of pressures (e.g.,
stock options, analyst forecasts, and investor expectations) (Stein 1988, 1989). There are also
many ways that myopic action can be exhibited, including excess production to meet short-term
performance goals or to improve accounting performance (Bruggen et al. 2011; Young et al.
2014), reductions in R&D (Bushee 1998), and other forms of real earnings management
(Graham et al. 2005; Roychowdhury 2006; Cohen et al. 2008; Dichev et al. 2013; Vorst 2016).
Edmans et al. (2016) and Ladika and Sautner (2016) also provide evidence that incentive
horizons affect executives’ investment decisions, and show that shortening managers’ incentives
horizons can substantially reduce long-term investment. Given the prevalence of stock-based
compensation, this suggests that stock price concerns cause managers to reduce valuable
investments, consistent with the view of managerial myopia models (e.g., Stein 1988, 1989).
In this study, I examine investments in research and development (R&D) and capital (i.e.,
property, plant, and equipment), both of which are long-term in nature. These investments are
largely discretionary and can be delayed to meet short-term performance targets. When under
increased pressure, managers may be less inclined to invest in R&D and capital assets, as R&D
investments are expensed and capital investments may result in higher depreciation charges,
increases in interest costs, and reductions in cash balances. Delaying or foregoing such
8
investments to meet short-term performance targets, however, can inhibit the ability of the firm
to generate value in the future.
2.2. Governance and institutional ownership
Given the value-decreasing effects of myopic action and the empirical evidence regarding
managerial myopia, it is important to consider the role of governance in mitigating myopia.
There are many mechanisms that can be used to promote efficient investment and a variety of
groups and individuals that may play a role in governance. The choices between these various
mechanisms often depend on the type of firm, particularly with respect to the ownership
structure of the firm (Bebchuk and Weisbach 2010; Hart 1995). As the owners of the firm are a
fundamental driver of governance, I focus on the role of ownership in mitigating managerial
myopia, and specifically on the role of institutional investors.1
Institutional investors (owners) play an important governance role due to their large
ownership stakes and ability to influence managers through their voting and activism activities,
as well as through their threat of exit. In publicly traded companies, financing often occurs
through equity securities which are owned by a large number of investors, each of which may
have a relatively small stake in the firm. While this provides the benefit of risk diversification to
the investors, it creates a problem of free-riding with respect to governance (Bebchuk and
Weisbach 2010). Since no single investor or group of investors has a sufficiently large stake in
the company, incentives to be actively involved in governance are very low, particularly when
the investors may have ownership stakes in other companies as well. The free-riding problem
1 Tirole (2005) outlines a broad set of governance mechanisms, including incentives (e.g., compensation), the board
of directors, ownership and investor activism, takeovers and leveraged buyouts, and debt. I restrict my analysis to
governance arising through ownership, as many other governance mechanisms are driven by owners. For instance,
the owners of the firm elect the board of directors, who then design incentives for executives. Thus, while other
governance mechanisms could also affect long-term investment activity, I focus on the influence of institutional
ownership as a fundamental driver of governance.
9
arises because the benefit accruing to any investment in becoming informed about the company
and exercising governance is shared among all investors, not only by those making the
investment in governance, which substantially reduces the incentives for any individual investor
to be actively involved in governance activities (Shleifer and Vishny 1997).
In the presence of governance free-riding, only larger shareholders will have sufficient
incentives to become more informed and to monitor managers. Prior research has focused on
institutional investors as they have the resources to hold larger stakes in a given firm and thus
have greater incentives to be involved in governance activities compared to smaller investors
(Edmans 2014; Bebchuk and Weisbach 2010). Institutional investors may also become involved
in proxy contests and other activist actions in an attempt to change corporate policies, replace
directors and managers, and increase dividend payments (Edmans 2014). As defined by the SEC
(Rule 13f), institutional investors are entities which manage at least $100 million in equity and
which must file quarterly reports with the SEC (Bushee 1998). Collectively, institutional
investors hold a substantial portion of outstanding stock in the U.S., and prior research has
established the importance of institutional investors in the economy and their influence on
managers (Aggarwal et al. 2011; Bebchuk and Hamdani 2009; Chen et al. 2007).
There are many means by which institutional investors can encourage long-term
investments and thus reduce managerial myopia and promote long-term value. First, institutional
investors are sophisticated investors and much better informed than the average investor (Bushee
and Goodman 2007; Parrino et al. 2003). As pointed out by Edmans (2009), small shareholders
suffer not so much from the “separation of ownership from control” as from the “separation of
ownership from information” (p. 2485). By nature of their informational advantage and greater
sophistication, institutional investors have the ability to better identify the long-term value
10
associated with firms’ investments, which then gives managers the freedom to focus on
maximizing long-run value, without being penalized for temporary reductions in earnings or
stock prices (Bushee 1998). Second, in addition to active governance, institutional investors with
large holdings can exert influence simply through the option of selling their ownership stake
(Parrino et al. 2003). Thus, institutional investors can cause stock prices to better reflect
fundamental value simply due to their threat of exit (Edmans 2009). These advantages allow
institutional investors to exercise restraint and to provide managers with greater freedom to
pursue value creation over a longer horizon.2
Prior empirical research provides evidence that higher levels of institutional ownership
reduce managerial myopia. For instance, studies have shown that institutional ownership is
positively related to firm-level governance (Aggarwal et al. 2011), industry-adjusted
expenditures for property, plant, and equipment (PPE) and R&D (Wahal and McConnell 2000),
as well as innovation, R&D, and the productivity of R&D (Aghion et al. 2013). Institutional
ownership has also been shown to decrease the likelihood of cutting R&D to reverse an earnings
decline (Bushee 1998) and to limit the influence of venture capitalists on annual, short-horizon
incentives (Cadman and Sunder 2014).
2.3. Institutional ownership and long-term investments across life cycle stages
While the importance of institutional ownership has been previously examined, the
effects of institutional ownership should be more pronounced for certain firms and in specific
settings. Prior studies have shown that the effectiveness of governance depends on contextual
2 As an example of how institutional investors may exercise restraint (and encourage restraint from their own
investors), Peter A. Harbeck, President & CEO of SunAmerica Asset Management, LLC wrote the following in a
letter to shareholders in the SunAmerica Series, Inc. 2016 Annual Report: “Maintaining a long-term perspective is a
basic tenet of effective investing for both managers and investors. We believe that investors should resist the urge to
act upon short-term market movements and should instead maintain investments in assets that are allocated based on
their long-term individual goals” (Harbeck 2016, 3).
11
factors and firm-specific circumstances (O’Conner and Byrne 2015; Bhagat et al. 2008; Dey
2008; Cremers and Nair 2005). For instance, the effects of institutional ownership vary based on
important characteristics of institutional investors, such as portfolio weights (Fich et al. 2015),
holding size (Chen et al. 2007), and investment strategies (Bushee and Goodman 2007;
Abarbanell et al. 2003; Bushee 1998). The effects of institutional ownership also vary based on
characteristics of the firms in which they invest, such as the level of agency costs (Crane et al.
2016) and the presence of other governance channels (Atanassov 2013). To add to this line of
research and to better understand the circumstances in which institutional ownership matters
most, I leverage a growing literature on the corporate life cycle to examine how a firm’s life
cycle stage influences the effectiveness of institutional ownership.
As firms evolve and face different operating environments, they move through various
life cycle stages (e.g., Phelps et al. 2007; van de Ven and Poole 1995). Firms do not necessarily
follow a linear, sequential progression through life cycle stages and may skip stages or revert to
previous life cycle stages due to differences in internal (e.g., strategy, innovation, investments)
and external factors (e.g., industry shocks, competition) (Phelps et al. 2007; van de Ven and
Poole 1995; Dickinson 2011; Miller and Friesen 1984). As a result, firms in the same life cycle
stage may have arrived in that stage through many different paths. I use an adaptation of
Dickinson’s (2011) classification, in which she classifies firms into life cycle stages based on the
pattern of their cash inflows and outflows from operating, investing, and financing activities (see
Figure 1). Her classification scheme provides five stages, which she labels Introduction, Growth,
Mature, Shake-Out, and Decline.
While any classification scheme is necessarily imprecise and there may be ambiguity in
classifying certain firms, a typology of classifying firms based on their life cycle stage can yield
12
valuable insights to better understand predictable patterns of firm characteristics and actions.
Further, while there are not bright-line distinctions between the stages, there are important
differences in firm characteristics between stages, and many similarities among firms classified
in the same stage. For instance, firms differ in predictable ways across life cycle stages in terms
of innovation, growth, and the competition they face. Other important differences include
ownership concentration, business structure, centralization, and risk-taking. For instance, prior
studies have found that firms’ investment, financing, and cash policies (Faff et al. 2016), board
structure and composition (Balogh 2016), sales growth and capital investments (Anthony and
Ramesh 1992), dividend policies (DeAngelo et al. 2006), and profitability (Dickinson 2011) vary
across life cycle stages. More recent studies have also considered how a firm’s life cycle
provides additional explanatory power for accrual-based earnings management (Chang and Li
2016), relative performance evaluation (Drake and Martin 2016), executive compensation (Drake
and Martin 2015), and the pricing of cash flows and accruals (Hribar and Yehuda 2015). As of
yet, however, little research has considered how governance mechanisms may function
differently depending on a firm’s life cycle stage.3
Dedman and Filatotchev (2008) suggest that “the role of corporate governance is likely to
differ in ways contingent on both the firm’s internal and external factors” with the result that
“internal and external contingencies are likely to influence the effectiveness of particular
governance practices” (p. 250). As firms change over the course of their life cycle, they face
different internal and external operating environments, competition, investment opportunities,
and agency costs. For instance, free cash problems generally only arise in later life cycle stages
3 While most prior studies have examined cross-sectional variation in control use among mature, stable firms
(Filatotchev et al. 2006), some studies have examined the evolution of organizational control for firms at specific
transitions between life cycle stages (Shah et al. 2013; Phelps et al. 2007; Cardinal et al. 2004).
13
(Saravia 2014; Filatotchev et al. 2006; DeAngelo et al. 2006; Grullon et al. 2002), so
mechanisms designed to address free cash flow problems might actually be detrimental in other
life cycle stages. Thus, what is effective in one life cycle stage may be less effective or even
detrimental in another stage, since firms face different governance challenges in different life
cycle stages (Koh et al. 2015; Filatotchev et al. 2006; Miller and Friesen 1984; Anthony and
Ramesh 1972).
Given different governance challenges across life cycle stages, I predict that the
effectiveness of governance in mitigating investment myopia will vary across firms’ life cycle
stages. Dickinson (2011) suggests that the ideal point is somewhere between the Growth and
Mature stages, as this is where the risk-reward structure is optimized. While the Growth and
Mature stages are characterized by stability, the Introduction and Decline stages are transitory.4
Firms in the Introduction and Decline stages are characterized by negative operating cash flows,
and these firms also tend to have the lowest profitability levels. As these are not sustainable
long-term states, firms need to generate positive operating cash flows or face exit. Thus, the
Introduction and Decline stages are transitory stages which represent critical “make-or-break”
points in the corporate life cycle.5 In a similar vein, Greiner (1972) suggests that a number of
firms fail during these “periods of crisis”. In particular, “[firms] unable to abandon past practices
and effect major organization changes are likely either to fold or to level off in their growth rates.
The critical task for management in each revolutionary period is to find a new set of organization
practices that will become the basis for managing the next period of evolutionary growth” (p.
4 The Shake-Out stage is essentially an “Other” category for unusual cash flow patterns. It is difficult to predict what
the effect of institutional owners will be in this stage, since there are three highly distinct cash flow patterns which
result in classification in this stage. 5 The Decline stage does not necessarily represent a stage in which the firm is itself facing exit. Gort and Klepper
(1982) define the Decline stage as a situation in which there are essentially no new producers entering the market.
Firms classified in the Decline stage may be experiencing adverse circumstances or otherwise attempting to revive
the firm. Thus, the Decline stage does not necessarily represent a period of winding down operations.
14
40). As long-term investments (in capital and R&D) are critical in generating positive future
operating cash flows., firms in these “periods of crisis” that make appropriate investments face
more promising future prospects, while firms that fail to make adequate investments face greater
likelihood of exit. Further, when firms are operating in unsustainable situations, they face greater
uncertainty, which is likely to further reduce long-term investments. To move to a sustainable
stage, disruptive change may be necessary, thus requiring greater long-term investment.
During these critical transitory periods, managers face greater short-term pressure which
can lead to reductions in long-term investments. Institutional owners can insulate managers from
other external pressures for short-term results, allowing managers to make the long-term
investments necessary to generate positive future operating cash flows. Institutional investors can
also provide stability to stock prices through greater insights regarding long-term value, further
mitigating managerial concerns about short-term price effects related to long-term investment
decisions. Finally, institutional ownership tends to be lower in less established firms (i.e., in
transitory life cycle stages), so the marginal effect of each institutional owner on managerial
decisions should be stronger. Thus, I predict that the effect of institutional ownership on firms’
long-term investment will be more pronounced among firms in transitory life cycle stages. This
leads to my hypothesis:
H1: The effect of institutional ownership on firms’ long-term investments is more positive in
transitory life cycle stages.
15
CHAPTER 3: RESEARCH DESIGN
3.1. Data and sample
Institutional ownership data come from the Thomson Reuters Institutional (13f) Holdings
s34 Master File. Long-term investment values and other financial statement data come from
Compustat Annual. Stock price and trading data come from CRSP. I start with all firms
incorporated in the U.S., and then exclude financial firms (NAICS 52) and utilities (NAICS 22)
due to differences in their physical capital requirements and regulatory environments (Faff et al.
2016; DeAngelo et al. 2006). I then drop any observations with assets less than $1 million, and
any observations with abnormal (e.g., negative) values for long-term investments or other control
variables. After merging the datasets, the main sample for empirical analysis includes 6,141
unique firms (42,112 firm-year observations) for the period 1997–2014.
3.2. Institutional ownership
To examine how institutional ownership influences firms’ investment levels, I create
composite measures of institutional ownership (i.e., institutional ownership scores). Using
institutional ownership scores allows me to incorporate multiple dimensions of institutional
ownership. Many of the specific measures are closely related, and thus may be usefully
summarized, providing a more informative overall picture and simplifying subsequent analysis.6
Importantly, I measure institutional ownership from the firm’s perspective, rather than from the
institutional investor’s perspective. I use factor analysis to develop the institutional ownership
scores, which allows the weights to vary across different measures.
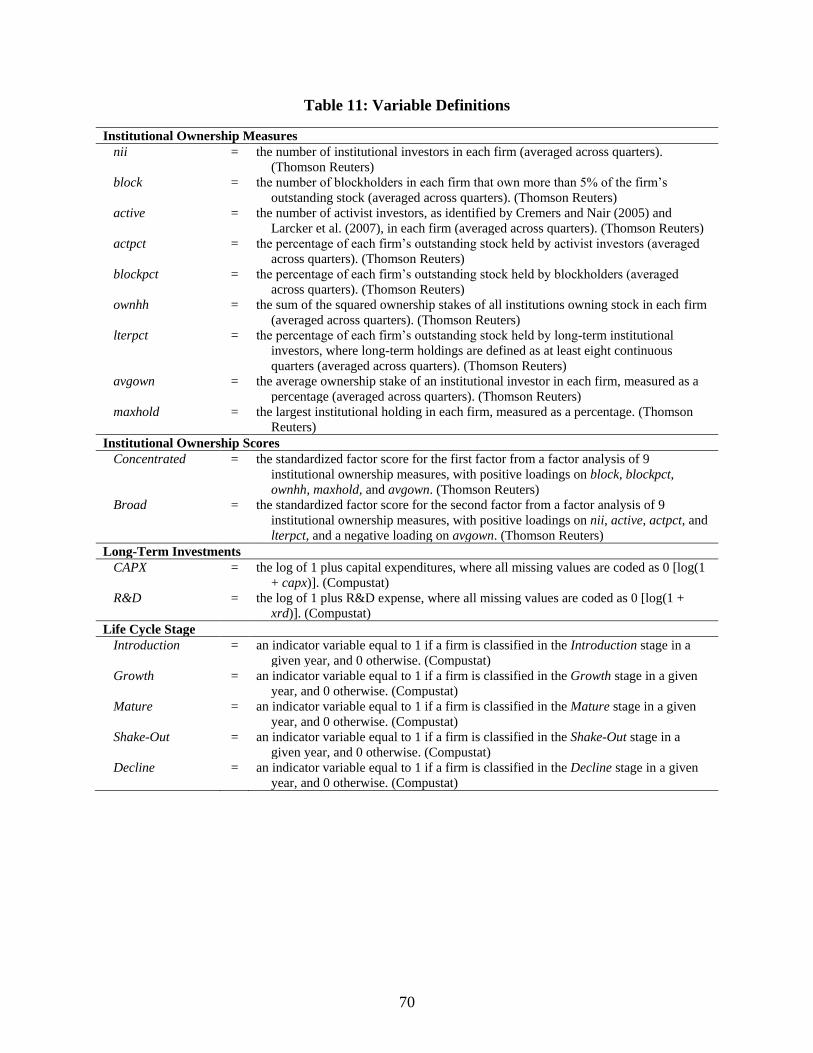
I include nine measures which capture different aspects of institutional ownership. The
6 Using a summary measure also provides a stronger test, as including multiple correlated measures in a single
model would lead to substantial multicollinearity.
16
data on institutional ownership are quarterly, so I average across quarters to calculate each
measure by firm and year, unless indicated otherwise. I start by including the number of
institutional owners (nii) for each firm. I include the number of blockholders that own at least
five percent of a firm’s outstanding stock (block). I identify activist institutions based on the
classifications of Cremers and Nair (2005) and Larcker et al. (2007), and calculate the number of
activist institutions with holdings in each firm (active). I also measure the percentage of each
firm’s outstanding stock that is held by activist institutions (actpct) and blockholders (blockpct).
The Herfindahl-Hirschman Index is the sum of the squared ownership stakes of all institutions
owning stock in a given firm (ownhh). Institutions are classified as long-term investors if they
held stock for at least eight continuous quarters, consistent with Bushee (1998), and I include the
percentage of each firm’s outstanding stock held by long-term investors (lterpct). The average
ownership stake of an institutional owner in each firm is measured as a percentage (avgown).
Finally, I include the largest institutional ownership stake (in any quarter) in each firm
(maxhold). To mitigate the effect of outliers and to reduce skewness, I winsorize each of the nine
institutional ownership measures at the 1st and 99th percentiles.
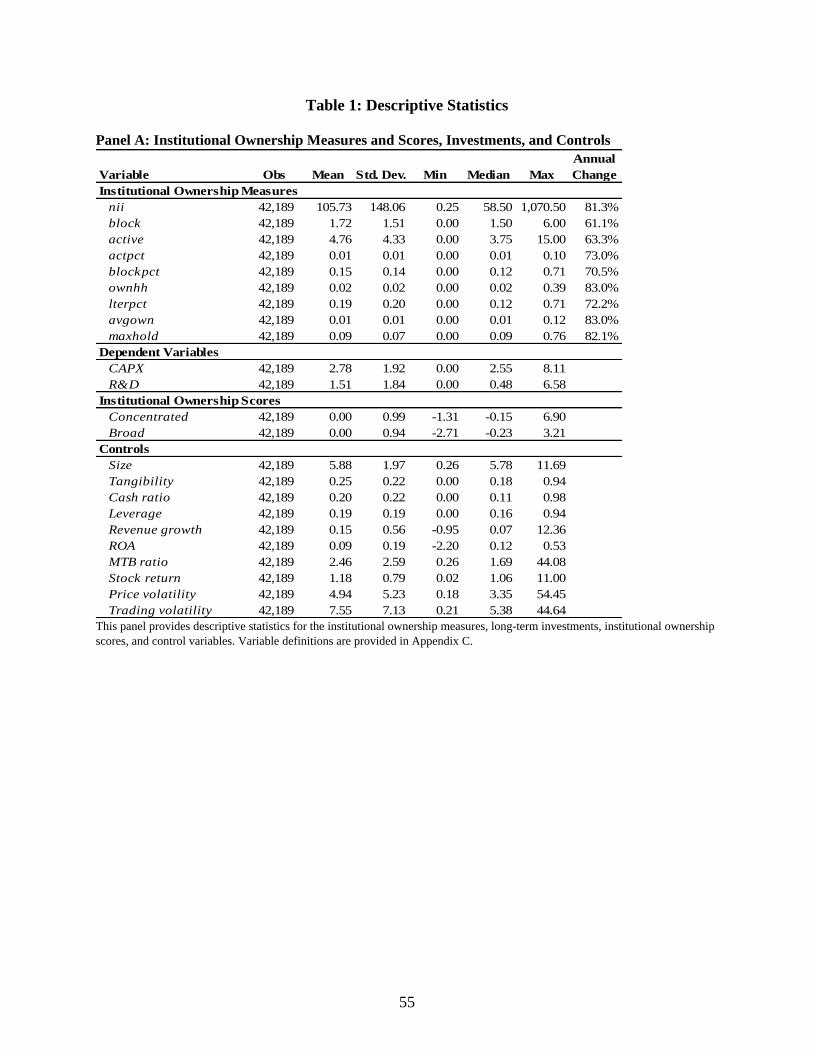
As shown in Table 1, Panel A, the mean (median) firm has 106 (59) institutional owners.
The mean (median) firm has 2 (2) blockholders that hold 15% (12%) of outstanding stock, and 5
(4) that are activist owners that hold 1% (1%) of outstanding stock. The largest holding is 9% on
average, and only 19% of outstanding shares are held by institutional investors for two years or
more. In the last column of Panel A, I show that these variables exhibit substantial variation over
time as institutions change their holdings in a given firm (range of 61%–83% annual change,
depending on the variable). These ownership characteristics also vary across life cycle stages, as
shown in Table 1, Panel B. Each of the specific institutional ownership measures is generally
17
highest for Mature firms and lowest for Introduction and Decline firms, except for average
ownership percentage, which would be expected to have the opposite pattern given the potential
for more diversified ownership for Mature firms. These patterns are presented graphically in
Figure 2, Panel A, while Table 2, Panel A provides Pearson correlations for the institutional
ownership measures. I find that all of the institutional ownership measures are significantly
correlated, and all in a positive direction, with the exception of average ownership (avgown).
I include the nine specific institutional ownership measures in a factor analysis to create
composite institutional ownership scores for each firm-year in my sample. Based on a review of
eigenvalues, scree plots, and the proportion of variance explained, I determined that there was a
clear two-factor solution (Tabachnick and Fidell 2013). To maintain the orthogonality of the
factors for subsequent analysis and to more easily interpret the factors, I used varimax rotation.
The results of the factor analyses, including the (rotated) factor loadings, eigenvalues,
uniquenesses, and proportion of variance explained are reported in Table 3.
Based on the factor loadings, I identified which institutional ownership measures were
most strongly associated with each factor. I identified these measures based on whether the
absolute value of the factor loading was above 0.40. For institutional ownership, the first factor
appears to represent concentrated institutional ownership, as the factor is positively related to the
number of blockholders (block), the percentage of shares held by blockholders (blockpct), the
Herfindahl-Hirschman Index (ownhh), the largest institutional holding (maxhold), and the
average institutional ownership stake (avgown). In contrast, the second factor appears to
represent more dispersed, yet more active institutional ownership, as the factor is positively
related to the total number of institutional investors (nii), the number of active institutional
owners (active), the proportion of active (actpct) and long-term institutional owners (lterpct), and
18
negatively related to the average institutional ownership stake (avgown). Given the factor
loading structure, these factors seem to clearly represent different aspects of institutional
ownership, where the first institutional ownership factor represents concentrated institutional
ownership (Concentrated) and the second factor represents broad institutional ownership
(Broad).
Pearson correlations between the institutional ownership scores, investment measures,
and controls are provided in Table 2, Panel B, which indicate that both capital investments
(CAPX) and R&D investments (R&D) are positively correlated with the institutional ownership
scores (Concentrated and Broad), although the correlations are quite low for Concentrated. The
average factor scores for Concentrated and Broad are plotted against life cycle stages in Figure
2, Panel B. The figure shows substantial differences in the institutional ownership scores across
life cycle stages. In particular, both Concentrated and Broad ownership are higher in the Growth
and Mature stages relative to the Introduction and Decline stages.
3.3. Life cycle
To measure each firm’s life cycle stage, I start with Dickinson’s (2011) classification.
She classifies firms into one of five stages based on the pattern of their operating, investing, and
financing cash flows. Figure 1 shows the classification scheme based on the direction of cash
flows (whether the cash flow in each category is an inflow (+) or an outflow (–)). Thus, the
pattern of a firm’s cash flows provides a mapping into a life cycle stage each year. Her
classification results in five stages, which are labeled as Introduction, Growth, Mature, Shake-
Out, and Decline.
Dickinson’s (2011) classification scheme is a parsimonious and robust approach, and
relative to prior life cycle measures (e.g., Anthony and Ramesh 1992), is free from distributional
19
assumptions (i.e., uniformity) and has better explanatory power for future profitability. She also
validated her classification scheme using a number of approaches.7 Subsequent studies have
further validated Dickinson’s (2011) life cycle classification, and have shown that this
classification provides additional explanatory power for accrual-based earnings management
(Chang and Li 2016), relative performance evaluation (Drake and Martin 2016), executive
compensation (Drake and Martin 2015), and the pricing of cash flows and accruals (Hribar and
Yehuda 2015).
One of the drawbacks of using an annual re-classification, however, is that random
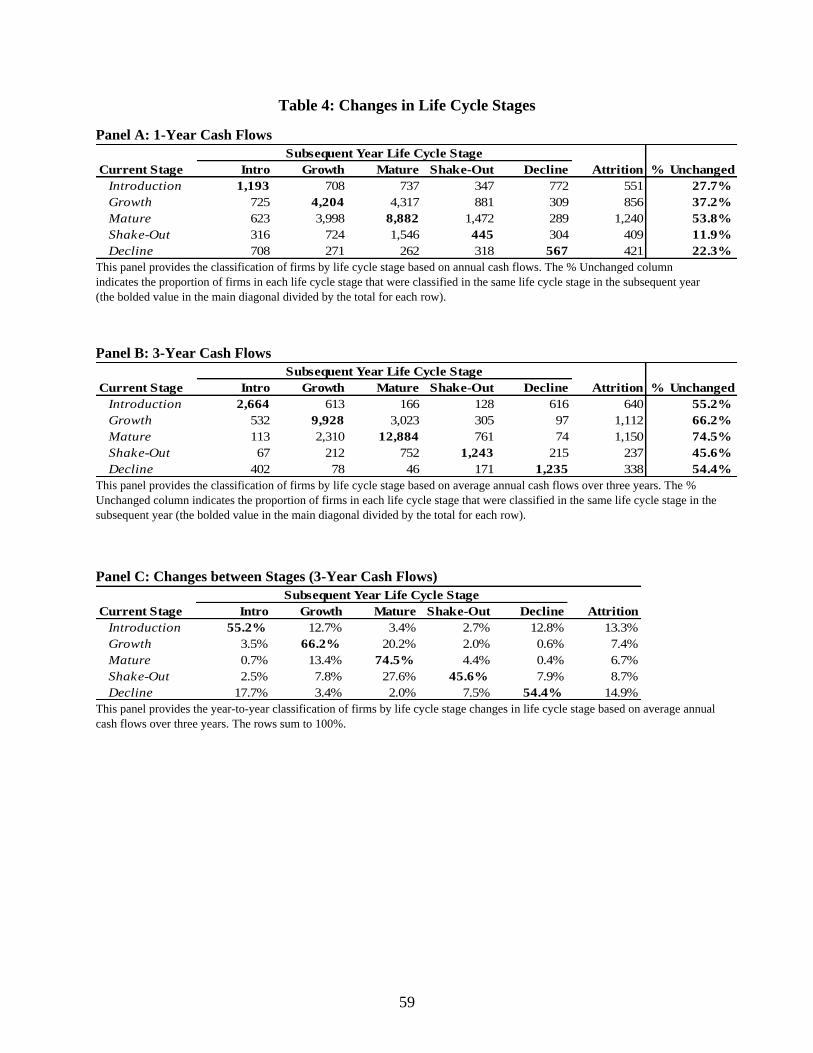
fluctuations and volatility in cash flows could result in frequent re-classifications. Panel A of
Table 4 shows the year-to-year classification of firms and indicates that a large proportion of
firms are classified in a different life cycle stage relative to the prior year. Firms should generally
follow a long-term trajectory through life cycle stages and it seems reasonable that firms would
not move from one life cycle stage to another on a frequent basis.
Thus, I use average three-year cash flows to smooth these fluctuations and to provide a
more consistent and stable proxy for firms’ life cycle stages. In particular, a smoothed three-year
average measure reduces variation due to unusual events and random fluctuations, and increases
the stability of the life cycle measure across years. As can be seen in Table 4, Panel B, the life
cycle measure using three-year average cash flows produces more consistent classifications, and
fewer observations which move to a different life cycle stage in a given year. Based on these
comparisons, I use this classification in all empirical tests.8
7 First, Dickinson (2011) analyzed the relation between cash flows, future performance, and life cycle fundamentals.
Her findings indicate that her classification scheme provides a superior alignment of the functional form of firm’s
profitability than earlier classification schemes. Second, patterns of growth, leverage, size, and age across life cycle
stages using this classification scheme are consistent with economic theory. 8 I find that my results are robust to using one-year cash flows to classify firms into life cycle stages (see Chapter
7.4).
20
As discussed in my hypothesis development, the Introduction and Decline stages
represent critical transitory periods that are unsustainable in the long-run. Thus, I further
examine what happens to firms in these stages, and whether they drop out of my sample or move
to another life cycle stage. As shown in Table 4, Panel C, the proportion of firms remaining in
the Introduction and Decline stages is lower than in the Growth and Mature stages. While 55.2%
of Introduction firms remain in the same stage in the subsequent year, of the remaining
Introduction firms, there is a roughly equal number moving out of the Introduction stage to the
Growth stage (12.7%), the Decline stage (12.8%), and dropping from the sample (13.3%). For
firms in the Decline stage, 54.4% remain in the same stage in the subsequent year, and there are
slightly more firms moving to the Introduction stage (17.7%) than those dropping from the
sample (14.9%). In both the Introduction and Decline stages, there are relatively few firms that
move directly into the Mature stage (3.4% and 2.0%, respectively).
To further examine survivorship, I look at the reasons why firms drop from the sample. I
use delisting data from the CRSP Event database and separately analyze firms that were delisted
due to mergers and acquisitions (delisting codes 200–299) and firms that were delisted for cause,
either through liquidation (delisting codes 400–499) or an inability to meet listing requirements
500–599) (Chen 2011; Yung et al. 2008; Beaver et al. 2007).9
In a similar analysis, Dickinson (2011) found that only 78% of firms in her sample
remained in the sample five years in the future. She also found substantially higher (lower)
survival rates for Mature (Decline) firms relative to the pooled sample. Consistent with
9 Other reasons for delisting include issue exchanges, expirations, or a change in ownership from domestic to
foreign. Details on delisting categories are available at http://www.crsp.com/products/documentation/delisting-
codes.
21
Dickinson’s (2011) findings, I find that firms in the Introduction and Decline stages experience
the greatest rates of delisting. As shown in Table 4, Panel D, on average, 6.4–6.6% of firms in
the Introduction and Decline stages delist every year for cause, compared to 0.7–1.0% of firms in
the Growth and Mature stages. Thus, the Growth and Mature stages are the most stable and
sustainable, while firms in the Introduction and Decline stages experience much higher rates of
attrition and movements into other life cycle stage. This is consistent with earlier arguments that
the Introduction and Decline stages are the most transitory and represent critical “make-or-
break” points in the corporate life cycle.
3.4. Long-term investments and controls
I use two measures of long-term investment: capital investments (i.e., in PPE) and
research and development (R&D) investments. The first measure of long-term investment is
capital expenditures, which includes items related to property, plant, and equipment,
expenditures for capital leases, increases in funds for construction, and other long-term capital
expenditures, but excludes expenditures related to acquisitions and discontinued operations
(Compustat: capx).10 The second measure of long-term investment is R&D expense (Compustat:
xrd).11 While the effectiveness of any given investment is uncertain, firms with greater
investments can be expected to yield greater long-term value over time, on average. For my
10 A challenge with examining capital investments is that it is very difficult to specify ex ante an appropriate level of
capital investment. Greater investment can be seen as a positive action, in the sense that it enables growth and future
performance. On the other hand, greater investment could also be representative of inefficient spending, such as
empire building or other forms of over-investment. Even attempting to control for size, industry characteristics,
growth opportunities, and profitability is unlikely to provide a measure of the optimal level of capital investment for
a given firm. Further, measuring managerial myopia is challenging since researchers are unable to empirically
measure the optimal level of investment and the extent to which managers make their investment decisions in light
of pressures for short-term results (Stein 1988). As such, similar to R&D investments, I focus instead on the size of
investments (inputs) rather than the quality of the investments. In supplemental analyses (see Chapter 6), I attempt to
further examine whether the results are driven by firms with a propensity toward over-investment. 11 While patenting activity may be a better indicator of innovation as it represents an output measure (Fang et al.
2014), I am interested in the extent to which firms are investing in long-term value creation (i.e., an input measure).
22
empirical analyses, I set all missing values to zero and take the natural log of one plus the
investment value.12 The patterns of long-term investments across life cycle stages are presented
graphically in Figure 2, Panel C. As shown in this figure, capital investments are lowest in the
Introduction and Decline stages, while R&D investments do not vary substantially across life
cycle stages.
Consistent with prior studies, I include controls related to size, financing, performance,
and market-based characteristics which are likely to influence long-term investments.
Specifically, I include lagged firm size (natural log of total assets), lagged asset tangibility (ratio
of net property, plant, and equipment to total assets), the lagged cash ratio (ratio of cash to total
assets), lagged leverage (ratio of long-term debt and debt in current liabilities to average total
assets), annual growth in revenue, return on assets (ratio of operating income before depreciation
to average total assets), the market-to-book ratio, annual stock returns, annual price volatility (the
standard deviation of closing prices over each firm’s fiscal year), and annual trading volatility
(the average trading volume divided by average shares outstanding). Finally, I include industry
fixed effects at the two-digit NAICS level and year fixed effects, and use robust standard errors
clustered by firm (Chen et al. 2015; Fang et al. 2014). After calculating the dependent variables
and control variables, I winsorize each at the 1st and 99th percentiles to mitigate the effect of
outliers. To further address skewness in the distributions of the dependent variables, I use a log
transformation for both capital and R&D investments.
12 I use the natural log of one plus long-term investments as my dependent variable, rather than scaling by total
assets or some other measure of firm size. Instead, I control for lagged firm size (natural log of total assets) as an
additional predictor in my models. This approach is strictly more general, as it allows the model to determine the
appropriate coefficient, rather than imposing a pre-specified relationship between long-term investments and firm
size.
23
CHAPTER 4: EMPIRICAL TESTS AND RESULTS
4.1. Baseline models
To provide baseline results of the association between institutional ownership and long-
term investments, I regress a measure of long-term investment (where LTI is either CAPX or
R&D) on the institutional ownership scores (Concentrated and Broad) and a set of controls,
including life cycle stage indicators. If institutional ownership affects managerial myopia, then I
expect a short-term reaction, which would be reflected in a contemporaneous annual relation
between institutional ownership and long-term investments. Thus, the baseline model for the
effect of institutional ownership on long-term investments (LTI) for firm i at time t is:
where LC are the life cycle stage indicators (one indicator is dropped as the base level, so there
are only four indicators in the equation above).
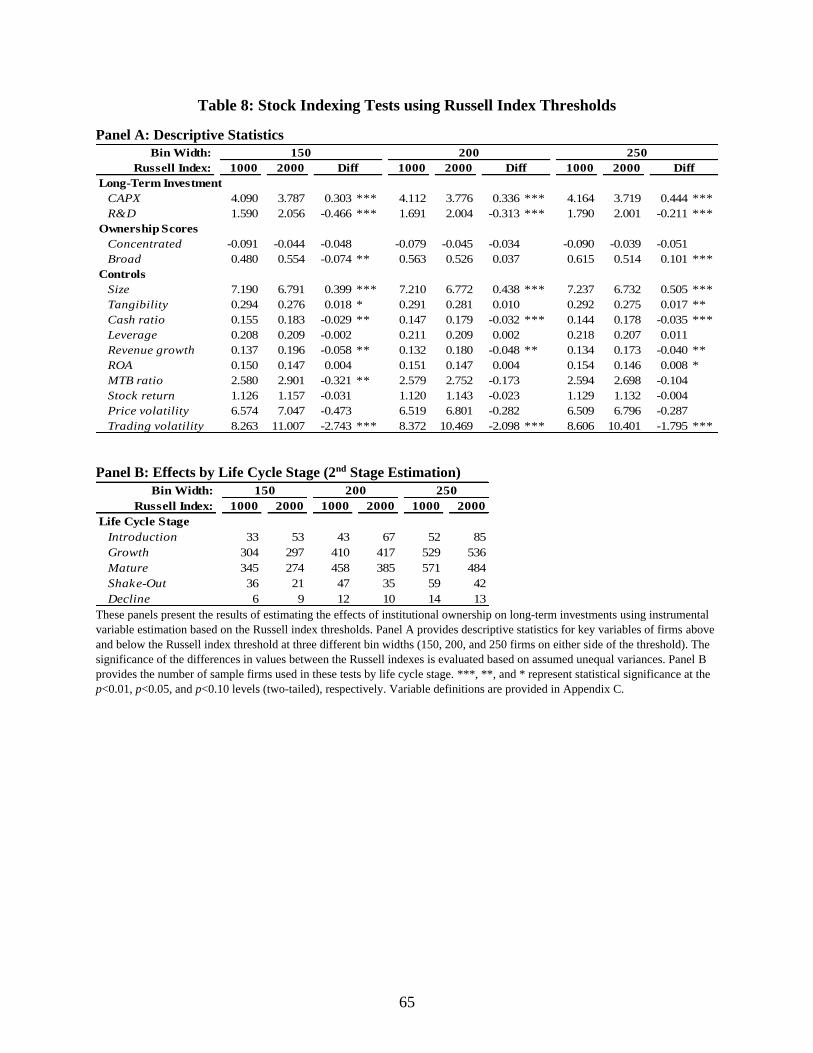
The results from estimating the second-stage model [Model (3)] are presented in Table 8,
Panel D. For ease of interpretation, the values presented in Panel D are the marginal effects of
institutional ownership (Concentrated or Broad) by life cycle stage. Control variables, life cycle
fixed effects, and year fixed effects are included in the second-stage model, but are excluded
from the table for ease of presentation. I find that Broad ownership is generally not significantly
related to CAPX. In contrast, Broad ownership is positively and significantly related to R&D in
the Introduction, Growth, and Mature stages under all bin widths, and for all life cycle stages in
the 250 firm bin width. As shown in Panel B, there are very few firms in the Decline stage, so it
is not surprising that I do not find an effect except in the 250 firm bin width. Thus, while I do not
find an effect with respect to CAPX, I find evidence in support of a causal relation between
Broad institutional ownership and long-term investments. I also continue to find that the effects
are more positive for firms in the Introduction and Decline stages, but the differences in effect
sizes between life cycle stages are generally not significant.
32
CHAPTER 6: INVESTMENT EFFICIENCY TESTS
One of the fundamental issues in corporate finance is the efficiency of capital allocation
across firms and within firms. In the absence of financing frictions, information asymmetry,
agency conflicts, and private managerial objectives, firms should be able to achieve first-best
investment levels. Since these impediments are likely to be present, however, most firms deviate
from the first-best level by either under-investing or over-investing. Managers’ private objectives
can involve over-investment (e.g., empire-building), but can also involve under-investment,
particularly related to reputational and career concerns (e.g., short-termism). Other private
objectives or tendencies provide ambiguous predictions regarding over- vs. under-investment.
Herding behavior, in which managers follow others’ actions, can lead to deviations from optimal
investment levels in either direction. Preferences for “the quiet life” (Bertrand and Mullainathan
2003) can also lead to either under- or over-investment. In some cases, a “quiet life” preference
may lead to inertia and the continuation of existing investments or an unwillingness to terminate
investments. In other cases, such inertia may inhibit managers from making additional
investments to pursue new business or growth. Thus, the existence of private objectives and
other agency problems can lead to either under- or over-investment (Stein 2003), which makes it
difficult to empirically identify firms’ investment opportunities and optimal investment levels
(Erickson and Whited 2006). Distortions in investment efficiency can also arise from
contracting. For instance, Laux (2012) models how managerial myopia can arise endogenously
from boards attempting to balance the provision of incentives for effort and incentives to induce
efficient investment. Given these limitations, measuring the level of a firm’s under- or over-
investment is very challenging.
33
Thus, finding a positive effect of institutional ownership on long-term investments could
either provide evidence of a reduction in managerial myopia and an increase in investment
efficiency (the myopia hypothesis), or could represent over-investment (the efficiency
hypothesis) (Edmans et al. 2016). Given the differences in implications, it is important to attempt
to distinguish between these competing hypotheses. I examine the issue of investment efficiency
to identify whether institutional investors fulfill a positive governance role or actually increase
pressure on managers, resulting in inefficient investment. In general, I find that my results are
not indicative of over-investment.
First, R&D investments are less likely to reflect over-investment relative to capital
investments (Ramalingeogowda et al. 2013). Hall and Lerner (2010) further show that firms tend
to under-invest in R&D. R&D investments are also generally value-increasing, while capital
investments can be value-decreasing. For instance, Eberhart et al. (2004) show that firms
experience significantly positive long-term abnormal operating performance subsequent to
increases in R&D. Thus, my finding of a positive effect of institutional ownership on firms’
R&D investments is unlikely to be driven by over-investment. As described by
Ramalingeogowda et al. (2013), such results are consistent with an under-investment explanation
(governance promoting a more efficient investment level) but inconsistent with an over-
investment explanation.
Second, I test investment efficiency using firms’ cash and debt levels, as one of the
strongest empirical regularities with respect to investments is that firms with more cash and
lower debt tend to invest more, and are potentially more likely to over-invest. While prior studies
have not provided strong evidence on why this is the case, researchers have attempted to use
these findings to measure firms’ under- and over-investment. Biddle et al. (2009) create a
34
measure which attempts to assess firms’ propensity toward over-investment (under-investment)
based on high (low) cash balances and low (high) leverage.14
To consider the potential for under- and over-investment, I calculate each firm’s
propensity toward over-investment using Biddle et al.’s (2009) approach. For each year and
industry (using the Fama-French 12-industry classification), I rank firms into deciles based on
(1) their cash balances (or cash ratio) and (2) their leverage. Prior to creating the deciles, I
multiply leverage by –1 so that both sets of deciles are increasing in the propensity toward over-
investment. I then scale both sets of deciles to range between 0 and 1, and take the average of the
two scaled measures (OverFirm). Based on theory and prior empirical findings, firms with
higher values on this measure should be more likely to over-invest.15
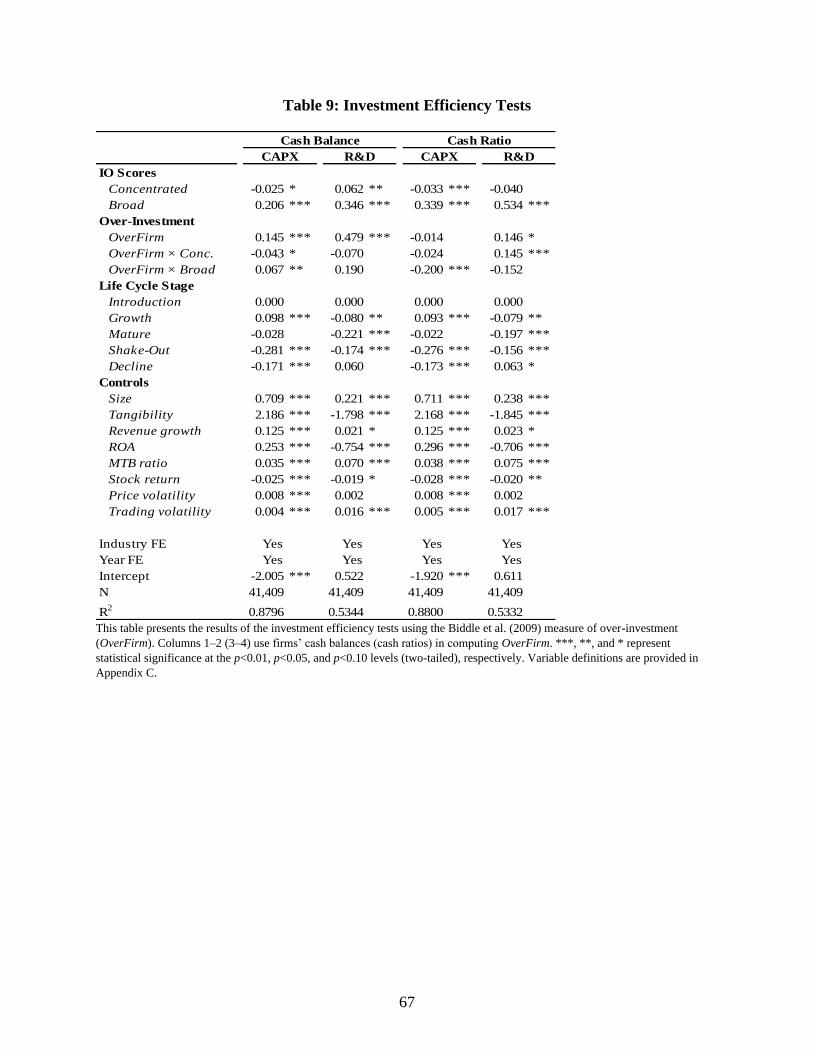
I then analyze Model (1) including OverFirm as a proxy for a firm’s propensity toward
over-investment, and interactions between OverFirm and both Concentrated and Broad. The first
(last) two columns in Table 9 use a firm’s cash balance (cash ratio) in calculating OverFirm.
When using a firm’s cash balance, the results continue to provide evidence of a negative
(positive) main effect of Concentrated (Broad) on CAPX, and a positive effect of both
Concentrated and Broad on R&D. The main effect on OverFirm is positive and significant for
both CAPX and R&D, consistent with this measure capturing higher levels of investment (and
14 Biddle et al. (2009) use this measure to examine whether moral hazard and adverse selection hamper efficient
investment, and whether financial reporting quality affects this relation. In particular, they measure the relation
between financial reporting quality and investment by regressing investment on a financial reporting quality
measure, an over-investment measure, and their interaction. They find a conditional negative (positive) relation
between financial reporting quality and investment for firms more disposed to over-investment (under-investment).
This approach has also been used by Cheng et al. (2013) to examine the investment behavior of firms before and
after the disclosure of an internal control weakness, and by Lara et al. (2016) to examine the effect of conservatism
on investment efficiency. Biddle et al.’s (2009) findings with respect to governance suggest that institutional
ownership is positively (negatively) related to investment regardless of a firm’s propensity toward over-investment.
They also find that institutional ownership is negatively related to under-investment and positively related to over-
investment, where they measure institutional ownership as the percentage of institutional investors in the firm. 15 Using the Fama-French 12-industry classification provides between 47 and 715 firms for calculating deciles for
each industry-year, after excluding the Utilities and Finance industries.
35
potentially capturing over-investment). The interaction between OverFirm and Concentrated
(Broad) is significant and negative (positive) for CAPX, but is not statistically different from
zero for R&D. Thus, this provides some evidence that Concentrated (Broad) institutional
ownership may decrease (increase) over-investment in CAPX, but this relation does not hold with
respect to R&D. When the cash ratio is used instead of the cash balance, however, the interaction
between OverFirm and Concentrated is only significantly positive for R&D, and the interaction
between OverFirm and Broad is actually negative for CAPX. Further, the main effect of
OverFirm is only positive for R&D. Given these conflicting results, there does not appear to be
strong evidence that the effects I document are indicative of over-investment.
Third, I also consider firms’ changes in dividends. Brav et al. (2005) provide survey
evidence that managers are willing to forgo valuable investment opportunities to avoid reducing
dividends, and Daniel et al. (2010) provide archival evidence consistent with these findings.
However, there is an asymmetry in managers’ behavior regarding dividend changes. While
managers are willing to forgo valuable investments to avoid reducing dividends, they are not as
willing to forgo valuable investments to increase dividends. As a result, firms that decrease
(increase) dividends are more (less) likely to be facing financial constraints and thus less
susceptible to over-investment (Brav et al. 2005; Ramalingeogowda et al. 2013). As expected, I
find firms that decrease dividends have lower levels of long-term investments, on average.
Interestingly, the effect of Broad ownership on capital investments is actually more positive for
firms that decrease dividends, and this is most pronounced for firms in the Introduction and
Decline stages. I do find that, on average, the effect of Concentrated ownership on R&D
investments is lower for firms that decrease dividends, and similarly for Broad ownership in the
Decline stage. Thus, while there is some limited evidence from this test in support of the
36
efficiency hypothesis, the results appear to be more in line with the myopia hypothesis. Based on
the evidence from these tests, my results do not appear to be driven by over-investment.
37
CHAPTER 7: SENSITIVITY TESTS
7.1. Quantile regression
I also consider how the level of long-term investment may influence my findings. In
particular, it is possible that the observed relation between institutional ownership and long-term
investments at the mean is driven by large effects in one part of the distribution. As such, there
may not be an effect in certain parts of the distribution, or there may even be opposing effects at
different ends of the distribution. Thus, rather than focus solely on the conditional mean of the
dependent variables, I consider how the effects of institutional ownership vary across the
distribution of long-term investments. To address this, I use quantile regression16, which allows
for an examination of the relation between institutional ownership and long-term investments
across the investment distribution. I run quantile regressions by life cycle stage at each decile of
CAPX and R&D. The results are presented in Table 10, and the patterns of the institutional
ownership effects by long-term investment decile and life cycle stage are presented in Figure 4.
I find that the effect of Concentrated institutional ownership on CAPX generally
decreases with the size of CAPX, except in the Mature stage. Further, the effect size is positive or
not significantly different from zero in the Introduction and Decline stages, but negative or not
significantly different from zero in the Growth and Mature stages. However, there is not a
consistent pattern for the effects of Broad ownership on CAPX across deciles of CAPX. For both
Concentrated and Broad ownership, the effects on CAPX are larger in the Introduction and
Decline stages relative to the Growth and Mature stages.
16 Quantile regression estimates conditional quantiles of the dependent variable as linear functions of the
independent variables. I use robust standard errors with kernel density estimation using the Epanechnikov kernel
function for all quantile regression models.
38
For R&D, there is a large density of firms with zero R&D, thus the lower deciles are
generally not significant (the 40th percentile of the R&D distribution is still zero). The effect of
Concentrated institutional ownership on R&D generally decreases with the size of R&D beyond
the 40th percentile. The effect of Broad institutional ownership on R&D follows a concave
pattern across all life cycle stages, and generally starts to decline between the 50th and 70th
percentiles. Thus, across life cycle stages, I find that the effect of institutional ownership in
promoting long-term investments is generally higher at lower levels of investment. This may be
particularly important as firms with lower levels of investment may benefit the most from
increasing their investment levels to expand and grow their operations.
7.2. Long-term effects
For my hypothesis tests (Chapter 4), I examine the relation between the institutional
ownership scores (changes in institutional ownership scores) and contemporaneous long-term
investments (changes in long-term investments), under the assumption that there should be an
effect in the short-run. To the extent that there are long-term effects of institutional ownership on
investment activity, I re-run the models using one-year ahead investments in the relevant
specifications. The results are similar and continue to support earlier inferences. I do find that
some of the significance levels decrease, and the effect of changes in Concentrated ownership on
changes in one-year ahead CAPX for Introduction firms is negative rather than positive.
7.3. Institutional ownership classification using Bushee’s (2001) measures
I also consider Bushee’s (1998, 2001) classification of institutional investors (Bushee
2001; Bushee and Noe 2000). Based on each institution’s past investment behavior (portfolio
turnover, diversification, and investment horizon), Bushee uses a two-stage process involving
factor analysis and cluster analysis to classify each institution as either a dedicated, quasi-
39
indexer, or transient investor. In general, quasi-indexers are diversified with low turnover and a
longer-term horizon, transient investors are diversified with high turnover and a shorter-term
horizon, and dedicated investors are less diversified, with low turnover and a long-term horizon
(Bushee 1998, 2001; Boone and White 2015). This approach results in classification based on
characteristics of the investor’s portfolio. Importantly, I measure institutional ownership from the
firm’s perspective, rather than from the institutional investor’s perspective. Given that managers
are influenced by the set of owners in their specific firm, my approach should provide a more
direct measure with respect to myopia and investment behavior.
The institutional ownership scores I develop also differ from Bushee’s (1998, 2001)
measures in terms of how the measures are constructed. In particular, the measures I develop
(Concentrated and Broad) are orthogonal by construction. In contrast, Dedicated, Quasi-Indexer,
and Transient are all positively correlated (ρ from 0.27 to 0.60 in my sample). In terms of the
association between the sets of institutional ownership measures, Concentrated (Broad) is
correlated 0.58, 0.52, and 0.35 (0.21, 0.58, and 0.39) with Dedicated, Quasi-Indexer, and
Transient, respectively (all p < 0.01).
I re-run the relevant analyses above using Bushee’s institutional investor measures
instead of the Concentrated and Broad measures I develop.17 I find that Quasi-Indexer
ownership is negatively related to CAPX, but none of the other effects are significant for either
the levels or changes specifications. I find that changes in both Quasi-Indexer and Dedicated
17 I run these analyses over the same period (1997–2014) for comparative purposes. For each of the three
institutional classifications I compute the total fraction of shares held in each firm, and then take the average across
quarters to obtain a mean annual fraction. I use Bushee’s permanent classifications (rather than the annual
classifications), which assign the same classification to a fund manager across years based on the modal
classification for each fund manager. Using the permanent classification provides a more consistent classification
across time. Further, due to the requirement of at least two years of data for a fund, the permanent classification
provides a larger sample size by providing a classification for the first two years. The institutional investor
classifications and additional details are provided by Brian Bushee on his website
The values represent the means of the standardized measures for each life cycle stage. The values represent the means of the factor scores by life cycle stage for the two
institutional ownership scores.
Panel C: Long-Term Investments
The values represent the average long-term investments by life cycle stage for CAPX
and R&D.
-0.8
-0.6
-0.4
-0.2
0.0
0.2
0.4
Introduction Growth Mature Shake-Out Decline
Av
g. S
tan
dar
diz
ed V
alu
e
nii block active
actpct blockpct ownhh
lterpct avgown maxhold
-0.8
-0.6
-0.4
-0.2
0.0
0.2
0.4
Introduction Growth Mature Shake-Out Decline
Av
g. F
acto
r S
core
Concentrated Broad
0.0
0.5
1.0
1.5
2.0
2.5
3.0
3.5
Introduction Growth Mature Shake-Out Decline
Av
g. lo
g(I
nv
estm
ent)
CAPX R&D
52
Figure 3: Effects of Institutional Ownership on Long-Term Investments by Life Cycle Stage
Panel A: Effects of Institutional Ownership on Capital
Investments
Panel B: Effects of Institutional Ownership on R&D Investments
The values represent the effects of institutional ownership on capital investments by
life cycle stage. The values represent the effects of institutional ownership on R&D investments by
life cycle stage.
Panel C: Effects of Changes in Institutional Ownership on
Changes in Capital Investments
Panel D: Effects of Changes in Institutional Ownership on
Changes in R&D Investments
The values represent the effects of changes in institutional ownership on changes in
capital investments by life cycle stage. The values represent the effects of changes in institutional ownership on changes in
R&D investments by life cycle stage.
-0.1
0.0
0.1
0.2
0.3
0.4
0.5
Intro Growth Mature Shake-Out Decline
Eff
ect
Siz
e
Concentrated Broad
-0.1
0.0
0.1
0.2
0.3
0.4
0.5
0.6
0.7
Intro Growth Mature Shake-Out Decline
Eff
ect
Siz
e
Concentrated Broad
-0.1
0.0
0.1
0.2
0.3
Intro Growth Mature Shake-Out Decline
Eff
ect
Siz
e
Δ Concentrated Δ Broad
-0.1
0.1
0.2
Intro Growth Mature Shake-Out Decline
Eff
ect
Siz
e
Δ Concentrated Δ Broad
53
Figure 4: Effects of Institutional Ownership on Deciles of Long-Term Investments by Life Cycle Stage
Panel A: Effects of Concentrated Ownership on Capital
Investments
Panel B: Effects of Broad Ownership on Capital Investments
The values represent the effects of Concentrated institutional ownership
on deciles of capital investments by life cycle stage. The values represent the effects of Broad institutional ownership on
deciles of capital investments by life cycle stage.
Panel C: Effects of Concentrated Ownership on R&D Investments Panel D: Effects of Broad Ownership on R&D Investments
The values represent the effects of Concentrated institutional ownership
on deciles of R&D investments by life cycle stage. The values represent the effects of Broad institutional ownership on
deciles of R&D investments by life cycle stage.
-0.10
-0.05
0.00
0.05
0.10
0.10 0.20 0.30 0.40 0.50 0.60 0.70 0.80 0.90
Eff
ect
Siz
e
Decile
Introduction Growth Mature
Shake-Out Decline
0.00
0.10
0.20
0.30
0.40
0.50
0.10 0.20 0.30 0.40 0.50 0.60 0.70 0.80 0.90
Eff
ect
Siz
e
Decile
Introduction Growth Mature
Shake-Out Decline
-0.10
-0.05
0.00
0.05
0.10
0.15
0.20
0.25
0.10 0.20 0.30 0.40 0.50 0.60 0.70 0.80 0.90
Eff
ect
Siz
e
Decile
Introduction Growth Mature
Shake-Out Decline
0.00
0.20
0.40
0.60
0.80
1.00
0.10 0.20 0.30 0.40 0.50 0.60 0.70 0.80 0.90E
ffec
t S
ize
Decile
Introduction Growth Mature
Shake-Out Decline
54
APPENDIX B
TABLES
55
Table 1: Descriptive Statistics
Panel A: Institutional Ownership Measures and Scores, Investments, and Controls
Variable Obs Mean Std. Dev. Min Median Max
Annual
Change
Institutional Ownership Measures
nii 42,189 105.73 148.06 0.25 58.50 1,070.50 81.3%
block 42,189 1.72 1.51 0.00 1.50 6.00 61.1%
active 42,189 4.76 4.33 0.00 3.75 15.00 63.3%
actpct 42,189 0.01 0.01 0.00 0.01 0.10 73.0%
blockpct 42,189 0.15 0.14 0.00 0.12 0.71 70.5%
ownhh 42,189 0.02 0.02 0.00 0.02 0.39 83.0%
lterpct 42,189 0.19 0.20 0.00 0.12 0.71 72.2%
avgown 42,189 0.01 0.01 0.00 0.01 0.12 83.0%
maxhold 42,189 0.09 0.07 0.00 0.09 0.76 82.1%
Dependent Variables
CAPX 42,189 2.78 1.92 0.00 2.55 8.11
R&D 42,189 1.51 1.84 0.00 0.48 6.58
Institutional Ownership Scores
Concentrated 42,189 0.00 0.99 -1.31 -0.15 6.90
Broad 42,189 0.00 0.94 -2.71 -0.23 3.21
Controls
Size 42,189 5.88 1.97 0.26 5.78 11.69
Tangibility 42,189 0.25 0.22 0.00 0.18 0.94
Cash ratio 42,189 0.20 0.22 0.00 0.11 0.98
Leverage 42,189 0.19 0.19 0.00 0.16 0.94
Revenue growth 42,189 0.15 0.56 -0.95 0.07 12.36
ROA 42,189 0.09 0.19 -2.20 0.12 0.53
MTB ratio 42,189 2.46 2.59 0.26 1.69 44.08
Stock return 42,189 1.18 0.79 0.02 1.06 11.00
Price volatility 42,189 4.94 5.23 0.18 3.35 54.45
Trading volatility 42,189 7.55 7.13 0.21 5.38 44.64 This panel provides descriptive statistics for the institutional ownership measures, long-term investments, institutional ownership
scores, and control variables. Variable definitions are provided in Appendix C.
56
Table 1 (cont’d)
Panel B: Descriptive Statistics by Life Cycle Stage
9 maxhold 0.10 0.55 0.16 0.24 0.76 0.89 0.35 0.41 1.00 This panel provides correlations for the institutional ownership measures. Bolded Pearson correlations are significant at the 5% level (two-tailed). Variable definitions are provided
in Appendix C.
Panel B: Correlations between Institutional Ownership Scores, Investments, and Controls
These panels present the results of estimating the effects of institutional ownership on long-term investments separately for each life cycle stage. The values presented in Panels A
and B represent the coefficients for each institutional ownership score, where estimates were made separately for each life cycle stage. Control variables, industry fixed effects, and
year fixed effects are included in the estimation, but are excluded from the table for ease of presentation. Panel A (B) uses capital and R&D investments (changes in capital and
R&D investments) as the dependent variables. ***, **, and * represent statistical significance at the p<0.01, p<0.05, and p<0.10 levels (two-tailed in Panels A and B), respectively.
Variable definitions are provided in Appendix C.
63
Table 6 (cont’d)
Panel C: Capital and R&D Investments (Hypothesis Tests)
These panels present the results of estimating the effects of institutional ownership on long-term investments separately for each life cycle stage. The values presented in Panels C
and D represent the differences in the effects for each institutional ownership score and long-term investment across life cycle stages, and the statistical significance of the
differences. The tests are one-sided, with a predicted positive difference between transitory (Introduction and Decline) stages and sustainable (Growth and Mature) stages
(representing stronger effects in more transitory stages). Control variables, industry fixed effects, and year fixed effects are included in the estimation, but are excluded from the
table for ease of presentation. ***, **, and * represent statistical significance at the p<0.01, p<0.05, and p<0.10 levels (one-tailed in Panels C and D), respectively. Variable
definitions are provided in Appendix C.
64
Table 7: Effects of Institutional Ownership on Long-Term Investments by Changes in Life
Cycle Stage
Panel A: Capital and R&D Investments
DV:
Ownership Scores
Concentrated -0.036 *** -0.043 *** 0.033 * 0.005
Broad 0.264 *** 0.220 *** 0.443 *** 0.392 ***
N 11,498 30,363 11,498 30,363
R2
0.8644 0.8797 0.5490 0.5547
CAPX R&D
Transition Stable Transition Stable
Panel B: Changes in Capital and R&D Investments
DV:
Changes in Scores
Δ Concentrated -0.018 * -0.016 *** 0.001 -0.002
Δ Broad 0.102 *** 0.105 *** 0.054 *** 0.031 ***
N 10,002 25,981 10,002 25,981
R2
0.1111 0.0983 0.0513 0.0445
Δ CAPX Δ R&D
Transition Stable Transition Stable
These panels present the results of estimating the effects of institutional ownership on long-term investments using separate
samples for firms that either remain in the same life cycle stage (Stable) or move to a new life cycle stage in a given year
(Transition). Control variables, life cycle indicators, industry fixed effects, and year fixed effects are included in the estimation,
but are excluded from the table for ease of presentation. Panel A presents the results using capital and R&D investments as the
dependent variables, and Panel B presents the results using changes in capital and R&D investments as the dependent variables.
***, **, and * represent statistical significance at the p<0.01, p<0.05, and p<0.10 levels (two-tailed), respectively. Variable
definitions are provided in Appendix C.
65
Table 8: Stock Indexing Tests using Russell Index Thresholds
These panels present the results of estimating the effect of institutional ownership on long-term investments by life cycle stage using quantile regression. Results are reported
for each decile of the capital investments (Panel A) and R&D investments (Panel B). ***, **, and * represent statistical significance at the p<0.01, p<0.05, and p<0.10 levels
(two-tailed), respectively.
69
APPENDIX C
VARIABLE DEFINITIONS
70
Table 11: Variable Definitions
Institutional Ownership Measures
nii = the number of institutional investors in each firm (averaged across quarters).
(Thomson Reuters)
block = the number of blockholders in each firm that own more than 5% of the firm’s
outstanding stock (averaged across quarters). (Thomson Reuters)
active = the number of activist investors, as identified by Cremers and Nair (2005) and
Larcker et al. (2007), in each firm (averaged across quarters). (Thomson Reuters)
actpct = the percentage of each firm’s outstanding stock held by activist investors (averaged
across quarters). (Thomson Reuters)
blockpct = the percentage of each firm’s outstanding stock held by blockholders (averaged
across quarters). (Thomson Reuters)
ownhh = the sum of the squared ownership stakes of all institutions owning stock in each firm
(averaged across quarters). (Thomson Reuters)
lterpct = the percentage of each firm’s outstanding stock held by long-term institutional
investors, where long-term holdings are defined as at least eight continuous
quarters (averaged across quarters). (Thomson Reuters)
avgown = the average ownership stake of an institutional investor in each firm, measured as a
percentage (averaged across quarters). (Thomson Reuters)
maxhold = the largest institutional holding in each firm, measured as a percentage. (Thomson
Reuters)
Institutional Ownership Scores
Concentrated = the standardized factor score for the first factor from a factor analysis of 9
institutional ownership measures, with positive loadings on block, blockpct,
ownhh, maxhold, and avgown. (Thomson Reuters)
Broad = the standardized factor score for the second factor from a factor analysis of 9
institutional ownership measures, with positive loadings on nii, active, actpct, and
lterpct, and a negative loading on avgown. (Thomson Reuters)
Long-Term Investments
CAPX = the log of 1 plus capital expenditures, where all missing values are coded as 0 [log(1
+ capx)]. (Compustat)
R&D = the log of 1 plus R&D expense, where all missing values are coded as 0 [log(1 +
xrd)]. (Compustat)
Life Cycle Stage
Introduction = an indicator variable equal to 1 if a firm is classified in the Introduction stage in a
given year, and 0 otherwise. (Compustat)
Growth = an indicator variable equal to 1 if a firm is classified in the Growth stage in a given
year, and 0 otherwise. (Compustat)
Mature = an indicator variable equal to 1 if a firm is classified in the Mature stage in a given
year, and 0 otherwise. (Compustat)
Shake-Out = an indicator variable equal to 1 if a firm is classified in the Shake-Out stage in a
given year, and 0 otherwise. (Compustat)
Decline = an indicator variable equal to 1 if a firm is classified in the Decline stage in a given
year, and 0 otherwise. (Compustat)
71
Table 11 (cont’d)
Controls
Size = the natural log of total assets in t–1. (Compustat)
Tangibility = the ratio of net property, plant, and equipment to total assets in t–1. (Compustat)
Cash ratio = the ratio of cash to total assets in t–1. (Compustat)
Leverage = the ratio of long-term debt and debt in current liabilities to total assets in t–1.
(Compustat)
Revenue growth = the change in revenue divided by revenue in t–1. (Compustat)
ROA = the ratio of operating income before depreciation to average (t to t–1) total assets.
(Compustat)
MTB ratio = the ratio of the market value to book value. (Compustat)
Stock return = the annual stock return. (Compustat)
Price volatility = the standard deviation of daily stock prices in a given year. (CRSP)
Trading volatility = the ratio of average trading volume to average shares outstanding in a given year.
(CRSP)
Russell Indexing Variables
R2000 = an indicator variable equal to 1 if a firm is classified in the Russell 2000 index in a
given year, and 0 otherwise. (FTSE Russell)
Distance = the rank distance from the Russell 1000/2000 threshold in a given year. (FTSE
Russell)
Investment Efficiency Variables
OverFirm = the average of the scaled cash balances (or cash ratios) and leverage, where each
measure is scaled to range between 0 and 1 after creating ranked deciles by year
and Fama-French 12-industry (leverage is multiplied by –1 so that both sets of
deciles are increasing in the propensity toward over-investment). (Compustat)
Data sources are provided in parentheses after the variable description.
72
REFERENCES
73
REFERENCES
Abarbanell, J. S., B. J. Bushee, and J. S. Raedy. 2003. Institutional investor preferences and price
pressure: The case of corporate spin-offs. Journal of Business 76(2), 233–261.
Aggarwal, R., I. Erel, M. Ferreira, and P. Matos. 2011. Does governance travel around the
world? Evidence from institutional investors. Journal of Financial Economics 100, 154–181.
Aghion, P., J. Van Reenen, and L. Zingales. 2013. Innovation and institutional ownership. The
American Economic Review 103(1), 277–304.
Anthony, J. H., and K. Ramesh. 1992. Association between accounting performance measures
and stock prices. Journal of Accounting and Economics 15, 203–227.
Appel, I. R., T. A. Gormley, and D. B. Keim. 2016. Passive investors, not passive owners.
Journal of Financial Economics 121, 111–141.
Atanassov, J. 2013. Do hostile takeovers stifle innovation? Evidence from antitakeover
legislation and corporate patenting. The Journal of Finance 68(3), 1097–1131.
Balogh, A. 2016. Does life-cycle influence board composition? Working Paper, The University
of Sydney Business School.
Beaver, W., M. McNichols, and R. Price. 2007. Delisting returns and their effect on accounting-
based market anomalies. Journal of Accounting and Economics 43, 341–368.
Bebchuk, L, A., and A. Hamdani. 2009. The elusive quest for global governance standards.
University of Pennsylvania Law Review 157, 1263–1317.
Bebchuk, L, A., and M. S. Weisbach. 2010. The state of corporate governance research. The
Review of Financial Studies 23(3), 939–961.
Bertrand, M., and S. Mullainathan. 2003. Enjoying the quiet life? Corporate governance and
managerial preferences. Journal of Political Economy 111(5), 1043–1075.
Bhagat, S., B. Bolton, and R. Romano. 2008. The promise and peril of corporate governance
indices. Columbia Law Review 108(8), 1803–1882.
Biddle, G. C., G. Hilary, and R. S. Verdi. 2009. How does financial reporting quality relate to
investment efficiency? Journal of Accounting and Economics 48, 112–131.
Biktimirov, E. N., A. R. Cowan, and B. D. Jordan. 2004. Do demand curves for small stocks
slope down? The Journal of Financial Research 27(2), 161–178.
Boone, A. L. and J. T. White. 2015. The effect of institutional ownership on firm transparency
and information production. Journal of Financial Economics 117, 508–533.
74
Brav, A., J. R. Graham, C. R. Harvey, and R. Michaely. 2005. Payout policy in the 21st century.
Journal of Financial Economics 77, 483–527.
Bruggen, A., R. Krishnan, and K. L. Sedatole. 2011. Drivers and consequences of short-term
production decisions: Evidence from the auto industry. Contemporary Accounting Research
28(1), 83–123.
Bushee, B. J. 1998. The influence of institutional investors on myopic R&D investment
behavior. The Accounting Review 73(3), 305–333.
Bushee, B. J. 2001. Do investors prefer near-term earnings over long-run value? Contemporary
Accounting Research 18(2), 207–246.
Bushee, B., and T. Goodman. 2007. Which institutional investors trade based on private
information about earnings and returns? Journal of Accounting Research 45, 289–321.
Bushee, B., and C. Noe. 2000. Corporate disclosure practices, institutional investors, and stock
return volatility. Journal of Accounting Research 38, 171–202.
Cadman, B., and J. Sunder. 2014. Investor horizon and CEO horizon incentives. The Accounting
Review 89(4), 1299–1328.
Cardinal, L. B., S. B. Sitkin, and C. P. Long. 2004. Balancing and rebalancing in the creation and
evolution of organizational control. Organization Science 15(4), 411–431.
Chang, H. S., and L. Y. Li. 2016. Firm life cycle and detection of accrual-based earnings
manipulation. Working Paper, Singapore Management University and University of Illinois at
Urbana-Champaign.
Chang, Y.-C., H. Hong, and I. Liskovich. 2015. Regression discontinuity and the price effects of
stock market indexing. The Review of Financial Studies 28(1), 212–246.
Chen, H. 2011. Firm life expectancy and the heterogeneity of the book-to-market effect. Journal
of Financial Economics 100, 402–423.
Chen, H., G. Noronha, and V. Singal. 2006. Index changes and losses to index fund investors.
Financial Analysts Journal 62(4), 31–47.
Chen, X., J. Harford, and K. Li. 2007. Monitoring: Which institutions matter? Journal of
Financial Economics 86, 279–305.
Chen, Y., S. G. Rhee, M. Veeraraghavan, and L. Zolotoy. 2015. Stock liquidity and managerial
short-termism. Journal of Banking & Finance 50, 44–59.
Cheng, M., D. Dhaliwal, and Y. Zhang. 2013. Does investment efficiency improve after the
disclosure of material weaknesses in internal control over financial reporting? Journal of
Accounting and Economics 56, 1–18.
75
Cohen, D. A., A. Dey, and T. Z. Lys. 2008. Real and accrual-based earnings management in the
pre- and post-Sarbanes-Oxley periods. The Accounting Review 83(3), 757–787.
Crane, A. D., S. Michenaud, and J. P. Weston. 2016. The effect of institutional ownership on
payout policy: Evidence from index thresholds. The Review of Financial Studies 29(6), 1377–
1408.
Cremers, K. J. M., and V. B. Nair. 2005. Governance mechanisms and equity prices. The Journal
of Finance 60(6), 2859–2894.
Daniel, N. D., D. J. Denis, and L. Naveen. 2010. Sources of financial flexibility: Evidence from
cash flow shortfalls. Working Paper, Drexel University, Purdue University, and Temple
University.
DeAngelo, H., L. DeAngelo, and R. M. Stulz. 2006. Dividend policy and the earned/contributed
capital mix: A test of the life-cycle theory. Journal of Financial Economics 81, 227–254.
Dedman, E., and I. Filatotchev. 2008. Corporate governance research: A contingency framework.
International Journal of Managerial Finance 4(4), 248–258.
Dey, A. 2008. Corporate governance and agency conflicts. Journal of Accounting Research
46(5), 1143–1181.
Dichev, I. D., J. R. Graham, C. R. Harvey, and S. Rajgopal. 2013. Earnings quality: Evidence
from the field. Journal of Accounting and Economics 56, 1–33.
Dickinson, V. 2011. Cash flow patterns as a proxy for firm life cycle. The Accounting Review
86(6), 1969–1994.
Drake, K. D., and M. A. Martin. 2016. Implementing relative performance evaluation: The role
of life cycle peers. Working Paper, University of Arizona and University of Illinois – Chicago.
Drake, K. D., and M. A. Martin. 2015. Executive compensation: A firm life cycle analysis.
Working Paper, University of Arizona and University of Illinois – Chicago.
Eberhart, A. C., W. F. Maxwell, and A. R. Siddique. 2004. An examination of long-term
abnormal stock returns and operating performance following R&D increases. The Journal of
Finance 59(2), 623–650.
Edmans, A. 2009. Blockholder trading, market efficiency, and managerial myopia. The Journal
of Finance 64(6), 2481–2513.
Edmans, A. 2014. Blockholders and corporate governance. Annual Review of Financial
Economics 6, 23–50.
Edmans, A., V. W. Fang, and K. A. Lewellen. 2016. Equity vesting and investment. Working
Paper, London Business School, University of Minnesota, and Dartmouth College.
76
Erickson, T., and T. M. Whited. 2006. On the accuracy of different measures of q. Financial
Management 35(3), 5–33.
Faff, R., W. C. Kwok, E. J. Podolski, and G. Wong. 2016. Do corporate policies follow a life-
cycle? Journal of Banking & Finance 69, 95–107.
Fang, V. W., X. Tian, and S. Tice. 2014. Does stock liquidity enhance or impede firm
innovation? The Journal of Finance 69(5), 2085–2125.
Fich, E. M., J. Harford, and A. L. Tran. 2015. Motivated monitors: The importance of
institutional investors’ portfolio weights. Journal of Financial Economics 118, 21–48.
Filatotchev, I, S. Toms, and M. Wright. 2006. The firm’s strategic dynamics and corporate
governance life-cycle. International Journal of Managerial Finance 2(4), 256–279.
FTSE Russell. 2016. Construction and Methodology: Russell U.S. Equity Indexes v2.2. Accessed
October 12, 2016. http://www.ftse.com/products/downloads/Russell-US-