econstor Make Your Publications Visible. A Service of zbw Leibniz-Informationszentrum Wirtschaft Leibniz Information Centre for Economics Andreula, Nicolo; Chong, Alberto; Guillen, Jorge Working Paper Institutional Quality and Fiscal Transparency IDB Working Paper Series, No. IDB-WP-125 Provided in Cooperation with: Inter-American Development Bank (IDB), Washington, DC Suggested Citation: Andreula, Nicolo; Chong, Alberto; Guillen, Jorge (2009) : Institutional Quality and Fiscal Transparency, IDB Working Paper Series, No. IDB-WP-125, Inter-American Development Bank (IDB), Washington, DC This Version is available at: http://hdl.handle.net/10419/89153 Standard-Nutzungsbedingungen: Die Dokumente auf EconStor dürfen zu eigenen wissenschaftlichen Zwecken und zum Privatgebrauch gespeichert und kopiert werden. Sie dürfen die Dokumente nicht für öffentliche oder kommerzielle Zwecke vervielfältigen, öffentlich ausstellen, öffentlich zugänglich machen, vertreiben oder anderweitig nutzen. Sofern die Verfasser die Dokumente unter Open-Content-Lizenzen (insbesondere CC-Lizenzen) zur Verfügung gestellt haben sollten, gelten abweichend von diesen Nutzungsbedingungen die in der dort genannten Lizenz gewährten Nutzungsrechte. Terms of use: Documents in EconStor may be saved and copied for your personal and scholarly purposes. You are not to copy documents for public or commercial purposes, to exhibit the documents publicly, to make them publicly available on the internet, or to distribute or otherwise use the documents in public. If the documents have been made available under an Open Content Licence (especially Creative Commons Licences), you may exercise further usage rights as specified in the indicated licence. www.econstor.eu
Transcript
econstorMake Your Publications Visible.
A Service of
zbwLeibniz-InformationszentrumWirtschaftLeibniz Information Centrefor Economics
Andreula, Nicolo; Chong, Alberto; Guillen, Jorge
Working Paper
Institutional Quality and Fiscal Transparency
IDB Working Paper Series, No. IDB-WP-125
Provided in Cooperation with:Inter-American Development Bank (IDB), Washington, DC
Suggested Citation: Andreula, Nicolo; Chong, Alberto; Guillen, Jorge (2009) : InstitutionalQuality and Fiscal Transparency, IDB Working Paper Series, No. IDB-WP-125, Inter-AmericanDevelopment Bank (IDB), Washington, DC
This Version is available at:http://hdl.handle.net/10419/89153
Standard-Nutzungsbedingungen:
Die Dokumente auf EconStor dürfen zu eigenen wissenschaftlichenZwecken und zum Privatgebrauch gespeichert und kopiert werden.
Sie dürfen die Dokumente nicht für öffentliche oder kommerzielleZwecke vervielfältigen, öffentlich ausstellen, öffentlich zugänglichmachen, vertreiben oder anderweitig nutzen.
Sofern die Verfasser die Dokumente unter Open-Content-Lizenzen(insbesondere CC-Lizenzen) zur Verfügung gestellt haben sollten,gelten abweichend von diesen Nutzungsbedingungen die in der dortgenannten Lizenz gewährten Nutzungsrechte.
Terms of use:
Documents in EconStor may be saved and copied for yourpersonal and scholarly purposes.
You are not to copy documents for public or commercialpurposes, to exhibit the documents publicly, to make thempublicly available on the internet, or to distribute or otherwiseuse the documents in public.
If the documents have been made available under an OpenContent Licence (especially Creative Commons Licences), youmay exercise further usage rights as specified in the indicatedlicence.
www.econstor.eu
IDB WORKING PAPER SERIES # IDB-WP-125
Institutional Quality and Fiscal Transparency
Nicoló Andreula Alberto Chong Jorge Guillén
Inter-American Development Bank
Department of Research and Chief Economist
December 2009
Institutional Quality and Fiscal Transparency
Nicoló Andreula Alberto Chong Jorge Guillén
Inter-American Development Bank 2009
Cataloging-in-Publication data provided by the Inter-American Development Bank Felipe Herrera Library Andreula, Nicoló.
Institutional quality and fiscal transparency / Nicoló Andreula, Alberto Chong, Jorge Guillén. p. cm. (IDB working paper series ; 125) Includes bibliographical references. 1. Transparency in government. 2. Finance, Public. 3. Public administration. I. Chong, Alberto. II. Guillén, Jorge. III. Inter-American Development Bank. Research Dept. IV. Title. V. Series. JC598 .A52 2009 352.88 A553—dc22
This paper uses new data on fiscal transparency for a cross-section of countries; these data possess several advantages. First, the data are based on in-depth reports using a standardized methodology and protocol. Second, this study covers 82 countries, more than previous comparable studies. Third, the fiscal measures used have been obtained with the collaboration of government authorities, which makes them particularly reliable. Finally, the data collection has been undertaken at a high level. These new data permit examination of a relevant but little-studied issue, the role of institutional quality in a country’s fiscal transparency. It is shown that there is in fact a causal relationship between institutions and transparency. The findings are robust to changes in specification and a host of transparency sub-measures. Keywords: Fiscal management, Institutions, Public administration, Transparency JEL Classifications: H50, H83
* Nicoló Andreula is affiliated with Bocconi University. Alberto Chong is affiliated with the Research Department of the Inter-American Development Bank. Jorge Guillén is affiliated with CENTRUM Business School, Pontificia Universidad Católica del Perú We acknowledge comments, suggestions, and assistance from Gabriela Carbajal, Marina Duque, Gianmarco León, Gonzalo Llosa, Michelle Pérez, and Vanessa Rios. Arturo Galindo, Ugo Panizza, and Luisa Zanforlin provided useful comments. Our findings do not necessarily represent the views of the Inter-American Development Bank. Corresponding author: Chong: 1300 New York Ave. N.W. Stop SE-1046, Washington D.C. 20577, USA. Tel: (202) 623-1536; Fax: (202) 623-2481. E-mail: [email protected]
1. Introduction Despite the worldwide attention that transparency has received in the last decade, empirical
studies on its determinants are still quite limited. In recent years scholars and financial
institutions have concentrated their studies on the positive effects of fiscal transparency such as
improved access to international capital markets, the attraction of foreign direct investment,
prevention of financial crises and reduction of interest rate spreads. As is often the case, light
was shed on the topic following hard shocks; for instance, both the Mexican (1994) and Asian
(1997) crises became turning points in the debate, raising concerns about the possible impacts of
a lack of transparency. Starting from the reasonable expectation that policy recommendations
which solely emphasize economic factors while disregarding institutional concerns may be
unsubstantiated, we investigate the role of the institutional environment in shaping the
informational structure of various national fiscal systems.
Kopits and Craig (1998) identify fiscal transparency as “openness toward the public at
large about government structure and functions, fiscal policy intentions, public sector accounts,
and projections. It involves ready access to reliable, comprehensive, timely, understandable, and
internationally comparable information on government activities so that the electorate and
financial markets can accurately assess the government’s financial position and the true costs and
benefits of government activities, including their present and future economic and social
implications.”
Some researchers study the relationships between fiscal transparency and fiscal
performances and/or other macroeconomic indicators, providing several explanations and
different theories rather than a unique and shared answer. For instance, Hameed (2005) runs a
cross-country regression with 57 observations and concludes that transparency matters for credit
rankings in the sense that they are positively related to transparency, and that countries with
higher fiscal transparency general index have better fiscal discipline. Jarmuzek (2006) assesses
the role of fiscal transparency in establishing better fiscal discipline. Considering 27 ex-socialist
countries, he finds a negative, although weak, relationship between fiscal transparency and debt
accumulation. Furthermore, he finds that there is no statistically significant evidence supporting
the importance of fiscal transparency in determining fiscal performance, and only marginal
significance when correcting for endogeneity. Incidentally, Gleich (2003) shows that budget
procedures which reduce collective action problems in Eastern Europe are associated with
2
increased fiscal discipline. Milesi-Ferreti (2004) studies the interactions between fiscal
transparency and fiscal rules, focusing on the effects of the Maastricht Treaty on EU member
countries. He finds that fiscal transparency shapes fiscal performance, as a highly transparent
fiscal context makes politicians implement the measures necessary to balance the budget. Alt and
Lassen (2006) show that fiscal transparency reduces public debt and deficits, even after
controlling for political variables like common law history, political competition, and
presidential system. Ferejohn (1999) models transparency as a constitutional choice of an
information structure. At the beginning of every period the incumbent chooses the degree of
precision of the signal perceived by the electors (principals), knowing that in most cases this
informational accuracy would be directly proportional to the amount of resources that voters
would be willing to allocate to politicians. Agents who want to manage a larger amount of public
goods will raise fiscal transparency levels in order to be perceived as more trustworthy by voters
who will eventually give them more resources. Alt and Lowry (1994) argue that democrats
increase transparency to achieve their preferred higher amount of public goods, while Alt,
Lassen and Rose (2006) focus on the determinants of fiscal transparency by exploring its
political and economic causes. They suggest that both politics and fiscal policy outcomes
influence transparency levels.
We use new data on fiscal transparency (FT) for a cross-section of countries, and these
data possess several advantages. First, they are based on in-depth reports using a standardized
methodology and protocol. Second, this is the first study that has such large country coverage, 82
in total. Third, the fiscal measures have been obtained with the collaboration of government
authorities, which makes them particularly reliable. Finally, the data collection has been
undertaken at a high level. Thus, the main contribution of this paper is the provision of a new
index of FT, constructed by translating in numerical values the qualitative information presented
in 82 countries’ Reports on the Observance of Standards and Codes (ROSCs), issued by the
International Monetary Fund. Additionally, we have assembled three sub-indicators according to
the following categories: clarity and assurances of information, roles and responsibility
(Quality&Resp), open budget preparation (BudgPrep), and public availability of information
(InfoAvail).
We find that better institutions yield higher levels of fiscal transparency, and different
aspects of the institutional framework have different impacts on our disaggregated fiscal
3
transparency measures. Furthermore, we corrected for endogeneity by employing an instrumental
variables approach. The rest of the paper is organized as follows. Section 2 defines fiscal
transparency, reviewing the relevant literature, explains our methodological strategy and presents
our dataset. Section 3 presents and discusses empirical results and robustness checks. Section 4
concludes.
2. Data and Empirical Approach We use new data from the IMF’s Reports on the Observance of Standards and Codes (ROSCs).
Many of the authors reviewed so far have concentrated their attention on particular categories of
countries or limited geographical areas, either because of the focus of their study or because of
difficulties in providing a standardized measure of fiscal transparency for countries belonging to
different social, political and economic contexts.1 ROSCs, however, provide a feasible means of
constructing a standardized measure of fiscal transparency in diverse countries: regardless of the
nation analyzed, these reports are always written with the same methodology and under the same
criteria. Hameed (2005), for instance, uses this source based on the IMF’s Code to develop
fiscal transparency indices for 57 countries. His indices look at FT from four different
execution reporting (BEX); and iv) fiscal risk disclosures (FR). Following the approach of Allan
and Perry (2003), Hameed considers 20 different items (e.g., quasi-financial activities,
contingent liabilities or tax expenditure) and gives each of them a mark between 0 and 1
according to the evaluation presented in the Reports.
Our index of FT is calculated for 82 countries, and to the best of our knowledge no other
contribution in the literature has encompassed such a large sample. We started from the “Code of
Good Practises on Fiscal Transparency” revised by the IMF in 2007, which contains 45 good
practices summarized in one sentence each, and we selected 39 of them as the most relevant for
1 Jarmuzek et al. (2006) construct an index consisting of five clusters, including (1) medium-term budgeting and analysis, (2) accounting and data quality, (3) extra-budgetary fiscal operations, (4) intergovernmental relations, and (5) the role of auditing in the budgetary process and the importance of the Ministry of Finance over spending ministries. Guerrero (2001) uses an index of budget transparency a\developed by a group of civil and academic institutions for four Latin American countries focusing on: participation and elaboration of the budget, oversight, accountability and access to information. Gleich (2003) uses survey data for ten Eastern European countries and develops four indices that capture the stages of the budget process. Alt et al. (2006) code survey responses for nine budget procedures and create a transparency index. Allan and Perry (2003) go through the ROSCs for most of the European Union (EU) accession candidate countries and focus on medium-term frameworks, accounting, reporting and oversight standards, off budget activities and fiscal risks, and intergovernmental fiscal relations.
4
our purpose and the most frequently evaluated.2 We then examined the ROSCs to see the extent
to which each country followed IMF recommendations in each selected practice, assigning a
mark between zero and ten: for example, “0” corresponds to “code not observed at all”; we
marked “2” if the country’s adherence to IMF suggestion was only minimal, “4” if it was limited,
“6” if the Code was followed only partly, “8” if mostly followed, and “10” if the IMF’s
recommendations for that practice were totally respected. Our FT index is nothing but the mean
of the marks assigned for each practice. Although the 2007 revision of the Code aggregates
practices into four main clusters (clarity of roles and responsibilities, open budget processes,
public availability of information, assurance of integrity), we see fiscal transparency as threefold
and therefore aggregate practices into three sub-indices: clarity and assurances of information,
roles and responsibility (Quality&Resp), open budget preparation (BudgPrep), and public
availability of information (InfoAvail).
The latter sub-index (InfoAvail) aims to measure the extent to which in every country the
public is provided with comprehensive information on past, current and projected fiscal activity
and on all major risk, and if a commitment is made to timely publications. This sub-index
additionally evaluates the extent to which fiscal information is presented in a way that facilitates
policy analysis and promotes accountability. The first sub-index (Quality&Resp) evaluates how
each country adheres to the following principles: “the government sector should be distinguished
from the rest of the public sector; there should be an open legal, regulatory and administrative
framework for fiscal management; fiscal data should meet accepted data quality standards; fiscal
activities should be subject to effective internal oversight and safeguards; fiscal information
should be externally scrutinized.” Lastly, BudgPrep is a proxy that measures how clear national
procedures are for budget execution, monitoring and reporting, as well as rating how much
budget preparation follows an established timetable and is guided by well-defined
macroeconomic and fiscal policy objectives (IMF Revised Code, 2007). Table 1 shows in detail
the composition of each index, while for a detailed description of each single topic we refer to
the IMF ROSC website (http://www.imf.org/external/np/rosc/rosc.asp). Finally it is useful to
point out that, due to the availability of the data, the sub-indices are calculated in different years 2 Not all the ROSCs of every country contain all the information required, especially the oldest ones, so some countries might have a higher number of practises evaluated compared to other ones, but we believe that this issue does not substantially change our results. When we consider only the practices evaluated for every country our results are substantially unchanged.
where α is a constant, βs are the coefficients, CONTINENT is a vector of territorial dummies and
εi is an uncorrelated error with mean zero (for explanation of the other controls see below).3 All
the explanatory variables are expressed as an average for the decade 1990-2000 (for available
years), with the purpose of reducing reverse causality biases and leaving a reasonable span of
time between the causes of the approval transparency-enhancing reforms and their effect on
fiscal systems. In terms of the quality of institutions—our main explanatory variable, InstQual—
we refer to the governance indicators developed by Kaufmann, Kraay and Zoido-Lobatón
(2003). Combining both large opinion surveys and measures based on polls of experts, the
authors define governance using six clusters of variables: voice and accountability
(Voice&Account), political instability and violence (PolStab), government effectiveness
(GovEff), regulatory burden (RegBurden), rule of law (RuLaw) and control of corruption
(ContrCorrupt). The first two variables capture the process by which authorities are selected and
replaced; they include indicators that measure aspects of the political process, civil liberties, and
political rights, intended to assess the extent to which citizens are able to participate in the
3 The areas considered are Europe, Africa, Asia, Middle East, Oceania, North America and South America. All the regression are calculated with heteroskedasticity robust – standard errors. Results are basically unchanged if we use the assumption of homoskedasticity Additionally, we also augmented the latter specification with more macro and demographic controls, considering two more equations: FTi = α+ β1* logGDPi + β2* INSTQUAL + β3* DEFICITi + β4* INFLATIONi + β5* MAJORITYi + β6* GOVFRACi + β7* ETFRAi + β8* DEBTi + γ * CONTINENT + εi and FTi= α+ β1* logGDPi + β2* INSTQUAL + β3* DEFICITi + β4* INFLATIONi + β5* MAJORITYi + + β6* GOVFRACi + β7* ETFRAi + β8* DEBT + β9* URBANPOPi + β8* AGEPOP + γ* CONTINENT + εi
6
selections of governments. In particular, PolStab measures perceptions of the likelihood that the
government in power will be destabilized or removed by possibly unconstitutional or violent
mechanisms. The next two clusters refer to the ability of the government to formulate and
implement policies. While GovEff encompasses perceptions of the quality of the provision of
public services,4 RegBurden focuses more on policies themselves, including whether those
policies are market-friendly or so excessively regulatory that they become an obstacle or burden
for trade, business and development. The last group indicates the level of respect that citizens
have for the state and national institutions, focusing specifically on rule of law (RuLaw)
enforcement and control of corruption (ContrCorrupt).5 Using an unobserved components
model that expresses the observed data as a linear function of unobserved governance plus a
disturbance term capturing perception errors and/or sample variation in each indicator,
Kaufmann, Kraay and Zoido-Lobatón aggregate the governance indicators into each of the six
dimensions mentioned above. To arrive at an aggregate governance indicator, which we label
quality of institutions (InstQual), we compute the mean of these values for each country. It is
worth mentioning that these variables lack temporal coverage, as they have only been calculated
since 1996 and are not available on an annual basis. The scores range from –2.5 to 2.5, and we
take the average of the available values from 1996 to 2004. Again, the higher the value, the
better the institutional quality indicator. Below, in the robustness checks section, we will also
consider some variables contained in the well known Polity V database (Jaggers and Moore,
1995) and the International Country Risk Guide (ICRG, 2006).6
There is almost no ambiguity in predicting the sign of the coefficient β2 of our
institutional variable, intuitively expected to be positive and significant: in fact, politicians might
have more incentives to promote FT in a sounder institutional context. More informed public
opinion, a more efficient and honest bureaucracy, rule of law and control of corruption could
4 GovEff synthesizes features such as the quality of the bureaucracy, the competence of civil servants, the independence of the civil servants from political pressures, and the credibility of the government. 5 RuLaw represents the extent to which citizens have confidence and abide by the rules of society such as the effectiveness and predictability of the judiciary, or the enforceability of contracts; cc refers to the perception of the degree of prevention of the exercise of public power for private gains. 6 The latter furnishes proxies to measure the extent to which various relevant institutional aspects are in place for a given country: government stability, military in power, law and order, control of corruption and quality of the bureaucracy. From the former database (Polity V), we borrowed the proxies POLITY2 and DEMOC, annual indices based on three categories that try to account for different aspects characteristics of a democracy: executive recruitment, responsiveness or independence of the executive authority and extent of political competition or opposition.
7
more severely punish bribes and electoral clientelism, practices that might be facilitated by low
levels of fiscal transparency. We include income as an explanatory variable since GDP per capita
levels can affect fiscal transparency. Richer countries can afford better informational systems,
and they might have greater incentives to publicize their better results. LogGDP, expressed in
constant year 2000 dollars, is considered in log because we found this non-linear function to
have a better explanatory power in terms of R-squared. This variable is taken from the World
Development Indicators database by the World Bank, which is the source of all our macro and
demographic variables, apart from Deficit, which is taken from the IMF database. Following the
literature (particularly Alt, Lassen and Rose, 2006), we consider deficit and debt (both expressed
as a percentage of annual GDP) because poor fiscal performances could lead citizens to be more
demanding of government transparency. DEBT is included only in equation (2) because it is not
available for some countries and reduces the number of observations (from 78 to 65) included in
our regressions. Additionally, we control for some demographic variables most likely to affect
electorate’s overall responsiveness: percentage of population living in urban areas, Urbanpop,
and percentage of people aged between 14 and 65, Agepop.
We also included some political controls widely used in literature; they are taken from
the WGI database (World Bank and Beck et al., 2006). The literature predicts FT levels to be
higher in countries where electoral competition is stronger, i.e., where the executive has a lower
percentage of parliament seats (majority) compared to other countries. In fact, Hanssen (2004)
finds that stiffer electoral competition positively affects the independence of (judiciary)
institutions, and the same might happen to fiscal transparency.7 We therefore include two
proxies of political competition: the margin of votes (in percentage) of the majority in power and
government fractionalization.8
7 Alt, Lassen and Rose (2006) note a parallelism between transparency reforms and Hanssen’s delegation model (2004), where there are two parties competing for authority and the incumbent can choose to delegate policy choice to an independent institution, the judiciary. 8 A priori, the effect of government fractionalization on fiscal transparency is ambiguous. If the government is composed by many parties, each of them would like to use public goods to pursue its own clientelistic interests, being sure that being accountable for, say, deficits, inefficiencies or bad performances is more difficult than in a one-party system, so reaching an agreement on reforms that open up the budget process to the public would be more difficult with many parties in power. Conversely, incumbents may prefer to have less discretion over public goods but limit the misuse of them by other incumbents (with whom they share office); thereby the fractionalized government could internally reach a compromise to manage resources in a transparent framework. Hypothetically, each ruling party might also be willing to let voters identify clearly who has done what in the government and open up the budget process to the electors. Alternatively, we could consider government fractionalization another measure
8
Lastly, drawing on the predictions of Alt and Lassen (2006), we could expect that the
higher the political polarization, the less similar the preferences of opposite parties, and the
higher the benefits of tying the hands of a partisan adversary. Nonetheless, these authors note
that, while general agreement among political parties is needed in order to approve transparency-
enhancing reforms, the probability of reaching a compromise might be inversely proportional to
the distance between parties in the political/ideological spectrum. Since we cannot predict ex
ante the sign of the coefficient of polarization, following Aghion, Alesina and Trebbi (2004) we
approximate political polarization with ethnic fractionalization.9
3. Findings Table 4 presents simple correlations among our dependent variables and the institutional
indicators. As can be observed, not only are the signs consistent with the logic that better
institutions yield higher levels of fiscal transparency, but also the degree of correlation is quite
strong, and in all cases it is statistically significant at the 1 percent level. Figure 1 shows this
positive relationship between the index of fiscal transparency and the quality of institutions
indicator, both in aggregate terms. The first three columns of Table 5 present results for our OLS
regression, considering specifications (1), (2) and (3), respectively. The dependent variable is
always our summary index of fiscal transparency, FT. As expected, in the OLS regression the
InstQual coefficient is always highly significant at 1 percent level. The coefficient of Deficit in
columns (2) and (3) is positive and significant, consistent with the findings of Alt, Lassen and
Rose (2006). LogGDP is significant only when we run our benchmark regression (1), ceasing to
be significant when more controls are included.
We acknowledge that our OLS estimation can suffer from endogeneity problems,
particularly regarding variables such as InstQual, logGDP, and Deficit. This problem is
encountered in much of the literature; for example, Petrie (2003) or Hameed (2005). As
mentioned above, in order to reduce reverse causality problems, all our macro-economic controls
are expressed as the mean value of the decade 1990-2000, while FT indices refer at least to the
of political competition, i.e., competition is so stiff that no party has the majority necessary to rule by itself and alliances are needed. 9 Governance indicators and fiscal transparency may be endogenous, but we will use 2SLS regression (see below) to isolate the effect only in one direction, from institutions to transparency, as well as to control for the endogeneity of some macro variables like income, deficit and debt.
9
year 2001 onwards. We are still aware of the correlation between current levels and those of the
recent past, so we control for endogeneity by running some two-stage least square (2SLS)
regressions, instrumenting for the suspected endogenous variables with proxies widely used in
the literature. We considered five possible instruments, but we decided to use only religious
affiliation and legal system origin. We additionally instrument our possibly endogenous variables
with settlers’ mortality, latitude and ethnic fractionalization.10
Easterly and Levine (1997) and Alesina et al. (2003) have shown that ethnic
heterogeneity negatively affects institutions and subsequently GDP levels because the more
ethnically fractionalized a country is, the more often dominant groups would shape governmental
policies in order to expropriate from ethnic losers, restricting their freedom of opposition and
limiting the production of public goods to prevent those outside the ruling group from benefiting
and getting stronger (La Porta et al., 1998). Using ethnic fractionalization (ETFRA) as an
instrument could create at least two problems: endogeneity and flaws in the exclusion restriction
(i.e., significance of the instrument coefficient in the second-stage regression). The latter happens
if ethnic fractionalization has a direct effect on FT: in that case, it cannot be considered a good
instrument. But how could ETFRA affect FT apart from shaping institutions? If we follow
Aghion, Alesina and Trebbi (2004) in considering ETFRA as an exogenous measure of political
polarization or political fragmentation, then, as argued by Alt, Lassen and Rose (2006), it could
have a significant impact on politicians’ incentives to approve transparency-enhancing reforms,
as discussed above.
La Porta et al. (1998) use legal system origins to estimate the quality of institutions, by
classifying each country in one out of five categories according to its commercial legal tradition:
common law, French civil law, German civil law, Scandinavian law and socialist law. The
authors’ thesis is that a country’s legal tradition shapes its institutions over time, and that “the
distinctions between the French, the German and the Scandinavian law are relatively subtle, but
the distinction between socialist, civil and common law are not.” Finally, an additional valuable
10 Acemoglu, Johnson and Robinson (2001) propose exploiting differences in European settlers’ mortality rates to estimate institutions, because in territories where Europeans faced high mortality rates they were not able to settle and they set up extractive institutions, while places where their mortality rates were comparatively lower experienced the promotion of sound institutional policies that persisted until now; although apparently flawless, the instrument “settler mortality” is not ideal for our purpose because it can be applied only to countries that used to be former European colonies. This would lead us to drop nearly half of the observation in our sample. As shown in the Appendix, however, under these circumstances that our results lose some significance but do not change considerably.
10
perspective for analyzing a country’s institutions is its citizens’ religious affiliation.ctive to look
at differences in institutions is religious belonging.11 Following Weber (1958) and Putnam et al.
(1993), La Porta et al. (1998) argue that government performance is influenced by “the
percentage of population in each country belonging to different religious affiliations”, showing
that institutions of largely Protestant countries perform better than nations with a majority of
people belonging to “hierarchical religions” such as Roman Catholicism, Islam and Greek
Orthodoxy.12
As implied above, we decide to instrument GDP levels, deficit and institutional variables
with legal system origin and percentages of Protestant, Catholic and Muslim individuals living in
a given country. We decided to leave settlers’ mortality and latitude out of the regression and to
include ethnic fractionalization as a control in the main equation. The exclusion restriction
implied by our IV strategy is that, conditional on the controls included in the regression, our
instruments have no direct effect on fiscal transparency apart from determining our instrumented
variables. In fact, we see no reason why legal system origin and religious affiliation could
determine a country’s FT but for shaping its institutions and influencing its GDP levels and fiscal
performances.13
The last three columns of Table 5 report the results of our 2SLS regression—equations
(1), (2) and (3), respectively—which confirm the robustness of our OLS results: even when we
control for endogeneity, institutions appear to have a positive and significant coefficient on FT,
as well as on government fractionalization and inflation. In all the 2SLS regressions β2—the
coefficient referring to institutional quality—is almost doubled in comparison to the OLS
regression. According to our 2SLS estimation of equation (1), a one-unit increase in our
institutional quality index (which ranges from -2.5 to 2.5), might raise FT by 2.8 points, quite a
strong impact if we consider that our fiscal transparency index is a 0-10 scale. To provide a
practical example, our coefficient predicts that shifting from the institutional framework of
Latvia to that of Germany would, ceteris paribus, increase FT by a quantity equal to the
11 Alesina et al. (2003) have shown that religious fractionalization per se does might not influence economic and institutional development and it might be endogenous, but they reckon that different religious affiliations do matter in shaping institutions. 12 La Porta et al. (1998) view countries with a Muslim or Catholic heritage as more interventionist because, compared to Protestantism, these religions “like to tell people what to do…and grew to support state power.” 13 First-stage regressions and the Sargan test tell us that the exclusion restriction works well for all our instrumental variables, while it is not possible to test for endogeneity of ETFRA in our first-stage regression—whether we include it or not, results in our second-stage regression do not change significantly.
11
difference in FT between Spain and Bangladesh. Interestingly enough, instrumented income is
never significant, while in column 6, which refers to equation (1), the coefficient of ETFRA is
positive and significant, contrary to the results of Alt, Lassen and Rose (2006), but consistent
with the idea that higher political polarization raises the incentives to tie opponents’ hands with
FT reforms.
In Table 6 we consider the three sub-indices of fiscal transparency, and we run our
benchmark regression (1), both OLS and 2SLS, using each as a dependent variable. From this
table we can observe that the quality of institutions variable yields the expected positive
coefficient and it is always statistically significant. In terms of relative magnitude of the
coefficients, institutions seem to affect mostly InfoAvail (especially in the 2SLS case), with the
lowest coefficient for Quality&Resp.
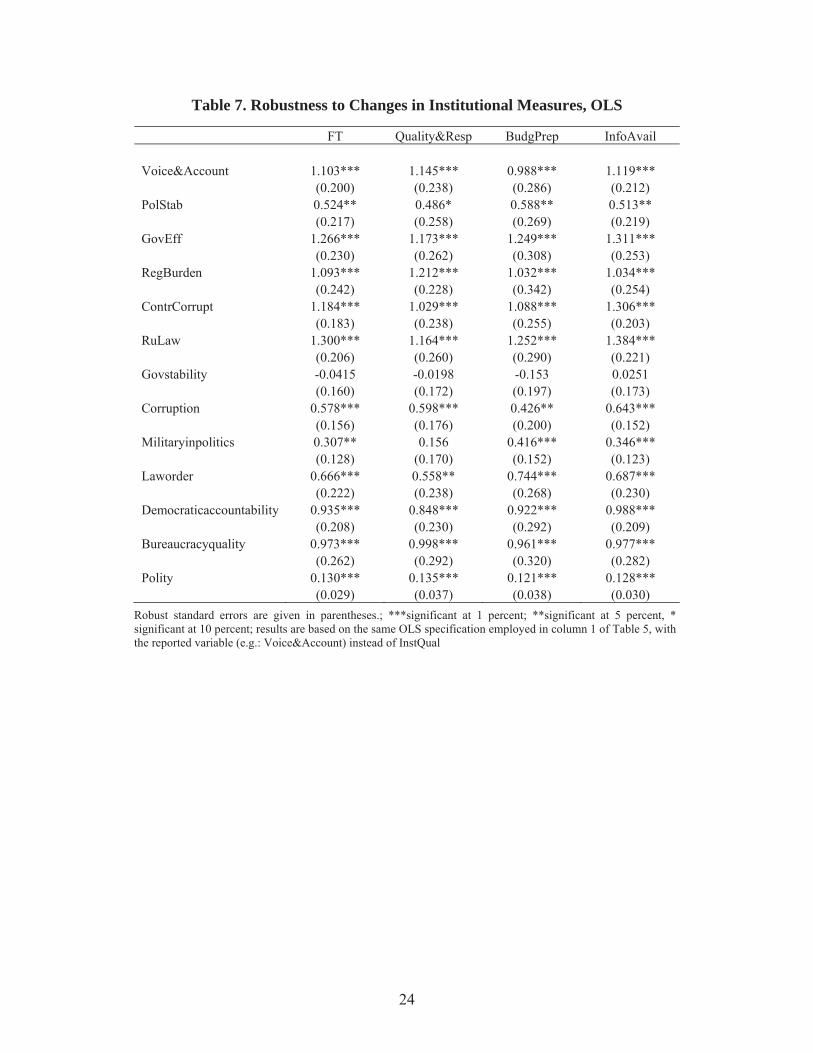
As a robustness check, we observed the effect on fiscal transparency indices of each of
the governance indicators that compose our InstQual summary index, as well as of other
institutional proxies taken from other datasets described earlier. Tables 7 presents the results of
OLS regression (1) for every sub-index, tested by each institutional component (2SLS results are
available in Appendix 2). Every institutional proxy seem has a significant coefficient in
explaining our FT summary index, apart from government stability measure taken from the
ICRG database, but this variable is never significant in any regression. Apparently, whether
governments are stable or change very often does not affect fiscal transparency in a given
country; the same is true for political stability in determining data quality and clarity of
responsibilities.
We acknowledge that our proxies for institutional quality may suffer of measurement
error, and this “noise” may create an attenuation bias that lowers the value of our coefficients,
although it is difficult to provide a numeric interpretation of our indices. We further aggregate
our six indicators into a simple average in order to obtain a synthetic measure of the quality of
institutions. Also, as some of these indicators may be more important than others in
characterizing institutional quality or FT, assigning each of them equal weight may not be the
best way of clustering them. We also applied Principal Component Analysis (PCA) to aggregate
our measures. PCA is a method that aims at describing a variable with a set of variable with a
lower dimensionality. Mathematically, we can define PCA as an orthogonal linear
transformation that transforms the data into to a new coordinate system such that the greatest
variance by any projection of the data comes to lie on the first coordinate (called the first
principal component). Intuitively, with this method we obtain the best linear combination of the
variables in a least square sense. The first principal component explains about 87 percent of the
variations in institutional data, and factor loadings have almost the same weight, with the
exception of Political Stability (PolStab), which is slightly lower than other variables.14
Apart from the regressions reported, we control for other macro and political variables.
Among the former, we mention yearly GDP growth rate (instrumented and not), instrumented
public debt over GDP, size of the public sector as a percentage of GDP, economic openness
(measured as the amount of exports plus imports over the GDP), population, population squared,
GDP per capita in levels, GDP per capita squared, instrumented inflation and external debt. The
significance of our “institutional” coefficients is not affected when we include other “political
variables,” dummies to control for presidential, semi-presidential and parliamentary system,
plurality rules, proportional representation and “number of democratic governments since 1975.”
5. Conclusions In this paper we study the relation between fiscal transparency and institutional factors. Whereas
fiscal transparency has become a prominent concern in recent decades, most of the research so
far has tended to focus on the links between fiscal transparency and budget performance, fiscal
discipline and other economic variables. If political, institutional and governance factors are
examined in relation to fiscal transparency issues, though, they are more likely to be seen as
determinants than explicative parameters. In our analysis, we show that institutions matter for
fiscal transparency, as can be observed by the highly statistically significant results we obtained
after using our fiscal transparency index and various governance indicators. Assembling data
from 82 countries’ ROSCs we provided a summary index of fiscal transparency and three sub-
indices for different characteristics using information from public balance sheets: clarity and
assurances of information, roles and responsibilities, open budget preparation, and public
availability of information.
We found that higher levels of institutional quality or governance give way to better
fiscal transparency indicators. Moreover, after considering possible endogeneity issues and
14 PCA for our FT indices: 89 percent of the variance explained by the first principal component, with almost the same factor weight for all the components (i.e., they are equally important and highly correlated with each other); when I run the regression using our PCA aggregation indices the results are never affected.
13
instrumenting for the institutional and some economic variables, the two-stage least squares
regression produced almost the same results as the OLS method. The evidence thereby supports
our hypothesis that not only does fiscal transparency matters for institutional issues, but
governance and quality of institutions are also determinants of fiscal transparency. Overall, our
hypothesis that democratic institutions have a positive and significant impact on the transparency
of public fiscal systems seems to be confirmed.
14
Figure 1. Fiscal Transparency and Quality of Institutions
24
68
10
-2 -1 0 1 2QII
FT Fitted values
15
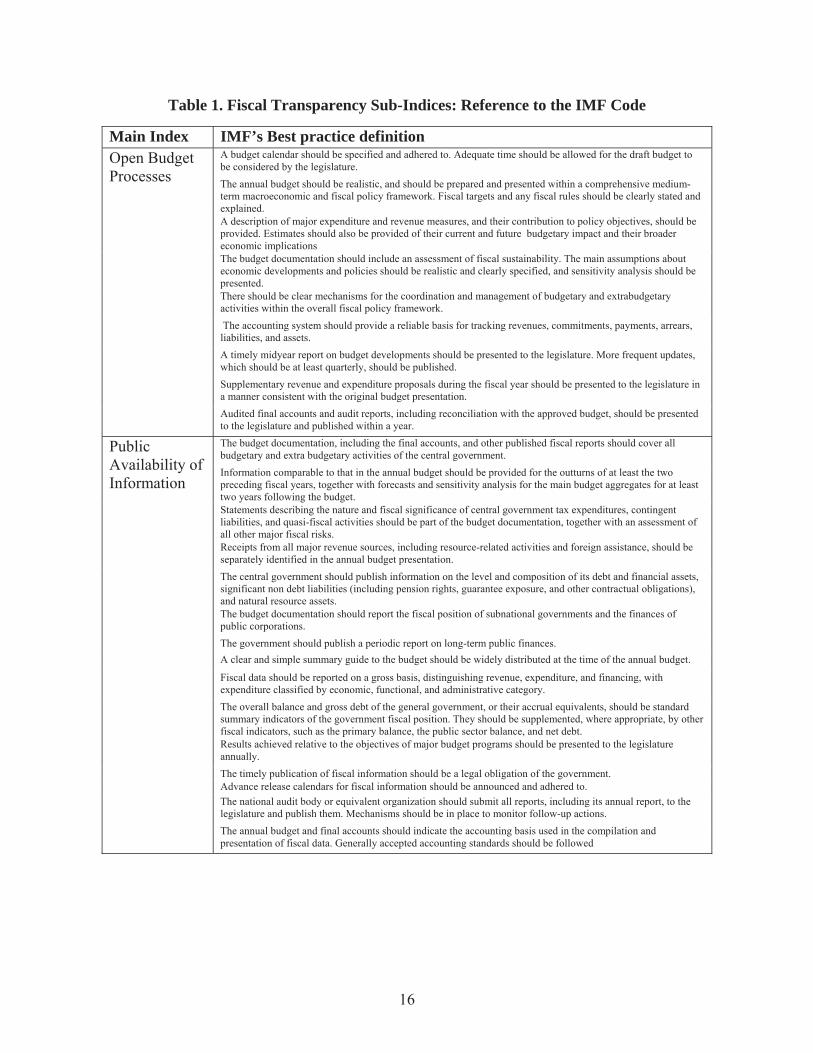
Table 1. Fiscal Transparency Sub-Indices: Reference to the IMF Code
Main Index IMF’s Best practice definition Open Budget Processes
A budget calendar should be specified and adhered to. Adequate time should be allowed for the draft budget to be considered by the legislature. The annual budget should be realistic, and should be prepared and presented within a comprehensive medium-term macroeconomic and fiscal policy framework. Fiscal targets and any fiscal rules should be clearly stated and explained. A description of major expenditure and revenue measures, and their contribution to policy objectives, should be provided. Estimates should also be provided of their current and future budgetary impact and their broader economic implications The budget documentation should include an assessment of fiscal sustainability. The main assumptions about economic developments and policies should be realistic and clearly specified, and sensitivity analysis should be presented. There should be clear mechanisms for the coordination and management of budgetary and extrabudgetary activities within the overall fiscal policy framework. The accounting system should provide a reliable basis for tracking revenues, commitments, payments, arrears, liabilities, and assets. A timely midyear report on budget developments should be presented to the legislature. More frequent updates, which should be at least quarterly, should be published. Supplementary revenue and expenditure proposals during the fiscal year should be presented to the legislature in a manner consistent with the original budget presentation. Audited final accounts and audit reports, including reconciliation with the approved budget, should be presented to the legislature and published within a year.
Public Availability of Information
The budget documentation, including the final accounts, and other published fiscal reports should cover all budgetary and extra budgetary activities of the central government. Information comparable to that in the annual budget should be provided for the outturns of at least the two preceding fiscal years, together with forecasts and sensitivity analysis for the main budget aggregates for at least two years following the budget. Statements describing the nature and fiscal significance of central government tax expenditures, contingent liabilities, and quasi-fiscal activities should be part of the budget documentation, together with an assessment of all other major fiscal risks. Receipts from all major revenue sources, including resource-related activities and foreign assistance, should be separately identified in the annual budget presentation. The central government should publish information on the level and composition of its debt and financial assets, significant non debt liabilities (including pension rights, guarantee exposure, and other contractual obligations), and natural resource assets. The budget documentation should report the fiscal position of subnational governments and the finances of public corporations. The government should publish a periodic report on long-term public finances. A clear and simple summary guide to the budget should be widely distributed at the time of the annual budget.
Fiscal data should be reported on a gross basis, distinguishing revenue, expenditure, and financing, with expenditure classified by economic, functional, and administrative category. The overall balance and gross debt of the general government, or their accrual equivalents, should be standard summary indicators of the government fiscal position. They should be supplemented, where appropriate, by other fiscal indicators, such as the primary balance, the public sector balance, and net debt. Results achieved relative to the objectives of major budget programs should be presented to the legislature annually. The timely publication of fiscal information should be a legal obligation of the government. Advance release calendars for fiscal information should be announced and adhered to. The national audit body or equivalent organization should submit all reports, including its annual report, to the legislature and publish them. Mechanisms should be in place to monitor follow-up actions. The annual budget and final accounts should indicate the accounting basis used in the compilation and presentation of fiscal data. Generally accepted accounting standards should be followed
16
Clarity and assurances of data, roles and responsibilities
Budget forecasts and updates should reflect recent revenue and expenditure trends, underlying macroeconomic developments, and well-defined policy commitments. Data in fiscal reports should be internally consistent and reconciled with relevant data from other sources. Major revisions to historical fiscal data and any changes to data classification should be explained. Public finances and policies should be subject to scrutiny by a national audit body or an equivalent organization that is independent of the executive. Independent experts should be invited to assess fiscal forecasts, the macroeconomic forecasts on which they are based, and their underlying assumptions. A national statistical body should be provided with the institutional independence to verify the quality of fiscal data. The structure and functions of government should be clear. The fiscal powers of the executive, legislative, and judicial branches of government should be well defined. The responsibilities of different levels of government, and the relationships between them, should be clearly specified. Relationships between the government and public corporations should be based on clear arrangements. Government relationships with the private sector should be conducted in an open manner, following clear rules and procedures. The collection, commitment, and use of public funds should be governed by comprehensive budget, tax, and other public finance laws, regulations, and administrative procedures. Laws and regulations related to the collection of tax and non-tax revenues, and the criteria guiding administrative discretion in their application, should be accessible clear, and understandable. Appeals of tax or non-tax obligations should be considered in a timely manner. There should be sufficient time for consultation about proposed laws and regulatory changes and, where feasible, broader policy changes. Contractual arrangements between the government and public or private entities, including resource companies and operators of government concessions, should be clear and publicly accessible. Government liability and asset management, including the granting of rights to use or exploit public assets, should have an explicit legal basis.
Index constructed by taking the average of the scores (between 0 and 10) assigned to the practises evaluated in the ROSCs and listed in Table 1.
Authors’ calculation
Quality&Resp Variable based on IMF country ROSCs to evaluate the extent to which a country follows IMF’s Code of good practices in clarity and assurances of information, roles and responsibility. The higher the variable, the more transparent a country is in this area.
Authors’ calculation
BudgPrep Variable based on IMF country ROSCs to evaluate the extent to which a country follows IMF’s Code of good practices in open budget preparation. The higher the variable, the more transparent a country is in this area.
Authors’ calculation
InfoAvail Variable based on IMF country ROSCs to evaluate the extent to which a country follows IMF’s Code of good practices in public availability of information. The higher the variable, the more transparent a country is in this area.
Authors’ calculation
LogGDP Logarithm of GDP per capita, normalized to year 2000 US$ (average for the period 1990-2000, when years available)
WDI
InstQual Simple Average of the variables VA, PS, GE, RQ, RL, CC Authors’ calculation
Voice&Account Voice and Accountability: it measures aspects of the political process, civil liberties, and political rights, intended to assess the extent to which citizens are able to participate in the selections of governments (average for the period 1996-2004, when years available).
Kaufmann et al. (2003)
PolStab Political Stability: It measures aspects of the perceptions of the likelihood that the government in power will be destabilized or removed by possibly unconstitutional or violent mechanisms (average for the period 1996-2004, when years available).
“
GovEff Government Effectiveness: It encompasses perceptions of the quality of the provision of public services, the quality of the bureaucracy, the competence of civil servants, the independence of the civil servants from political pressures, and the credibility of the government (average for the period 1996-2004, when years available).
“
RegBurden Regulatory Burden: it focuses on the policies themselves, including how market-friendly or excessively regulatory are the policies so that they become an obstacle or burden for trade, business and development (average for the period 1996-2004, when years available).
“
ContrCorrupt Control of Corruption: It refers to the perception of the degree of prevention of the exercise of public power for private gains (average for the period 1996-2004, when years available).
“
RuLaw Rule of Law: It represents the extent to which citizens have confidence and abide by the rules of society such as the effectiveness and predictability of the judiciary, or the enforceability of contracts (average for the period 1996-2004, when years available).
“
Deficit Yearly Balance deficit as a fraction of GDP (average for the period 1990-2000, when years available).
IMF
Inflation inflation, consumer price - annual % (average for the period 1990-2000, when years available.
WDI
Majority Number of seats held by the government. It is calculated by dividing the number of government seats by total seats.
WGI 2007
Govfract Government fractionalization: probability that two deputies picked at random from among the government parties will be of different parties.
WGI 2007
Etfra Index of ethnic fractionalization. Alesina et al. (2003)
Debt_gdp Public debt as a percentage of GDP (average for the period 1990-2000, when years available).
WDI
Urbanpop Percentage of population living in urban areas (average for the period 1990-2000). WDI Agepop Percentage of population aged between 15 and 64 y.o. (average for the period 1990-
2000, when years available). WDI
18
Table 2., continued
Variable Description Source Religion Identify the percentage of the population of each country that belonged to the three
most widely spread religions in the world in 1980. For countries of recent formation, the data are available for 1990-95. The numbers are in percent (scale from 0 to 100). The three religions identified here are Roman Catholic, Protestant and Muslim. The residual is called "otherreli".
La Porta et al (1998)
Legal Origin Dummies that identify the legal origin of the country. There are five possible origins: English Common Law, French Commercial Code, German Commercial Code, Scandinavian Commercial Code, Socialist/Communist laws.
La Porta et al (1998)
Govstability Index on risk implied by Government Stability in each country. Higher values of this index indicate lower risk. We use mean values of this index for the years between 1990 and 2000 (when available).
ICRG
Corruption Index on risk implied by corruption in each country. Higher values of this index indicate lower risk. We use mean values of this index for the years between 1990 and 2000 (when available).
ICRG
Militaryinpolitics Index on risk implied by the presence of military in politics in each country. Higher values of this index indicate lower risk. We use mean values of this index for the years between 1990 and 2000 (when available).
ICRG
Laworder Index on risk implied by rule of law in each country. Higher values of this index indicate lower risk. We use mean values of this index for the years between 1990 and 2000 (when available).
ICRG
Democraticaccountability
Index on risk implied by accountability in each country. Higher values of this index indicate lower risk. We use mean values of this index for the years between 1990 and 2000 (when available).
ICRG
Bureaucracyquality Index on risk implied by the quality of the bureaucracy in each country. Higher values of this index indicate lower risk. We use mean values of this index for the years between 1990 and 2000 (when available).
ICRG
Polity Variable based on expert judgment on aspects of institutionalized democracy and autocracy within a country. The higher the value, the more democratic a country is.
Polity V database
Economic Openness
Sum of exports and imports of goods and services, in local currency, as a share of GDP, in local currency.
WDI
External Debt Share of Public External Debt as a share of GDP. Year 1990. WDI Proportional Dummy that takes value 1 if candidates are elected based on the percent of votes
received by their party and/or if sources specifically call the system “proportional representation”. It takes value 0 otherwise.
WGI 2007
Plurality Dummy that takes value 1 if legislators are elected using a winner-take-all / first past the post rule; 0 otherwise.
WGI 2007
System Dummies for parliamentary, semi-presidential and presidential system. WGI 2007
Observations 78 65 65 78 65 65 R-squared 0.794 0.812 0.817 0.679 0.702 0.763 Robust standard errors are given in parentheses. ***significant at 1 percent; **significant at 5 percent, * significant at 10 percent seven territorial dummies (europe, asia, africa, middle east, oceania, north america, south america) are included in all the regressions but not reported the columns 1 2 and 3 consider LogGDP, InstQual and Deficit to be exogenous variables, and provide Ordinary Least Squares estimates. The columns 4 5 6 show the second stage of the two-stage least square procedure in order to account for possible endogeneity of these variables. The instruments used are legal system origin and percentage of muslim, catholic and protestant in any country.
Observations 78 78 78 78 78 78 R-squared 0.740 0.673 0.774 0.697 0.591 0.591 Robust standard errors are given in parentheses. ***significant at 1 percent; **significant at 5 percent, * significant at 10 percent; seven territorial dummies (europe, asia, africa, middle east, oceania, north america, south america) are included in all the regressions but not reported the columns 1 2 and 3 consider logGDP, InstQual and Deficit to be exogenous variables, and provide Ordinary Least Squares estimates. Columns 4, 5 and 6 show the second stage of the two-stage least square procedure in order to account for possible endogeneity of these variables. The instruments used are legal system origin and percentage of muslim, catholic and protestant in any country.
23
Table 7. Robustness to Changes in Institutional Measures, OLS
Robust standard errors are given in parentheses.; ***significant at 1 percent; **significant at 5 percent, * significant at 10 percent; results are based on the same OLS specification employed in column 1 of Table 5, with the reported variable (e.g.: Voice&Account) instead of InstQual
24
References Acemoglu, D., S. Johnson and J.A. Robinson 2001. “The Colonial Origins of Comparative
Development: An Empirical Investigation.” American Economic Review 91: 1369-1401.
Aghion, P., A. Alesina and F. Trebbi. 2004. “Endogenous Political Institutions.” Quarterly
Journal of Economics 119(2): 565-611.
Alesina, A. et al. 2003. “Fractionalization.” Journal of Economic Growth 8: 155-194.
Alesina, A., and R. Perotti. 1996. “Fiscal Discipline and the Budget Process.” American
Economic Review 86: 401-407
Allan, W., and T. Parry. 2003. “Fiscal Transparency in EU Accession Countries: Progress and
Future Challenges.” IMF Working Paper 03/163. Washington, DC, United States:
International Monetary Fund.
Alt, J.E., and D. Lassen. 2006. “Transparency, Political Polarization, and Political Budget Cycles
in US States.” Forthcoming in American Journal of Political Science.
Alt, J.E., D. Lassen and S. Rose. 2006. “The Causes of Fiscal Transparency: Evidence from the
American States.” EPRU Working Paper 06-02. Copenhagen, Denmark: University of
Copenhagen, Department of Economics, Economic Policy Research Unit. Available at:
http://www.econ.ku.dk/epru/files/wp/wp-06-02.pdf
Alt, J.E., and R.C. Lowry. 1994. “Divided Government, Fiscal Institutions, and Deficits:
Evidence from the States.” American Political Science Review 88: 811-28.
Beck, T. et al. 2006. World Bank Database of Political Institutions. Available at
http://go.worldbank.org/2EAGGLRZ40
Besley, T. 2006. Principled Agents? The Political Economy of Good Government. Oxford,
United Kingdom: Oxford University Press.
Center for International Development and Conflict Management (CIDCM). 2004. “Polity IV
Dataset.” College Park, Maryland, United States: University of Maryland. Available at:
www.cidcm.umd.edu/inscr/polity
Drabek, Z., and W. Payne. 1999. “The Impact of Transparency on Foreign Direct Investment.”
Staff Working Paper ERAD-99-02. Geneva, Switzerland: World Trade Organization,
Polity 0.284** 0.254* 0.286* 0.287** (0.131) (0.142) (0.162) (0.138) Robust standard errors are given in parentheses. ***significant at 1 percent; **significant at 5 percent, * significant at 10 percent; results are based on the same 2SLS specification employed in column 4 of Table 5.