56
Institutional University Cooperation with Bahir Dar University - Year 3 Joint Steering Committee Meeting Excursion Guide (21-22 March 2019) Jan Nyssen & Enyew Adgo (eds.)
Institutional University Cooperation with
Bahir Dar University - Year 3 Joint
Steering Committee Meeting
Excursion Guide (21-22 March 2019)
Jan Nyssen & Enyew Adgo (eds.)

2
To be cited as:
Jan Nyssen, Enyew Adgo (eds.), 2019. Institutional University Cooperation with Bahir Dar
University - Year 3 Joint Steering Committee Meeting - Excursion Guide. Bahir Dar University
(Ethiopia) & VLIR-UOS (Belgium), 56 p.

3
Table of contents Chapter 1: The diversity of wetlands in Lake Tana and surroundings ........................................... 4
Chapter 2: Physical and chemical limnology of Lake Tana and its tributary rivers ..................... 10
Chapter 3: The impact of urbanization on Dibankie hill .............................................................. 13
Chapter 4: Uncovering ecosystem services on expropriated land: A participatory assessment in
the case of urban expansion in Bahir Dar ..................................................................................... 15
Chapter 5: Inventory of potential geosites in the Lake Tana area: the case of Dibankie Mountain
....................................................................................................................................................... 18
Chapter 6: Improving agricultural water productivity in the Lake Tana basin ............................. 21
Chapter 7: Role of public extension performers’ as source of information and knowledge to
smallholder farmers - the case of northwest Ethiopia ................................................................... 23
Chapter 8: Direct and indirect effect of irrigation water availability on crop revenue: A Structural
Equation Model ............................................................................................................................. 26
Chapter 9: Water balance of Tana basin: progress ....................................................................... 29
Chapter 10: Water balance of Beles basin .................................................................................... 32
Chapter 11: Dormancy, flower bud and fruit quality under conditions of insufficient chilling in
apple (Malus domestica) ............................................................................................................... 35
Chapter 12: Tomato chilling to reduce postharvest losses in Ethiopia ......................................... 39
Chapter 13: Understanding the interrelation between landscape structure on church forests’
resilience, bird ecology and agricultural production in the Eastern Lake Tana basin .................. 42
Chapter 14: Floodplain sediment storage quantification: the case of upper reaches of the Gumara
river ............................................................................................................................................... 45
Chapter 15: Quantifying and understanding land degradation process in relationship to landscape
connectivity in the Lake Tana basin ............................................................................................. 48
Chapter 16: Effect of curing temperature and relative humidity on storability of onion ............. 51
Chapter 17: Habitat characterization of young-of-the-year Labeobarbus species ....................... 54
4
Chapter 1: The diversity of wetlands in Lake Tana and surroundings
Abrehet Kahsay1,3, Elie Verleyen8, Ayalew Wondie2, Ludwig Triest3, Luc De Meester4, Iris
Stiers3, Daniel Ayalew5, Enyew Adgo6, Jan Nyssen7, Pieter Lemmens4, Mulugeta Kibret2
1Department of Fisheries, Wetlands and Wildlife Management, Bahir Dar University, Bahir Dar,
Ethiopia 2Department of Biology, Bahir Dar University, Bahir Dar, Ethiopia 3Department of Biology, Vrije Universiteit Brussel, Brussels, Belgium 4Department of Biology, KU Leuven, Leuven, Belgium 5Department of Geography and Environmental Studies, Bahir Dar University, Bahir Dar,
Ethiopia 6Department of Natural Resource Management, Bahir Dar University, Ethiopia 7Department of Geography, Ghent University, Ghent, Belgium 8Department of Biology, Ghent University, Ghent, Belgium
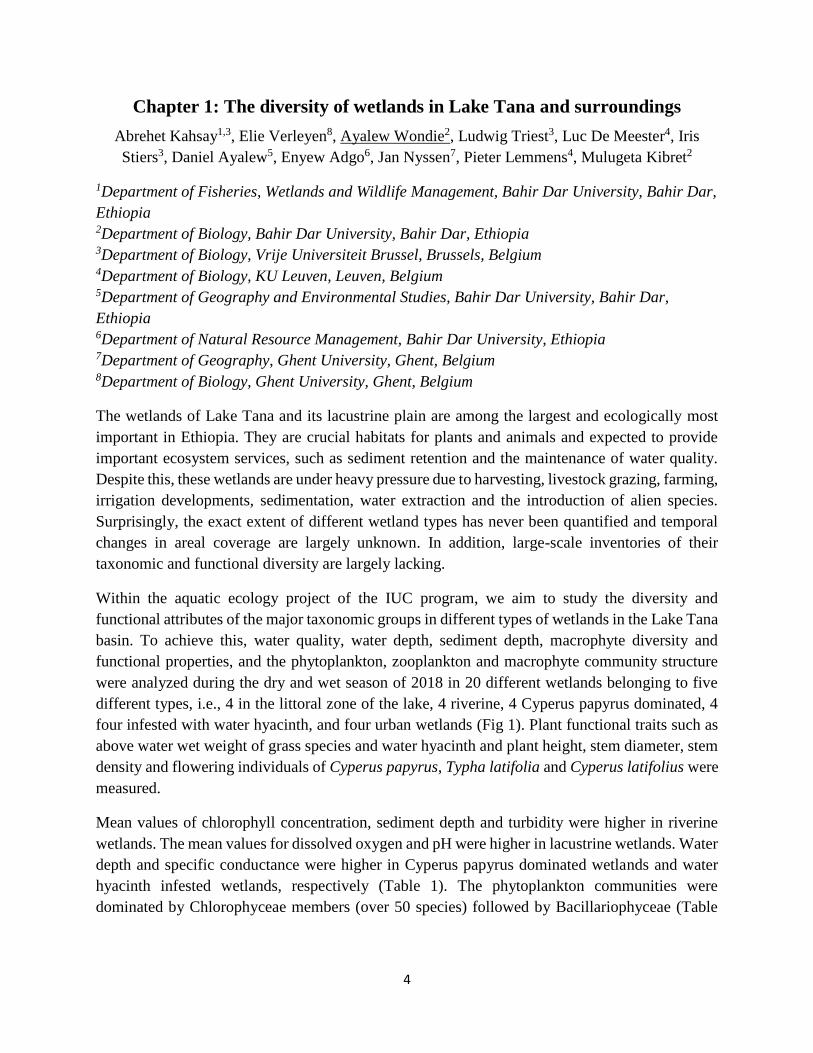
The wetlands of Lake Tana and its lacustrine plain are among the largest and ecologically most
important in Ethiopia. They are crucial habitats for plants and animals and expected to provide
important ecosystem services, such as sediment retention and the maintenance of water quality.
Despite this, these wetlands are under heavy pressure due to harvesting, livestock grazing, farming,
irrigation developments, sedimentation, water extraction and the introduction of alien species.
Surprisingly, the exact extent of different wetland types has never been quantified and temporal
changes in areal coverage are largely unknown. In addition, large-scale inventories of their
taxonomic and functional diversity are largely lacking.
Within the aquatic ecology project of the IUC program, we aim to study the diversity and
functional attributes of the major taxonomic groups in different types of wetlands in the Lake Tana
basin. To achieve this, water quality, water depth, sediment depth, macrophyte diversity and
functional properties, and the phytoplankton, zooplankton and macrophyte community structure
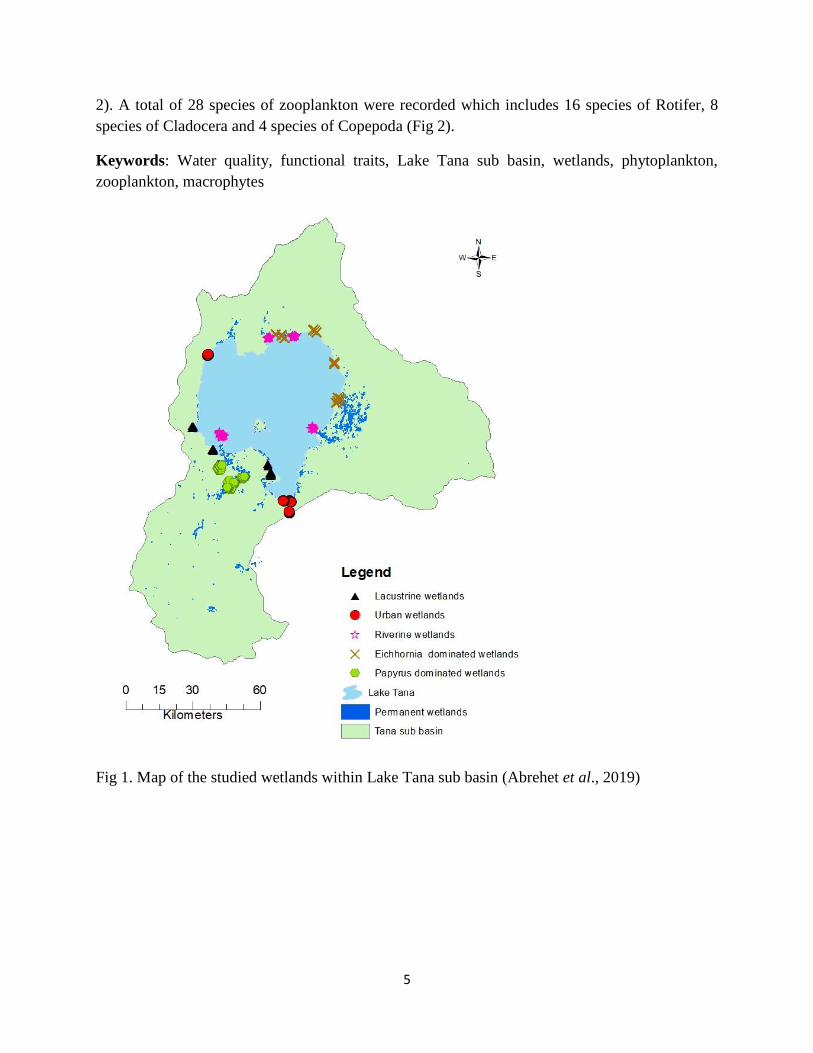
were analyzed during the dry and wet season of 2018 in 20 different wetlands belonging to five
different types, i.e., 4 in the littoral zone of the lake, 4 riverine, 4 Cyperus papyrus dominated, 4
four infested with water hyacinth, and four urban wetlands (Fig 1). Plant functional traits such as
above water wet weight of grass species and water hyacinth and plant height, stem diameter, stem
density and flowering individuals of Cyperus papyrus, Typha latifolia and Cyperus latifolius were
measured.
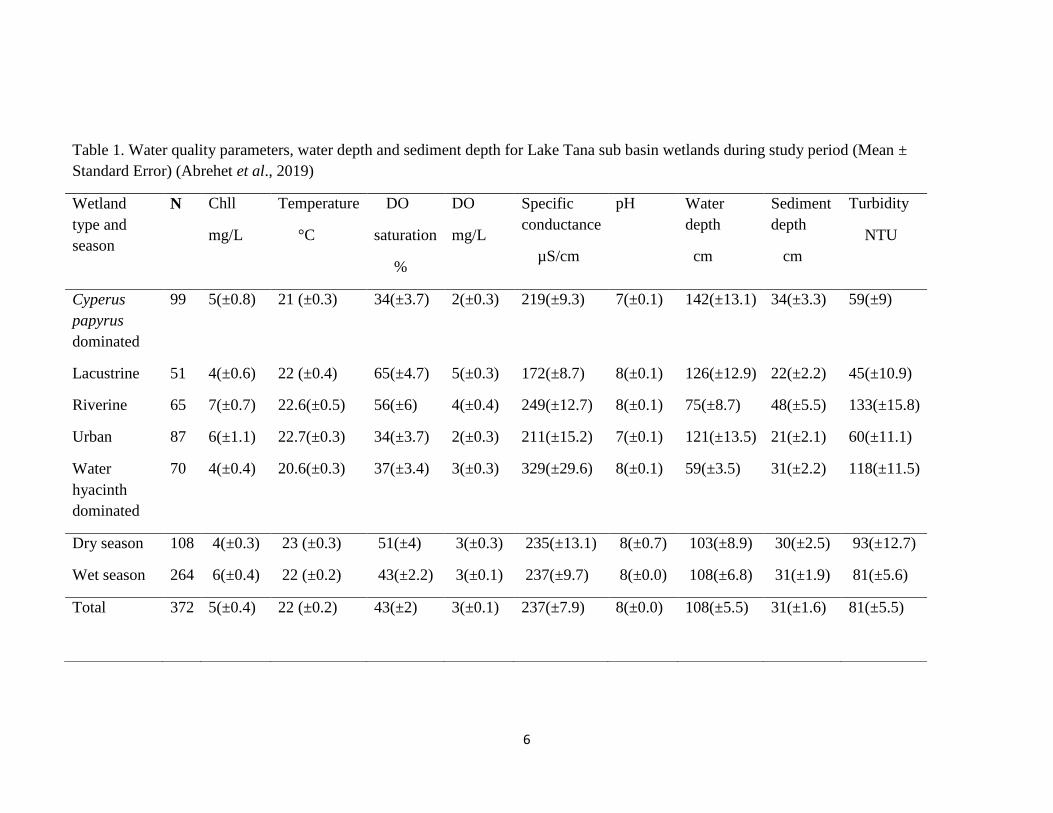
Mean values of chlorophyll concentration, sediment depth and turbidity were higher in riverine
wetlands. The mean values for dissolved oxygen and pH were higher in lacustrine wetlands. Water
depth and specific conductance were higher in Cyperus papyrus dominated wetlands and water
hyacinth infested wetlands, respectively (Table 1). The phytoplankton communities were
dominated by Chlorophyceae members (over 50 species) followed by Bacillariophyceae (Table
5
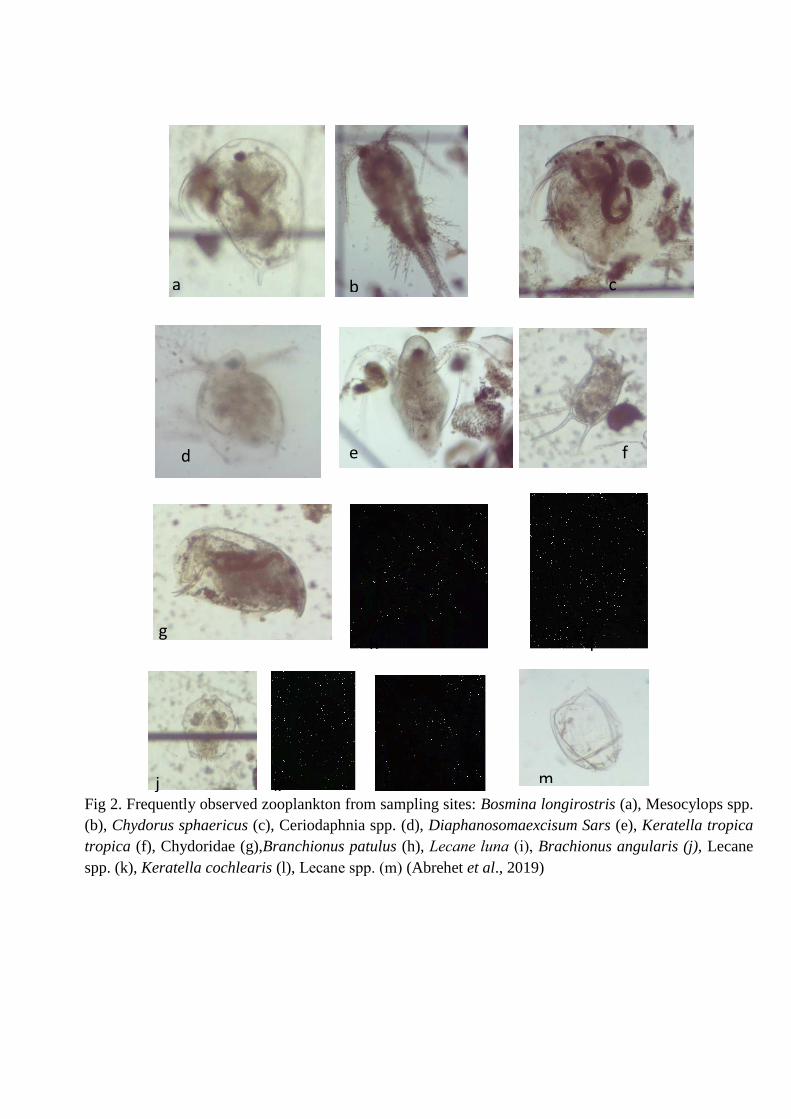
2). A total of 28 species of zooplankton were recorded which includes 16 species of Rotifer, 8
species of Cladocera and 4 species of Copepoda (Fig 2).
Keywords: Water quality, functional traits, Lake Tana sub basin, wetlands, phytoplankton,
zooplankton, macrophytes
Fig 1. Map of the studied wetlands within Lake Tana sub basin (Abrehet et al., 2019)
6
Table 1. Water quality parameters, water depth and sediment depth for Lake Tana sub basin wetlands during study period (Mean ±
Standard Error) (Abrehet et al., 2019)
Wetland
type and
season
N Chll
mg/L
Temperature
°C
DO
saturation
%
DO
mg/L
Specific
conductance
µS/cm
pH Water
depth
cm
Sediment
depth
cm
Turbidity
NTU
Cyperus
papyrus
dominated
99 5(±0.8) 21 (±0.3) 34(±3.7) 2(±0.3) 219(±9.3) 7(±0.1) 142(±13.1) 34(±3.3) 59(±9)
Lacustrine 51 4(±0.6) 22 (±0.4) 65(±4.7) 5(±0.3) 172(±8.7) 8(±0.1) 126(±12.9) 22(±2.2) 45(±10.9)
Riverine 65 7(±0.7) 22.6(±0.5) 56(±6) 4(±0.4) 249(±12.7) 8(±0.1) 75(±8.7) 48(±5.5) 133(±15.8)
Urban 87 6(±1.1) 22.7(±0.3) 34(±3.7) 2(±0.3) 211(±15.2) 7(±0.1) 121(±13.5) 21(±2.1) 60(±11.1)
Water
hyacinth
dominated
70 4(±0.4) 20.6(±0.3) 37(±3.4) 3(±0.3) 329(±29.6) 8(±0.1) 59(±3.5) 31(±2.2) 118(±11.5)
Dry season 108 4(±0.3) 23 (±0.3) 51(±4) 3(±0.3) 235(±13.1) 8(±0.7) 103(±8.9) 30(±2.5) 93(±12.7)
Wet season 264 6(±0.4) 22 (±0.2) 43(±2.2) 3(±0.1) 237(±9.7) 8(±0.0) 108(±6.8) 31(±1.9) 81(±5.6)
Total
372 5(±0.4) 22 (±0.2) 43(±2) 3(±0.1) 237(±7.9) 8(±0.0) 108(±5.5) 31(±1.6) 81(±5.5)

7
Table 2. The most frequently encountered species list of phytoplankton during the study period from Lake Tana sub basin wetlands
(Abrehet et al., 2019)
Cyanophyeae Bacillariophyceae Dinophyceae Chlorophyceae Chlorophyceae continued Anabaena constricta Aulacoseira granulata Peridinium cinctum Ankistrodesmus angustus C.Bern. Pediastrum duplex Meyen
Anabaena sp. Acnanthes spp Peridinium gatunense Nyg. Ankistrodesmus falcatus Pleurotaenium trabecula
Chroococcus sps Asterionella formosa HASSALL Peridinium sp. Ankistrodesmus nannoselene Scenedesmus sps
Gomphospaeria natans Aulacoseira distans (Ehr.) Simon. Peridinium volzii Lemm. Chlamydomonas flosculariae Schroederia setigera (Schröd.) Lemmer.
Leptolyngbya boryana Coscinodiscus spp Chlamydomonas sp. Selanstrum sp.
Leptolyngbya foveolarum Coscinodiscus lacustris Closterium subulatum Sorastrum sps
Microcystis sps Cyclotella comta Closterium acutum Bréb. Spirogra labyrinthiformis
Oscillatoria brevis Cyclotella radiosa (Grun.) Lemm. Closterium kuetzingii Spirogyra spp
Oscillatoria geminata Cymbella minuta Hilse Closterium sp. ( limneticum) Staurastrum johnsonii
Oscillatoria lacustris Cymbella ventricosa Coelastrum microporum Staurastrum gracile
Oscillatoria lauterbornii Diatoma vulgaris Bory Euglenophyceae Coelastrum reticulatum Staurastrum gracile Ralf ex Ralfs
Oscillatoria limosa Fragilaria capucina Euglena cf. viridis Cosmarium archerianum Staurastrum longebrachiatum
Oscillatoria tenuis Fragilaria sps Phacus acuminatus Stokes Cosmarium circulare Staurastrum teliferum
Phormidium tenne Gomphonema gracile Ehr. Euglena acus Cosmarium contractum O. Kirch. Staurastrum triangularis var. triangularis
Phormidium valderiae Gomphonema minutum Cosmarium granatum Breb Staurodesmus convergens
Planktolyngbya limnetica Gomphonema venusta passy Cosmarium quadrum Staurodesmus curvatus var. latus
Pseudoanabaena sp. Aulacoseira italicas Cosmarium rectangulare Tetraedron arthrodesmiforae
Synechococcus sp. Navicula cospidata Eudorina elegans Treubaria crassispina
Navicula cryptocephala Kutz. Geminella sps Treubaria sps
Nitzschia closterium Gonatozygon kinahanii Treubaria triappendiculata
Nitzschia minuta Gonatozygon monotaenium Tribonema minus hazen
Nitzschia reversa Haematococcus sp. Xanthidium cristatum
Nitzschia sps Micrasterias radiate Hass
Pinnularia sp. Microspora quadrata
Pleurosigma elongatum Monoraphidium contortum
Raphidiopsis mediteranea Skuja Mougeotia laetevirens
Rhoicosphenia abreviata Oedogonium sp.
Rhopalodia gibba Oocystis eremosphaeria G. M. Smith
Rhopalodia gibba(Ehr.) O. Müll. Oocystis sp.
Stephanodiscus spp Pediastrum.boryanum(Turp.)Menegh.
Synedra sps( synedra affinis) P. simplex Meyen
Synedra ulna (Nitz.) Ehr. Volvox globator
a b c
d e f
g h i
j k l m
Fig 2. Frequently observed zooplankton from sampling sites: Bosmina longirostris (a), Mesocylops spp.
(b), Chydorus sphaericus (c), Ceriodaphnia spp. (d), Diaphanosomaexcisum Sars (e), Keratella tropica
tropica (f), Chydoridae (g),Branchionus patulus (h), Lecane luna (i), Brachionus angularis (j), Lecane
spp. (k), Keratella cochlearis (l), Lecane spp. (m) (Abrehet et al., 2019)
9
References
Geremew, A., & Triest, L. (2017). Hydrological connectivity and vegetative dispersal shape
clonal and genetic structure of the emergent macrophyte Cyperus papyrus in a tropical highland
lake (Lake Tana, Ethiopia). Hydrobiologia, 1-18.
Wondie, A. (2006). Dynamics of the major phytoplankton and zooplankton communities and
their role in the food web of Lake Tana, Ethiopia (Doctoral dissertation, Ph. D thesis. Addis
Ababa University, Ethiopia. 162pp).
Wondie, A., Mengistu, S., Vijverberg, J., & Dejen, E. (2007). Seasonal variation in primary
production of a large high altitude tropical lake (Lake Tana, Ethiopia): effects of nutrient
availability and water transparency. Aquatic Ecology, 41(2), 195-207.
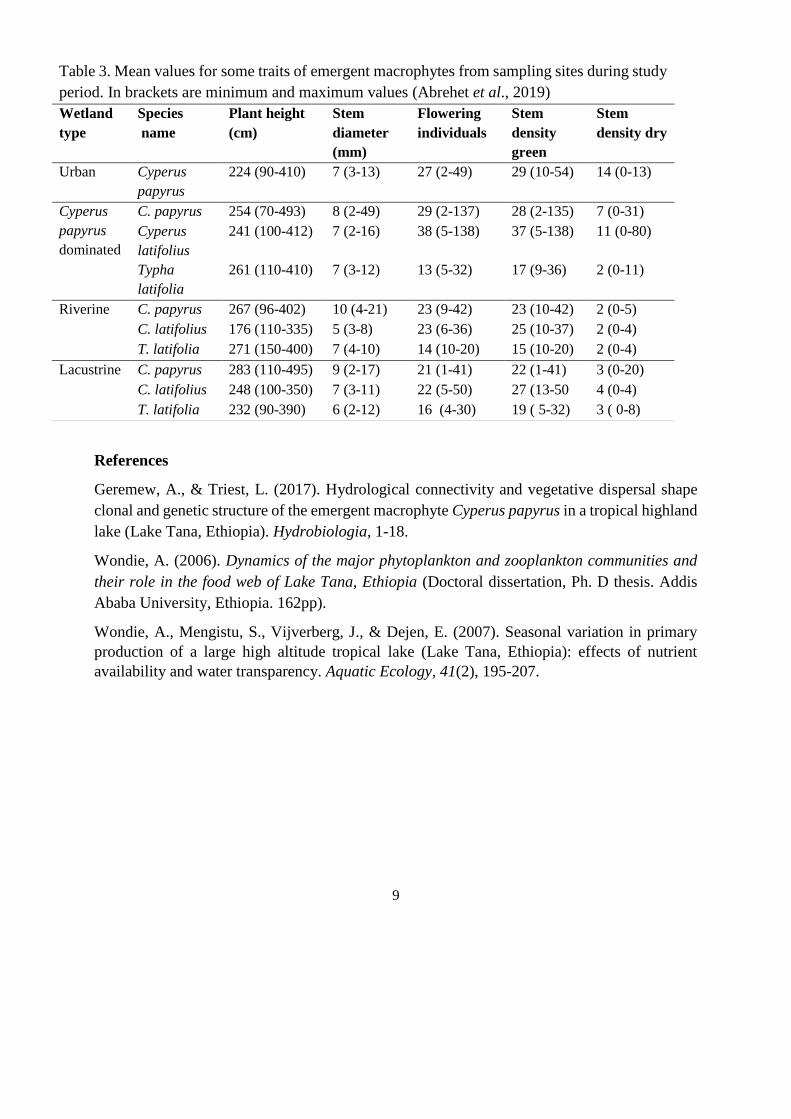
Table 3. Mean values for some traits of emergent macrophytes from sampling sites during study
period. In brackets are minimum and maximum values (Abrehet et al., 2019)
Wetland
type
Species
name
Plant height
(cm)
Stem
diameter
(mm)
Flowering
individuals
Stem
density
green
Stem
density dry
Urban Cyperus
papyrus
224 (90-410) 7 (3-13) 27 (2-49) 29 (10-54) 14 (0-13)
Cyperus
papyrus
dominated
C. papyrus 254 (70-493) 8 (2-49) 29 (2-137) 28 (2-135) 7 (0-31)
Cyperus
latifolius
241 (100-412) 7 (2-16) 38 (5-138) 37 (5-138) 11 (0-80)
Typha
latifolia
261 (110-410) 7 (3-12) 13 (5-32) 17 (9-36) 2 (0-11)
Riverine C. papyrus 267 (96-402) 10 (4-21) 23 (9-42) 23 (10-42) 2 (0-5)
C. latifolius 176 (110-335) 5 (3-8) 23 (6-36) 25 (10-37) 2 (0-4)
T. latifolia 271 (150-400) 7 (4-10) 14 (10-20) 15 (10-20) 2 (0-4)
Lacustrine C. papyrus 283 (110-495) 9 (2-17) 21 (1-41) 22 (1-41) 3 (0-20)
C. latifolius 248 (100-350) 7 (3-11) 22 (5-50) 27 (13-50 4 (0-4)
T. latifolia 232 (90-390) 6 (2-12) 16 (4-30) 19 ( 5-32) 3 ( 0-8)
10
Chapter 2: Physical and chemical limnology of Lake Tana and its tributary
rivers
Bayeh Abera1, 2*, Mulugeta Kibret3, Wout Van Echelpoel4, Abrehet Kahsay5, Wondie
Zelalem5, Daniel Ayalew6, Enyew Adgo7, Jan Nyssen8, Peter Goethals4, Elie Verleyen2
1Department of Microbiology, College of Medicine and Health Sciences, Bahir Dar
University, Ethiopia 2Laboratory of Protistology and Aquatic Ecology, Department of Biology, Ghent University,
9000 Ghent, Belgium 3Department of Biology, Science College Bahir Dar University, Ethiopia 4Laboratory of Environmental Toxicology and Aquatic Ecology, Ghent University, 9000
Ghent, Belgium 5Department of Fishery Wetland and Wildlife Management, College of Agriculture and
Environmental Science, Bahir Dar University, Ethiopia 6Geospatial Data & Technology Center, Bahir Dar University 7Department of Natural Resource Management, Bahir Dar University, Ethiopia 8Department of Geography, Ghent University, 9000 Ghent, Belgium
Lake Tana is the largest lake in Ethiopia. It is very likely that anthropogenic activities in the
lake’s catchment, such as agriculture, urbanization and degradation of wetlands already affected
the water quality of the lake and its rivers. Large-scale limnological survey for assessing its
water quality are however still largely lacking. We aim to study the physical and chemical
limnology of the lake and their effect on prokaryotic and eukaryotic planktonic communities.
In this preliminary study we report on the physical and chemical parameters measured during
the dry (April-May 2018) and wet season (September 2018) in 22 stations, including eight sites
in the littoral zone (LT1-LT8), two pelagic sites and at three rivers mouths in the lake, as well
as in two sampling locations from six rivers (Fig.1), and combined this with monthly
measurements in an open water site. Dissolved oxygen, pH, temperature, turbidity and specific
conductance were measured using a multi-parameter YSI PRO DSS probe. Biochemical
oxygen demand, total phosphorus, orthophosphate, nitrate, total nitrogen and total organic
carbon were analyzed using a Hach-Lange spectrophotometer (DR6000, USA). The
concentrations of orthophosphate, nitrate, total phosphorus and total nitrogen, as well as
turbidity were significantly (P<0.05) higher, while temperature and chlorophyll concentrations
were lower in the wet compared with the dry season (Fig.2). Particularly the sites in the rivers
showed a relatively high seasonal variability in their chemical limnological properties. The
mean turbidity of the lake was 115.7 NTU (Nephelometric Turbidity Units) during the wet
11
season and 34.6 NTU during the dry season. The values during the dry season are comparable
with similar previous measurements taken in 2000 (Dejen et al., 2004) but higher compared
with data obtained in 2011 (Goshu et al., 2017). These preliminary findings suggest yearly and
seasonal variations in water transparency in the lake.
Keywords: Physical and chemical limnology, water quality, nutrients, tributary river
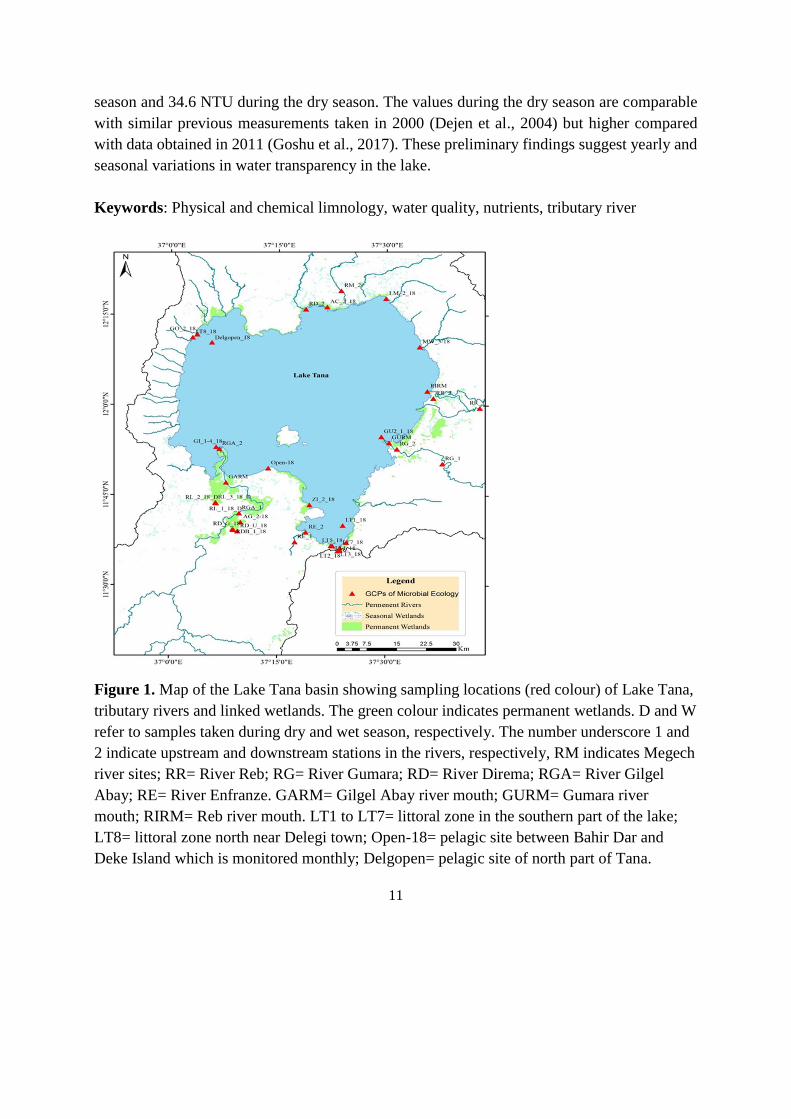
Figure 1. Map of the Lake Tana basin showing sampling locations (red colour) of Lake Tana,
tributary rivers and linked wetlands. The green colour indicates permanent wetlands. D and W
refer to samples taken during dry and wet season, respectively. The number underscore 1 and
2 indicate upstream and downstream stations in the rivers, respectively, RM indicates Megech
river sites; RR= River Reb; RG= River Gumara; RD= River Direma; RGA= River Gilgel
Abay; RE= River Enfranze. GARM= Gilgel Abay river mouth; GURM= Gumara river
mouth; RIRM= Reb river mouth. LT1 to LT7= littoral zone in the southern part of the lake;
LT8= littoral zone north near Delegi town; Open-18= pelagic site between Bahir Dar and
Deke Island which is monitored monthly; Delgopen= pelagic site of north part of Tana.

12
Figure 2. Principal component analysis (PCA) biplot of TN, TP, NO3
-, PO43-, DO, TOC,
COD, chlorophyll and turbidity of Lake Tana and tributary rivers. Full symbols denote the dry
season and open symbols the wet season. Squares = littoral sites; triangles = River sites;
Circles = open water sites.
References
Dejen, E., Vijverberg, J., Nagelkerke, L. A., Sibbing, F. A. (2004). Temporal and spatial
distribution of microcrustacean zooplankton in relation to turbidity and other environmental
factors in a large tropical lake (L. Tana, Ethiopia). Hydrobiology, 513(1-3), 39-49.
Goshu G., Koelmans A.A., de Klein J.J.M. (2017) Water Quality of Lake Tana Basin, Upper
Blue Nile, Ethiopia. A Review of Available Data. In: Stave K., Goshu G., Aynalem S. (eds)
Social and Ecological System Dynamics. AESS Interdisciplinary Environmental Studies and
Sciences Series. Springer, Cham.
13
Chapter 3: The impact of urbanization on Dibankie hill
Melaku Bogale1,2, Ben Derudder1, Amare Sewnet3, Steven Van Passel4, Jan Nyssen1, and
Enyew Adgo5
1 Department of Geography, Ghent University, Belgium. 2Department of Economics, Bahir Dar University, Ethiopia. 3Department of Geography and Environmental Studies, Bahir Dar University, Ethiopia. 4Department of Engineering Management, University of Antwerp, Belgium. 5Department of Natural Resource Management, Bahir Dar University, Ethiopia.
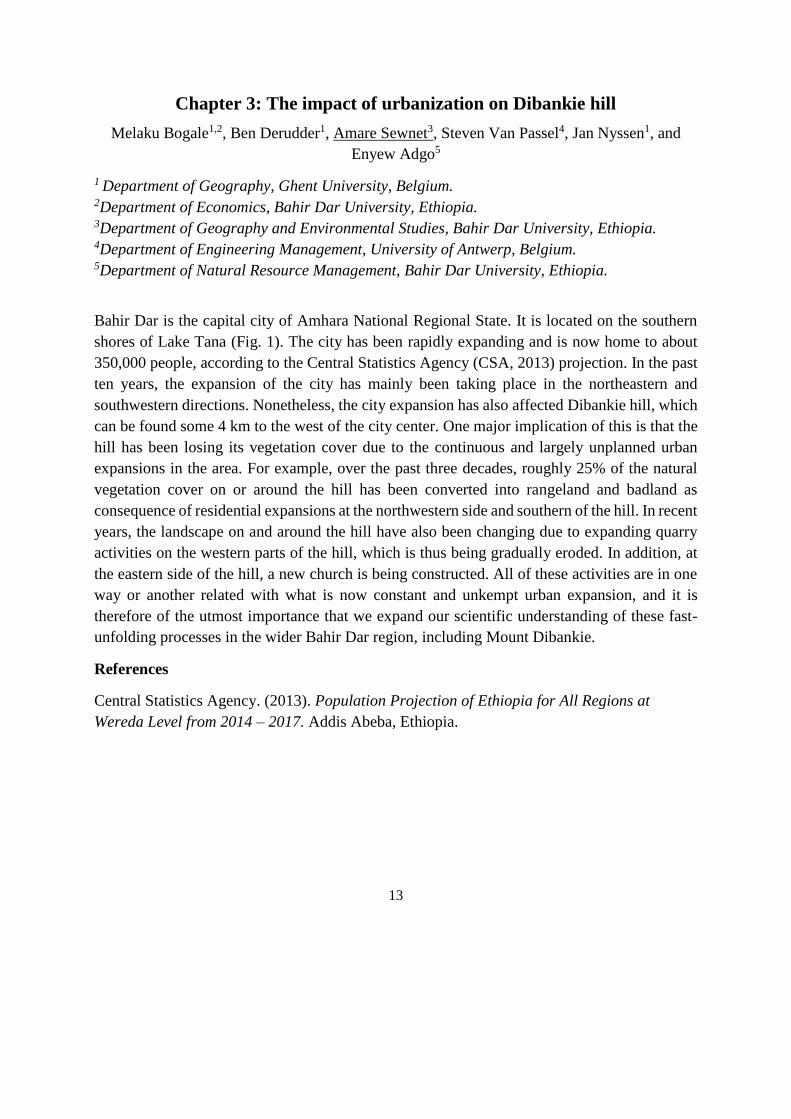
Bahir Dar is the capital city of Amhara National Regional State. It is located on the southern
shores of Lake Tana (Fig. 1). The city has been rapidly expanding and is now home to about
350,000 people, according to the Central Statistics Agency (CSA, 2013) projection. In the past
ten years, the expansion of the city has mainly been taking place in the northeastern and
southwestern directions. Nonetheless, the city expansion has also affected Dibankie hill, which
can be found some 4 km to the west of the city center. One major implication of this is that the
hill has been losing its vegetation cover due to the continuous and largely unplanned urban
expansions in the area. For example, over the past three decades, roughly 25% of the natural
vegetation cover on or around the hill has been converted into rangeland and badland as
consequence of residential expansions at the northwestern side and southern of the hill. In recent
years, the landscape on and around the hill have also been changing due to expanding quarry
activities on the western parts of the hill, which is thus being gradually eroded. In addition, at
the eastern side of the hill, a new church is being constructed. All of these activities are in one
way or another related with what is now constant and unkempt urban expansion, and it is
therefore of the utmost importance that we expand our scientific understanding of these fast-
unfolding processes in the wider Bahir Dar region, including Mount Dibankie.
References
Central Statistics Agency. (2013). Population Projection of Ethiopia for All Regions at
Wereda Level from 2014 – 2017. Addis Abeba, Ethiopia.

14
Fig. 1. Overview map of Bahir Dar
15
Chapter 4: Uncovering ecosystem services on expropriated land: A
participatory assessment in the case of urban expansion in Bahir Dar
Wubante Fetene Admasu*1,2, Annelies Boerema2,3, Jan Nyssen4, Amare Sewnet5, Enyew
Adgo6, Steven Van Passel2,7
1 Department of Land and Real Property Valuation, Bahir Dar University, Ethiopia 2 Department of Engineering Management, University of Antwerp, Belgium 3 Ecosystem Management Research Group (ECOBE), University of Antwerp, Belgium 4Department of Geography, Ghent University, Belgium 5 Department of Geography and Environmental Studies, Bahir Dar University, Ethiopia 6 Department of Natural Resource Management, Bahir Dar University, Ethiopia 7 Centre for Environmental Sciences, Hasselt University, Belgium
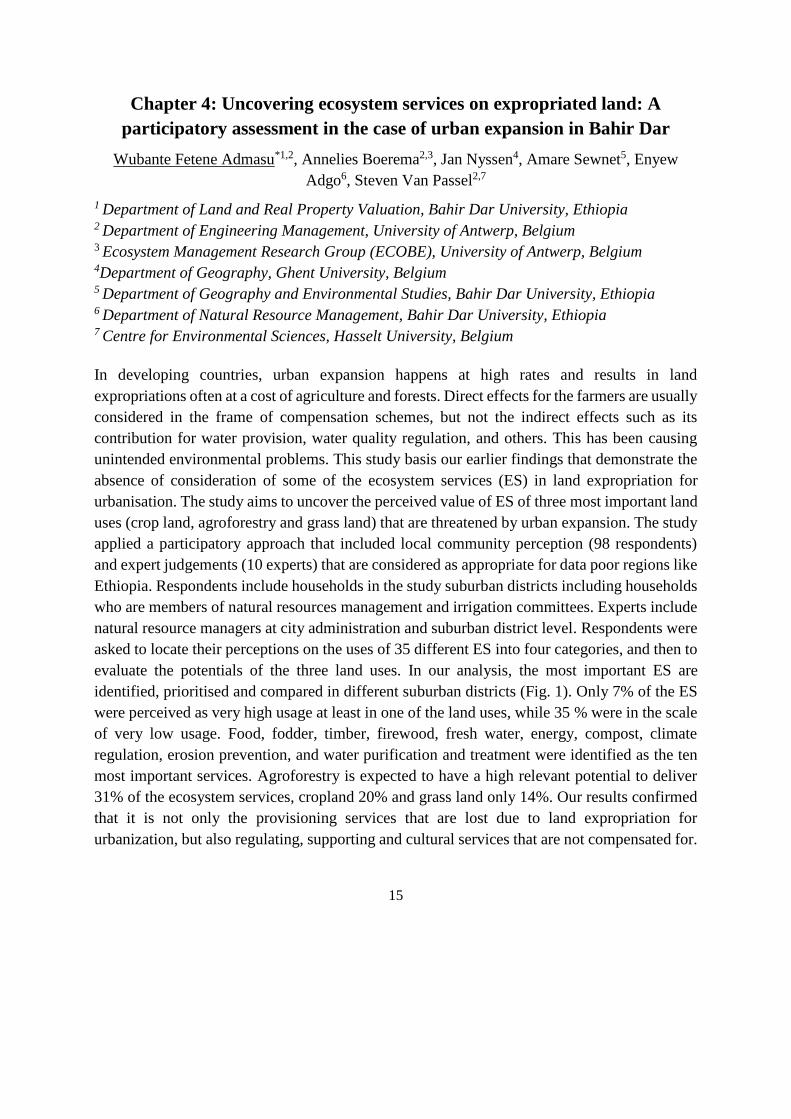
In developing countries, urban expansion happens at high rates and results in land
expropriations often at a cost of agriculture and forests. Direct effects for the farmers are usually
considered in the frame of compensation schemes, but not the indirect effects such as its
contribution for water provision, water quality regulation, and others. This has been causing
unintended environmental problems. This study basis our earlier findings that demonstrate the
absence of consideration of some of the ecosystem services (ES) in land expropriation for
urbanisation. The study aims to uncover the perceived value of ES of three most important land
uses (crop land, agroforestry and grass land) that are threatened by urban expansion. The study
applied a participatory approach that included local community perception (98 respondents)
and expert judgements (10 experts) that are considered as appropriate for data poor regions like
Ethiopia. Respondents include households in the study suburban districts including households
who are members of natural resources management and irrigation committees. Experts include
natural resource managers at city administration and suburban district level. Respondents were
asked to locate their perceptions on the uses of 35 different ES into four categories, and then to
evaluate the potentials of the three land uses. In our analysis, the most important ES are
identified, prioritised and compared in different suburban districts (Fig. 1). Only 7% of the ES
were perceived as very high usage at least in one of the land uses, while 35 % were in the scale
of very low usage. Food, fodder, timber, firewood, fresh water, energy, compost, climate
regulation, erosion prevention, and water purification and treatment were identified as the ten
most important services. Agroforestry is expected to have a high relevant potential to deliver
31% of the ecosystem services, cropland 20% and grass land only 14%. Our results confirmed
that it is not only the provisioning services that are lost due to land expropriation for
urbanization, but also regulating, supporting and cultural services that are not compensated for.

16
To ensure sustainable development, we suggest the consideration and compensation for main
ES in other categories too.
Key words: ecosystem services, land expropriations, land uses, urban expansion, community
perception.
Fig. 1. Comparisons of relative uses (using aggregate mean points) of ES by kebeles.
Key references
Burkhard, B., Kroll, F., Müller, F., & Windhorst, W. (2009). Landscapes' capacities to
provide ecosystem services-a concept for spatial planning. Landscape Online, 1(06), 1-30.
He, C., Zhang, D., Huang, Q., & Zhao, Y. (2016). Assessing the potential impacts of urban
expansion on regional carbon storage by linking the LUSD-urban and InVEST models.
Environmental Modelling & Software, 75, 44-58.
Krause, M. S., Nkonya, E., & Griess, V. C. (2017). An economic valuation of ecosystem
services based on perceptions of rural Ethiopian communities. Ecosystem Services, 26 (Part
A), 37-44.
Paudyal, K., Baral, H., Burkhard, B., Bhandari, S. P., & Keenan, R. J. (2015). Participatory
assessment and mapping of ecosystem services in a data-poor region: Case study of
community-managed forests in central Nepal. Ecosystem Services, 13 (Supplement C), 81-92.
Raymond, C. M., Bryan, B. A., MacDonald, D. H., Cast, A., Strathearn, S., Grandgirard, A.,
& Kalivas, T. (2009). Mapping community values for natural capital and ecosystem services.
Ecological Economics, 68(5), 1301-1315.
0
10
20
30
40
50
60
70
80
90
100
Addis Alem Woramit Wereb Zenzelima
Mea
n p
oin
ts
Kebeles
Provisioning
Regulating
Supportive
Cultural

17
Wubante Fetene, Van Passel, S., Amare Sewnet, Nyssen, J., Enyew Adgo, 2019. Take out the
farmer: an economic assessment of land expropriation for urbanisation in Bahir Dar,
northwest Ethiopia (under review).
18
Chapter 5: Inventory of potential geosites in the Lake Tana area: the case
of Dibankie Mountain
Getaneh Addis1,2, Jan van der Borg2, Jean Poesen2, Anton van Rompaey2, Kerebih Asrese3,
Amare Sewnet4, Jan Nyssen5, Enyew Adgo6, Steven Van Passel7
1Department of Tourism and Hotel Management, Bahir Dar University, Ethiopia 2Department of Earth and Environmental Studies, KU Leuven, Belgium
3Department of Social Work, Bahir University, Ethiopia 4Department of Geography and Environmental Studies, Bahir Dar University, Ethiopia 5Department of Geography, Ghent University, Belgium 6Department of Natural Resource Management, Bahir Dar University, Ethiopia 7Department of Engineering Management, University of Antwerp, Belgium
Geodiversity, which includes geological, geomorphological, mineralogical and other abiotic
natural futures, is an important resource for geotourism development. The Lake Tana area of
Ethiopia has rich geodiversity, including waterfalls, lakes, hot springs, wetlands, islands and
island monasteries, caves and cave churches, rock hewn churches, volcanic necks, volcanic
mountains, volcanic columns, potholes, viewpoints and scenic beauties. One of these
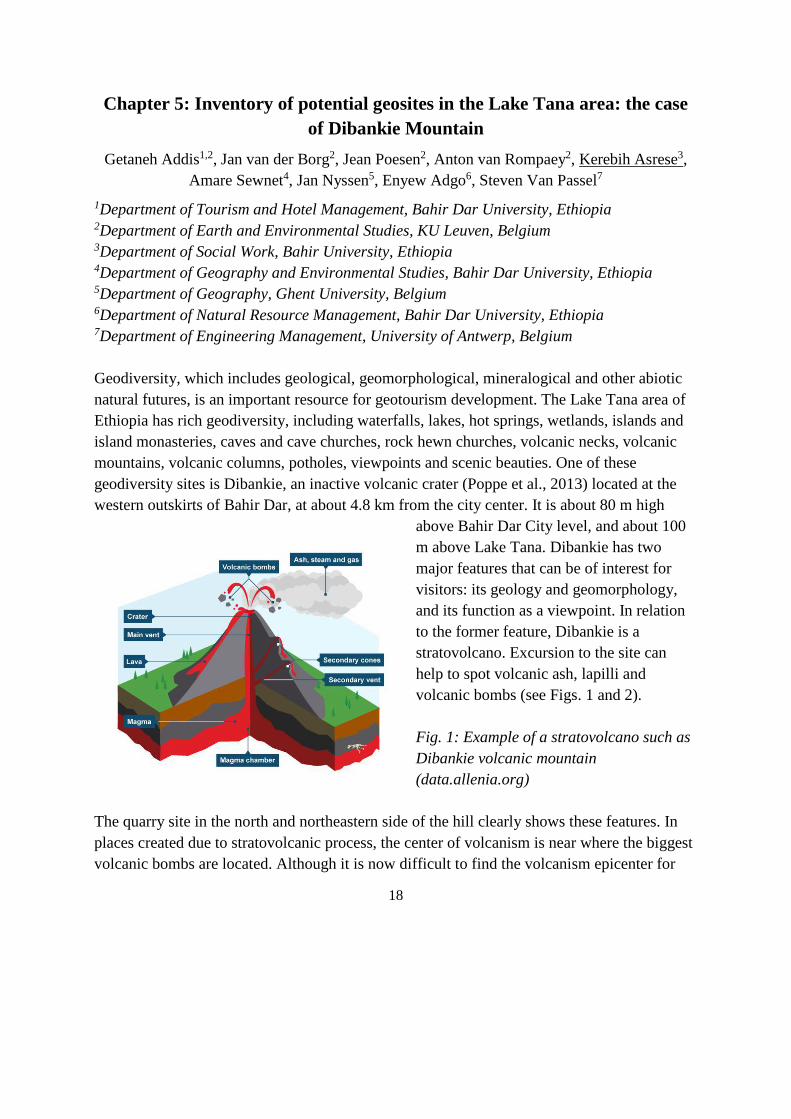
geodiversity sites is Dibankie, an inactive volcanic crater (Poppe et al., 2013) located at the
western outskirts of Bahir Dar, at about 4.8 km from the city center. It is about 80 m high
above Bahir Dar City level, and about 100
m above Lake Tana. Dibankie has two
major features that can be of interest for
visitors: its geology and geomorphology,
and its function as a viewpoint. In relation
to the former feature, Dibankie is a
stratovolcano. Excursion to the site can
help to spot volcanic ash, lapilli and
volcanic bombs (see Figs. 1 and 2).
Fig. 1: Example of a stratovolcano such as
Dibankie volcanic mountain
(data.allenia.org)
The quarry site in the north and northeastern side of the hill clearly shows these features. In
places created due to stratovolcanic process, the center of volcanism is near where the biggest
volcanic bombs are located. Although it is now difficult to find the volcanism epicenter for

19
Dibankie mountain due to gravel quarrying activity in the northern side, big boulders can still
be seen at the top of the mountain.
Fig. 2: The gravel quarry site at the north and northeastern side of Dibankie Mountain
Another major feature of Dibankie is that it can serve as an important viewpoint. Like Bezawit
hilltop, which is quite famous in the tourism itinerary in Bahir Dar, Dibankie mountain also
provides a spectacular view over Bahir Dar City, Zegie peninsula, Lake Tana and its island
monasteries, volcanic mountains and other landscapes in the area. Small-sized birds such as
red-cheeked cordon-bleu (Uraeginthus bengalus) can also be spotted in Dibankie.
20
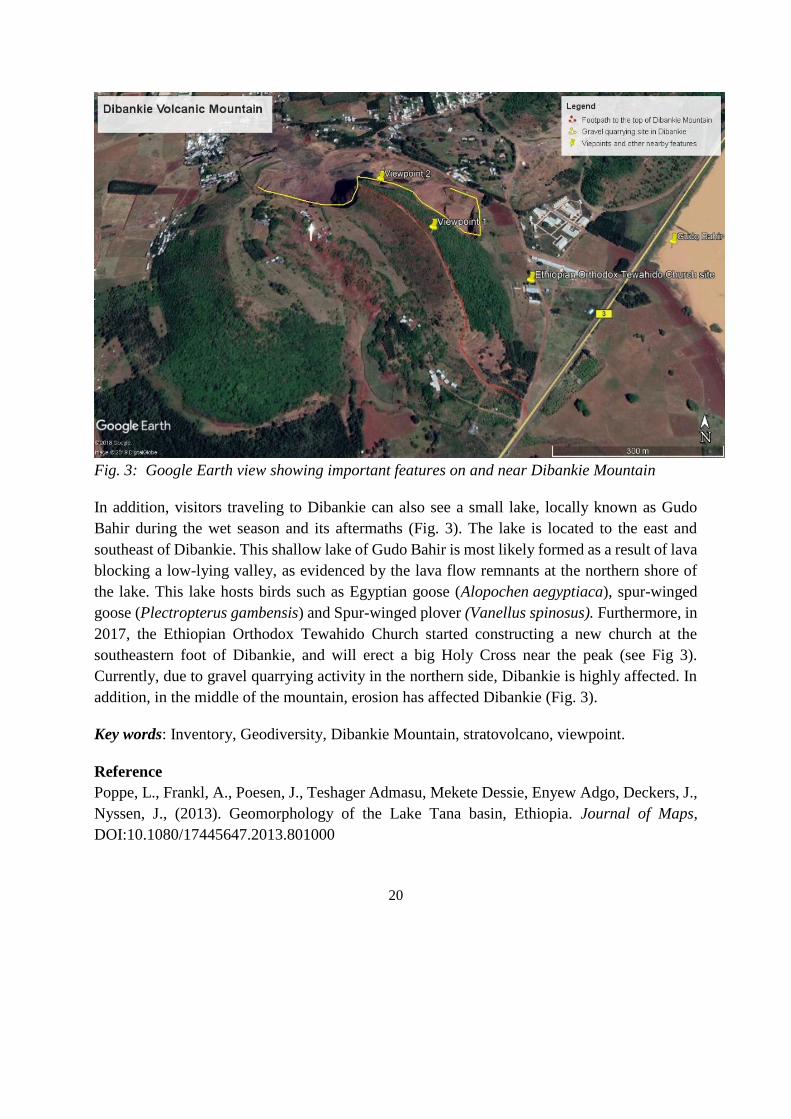
Fig. 3: Google Earth view showing important features on and near Dibankie Mountain
In addition, visitors traveling to Dibankie can also see a small lake, locally known as Gudo
Bahir during the wet season and its aftermaths (Fig. 3). The lake is located to the east and
southeast of Dibankie. This shallow lake of Gudo Bahir is most likely formed as a result of lava
blocking a low-lying valley, as evidenced by the lava flow remnants at the northern shore of
the lake. This lake hosts birds such as Egyptian goose (Alopochen aegyptiaca), spur-winged
goose (Plectropterus gambensis) and Spur-winged plover (Vanellus spinosus). Furthermore, in
2017, the Ethiopian Orthodox Tewahido Church started constructing a new church at the
southeastern foot of Dibankie, and will erect a big Holy Cross near the peak (see Fig 3).
Currently, due to gravel quarrying activity in the northern side, Dibankie is highly affected. In
addition, in the middle of the mountain, erosion has affected Dibankie (Fig. 3).
Key words: Inventory, Geodiversity, Dibankie Mountain, stratovolcano, viewpoint.
Reference
Poppe, L., Frankl, A., Poesen, J., Teshager Admasu, Mekete Dessie, Enyew Adgo, Deckers, J.,
Nyssen, J., (2013). Geomorphology of the Lake Tana basin, Ethiopia. Journal of Maps,
DOI:10.1080/17445647.2013.801000
21
Chapter 6: Improving agricultural water productivity in the Lake Tana
basin
Desale Kidane1,2, Mekete Dessie3, Seifu Tilahun3, P. Janssens4, J. Nyssen5, Enyew Adgo2, K.
Walraevens6, W. Cornelis1
1Department of Environment, Ghent University, Belgium 2Department of Natural Resource Management, Bahir Dar University, Ethiopia 3Bahir Dar Institute of Technology, Bahir Dar University, Ethiopia 4Soil Service of Belgium, Heverlee, Belgium 5Department of Geography, Ghent University, Belgium 6Laboratory for Applied Geology and Hydrogeology, Department of Geology, Ghent
University, Belgium
Field experiments on deficit irrigation integrated with management of acidic soils to improve
water productivity were undertaking in Koga irrigation scheme, south of Lake Tana basin. Prior
to the start of the experiment, a baseline study was carried on the selected experimental field to
assess its soil properties and groundwater level. The quality of irrigation water serving the field
was measured and soil management problems were identified. After having removed the litter
layers, disturbed and undisturbed soil samples (n = 36) were taken from nine representative
locations within the field using diagonal pattern. Depending on the plant root length, samples
were taken at 0-20, 20-40, 40-60 and 60-90 cm using auger and core sampler and analyzed for
bulk density, organic carbon, pH, Exchangeable acidity (H+, Al3+), and electrical conductivity
(EC) using standard procedures. Infiltration tests were done using a double ring infiltrometer
(Eijkelkamp, 1999). The groundwater level was measured from piezometers installed at 5.50 m
depth in the experimental fields, using Divers®. Under the irrigated wheat crop (variety
picaflor#1), soil moisture before and after irrigation was measured gravimetrically on samples
taken at 0-20, 20-40, 40-60 and 60-90 cm soil depth. Soil structure and the degree of soil
compaction were assessed semi-quantitatively using the Visual Evaluation of Soil Structure
(VESS) method and quantitatively with a penetrologger. The soil microbial activity was semi-
quantitatively evaluated by placing new cotton cloth in the plough layer at 15-20 cm depth. The
soil analysis showed that the texture is clayey and is strongly acidic with a pH (H2O) value of
5.14. The result of dry bulk density reveal that the surface soil (0-20 cm) had relatively low
bulk density (0.98±0.04 g/cm3) compared to sub-surface soil (20-90 cm), which had 1.19±0.03
g/cm3, indicating that the occurrence of soil compaction below 20 cm soil layer. The
compaction test result and the photos taken at the experimental site confirmed the availability
of soil compaction. Asmamaw et al. (2012) and Temesgen et al. (2012) confirmed the
availability of hard pan below 15-20 cm soil layer in Chemoga watershed, northwestern
22
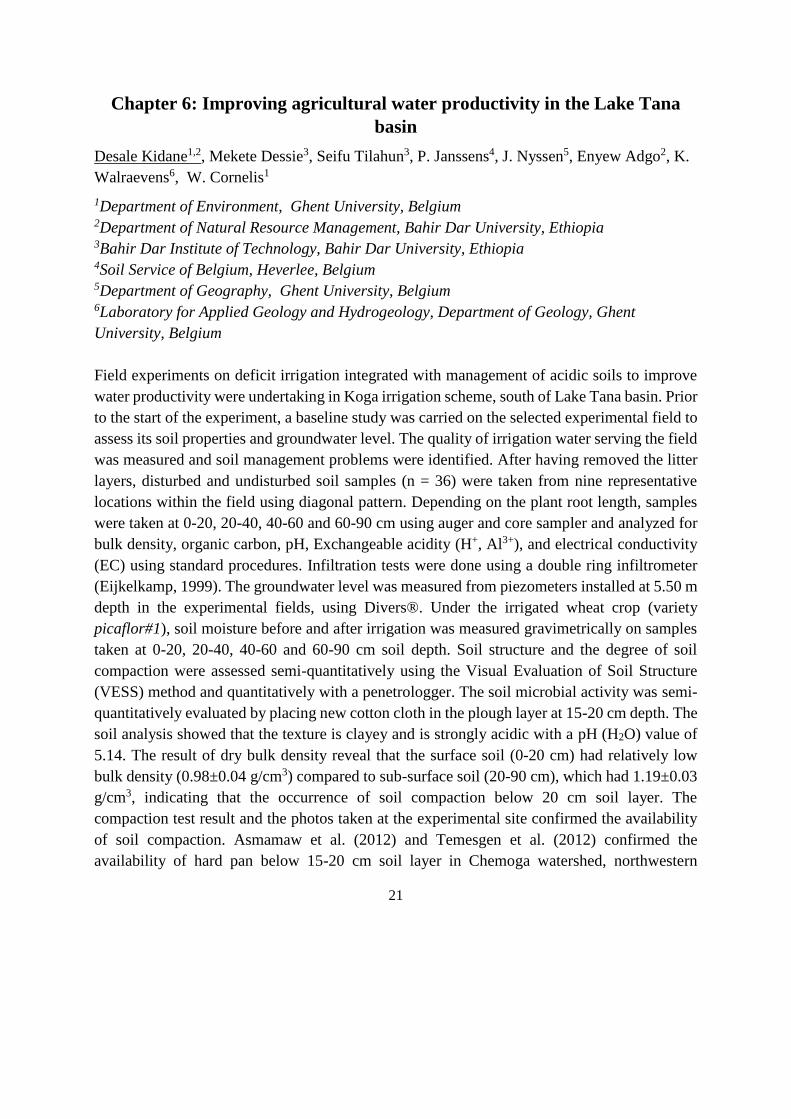
Ethiopia. The mean EC of the soil and the irrigation water were (0.075 dS/m) and (0.082 dS/m),
respectively. As it can be seen in Figure 1, the soil shows a moderate infiltration capacity of
0.045±0.002 cm/min.
Figure 1: Infiltration rate (IR) and cumulative infiltration capacity (CI) of the study soil
Key words: Bulk density, exchangeable acidity, infiltration capacity, infiltration rate
References
Desale Kidane Asmamaw, Melesse Temesgen Leye, and Abdu Abdulkadir Mohammed,
2012. Effect of Winged Sub-soiler and Traditional Tillage Integrated with Fanya Juu on
Selected Soil Physico-Chemical and Soil Water Properties in the Northwestern Highlands of
Ethiopia. East African Journal of Sciences, 6 (2): 105-116.
Eijkelkamp,1999. Operating instructions for Double Ring Infiltrometer set M10904.
Agrisearch equipment.
Melesse Temesgen., Uhlenbrook, S., Belay Simane., van der Zaag, P., Mohamed, Y.,
Wenninger J. and Savenije, H. H. G. 2012. Impacts of conservation tillage on the hydrological
and agronomic performance of Fanya juus in the upper Blue Nile (Abbay) river basin. Hydrol.
Earth Syst. Sci., 16: 4725–4735.
y = -0,0034x2 + 0,3347x + 0,6481R² = 0,9813
0 20 40 60
0
0,1
0,2
0,3
0,4
0,5
0
2
4
6
8
10
Time (min)
Infi
ltra
tion r
ate
(cm
/min
)
Cum
ula
tive
infi
ltra
tion (
cm)
CI (cm) IR (cm/min)

23
Chapter 7: Role of public extension performers’ as source of information
and knowledge to smallholder farmers - the case of northwest Ethiopia
Yemane Asmelash 1,2, J. Dessein1,3, Beneberu Assefa 2, M. Breusers4, Enyew Adgo2, L.
Lenaerts1,5, Tesfaye Shiferaw 6, J. Nyssen7
1Ghent University, Dpt. of Agricultural Economics, Belgium 2Bahir Dar University, College of agriculture and Environmental Sciences, Ethiopia 3 Instituut voor Landbouw-Visserij-en Voedingsonderzoek (ILVO), Belgium 4Institute for Anthropological Research in Africa, KU Leuven, Belgium 5Faculty of Biosciences (BIOVIT), Norwegian University of Life Sciences (NMBU), Norway 6Bahir Dar University, College of Science, Ethiopia 7Ghent University, Department of Geography, Belgium
Currently, there are four actors in agricultural extension: public agencies, private service
providers, Producer Organizations (POs), and Non-Governmental Organizations (NGOs).
Farmers need the latest information on an array of issues such as, pest outbreaks, inputs, markets,
meteorological forecasts, agronomic practices, pest and disease management. This paper
explores the role of public sector actors in information and knowledge arena. The study was
conducted in two districts of northwest Ethiopia, namely North Mecha and Fogera. For the
research design, Key Informant Interviews (KII) and Focus Group Discussions (FGD) were
used as the main data collection tools. A total of 16 KII and 20 FGDs were administered.
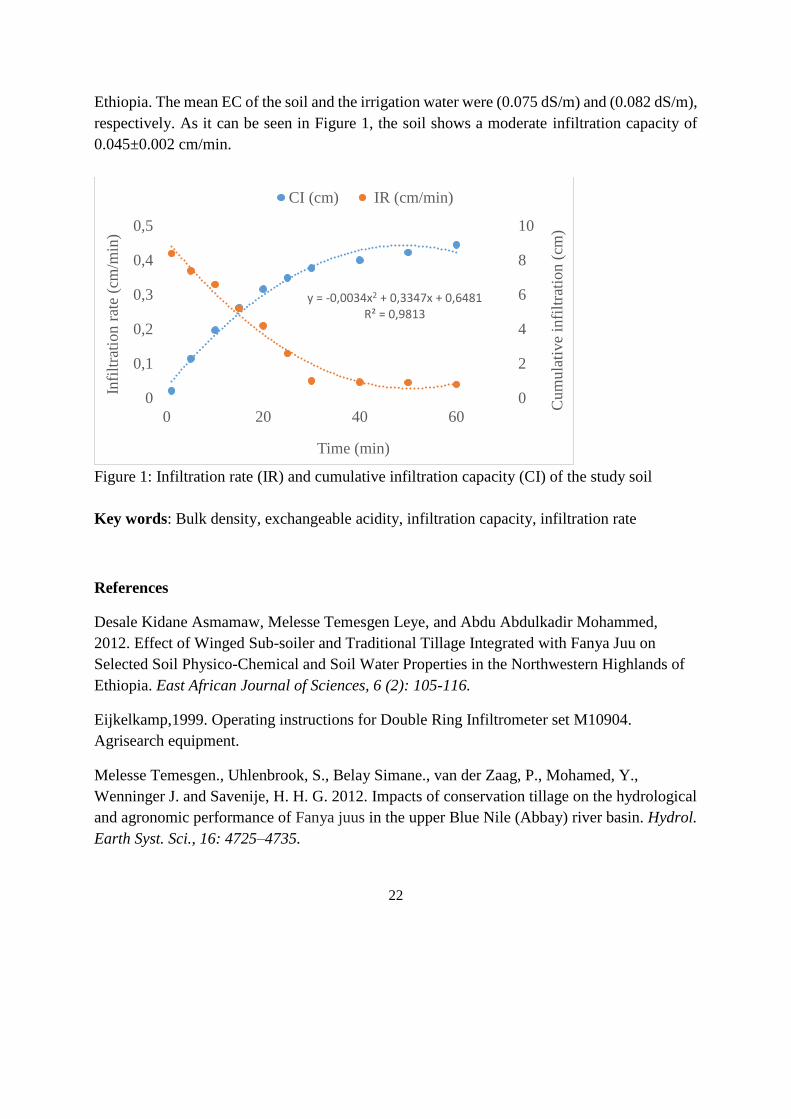
Fig 1. Information and knowledge dissemination performers
Research organizations
Different Farming
technologies
Technology generation
Technology dissimination
Technology evaluation
District office of agriculture
SMS Group from different
discipline
Sub-district Agricultural office
Plant Science Expert
Animal Science Expert
Natural Resource
Expert
Veternary Expert
Cooperative expert
25-30 farmers (Development
Group)
Leaders (contact farmers)
1:5 Group
Fellow Farmers
24
The results show that the performers have the role to induce knowledge and information which
is specific to rice and vegetables. Public agencies are the most primarily origins of information
and knowledge (Fig. 1). The Office of Agriculture of the Sub-districts is considered as the main
source of information and knowledge for smallholder farmers. Regional and national
agricultural research institutes are liable to create and pilot technologies to end users along with
information and knowledge. For instance, the two research centers, namely, Adet and Fogera
are perceived as the main sources of information and knowledge. Thus, it is concluded that
smallholder farmers’ use multiple sources of information from public extension agencies.
Key words: Public extension, Information, Knowledge, Northwest Ethiopia
Performers’ role, in view of the respondents (KII (n=16); FGDs (n=20))
Research Organizations (ROs)
The Fogera rice and Adet are the two research organizations in the districts aiming at
transferring actionable messages and technologies. However, they do not satisfy the
technological need of the end users. They are slow in responding to problems raised by farmers
and extension agents. For example, the former X-jigna rice variety in Fogera has not until now
been complemented by potentially better varieties, though some attempts are carried. Mecha
farmers are facing market problems for their vegetables. They are forced to sell at lower prices
and brokers are much benefited, because ROs have not contributed much to overcome
weaknesses in the value chains and value addition so far. Yet, substantial efforts such as the
introduction of improved rice varieties and post-harvest technologies are currently undertaken
by both research organizations.
District Office of Agriculture (DOA)
The DOA rarely visited farmers. However, they are considered as a source of information. They
disseminate information on new technologies, advice on marketing, product quality, and
environmental challenges. Still, the quality and dependability of information is under
interrogation. It is criticized for disorganization, ineffectiveness, and deficiency of quality
information.
Sub-district Agricultural Office (SAO)
They are the Frontline development practitioners executing development and extension
programs at the bottom level. However, they are required to be taken in various non-extension
activities including credit distribution, collection of credit repayments and delegate of
government officials. This inhibits them from providing information and knowledge to farmers
genuinely. Lack of transport limits EAs to travel from one village to another in the sub-district.

25
Moreover, Extension Agents (EAs) are not more responsive to farmers. Political commitment
has highly influenced the activities of EAs and burdened their primary jobs.
Development Groups (DG)
25-30 farmers are grouped together and called Development Group. It is a government
organizational arrangement and structure in agricultural extension. Nevertheless, it is not only
used by the agriculture sector. Other agencies like health, land administration and environment
affairs use this structure to implement their programs at grass root level. The purpose of this
group is to close gaps between EAs and farmers because EAs could not address all growers and
livestock keepers in the villages. The DGs are working as a bridge to transfer knowledge,
technologies and relevant agricultural messages to the majority of farmers.
1:5 Group
This is the lowest structure in the dissemination of information and knowledge. The structure
was expected to share information and knowledge on farm issues. However, because of various
reasons such as lack of interest to come together, boredom due to frequent meetings, farmers
were busy when they were called and they preferred to conduct their own job than to go to the
meetings; it is not performing as it is expected.
References
Abesha, D., Waktola, A., & Aune, J. B. (2000). Agricultural Extension in the drylands of
Ethiopia: Drylands Coordination Group.
Adamo, A. K. (2001). Participatory agricultural research processes in Eastern and Central
Ethiopia: using farmers social networks as entry points.
Aker, J. C. (2011). Dial “A” for agriculture: a review of information and communication
technologies for agricultural extension in developing countries. Agricultural Economics, 42 (6),
631-647.
Anderson, J. R., & Feder, G. (2004). Agricultural extension: Good intentions and hard realities.
The World Bank Research Observer, 19(1), 41-60.
Birner, R., & Anderson, J. R. (2007). How to make agricultural extension demand driven? The
case of India's agricultural extension policy (Vol. 729): Intl Food Policy Res Inst.
Kassa, B., & Alemu, D. (2016). Agricultural research and extension linkages: Challenges and
intervention options. Ethiopian Journal of Agricultural Sciences, 27(1), 55-76.
Sanginga, P. C., Tumwine, J., & Lilja, N. K. (2006). Patterns of participation in farmers’
research groups: Lessons from the highlands of southwestern Uganda. Agriculture and Human
Values, 23(4), 501-512.
26
Chapter 8: Direct and indirect effect of irrigation water availability on crop
revenue: A Structural Equation Model
Markose Chekol1,2; Steven Van Passel1,2,3; Daregot Berihun2; Jan Cools2,4; Zemen Ayalew5;
Amare Sewnet6; Enyew Adgo7; Jan Nyssen8
1Department of Engineering Management, Faculty of Applied Economics, University of
Antwerp, Belgium 2Department of Economics, College of Business and Economics, Bahir Dar University,
Ethiopia 3Centre for Environmental Sciences, Hasselt University, Belgium 4Institute of Environment and Sustainable Development, University of Antwerp, Belgium 5Department of Agricultural Economics, Bahir Dar University, Ethiopia 6Department of Geography and Environmental Studies, Bahir Dar University, Ethiopia 7Department of Natural Resource Management, Bahir Dar University, Ethiopia. 8Department of Geography, Ghent University, Belgium
The development of a clear understanding of the links between dam-driven irrigation water
uses and crop revenue is important for poverty reduction and food security. As a result, large
research efforts are devoted to the development of a link between crop production and
irrigation water (irrigation water availability causes high crop revenue). However, with the
application of a structural equation model, this paper argues that a one-sided argument of
irrigation water availability that causes high crop revenue is incomplete, as irrigation water
availability not only directly contributes to crop revenue but also indirectly conduces to crop
revenue via receptivity of the farmers to use improved farm inputs. In this study, the direct
and indirect effect of irrigation water on crop revenue is decomposed and quantified
specifically for the Koga irrigation scheme, located south of Lake Tana (northwest Ethiopia).
A primary data set was collected from a randomly selected sample of 450 households (254
farmers have access to irrigation water and 196 haven’t). The results showed that, in addition
to its direct effect, availability of irrigation water indirectly affects crop revenue. This indirect
effect is about 27 percent of the total effect and mediated by the receptivity of the farmers to
use improved farm inputs. The results suggested that irrigation water is essential to improve
both crop revenue and receptivity of the farmers to use improved farm inputs. This finding
also drives a strategic framework that the receptivity of the farmers to use modern farm inputs
is crucial for utilizing the positive effects of irrigation water availability on crop revenue. To
achieve high crop revenue, our model suggests that it is important not only to work on the
provision of irrigation water, but also on the farmers’ willingness to use other improved farm
inputs.
27
Keywords: Koga Dam; Irrigation Water; Crop Revenue; Farmers’ Receptivity; Improved
Farm Inputs.
References
Anderson, J.C., Gerbing, D.W., 1988. Structural Equation Modeling in Practice: A Review and
Recommended Two-Step Approach. Psychol. Bull. 103, 411–423.
https://doi.org/10.1037/0033-2909.103.3.411
Barker, R., Van Koppen, B., 2000. A Global Perspective on Water Scarcity and Poverty:
Achievements and Challenges for Water Resource Management, International Water
Management Institute Water Brief N°3. Colombo, Sri Lanka.
Olayide, O.E., Tetteh, I.K., Popoola, L., 2016. Differential impacts of rainfall and irrigation on
agricultural production in Nigeria: Any lessons for climate-smart agriculture? Agric.
Water Manag. 178, 30–36. https://doi.org/10.1016/j.agwat.2016.08.034
Silalertruksa, T., Gheewala, S.H., 2018. Land-water-energy nexus of sugarcane production in
Thailand. J. Clean. Prod. 182, 521–528. https://doi.org/10.1016/j.jclepro.2018.02.085
Wakeyo, M.B., Gardebroek, C., 2013. Does water harvesting induce fertilizer use among
smallholders? Evidence from Ethiopia. Agric. Syst. 114, 54–63.
https://doi.org/10.1016/j.agsy.2012.08.005
Zewdie, M., Van Passel, S., Tenessa, D., Cools, J., Ayele, Z., Minale, A., Tsegaye, E., Nyssen,
J., 2018. Direct and indirect effect of irrigation water availability on crop revenue: a
structural equation model. Manuscript submitted for publication.
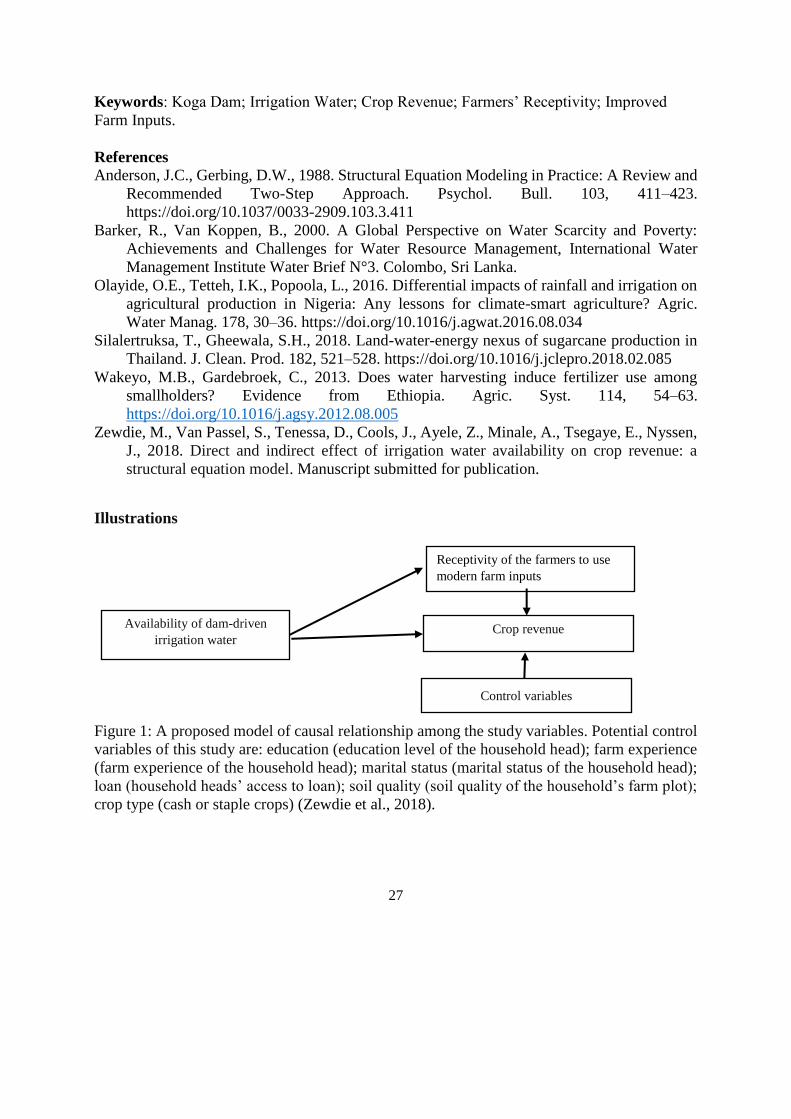
Illustrations
Figure 1: A proposed model of causal relationship among the study variables. Potential control
variables of this study are: education (education level of the household head); farm experience
(farm experience of the household head); marital status (marital status of the household head);
loan (household heads’ access to loan); soil quality (soil quality of the household’s farm plot);
crop type (cash or staple crops) (Zewdie et al., 2018).
Receptivity of the farmers to use
modern farm inputs
Availability of dam-driven
irrigation water
Crop revenue
Control variables

28
Figure 2: Partially mediated structural equation model (N = 450). All the estimated parameters
are standardized, and the standard errors (SE) and p-values are for the standardized estimates
of the parameters. Receptivity: willingness of the farmers to apply modern farm inputs;
irrigation water: availability of dam-driven irrigation water; LnCRPH: crop revenue per hectare
(after transformation); education: education level of the household head; farm experience: farm
experience of the household head; marital status: marital status of the household head; loan:
household heads’ access to loans; soil quality: soil quality of the households plot; crop type
(cash or staple crops). The path with light (not bold) standard error and p-value are statistically
insignificant (Zewdie et al., 2018).
29
Chapter 9: Water balance of Tana basin: progress
Alemu Yenehun1,2, Mekete Dessie3, Mulugeta Azeze3, Fenta Nigate1,2, Marc Van Camp2,
Ann van Griensven4, Enyew Adgo5, Jan Nyssen6, Kristine Walraevens2
1School of Earth Sciences and Blue Nile Water Institute, Bahir Dar University, Bahir Dar,
Ethiopia 2Laboratory for Applied Geology and Hydrogeology, Department of Geology, Ghent
University, Gent, Belgium 3School of Civil and Water Resources Engineering, Bahir Dar University, Bahir Dar,
Ethiopia 4Department of Hydrology and Hydraulic Engineering, Vrije Universiteit Brussel, Brussel,
Belgium 5Department of Natural Resources, Bahir Dar University, Ethiopia 6Department of Geography, Ghent University, Belgium
Lake Tana basin, one of the major sub-basins of Upper Blue Nile River basin, covers 15,077
km2 of which 3,156 km2 is the lake water body. The basin is rounded in shape with a central
depression; it is geologically complex and thought to be formed by the junction of three grabens,
dipping to a central depression, which was dammed afterwards by the deposition of quaternary
volcanic rocks. More than forty rivers are draining to the lake from which four are the major
ones. Characterizing the different aquifer systems and their hydrological connectivity with the
lake and river water bodies will fill the knowledge gap in understanding the hydro(geo)logical
system of the basin, and in upgrading the water balance studies. Hence, constant rate pumping
tests on shallow groundwater wells representing different aquifer systems have been executed.
Accordingly, an average transmissivity value of 2.73 m2/day has been estimated for pyroclastic
tuff, 10.38 m2/day for Oligocene-Miocene basalt, 365.2 m2/day for Quaternary basalt, 2.55
m2/day for highland residual-alluvial soil, and 2.99 m2/day for floodplain alluvio-lacustrine
aquifers. A number of automatic and manual measuring stations for monitoring of shallow
groundwater (69), surface water (14) and meteorological (14) variables (rainfall and
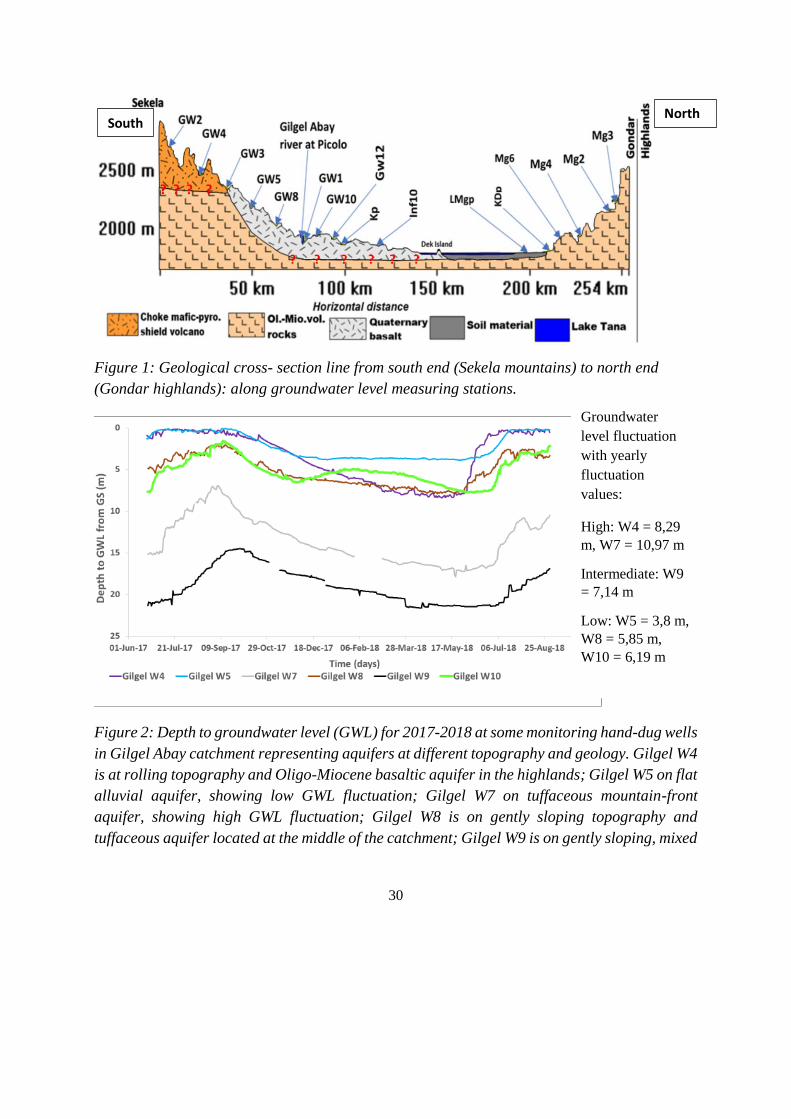
temperature) have been established. Results show that the groundwater level for tuff and basalt
top aquifers has a strong response to the rainfall compared to the middle and floodplain aquifer
systems (Figure 2, Gilgel W4 and W7 vs Gilgel W5, respectively). In general, the upper sloping
mountain-front and highland aquifers are characterized by sharp water level rises for the early
rainfalls and immediate decline following the offset of the rainfall (Figure 2, Gilgel W4 and
W7). In aquifer systems located at the foothill or at mountain-front, subsurface recharge from
the surrounding mountain areas occurs.
Keywords: Water balance, pumping test, transmissivity, groundwater level, aquifer
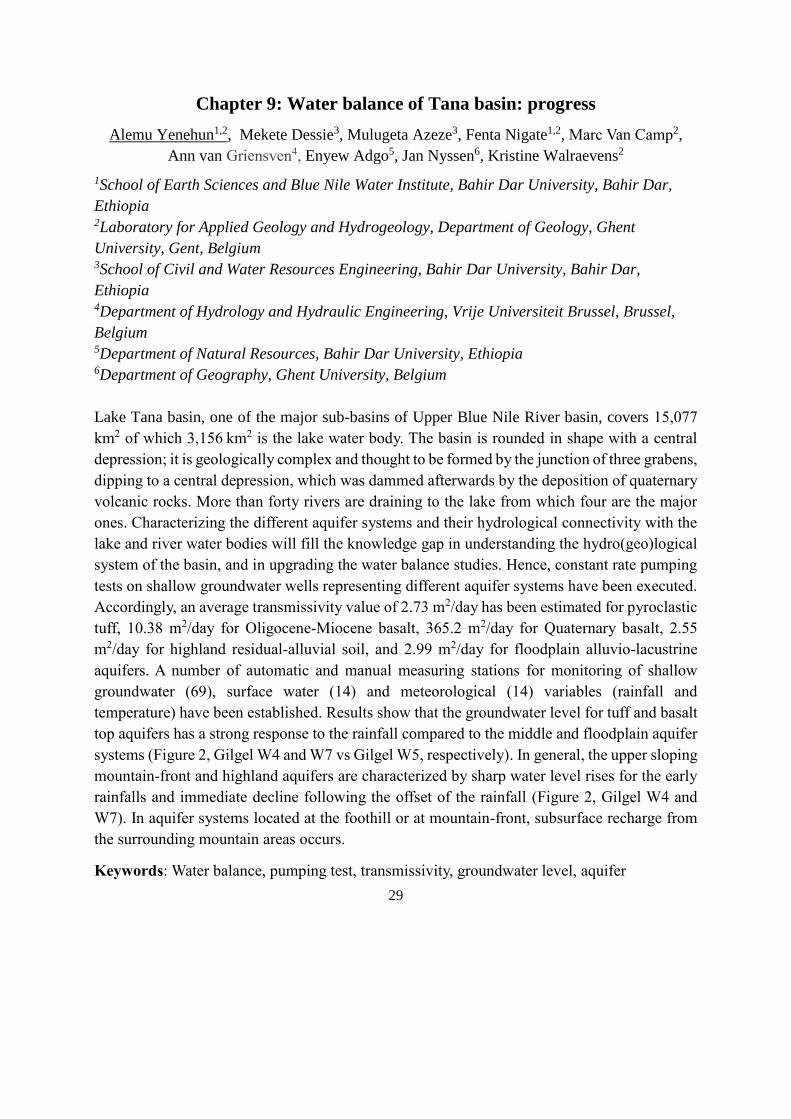
30
Figure 1: Geological cross- section line from south end (Sekela mountains) to north end
(Gondar highlands): along groundwater level measuring stations.
Figure 2: Depth to groundwater level (GWL) for 2017-2018 at some monitoring hand-dug wells
in Gilgel Abay catchment representing aquifers at different topography and geology. Gilgel W4
is at rolling topography and Oligo-Miocene basaltic aquifer in the highlands; Gilgel W5 on flat
alluvial aquifer, showing low GWL fluctuation; Gilgel W7 on tuffaceous mountain-front
aquifer, showing high GWL fluctuation; Gilgel W8 is on gently sloping topography and
tuffaceous aquifer located at the middle of the catchment; Gilgel W9 is on gently sloping, mixed
South North
Groundwater
level fluctuation
with yearly
fluctuation
values:
High: W4 = 8,29
m, W7 = 10,97 m
Intermediate: W9
= 7,14 m
Low: W5 = 3,8 m,
W8 = 5,85 m,
W10 = 6,19 m
31
(layers of both tuff and basalt) aquifer; and Gilgel W10 on Quaternary basalt at Koga command
area where rise in the dry season is due to recharge by irrigation water.
References
Alemu Yenehun, Fenta Nigatie, Ashebir Sewale, Minyahil Teferi, Marc Van Camp, Kristine
Walraevens, 2019. Groundwater recharge estimation and aquifer response to rainfall and
evapotranspiration: Case of Upper Kliti River, Tana Basin, North West Ethiopia (submitted).
Alemu Yenehun, Mekete Dessie, Mulugeta Azeze, Fenta Nigate, Ashebir Sewale, Marc Van
Camp, Ann van Griensven, Enyew Adgo, Jan Nyssen, Kristine Walraevens, 2019. Water
balance and hydro(geo)chemistry of Lake Tana Basin, Northern Ethiopia: Review (in
preparation).
Dessie, M., Verhoest, N.E.C., Admasu, T., Pauwels, V.R.N., Poesen, J., Adgo, E., Deckers, J.,
Nyssen, J., 2014. Effects of the floodplain on river discharge into Lake Tana (Ethiopia). J.
Hydrol. 519, 699–710. https://doi.org/10.1016/j.jhydrol.2014.08.007.
Dessie, M., Verhoest, N.E.C., Pauwels, V.R.N., Adgo, E., Deckers, J., Poesen, J., Nyssen, J.,
2015. Water balance of a lake with floodplain buffering: Lake Tana, Blue Nile Basin, Ethiopia.
J. Hydrol. 522, 174–186. https://doi.org/10.1016/j.jhydrol.2014.12.049.
Nigate, F., Van Camp, M., Kebede, S., Walraevens, K., 2016. Hydrologic interconnection
between the volcanic aquifer and springs , Lake Tana basin on the Upper Blue Nile. J. African
Earth Sci. 121, 154–167. https://doi.org/10.1016/j.jafrearsci.2016.05.015.
32
Chapter 10: Water balance of Beles basin
Ashebir Sewalea,b, Seifu Admassuc, Michael Meharic, Mekete Dessiec, Enyew Adgod, Jan
Nyssene, Margaret Chenf and Kristine Walraevensb
1 School of Earth Sciences and Blue Nile Water Institute, Bahir Dar University, Ethiopia 2Laboratory for Applied Geology and Hydrogeology, Department of Geology, Ghent
University, Belgium
3 School of Civil & Water Resources Engineering, Bahir Dar University, Ethiopia 4 Department of Natural Resource Management, Bahir Dar University, Ethiopia. 5 Department of Geography, Ghent University, Gent, Belgium 6 Department of Hydrology and Hydraulic Engineering, Faculty of Engineering, Vrije
Universiteit Brussel, Belgium
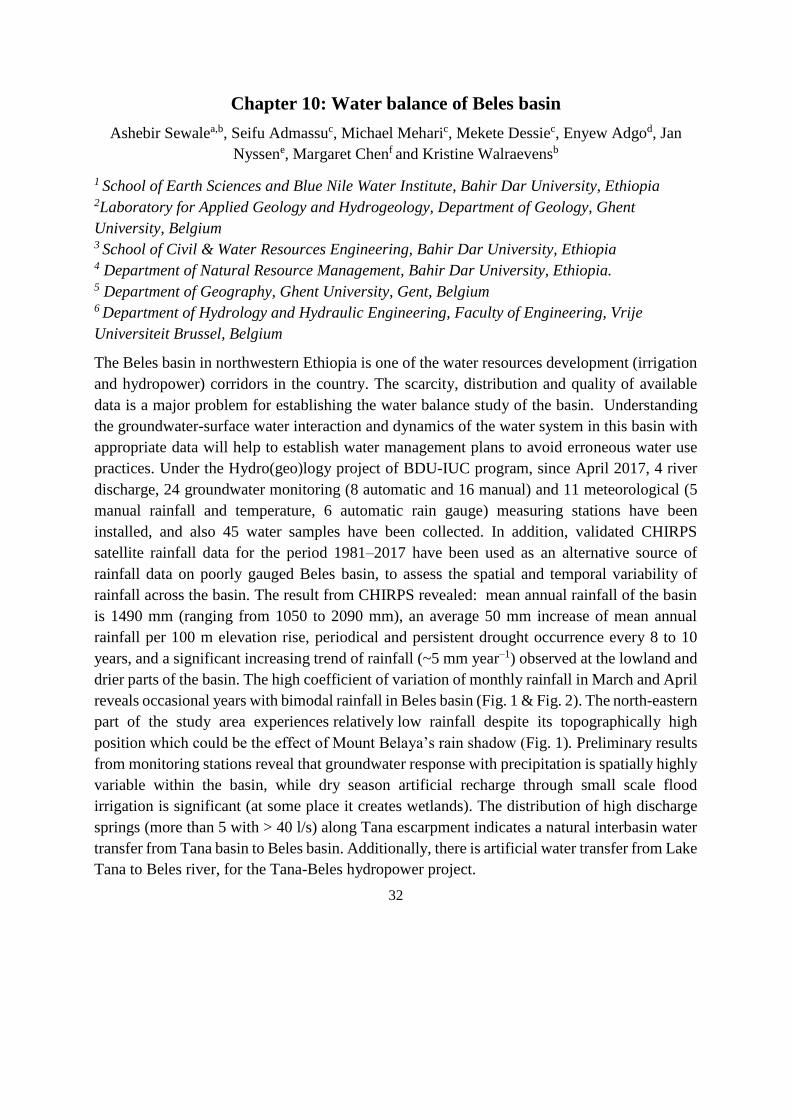
The Beles basin in northwestern Ethiopia is one of the water resources development (irrigation
and hydropower) corridors in the country. The scarcity, distribution and quality of available
data is a major problem for establishing the water balance study of the basin. Understanding
the groundwater-surface water interaction and dynamics of the water system in this basin with
appropriate data will help to establish water management plans to avoid erroneous water use
practices. Under the Hydro(geo)logy project of BDU-IUC program, since April 2017, 4 river
discharge, 24 groundwater monitoring (8 automatic and 16 manual) and 11 meteorological (5
manual rainfall and temperature, 6 automatic rain gauge) measuring stations have been
installed, and also 45 water samples have been collected. In addition, validated CHIRPS
satellite rainfall data for the period 1981–2017 have been used as an alternative source of
rainfall data on poorly gauged Beles basin, to assess the spatial and temporal variability of
rainfall across the basin. The result from CHIRPS revealed: mean annual rainfall of the basin
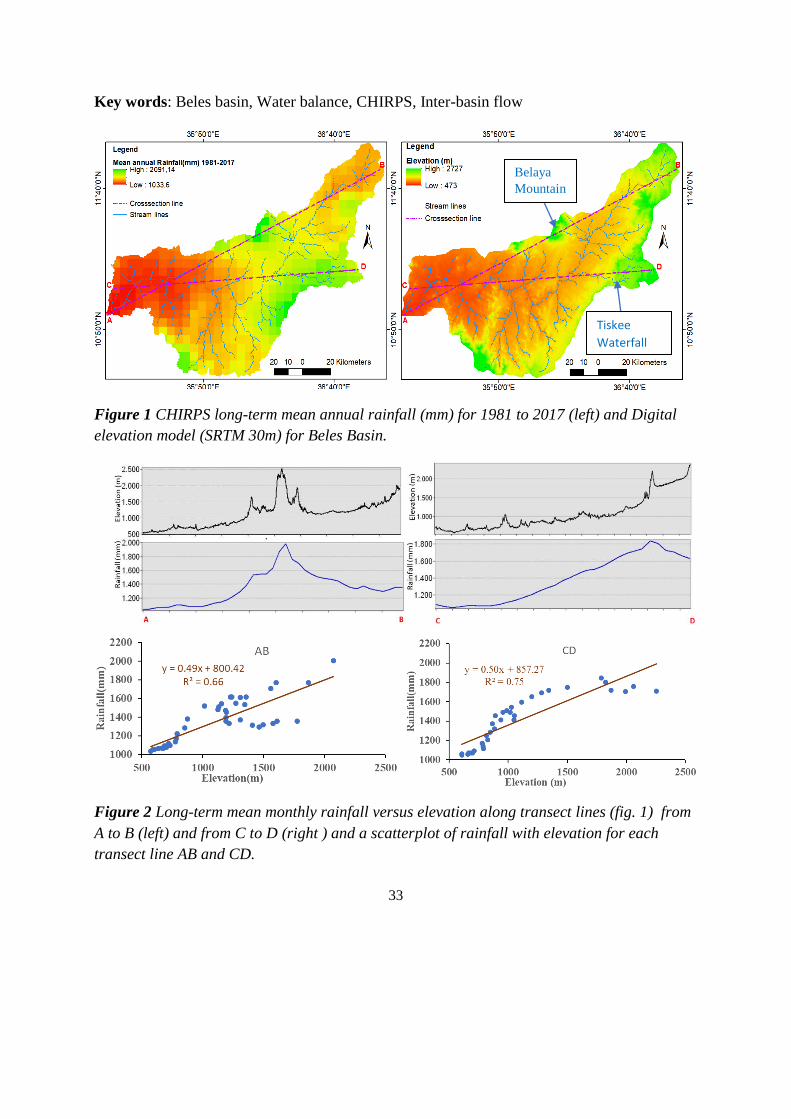
is 1490 mm (ranging from 1050 to 2090 mm), an average 50 mm increase of mean annual
rainfall per 100 m elevation rise, periodical and persistent drought occurrence every 8 to 10
years, and a significant increasing trend of rainfall (~5 mm year–1) observed at the lowland and
drier parts of the basin. The high coefficient of variation of monthly rainfall in March and April
reveals occasional years with bimodal rainfall in Beles basin (Fig. 1 & Fig. 2). The north-eastern
part of the study area experiences relatively low rainfall despite its topographically high
position which could be the effect of Mount Belaya’s rain shadow (Fig. 1). Preliminary results
from monitoring stations reveal that groundwater response with precipitation is spatially highly
variable within the basin, while dry season artificial recharge through small scale flood
irrigation is significant (at some place it creates wetlands). The distribution of high discharge
springs (more than 5 with > 40 l/s) along Tana escarpment indicates a natural interbasin water
transfer from Tana basin to Beles basin. Additionally, there is artificial water transfer from Lake
Tana to Beles river, for the Tana-Beles hydropower project.
33
Key words: Beles basin, Water balance, CHIRPS, Inter-basin flow
Figure 1 CHIRPS long-term mean annual rainfall (mm) for 1981 to 2017 (left) and Digital
elevation model (SRTM 30m) for Beles Basin.
Figure 2 Long-term mean monthly rainfall versus elevation along transect lines (fig. 1) from
A to B (left) and from C to D (right ) and a scatterplot of rainfall with elevation for each
transect line AB and CD.
Tiskee
Waterfall
Belaya
Mountain

34
Reference
Belay, A.S., Tilahun S.A., Moges, M. , Dessie, M., Adgo, E., Nyssen, J., Chen, M., Walraevens,
K., 2019. Assessment of spatio-temporal variability of rainfall using validated multi-source
satellite rainfall product(CHIRPS) in poorly gauged Beles Basin, Ethiopia. (In preparation )

35
Chapter 11: Dormancy, flower bud and fruit quality under conditions of
insufficient chilling in apple (Malus domestica)
Yemisrach Belay1,2, Jonas Van Eeghem2, Getachew Alemayehu3, Enyew Adgo4, Jan Nyssen5
and Wannes Keulemans2 1Department of Biology, College of Science, Bahir Dar University, P.O. Box: 79, Bahir Dar,
Ethiopia 2 Department of Department of Biosystems, Division of Crop Biotechnics,Willem de Croylaan
42 - box 2427, 3001 Leuven, Belgium 3 Department of Agronomy, Plant Sciences, College of Agriculture and Environmental Sciences,
Bahir Dar University, P.O.Box 79, Bahir Dar Ethiopia 4Departement of Natural Resource Management, Bahir Dar University, P.O. Box: 5501, Bahir
Dar, Ethiopia 5Department of Geography, Ghent University, Belgium
Although, apple (Malus x domestica, Borkh.) is a temperate fruit species that has got a lot of
interest in Ethiopia, due to its economic importance. Its production in Ethiopia has a major
problem due to insufficient chilling that affects the period of endo-dormancy. This is manifested
by irregular bud break, flower bud development, flowering, fruit set, fruit development and fruit
quality. This doctoral study is therefore designed to get a better insight into the genetic control
of the process of endo-dormancy starting from onset of endo-dormancy until early fruit set
under conditions of insufficient chilling by concentrating on the molecular and morphological
aspects underlying these processes. We will focus on finding insights on the expression of the
genes regulating the process of endo-dormancy. Ten candidate genes including DAM, DHNs,
HTAs and NAC and 6 other candidate genes which are involved in dormancy process will be
used for our study.
Preliminary results from available RNA samples at FTC indicated that the 4 already identified
genes are good candidate genes to describe the evolution of the dormancy process in a
greenhouse (simulation of insufficient chilling) and outside (figure 1).
So far, RNA extraction protocol development that has resulted in good quality RNA. By
following a modified RNA extraction protocol of the FTC lab, RNA was extracted from flower
bud samples collected during the onset of dormancy to deep dormancy stages (four time points),
gel electrophoresis and Nano-drop measurements were done. Even though, the samples have
very good concentrations with Nano-drop readings (Table 1) the gel pictures showed
degradation in most of the samples (Figure 2). By testing different protocols we were able to
identify source of degradation, which happen to be method of crushing and finally by modifying
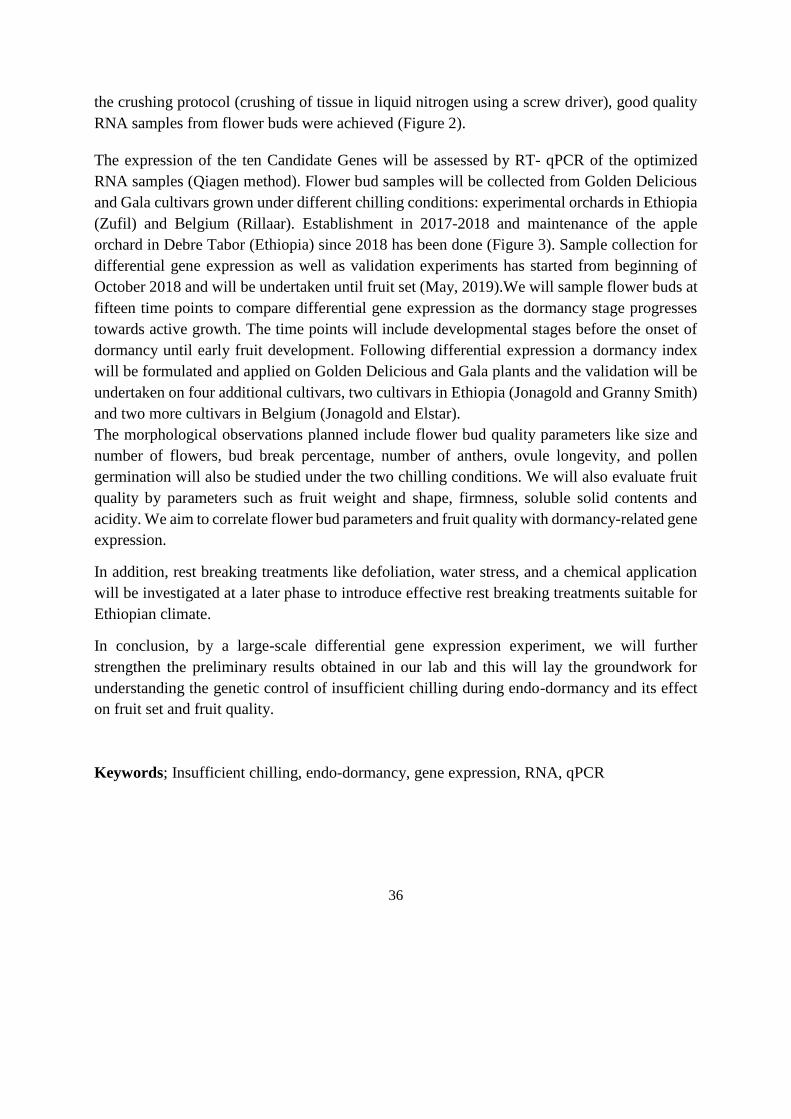
36
the crushing protocol (crushing of tissue in liquid nitrogen using a screw driver), good quality
RNA samples from flower buds were achieved (Figure 2).
The expression of the ten Candidate Genes will be assessed by RT- qPCR of the optimized
RNA samples (Qiagen method). Flower bud samples will be collected from Golden Delicious
and Gala cultivars grown under different chilling conditions: experimental orchards in Ethiopia
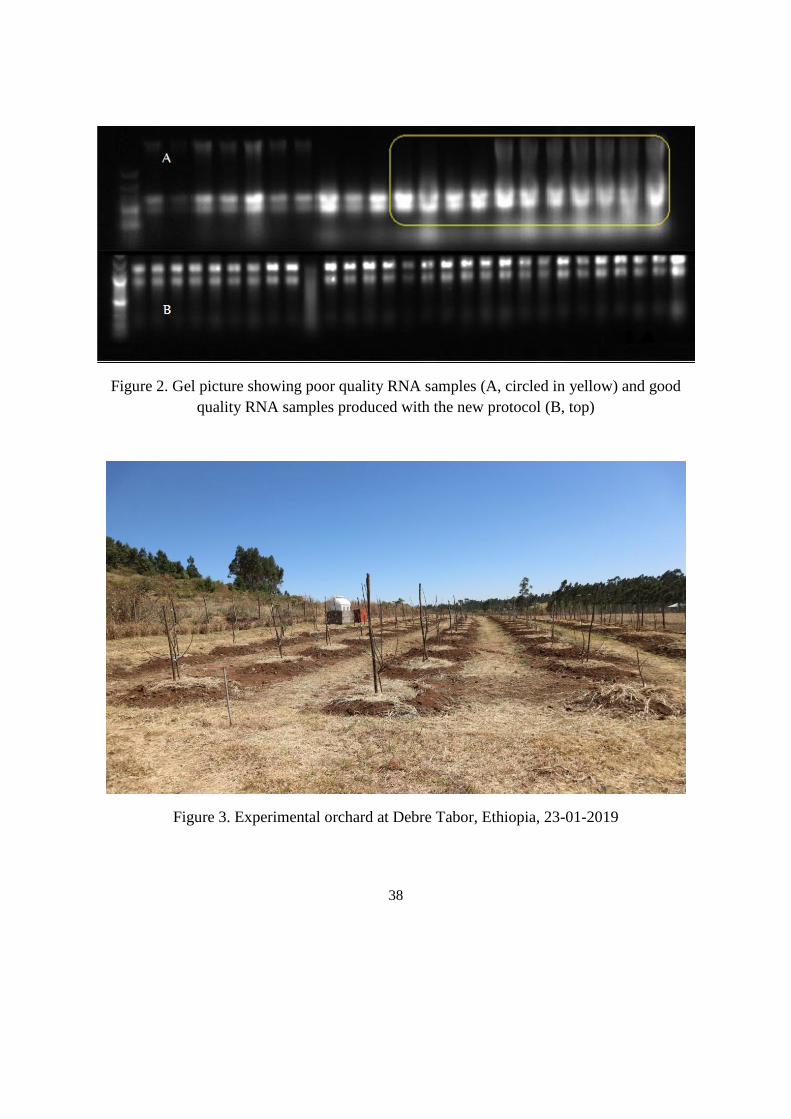
(Zufil) and Belgium (Rillaar). Establishment in 2017-2018 and maintenance of the apple
orchard in Debre Tabor (Ethiopia) since 2018 has been done (Figure 3). Sample collection for
differential gene expression as well as validation experiments has started from beginning of
October 2018 and will be undertaken until fruit set (May, 2019).We will sample flower buds at
fifteen time points to compare differential gene expression as the dormancy stage progresses
towards active growth. The time points will include developmental stages before the onset of
dormancy until early fruit development. Following differential expression a dormancy index
will be formulated and applied on Golden Delicious and Gala plants and the validation will be
undertaken on four additional cultivars, two cultivars in Ethiopia (Jonagold and Granny Smith)
and two more cultivars in Belgium (Jonagold and Elstar).
The morphological observations planned include flower bud quality parameters like size and
number of flowers, bud break percentage, number of anthers, ovule longevity, and pollen
germination will also be studied under the two chilling conditions. We will also evaluate fruit
quality by parameters such as fruit weight and shape, firmness, soluble solid contents and
acidity. We aim to correlate flower bud parameters and fruit quality with dormancy-related gene
expression.
In addition, rest breaking treatments like defoliation, water stress, and a chemical application
will be investigated at a later phase to introduce effective rest breaking treatments suitable for
Ethiopian climate.
In conclusion, by a large-scale differential gene expression experiment, we will further
strengthen the preliminary results obtained in our lab and this will lay the groundwork for
understanding the genetic control of insufficient chilling during endo-dormancy and its effect
on fruit set and fruit quality.
Keywords; Insufficient chilling, endo-dormancy, gene expression, RNA, qPCR

37
Table 1. RNA samples with good Nano-drop readings and concentrations
Cultivar Concentration 260/280 260/230
Br2 104.9 1.99 1.65
Br3 111.6 2.06 2.2
Br4 113 2.09 2.27
Br5 136.3 2.08 2.06
Br6 139.1 1.99 1.76
Br7 123.1 2.04 1.89
Br8 136.8 2.03 1.79
Ga 1 133.9 2.01 1.73
Ga 2 164.1 2.13 2.33
Ga 3 171 2.05 2.02
Ga 4 180.2 2.01 2.17
Ga 5 103.4 2.34 2.14
Ga 6 208.9 2.13 2.29
Ga 7 163.6 2.0 1.78
Ga 8 94.2 1.92 1.44
Figure 1: Gene expression of the DHN2 gene (production of dehydrines, involved in cold
adaptation) under greenhouse and field conditions. At the end of the endodormant period (30/01)
gene expression starts to decrease under field conditions (sufficient chilling), but this is not the
case under greenhouse conditions (insufficient chilling), hampering further flower-bud
development in the greenhouse.
38
Figure 2. Gel picture showing poor quality RNA samples (A, circled in yellow) and good
quality RNA samples produced with the new protocol (B, top)
Figure 3. Experimental orchard at Debre Tabor, Ethiopia, 23-01-2019
39
Chapter 12: Tomato chilling to reduce postharvest losses in Ethiopia
Dawit Fikadu1,2, Solomon W. Fanta2, Melkamu Alemayehu3, Getachew Alemayehu3, Enyew
Adgo3, Jan Nyssen4, Mulugeta Admasu1, Pieter Verboven1, Bart M. Nicolai1
1BIOSYST-MeBioS, KU Leuven, Willem de Croylaan 42, B-3001 Leuven, Belgium 2Faculty of Chemical and Food Engineering, Bahir Dar Institute of Technology, Bahir Dar
University, P.O. Box 26, Bahir Dar, Ethiopia 3College of Agriculture and Environmental Sciences, P.O. Box 5501, Bahir Dar University,
Bahir Dar, Ethiopia 4Department of Geography, Ghent University, Krijgslaan 281 S8, B-9000 Gent, Belgium
Tomato (Lycopersicon esculentum Mill.) is a cash crop and contains major health promoting
substances such as carotenoids (especially lycopene), phenolics, and ascorbic acid [1]. Tomato
is a climacteric fruit and its ripening is initiated by a surge of autocatalytic ethylene production
[2,3]. At the end of the ripening process the senescence phase starts, leading to rapid
deterioration [2,3,4]. Ripening and senescence can be delayed by refrigerated storage, but
because of lack of cold storage facilities in sub Saharan African countries including in Ethiopia
the major proportion of tomatoes produced by the farmers is lost due to postharvest losses [4,5].
In Ethiopia, about 85 % of the farmers are small-holders and live in rural areas, where the
national electricity grid is not yet connected. Postharvest losses of tomato in Ethiopia are
estimated from 30 to 50 % [4,6]. Lack of cold storage facilities and physical injuries are
mentioned as the most important factors of the accounted losses [4,6]. Cold storage of tomato
is known to reduce the rate of physiological changes such as respiration, softening and weight
loss, but below 10 to 13 °C, depending on the cultivar, chilling injury may occur as tomato is a
tropical fruit [5,7]. Establishing of cooling facilities in rural areas requires alternative energy
sources. The solar irradiation potential in Ethiopia is 1753-2483 kWh m-2 y-1 which is about
two times that of Belgium (1000-1100 kWh m-2 y-1) [8]. Therefore, utilization of available solar
energy for cold production is a viable option. This study mainly focuses on the development of
an absorption cooling system by using solar thermal energy for activation. First the effects of
storage temperature (5, 10, and 15°C) on the changes of Ethiopian tomato cultivars Melka salsa
and Melka shola will be assessed by conventional refrigeration at the green, turning and pink
harvesting stage. Then, a small-scale solar absorption chiller will be designed and developed
for tomato storage. The design process includes cooling load estimation for 50 kg of tomatoes,
sizing of components, and construction and testing of the system. In addition, modifications
will be performed as required. Finally, a large-scale solar absorption system will be modelled
based on the data obtained from the small-scale absorption chiller.
Key words: postharvest loss, cold storage, solar energy, tomato, physiological change

40
Figure 1. Illustration of tomato harvesting, sorting and grading, cold storage, firmness
(TA.XTplus Texture analyzer, Stable Micro Systems Ltd., Godalming, Surrey, UK)

41
determination, and labelled tomatoes for color change monitoring by spectrophotometer CM-
600D
References
1. Javanmardi, J., & Kubota, C. (2006). Variation of lycopene, antioxidant activity, total
soluble solids and weight loss of tomato during postharvest storage. Postharvest
biology and technology, 41(2), 151-155.
2. Van de Poel, B. (2013). Ethylene biosynthesis during climacteric ripening of tomato.
A systems biology approach.
3. Giovannoni, J. J. (2004). Genetic regulation of fruit development and ripening. The
plant cell, 16(suppl 1), S170-S180.
4. Getinet, H., Seyoum, T., & Woldetsadik, K. (2008). The effect of cultivar, maturity
stage and storage environment on quality of tomatoes. Journal of Food
Engineering, 87(4), 467-478.
5. Riudavets, J., Alonso, M., Gabarra, R., Arnó, J., Jaques, J. A., & Palou, L. (2016). The
effects of postharvest carbon dioxide and a cold storage treatment on Tuta absoluta
mortality and tomato fruit quality. Postharvest Biology and Technology, 120, 213-221.
6. Emana, B., Afari-Sefa, V., Nenguwo, N., Ayana, A., Kebede, D., & Mohammed, H.
(2017). Characterization of pre-and postharvest losses of tomato supply chain in
Ethiopia. Agriculture & Food Security, 6(1), 3.
7. McDonald, R. E., McCollum, T. G., & Baldwin, E. A. (1999). Temperature of water
heat treatments influences tomato fruit quality following low-temperature
storage. Postharvest Biology and Technology, 16(2), 147-155.
8. http://www.worldbank.org/energy
42
Chapter 13: Understanding the interrelation between landscape structure
on church forests’ resilience, bird ecology and agricultural production in
the Eastern Lake Tana basin
Ferehiwot Mequanint1,2, Alemayehu Wassie1, Shimeles Aynalem1, Enyew Adgo1, Jan
Nyssen3, Amaury Frankl3, Diederik Strubbe2, Bart Muys4, Luc Lens2
1College of Agriculture and Environmental Sciences, Bahir Dar University, Bahir Dar,
Ethiopia 2Terrestrial Ecology Unit, Ghent University, Ghent, Belgium 3Department of Geography, Ghent University, Ghent, Belgium 4Division Forest, Nature and Landscape, University of Leuven, Leuven, Belgium
In the northwest of Ethiopia, understanding the effects of landscape structure on plant and bird
community and ecosystem services (ES) remain at a very early stage. Despite the fact that the
interrelation between church forests and birds may have a significant role to enhance crop
production via physical (a buffer against wind and floods) and biological (sources of pollinators
and pest regulators), little is known about the ES of birds and church forests. In order to
effectively enhance ecological restoration and sustainable supplies of ES now and in the future,
an understanding of how landscape structure affects bird species composition and ES is urgently
required. Therefore, the study aims at understanding, the ecological value of church forests as
safeguards for avian biodiversity and associated ecosystem services such as pollination, seed
dispersal, and pest control and the ecological importance of connectivity of the landscape matrix
in which these forests are embedded. This will be done in four major phases, focusing on the
vegetation characteristics of the church forests themselves, the connectivity of the surrounding
landscape matrix, the composition of church forest bird communities and finally on the
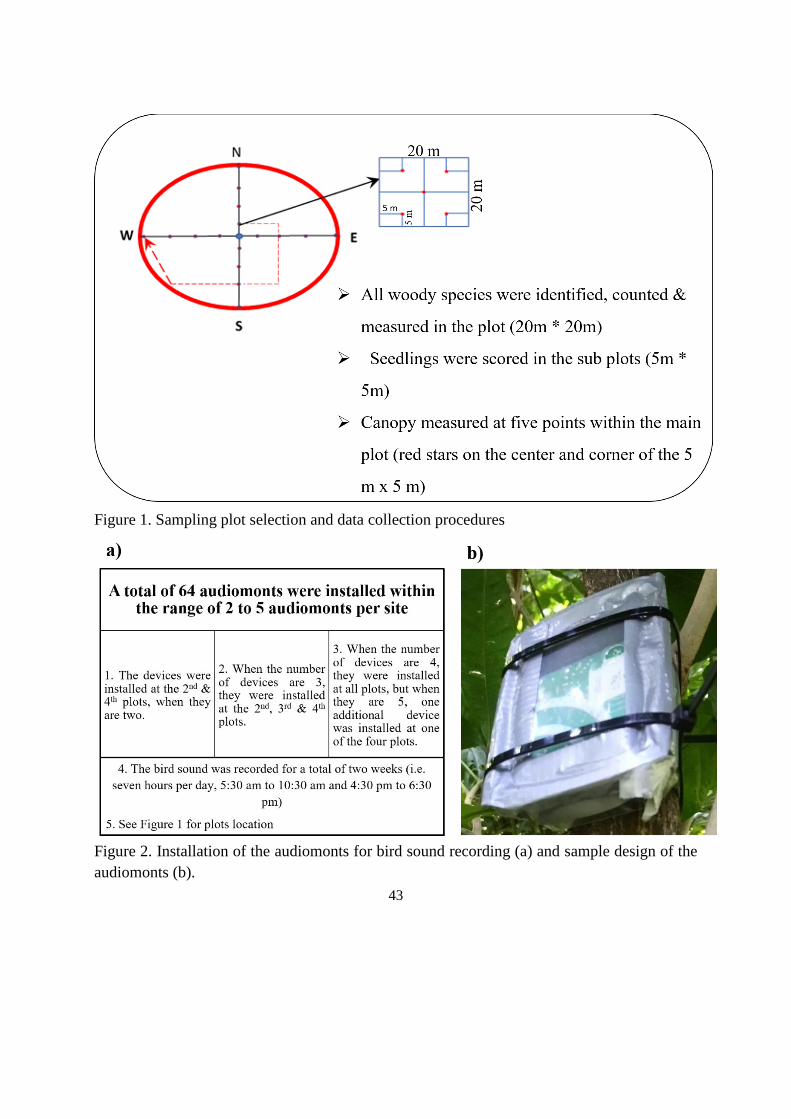
ecosystems services the birds provide. Currently, assessment on church forest vegetation and
bird species surveys are completed and the sampling procedure is visible in figure 1 and 2,
respectively. Data analyses for the church forest inventory are being undertaken at Gent
University. In the forest inventory, a total of 114 woody species representing 53 families were
recorded. Of these, 62.3% of the species were trees, 28.9% were shrubs, and 7.9% were lianas.
Species composition differed between forests with the range of 16 to 38 species. Species
composition of church forests will be further related to landscape characteristics of the
agricultural matrix and with management pressures within the forest fragment. Assessing seed
dispersal and pest control ecosystem services will be prospects for the next phase.
Key words: Bird, church forests, ecosystem services, landscape structure, Lake Tana
43
Figure 1. Sampling plot selection and data collection procedures
Figure 2. Installation of the audiomonts for bird sound recording (a) and sample design of the
audiomonts (b).

44
45
Chapter 14: Floodplain sediment storage quantification: the case of upper
reaches of the Gumara river
Girma Awoke1,2, Jef Brees1, Pascal Boeckx3, Karen Vancampenhout1,4, Enyew Adgo5, Jan
Nyssen6, Mengiste Abate2, Alemayehu Wassie5, Amaury Frankl6, Gert Verstraeten1
1Department of Earth and Environmental Sciences, KU Leuven, Belgium 2Department of Hydraulic and Water Resources Engineering and Blue Nile Water Institute,
Bahir Dar University, Ethiopia 3Department of Applied Analytical and Physical chemistry and Isotope Bioscience
Laboratory-ISOFYS, Ghent University, Belgium 4Bioengineering Technology TC, Kleinhoefstraat 4, 2440 Geel, Belgium 5Department of Natural Resource Management , Bahir Dar University, Ethiopia 6Department of Geography, Ghent University, Belgium
Whilst much research in the Ethiopian Highlands has been directed towards soil erosion, river
sediment, and nutrient fluxes, and reservoir sedimentation, one major aspect of the sediment
budget of a river catchment, floodplain deposition, has been neglected. Indeed, whilst Highland
rivers receive substantial quantities of detached sediment particles from their uphill catchments,
these rivers continuously deposit and rework the sediment in their often extensive floodplains
rather than merely transporting the sediment load towards the outlet. This is the case for the
rivers draining to Lake Tana, such as the River Gumara that originate at the foot of Mount Guna
(4120 m a.s.l.) and drain westwards to Lake Tana, and which will form the focus of this study.
This study is aimed at quantifying the amount of sediment stored in the alluvial plains of the
upper reaches of the Gumara.
Floodplain sediment storage was estimated by combining information on floodplain spatial
extent obtained through field-based and remote sensing based approaches, with information on
sediment thickness obtained through sediment coring and the analysis of cut-banks. Feeling
method and the Munsell color chart were used to determine the textural class and the color of
the core, respectively. As we learned from the study and according to Nanson and Croke (1992)
floodplain classifications confined vertical accretion sandy floodplains (A2), wandering gravel-
bed river floodplains (B2), meandering river, lateral migration floodplains (B3, of suborder,
non-scrolled B3a and scrolled B3b), and overbank vertical accretion (B5) is the observed ones
in the area. Besides, so far the study showed that 13.39 Mm3 of sediment is deposited in the
studied reach of the Gumara River (1027.85 km²; 176 km river length). The texture varies from
clay to sandy clay loam; sandy clay, silty clay and clay being the major texture classes observed.
Comparing this with floodplain sediment storage in similar-sized European catchments that are
characterized by long-term human impact (Hoffmann et al. 2013) shows that floodplain

46
sediment storage in the Gumara catchment is up 10 times lower. The topography and climatic
difference between the two regions could be the potential factors for such floodplain sediment
storage variations. Finally, not only the lower reaches but also the upper reaches of the Gumara
river also play an important role in storing sediment of different textural classes.
Key words: floodplain, sediment storage, Gumara river, coring
Legend:
Color: Dark reddish brown (5YR ¾) Allu. Uni 1: Alluvial unit 1 - Sandy clay
Fogeda River Allu. Uni 2: Alluvial unit 2 - Silty clay
Figure 1: Typical floodplain cross-section around Arib Gebeya (700 m downstream of the
Fogeda bridge): learns us change in thickness and texture of sediment storage along the width
and depth of the floodplain
Allu. Uni
Allu. Uni

47
Figure 2: Mineral sediment storage vs area; the graph shows the relationship between
sediment storage and catchment area for floodplains located in ca. 3 different topographical
settings. The storage for the upper Gumara lies above Scotland (much upland setting) and
below the central Europe (flattest setting)
References:
Nanson, G. C., & Croke, J. C. (1992). A genetic classification of floodplains. Geomorphology,
4(6), 459-486.
Hoffmann, T., Schlummer, M., Notebaert, B., Verstraeten, G., & Korup, O. (2013). Carbon
burial in soil sediments from Holocene agricultural erosion, Central Europe. Global
Biogeochemical Cycles, 27(3), 828-835.
48
Chapter 15: Quantifying and understanding land degradation process in
relationship to landscape connectivity in the Lake Tana basin
Habtamu Assaye1,2, Samuel Bodé3, Derege Tsegaye2, Alemayehu Wassie2, Enyew Adgo2,
Jean Poesen4, Jan Nyssen1, Pascal Boeckx3, Amaury Frankl1,5
1Department of Geography, Ghent University, Ghent, Belgium 2Department of Natural Resource Management, Bahir Dar University, Bahir Dar, Ethiopia 3Department of Green Chemistry and Technology, Ghent University, Ghent, Belgium 4Department of Earth and Environmental Sciences, KU Leuven, Heverlee, Belgium 5Research Foundation Flanders (FWO), Brussels, Belgium
Land degradation is a major environmental problem in the Lake Tana basin. In this research,
we aim at quantifying and understanding the processes of land degradation by water erosion in
the basin. The Enkulal catchment (ca. 10.4 km2) was selected to represent the upland areas of
the Gumara catchment. Within this catchment, six sub-catchments were selected with variable
land use and cover, topography and management. Five tipping-bucket rain gauges were
installed. Fourteen micro-catchments (ranging in area from 324 to 1715 m2) were selected from
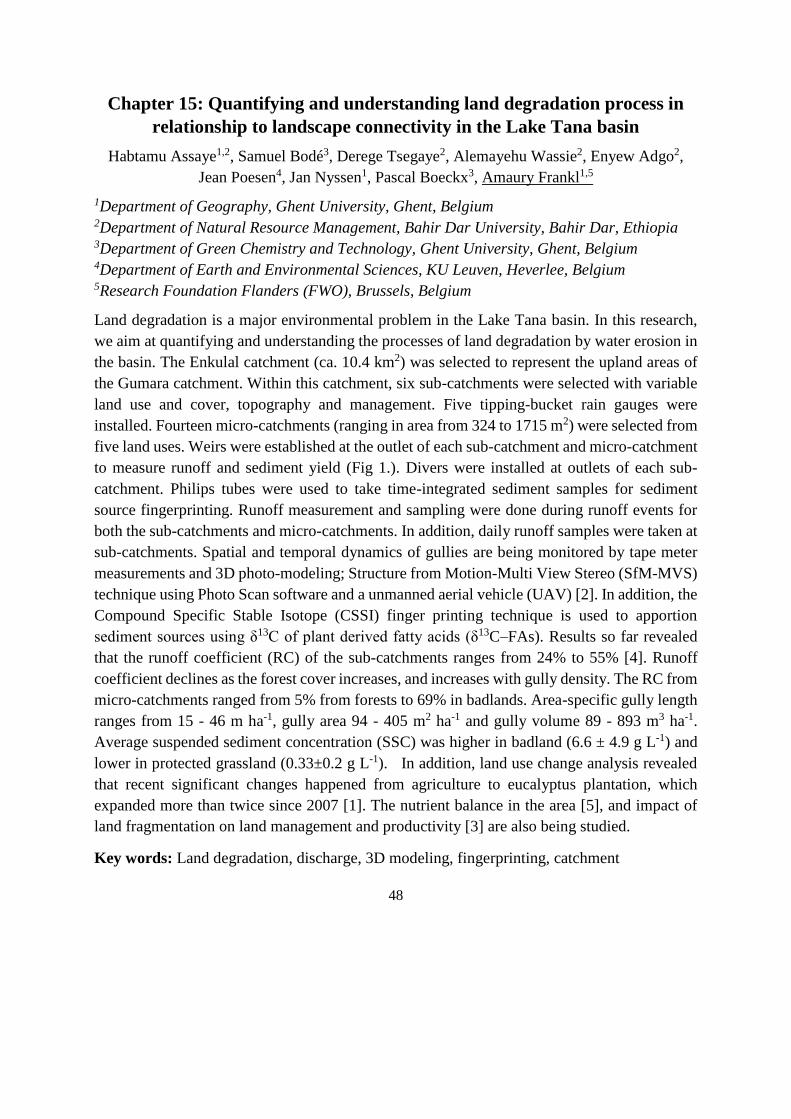
five land uses. Weirs were established at the outlet of each sub-catchment and micro-catchment
to measure runoff and sediment yield (Fig 1.). Divers were installed at outlets of each sub-
catchment. Philips tubes were used to take time-integrated sediment samples for sediment
source fingerprinting. Runoff measurement and sampling were done during runoff events for
both the sub-catchments and micro-catchments. In addition, daily runoff samples were taken at
sub-catchments. Spatial and temporal dynamics of gullies are being monitored by tape meter
measurements and 3D photo-modeling; Structure from Motion-Multi View Stereo (SfM-MVS)
technique using Photo Scan software and a unmanned aerial vehicle (UAV) [2]. In addition, the
Compound Specific Stable Isotope (CSSI) finger printing technique is used to apportion
sediment sources using δ13C of plant derived fatty acids (δ13C–FAs). Results so far revealed
that the runoff coefficient (RC) of the sub-catchments ranges from 24% to 55% [4]. Runoff
coefficient declines as the forest cover increases, and increases with gully density. The RC from
micro-catchments ranged from 5% from forests to 69% in badlands. Area-specific gully length
ranges from 15 - 46 m ha-1, gully area 94 - 405 m2 ha-1 and gully volume 89 - 893 m3 ha-1.
Average suspended sediment concentration (SSC) was higher in badland (6.6 ± 4.9 g L-1) and
lower in protected grassland (0.33±0.2 g L-1). In addition, land use change analysis revealed
that recent significant changes happened from agriculture to eucalyptus plantation, which
expanded more than twice since 2007 [1]. The nutrient balance in the area [5], and impact of
land fragmentation on land management and productivity [3] are also being studied.
Key words: Land degradation, discharge, 3D modeling, fingerprinting, catchment
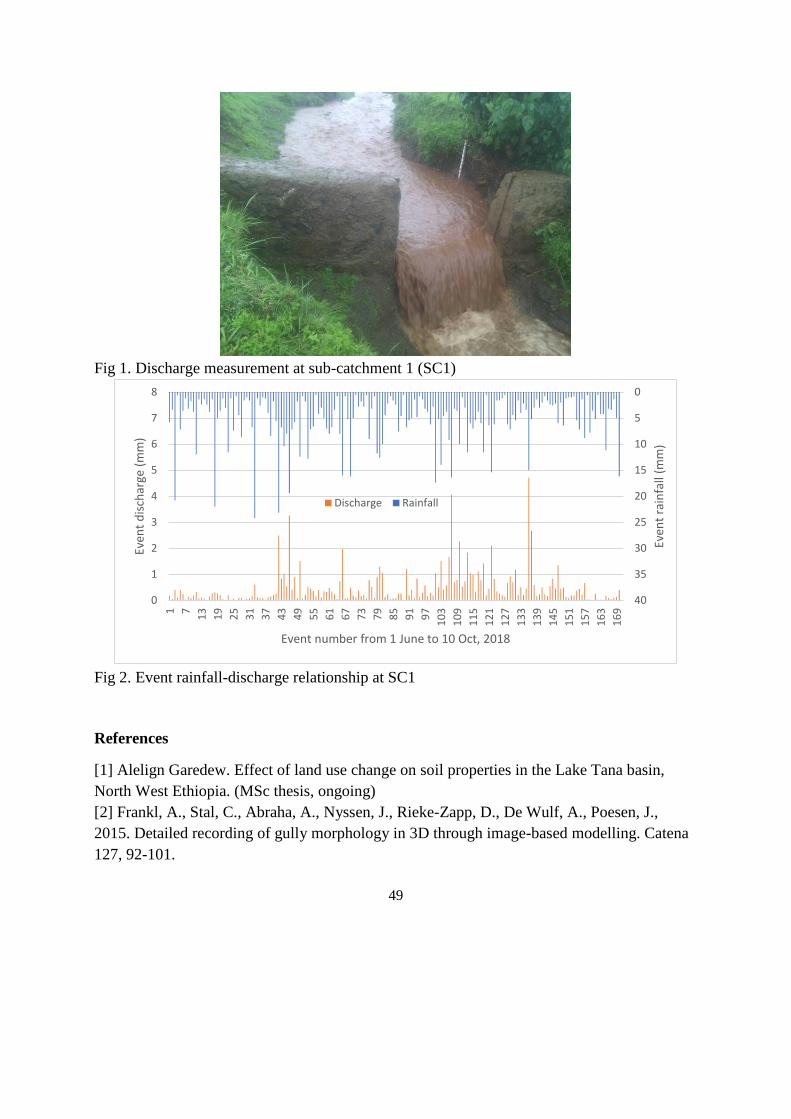
49
Fig 1. Discharge measurement at sub-catchment 1 (SC1)
Fig 2. Event rainfall-discharge relationship at SC1
References
[1] Alelign Garedew. Effect of land use change on soil properties in the Lake Tana basin,
North West Ethiopia. (MSc thesis, ongoing)
[2] Frankl, A., Stal, C., Abraha, A., Nyssen, J., Rieke-Zapp, D., De Wulf, A., Poesen, J.,
2015. Detailed recording of gully morphology in 3D through image-based modelling. Catena
127, 92-101.
0
5
10
15
20
25
30
35
400
1
2
3
4
5
6
7
8
1 7
13
19
25
31
37
43
49
55
61
67
73
79
85
91
97
10
3
10
9
11
5
12
1
12
7
13
3
13
9
14
5
15
1
15
7
16
3
16
9
Even
t ra
infa
ll (m
m)
Even
t d
isch
arge
(m
m)
Event number from 1 June to 10 Oct, 2018
Discharge Rainfall

50
[3] Gebre-Egziabher Fentahun. Level of land fragmentation and its implication to
productivity, conservation and management in the Lake Tana Basin, Ethiopia. (MSc thesis,
ongoing)
[4] Habtamu Assaye. Effect of catchment properties on event-based rainfall-runoff response
in the Lake Tana basin, northwestern Ethiopia (in preparation)
[5] Melese Geze. Analysis of nutrient balance in the agricultural landscape of the upland
sediment source area of the Lake Tana basin, the case of Dera District, South Gondar Zone,
Ethiopia (MSc thesis, ongoing)

51
Chapter 16: Effect of curing temperature and relative humidity on
storability of onion
Tewodros Andargie1,2, Solomon W. Fanta2, Melkamu Alemayehu3, Getachew Alemayehu3,
Enyew Adgo3, Jan Nyssen4, Mulugeta Admasu1, Pieter Verboven1, Bart M. Nicolai1
1BIOSYST-MeBioS, KU Leuven, Willem de Croylaan 42, B-3001 Leuven, Belgium 2Faculty of Chemical and Food Engineering, Bahir Dar Institute of Technology, Bahir Dar
University, P.O. Box 26, Bahir Dar, Ethiopia 3College of Agriculture and Environmental Sciences, Bahir Dar University, P.O. Box 5501,
Bahir Dar, Ethiopia 4Department of Geography, Ghent University, Krijgslaan 281 S8, B-9000 Gent, Belgium
Onion is an indispensable part of the daily Ethiopian dish and it is, thus, one of the most
economically important vegetable crops in Ethiopia [2]. However, postharvest losses are
extremely high mainly due to poor postharvest handling including inappropriate curing
practices as well as lack of cold storage facilities [2,3]. Curing is the most common postharvest
treatment employed by farmers to extend the storage life of onion in the country [1,4,5]. In
Ethiopia, where the time of harvesting coincides with the dry season, farmers cure onion bulbs
naturally in the production field using sunlight. Curing of onion can be also done artificially in
dryers through blowing hot dry air. Onion bulbs cured naturally in the field generally have a
lower shelf life compared to those cured artificially [4]. On the other hand, artificial curing
methods are expensive and thus not affordable by small-scale onion producers in a developing
country like Ethiopia. The objective of this research is, therefore to develop alternative and
affordable technology for increasing the storage life of onion bulbs. For that purpose, first, a
study has been conducted to investigate the effect of curing conditions and storage time on
storage life of onion bulbs. The ‘Bombay Red’ cultivar of onion was used as test crop which
has been harvested when about 0-10 % of leaves of the plant have been collapsed (topped-
down). Foliages were removed by cutting the neck at the distance of one 2.5 cm from the bulbs
before curing. Bulbs were artificially cured at three different temperatures (30, 40 and 50 °C)
and relative humidity levels (30, 50 and 70 %) for a duration of 48 hour. Thereafter, onion bulbs
were kept at ambient conditions (average temperature of 23 oC and relative humidity of 66 %)
for 90 days. Weight loss, total losses, sprouted and rotted bulbs and percentage of marketable
bulbs were measured at an interval of 10 days throughout storage. The results showed that the
highest weight loss (20%) was recorded when the onion bulbs were cured at 50 °C and relative
humidity (RH) of 30%, followed by uncured onion bulbs (17%); the lowest weight losses (11%)
were recorded for onion bulbs cured at 30 °C and 70% RH. A significant reduction in the
percentage of sprouted and rotted bulbs was observed when the curing temperature was ≤ 40 °C.

52
The weight loss, percentage of sprouted and rotted bulbs increased with in storage time. The
least total losses (51%) and highest percentage of marketable bulbs (49%) were recorded for
onion bulbs cured at 40 °C and 50% RH. On the other hand, the highest total losses (93%) and
lowest marketable bulbs (7%) were recorded for uncured onion bulbs. Based on the results of
the present study, it can be concluded that curing at a temperatures lower than 40 °C helps to
prolong the storability of onion bulbs. Despite curing improves storability of onion bulbs, the
total losses are still huge. This could be mainly due to the fact that onions used for this study
were immature. Thus, there is an ongoing experiment that studies the effect of curing condition
and stage of maturity on storability of onions.
Keywords: Onion, curing, sprouting bulbs, marketable bulbs, weight loss
Illustration
Small scale a solar tunnel dryer was design and constructed as an alternative technology for
onion curing. As shown in the figure below, air is drawn through the dryer by axial fan (C). It
is heated as it passes through flat plate solar collector (A) and then partially cooled as it removes
moisture from the onion bulbs which are placed in the drying chamber (B). A solar panel (D)
generate all necessary electric power for the fan, the control system (F) and charging a solar
battery (E) during the day.
Figure 1. A solar tunnel dryer setup constructed for onion curing: (A) solar collector; (B) drying
chamber; (C) axial fan; (D) solar panel; (E) solar battery and (F) solar charge controller.
53
References
1. Nega, G., Mohammed, A.A., & Menamo, T. (2015). Effect of curing and top removal
time on quality and shelf Life of onions (Allium cepa L.). Global Journal of Science
Frontier Research: D Agriculture and Veterinary. 2249-4626 & Print ISSN: 0975-5896
2. Abdissa Y, Tekalig T, Pant L. (2011). Growth, bulb yield and quality of onion (Allium
cepa L.) as influenced by nitrogen and phosphorus fertilization on vertisol I. growth
attributes, biomass production and bulb yield. Afr. J. Agric. 6(14): 3253-58.
3. Biswas SK. (2010). Yield and shelf life of onion (Allium cepa L) as affected by varying
levels of irrigation. Bangladesh J. Agril. 35(2): 247-255.
4. Gubb, I., MacTavish, H., (2002). Onion pre-and postharvest considerations. In:
Rabinowitch,H.D., Currah, L. (Eds.), Allium Crop Science: Recent Advances. CABI
Publishing, Wallingford, pp. 233–265.
5. Downes, K., Chope, G.A., Terry, L.A., (2009). Effect of curing at different temperatures
on biochemical composition of onion (Allium cepa L.) skin from three freshly cured and
cold stored UK-grown onion cultivars. Postharvest Biol. Technol. 54, 80–86.
54
Chapter 17: Habitat characterization of young-of-the-year Labeobarbus
species
Wondie Zelalem1,2
, Wassie Anteneh3, Minwyelet Mingist
1, Mulugeta Kibret
3, Enyew Adgo
4,
Elie Verleyen5, Jan Nyssen
6,Getachew Beneberu
7, Steven Bouillon
8, Alain De Vocht
2
1Department of Fisheries, Wetlands and Wildlife Management, College of Agriculture and
Environmental Studies, Bahir Dar University, Ethiopia 2Centre for Environmental Sciences, Hasselt University/PXL University College, Belgium
3Department of Biology, Bahir Dar University, Ethiopia
4Department of Natural Resource Management, Bahir Dar University, Ethiopia
5Laboratory of Protistology and Aquatic Ecology, Department of Biology, Ghent University,
Belgium 6Department of Geography, Ghent University, Belgium
7Department of Earth and Environmental Sciences, KU Leuven, Belgium
Introduction
The Lake Tana ecosystem, home for 15 commercially important endemic Labeobarbus species
(Nagelkerke & Sibbing, 2000) is a hotspot for biodiversity. Majority of the Labeobarbus
species of Lake Tana are reported as migratory species to tributary rivers (Anteneh et al., 2013;
Fedor et al., 2017). Gumara river is one of the most important breeding grounds for those
migratory Labeobarbus species. After hatching in the spawning place young-of-the-year
(YOY) Labeobarbus species are present in different habitats along the river. The lake and its
tributary rivers are suffering from major changes in climate and anthropogenic factors and the
impact on reproduction of the species is of overall importance for conservation and
management of the stock. Owing to their important contribution to the success of the entire
stock, giving credit for YOY fishes is indispensable. Then again knowledge of the requirements
of the breeding and nursery habitat of Labeobarbus species is a pillar for conservation and
management of these ecological and economical important fish species. However, the
microhabitats used by the young-of-the-year (YOY) Labeobarbus species are not yet known.
Therefore, this part of PhD work is focused on habitat characterization and survival of YOY
Labeobarbus species in Gumara river system.
Methods
This work has been conducted in the streach of Gumara River from its mouth to upstream
habitats at Wanzayie village. Along the stretches of the river, sites were selected such as a fast

55
smooth current (run), a swift current breaking over submerged gravel or rock that produces
surface agitation (riffle) and relatively deep slow water (pool). Depending on the area available
for sampling 72 sampling points were chosen from 6 different sites along the stretch of the river.
Fish sampls have been collected from lower to upper direction of each sampling reach using
point abundance electro-fishing technique (Figure 1). Measurements of physical and chemical
characteristics of the YOY fish habitats such as depth, speed of river water, substrate type,
temperature, dissolved oxygen, specific conductivity and pH have measured in-situ. To
estimate the food or energy sources and contribution of various components of fish diet for the
survival of YOY fishes, fish specimens and other functional groups have been collected for
stable isotope measurement.
Figure 1. a) Specimen collection using electrofishing b) measurements of YOY Labeobarbus
sp.
Preliminary results
Barbus humilis, B. pleurogramma, Garra spp. and Varichorinus beso from the family
‘Cyprinidae’ and rarely Clarias garipinus and Oreochromis niloticus were caught in some
sampling points during this survey. Barbus humilis was the most abundant species in the
majority of sampling points but Garra spp. are dominant in speedy water or riffles. YOY
Labeobarbus species were found in both runs and pool microhabitats including the lake shore
points. They were absent in the deep pools but usually found along the vegetated shore and
sheltered areas. Similarly, they are absent in fast running water or riffles with a velocity >
0.5m/s. In general, though the sampling is not yet completed, preliminary results show that
habitat preference of YOY Labeobarbus species is strongly associated with depth and velocity
of water.
Key words: microhabitat, Labeobarbus, electro-fishing, Gumara River,

56
References
Anteneh W., Getahun A. and Dejen E. (2013). Spawning migrations of Lake Tana Labeobarbus
spp. (Teleostei: Cyprinidae) in the Ribb River, Ethiopia. African Journal of Aquatic
Science 38(2):1– 8.
Nagelkerke, L. A. J. and Sibbing, F. A. (2000). The large barbs (Barbus spp., Cyprinidae,
Teleostei) of Lake Tana (Ethiopia), with a description of a new species, Barbus osseeinsis.
Netherlands Journal of Zoology 50, 179–214.
Shkil, F.N., Dzerzhinskii, K.F., Belay Abdissa, Borisov, V.B., Wondie Zelalem, Kapitanova,
D.V, Mesfin Tsegaw and Smirnov, S.V. (2017). Notes on the breeding of large lake Tana
barbs (Labeobarbus spp.) in nature and laboratory. Ethiop. J. Biol. Sci. 16(Suppl.): 149–
170.


