j ou rna l homepage: www.e lsev ie r .com/ locate /emr
Institutions and corporate capital structure in theMENA region
Mohamed Belkhir a,⁎, Aktham Maghyereh a, Basel Awartani b
a UAE University, College of Business & Economics, United Arab Emiratesb University of Plymouth, Plymouth, Graduate School of Management & Plymouth Business School, United Kingdom
Article history:Received 11 March 2015Received in revised form 3 January 2016Accepted 4 January 2016Available online 11 January 2016
This paper provides novel evidence on firm- and country-level determi-nants of firm capital structure decisions in the MENA region. Using asample of 444 listed firms from ten countries, over the 2003–2011 peri-od, we find that MENA firms have target leverage ratios towards whichthey adjust over time. Yet, the speed of adjustment varies from onecountry to another. Our findings also suggest that some firm-levelfactors are associated with leverage consistent with the trade-off andpecking order theories of capital structure. We further find robustevidence that better institutional quality leads firms to use more debt.
Keywords:Capital structureLeverageMENAInstitutionsFinancial development
1. Introduction and motivation
An extensive body of research has been dedicated to answering Myers (1984) question “How do firmschoose their capital structures?” Most studies have examined the capital structure issue in samples of firmsfrom a single country, typically the United States. Nevertheless, more recently, several studies have extendedtheir geographical scope and investigated the determinants of capital structure in international samples cov-ering firms fromdifferent countries. Examples of such studies are Booth et al. (2001) for developing countries,Bancel and Mittoo (2004) for European countries, Antoniou et al. (2008) for five developed countries,Getzmann et al. (2014) for Asian countries, and De Jong et al. (2008), Gungoraydinoglu and Öztekin
100 M. Belkhir et al. / Emerging Markets Review 26 (2016) 99–129
(2011), Fan et al. (2012), and Oztekin and Flannery (2012) for samples of countries from different parts of theworld. A close look into these studies suggests twomajor remarks. The first is that some firm-level factors areassociatedwith corporate leverage in a similarwaynomatterwhat country or region thefirm is located in. Forinstance, consistent with the trade-off theory of capital structure, firm size and asset tangibility are positivelyassociated with leverage ratios acrossmost, if not all, of these studies. Likewise, in line with the predictions ofthe pecking order theory of capital structure, firm profitability tends to be negatively associatedwith leverageratios in the majority of these studies. The second is that country-level factors play a significant role in deter-mining firm leverage. In particular, the nature and quality of a country's institutions impact firm optimal(target) leverage. Furthermore, such institutions have been shown to affect the speed at which firms in aspecific country adjust towards their target leverage.
In this paper, we extend the aforementioned literature to the Middle East and North Africa region (MENAhereafter) and try to answer two questions: (1) is firm leverage in MENA countries determined by the samefactors as those identified in other parts of the world? (2) Do institutional environments in MENA countriesaffect firms' capital structures, and if so, how? To answer these questions we use a sample of firms from tenMENA countries, which are Bahrain, Egypt, Jordan, Kuwait, Morocco, Oman, Qatar, Saudi Arabia, Tunisia,and the UAE. To the best of our knowledge, this is the first comprehensive study of capital structure choicesin the MENA region. Not only there is no prior research on firm capital structure decisions dedicated specifi-cally to this region, but also studies using international samples tend to exclude countries from the regionfrom their coverage. For instance, De Jong et al. (2008), Fan et al. (2012), and Oztekin and Flannery (2012)include firms from 37 countries to examine capital structure choices, but none of these countries is fromthe MENA region. We fill this gap in the literature and shed light on an important firm decision – financingdecision – in a growing, but understudied, region.
Examining firm financing choices in the MENA region is of utmost importance as the region's countrieshave been going, for more than two decades now, through reforms aiming at moving away from centrallyplanned economies to market-oriented ones. Firms are thereby supposed to behave consistent with thegoal of value maximization. It is thus of interest to investigate whether their financing decisions are deter-mined by the same factors observed in advanced countries where firms have been operating according tothe goal of valuemaximization for a long time, such as the U.S. andWestern European countries. Furthermore,there is steady integration of the region's financial markets in the global financial system. For instance, inMay2014, index compilerMSCI has upgraded stockmarkets of theUnited Arab Emirates andQatar from frontier toemergingmarket status,which is expected to increase capitalflows into thesemarkets aswell as internationalinvestors' focus on them. Such a move should, in turn, drive listed firms in those two markets to adopt bestpractices in terms of investment and financing decisions. It should also provide further incentives to otherstock markets in the region to adopt reforms and regulations that could promote their status from frontierto emerging. Besides these positive developments, firms located in theMENA countries continue to face a rel-atively weak institutional environment where investor protection is weak, bankruptcy regimes are deficient,and property rights are insecure. This is likely to affect their access to external capital, and, thereby, todetermine their optimal financial structures as well as the speed at which they revert back to such optimalstructures following shocks.
To examine capital structure and its firm- and country-level determinants in the MENA region, we use asample of 444 listed firms from ten countries, over the 2003–2011 period, or 3717 firm-year observations.Our findings suggest that the average firm in the MENA region has a book leverage ratio of 39% (median:36.8%) and a market leverage ratio of 33.4% (27.5%), which is comparable to leverage ratios in other develop-ing countries, reported in Booth et al. (2001) and Fan et al. (2012), but also to leverage ratios in the five mostdeveloped countries in theworld, reported in Antoniou et al. (2008). Using a partial adjustmentmodel of firmleverage that accounts for the dynamic nature of capital structure, we find evidence that firms inMENA coun-tries have target capital structures towards which they adjust over time.We further find that the speed of ad-justment towards target leverage varies from one country to another, possibly reflecting differences in thenature and quality of the institutional environments across countries, which, in turn, affect adjustmentcosts. Our results also suggest that traditional firm-level determinants of leverage tend to affect debt ratiosin MENA countries in line with standard capital structure theories, and consistent with the findings of priorresearch on countries from other parts of the world. For instance, we find evidence of a consistent and strongpositive impact of firm size and asset tangibility on leverage and a negative impact of profitability and growthopportunities on leverage. Our cross-country analysis of the potential impact of the institutional framework
on firm leverage shows that firms located in countries with more developed financial systems, more regula-tory effectiveness, and stronger rule of law usemore debt. In a further analysis, we also show that better qual-ity institutions attenuate the impact of size and asset tangibility on leverage.
Our study contributes to two literatures. First, we extend research on cross-country differences in firmcapital structure by presenting new evidence from a different geographical region that the level of a country'sfinancial development and the quality of its public governance impact firm financing choices. We furthershow that the quality of a country's institutions has not only a direct but also an indirect influence on firm cap-ital structure. In this regard, our research intersects with evidence that capital structure depends upon acountry's legal system (Bancel and Mittoo, 2004; Fan et al., 2012), creditor rights' protection (De Jong et al.,2008; Cho et al., 2014), corruption (Fan et al., 2012), and whether an economy is market- or bank-based(Antoniou et al., 2008). Our paper presents further evidence on the benefits of improving a country's institu-tional quality.
Second, we contribute to the build-up of a literature that examines firm financing choices in emergingmarkets whose institutional frameworks are generally different from those underpinningWestern – especial-ly U.S –models of capital structure. Specifically, our study adds to Ebrahim et al. (2014), who document evi-dence of the influence of political patronage on Malaysian firms' capital structures, Deesomak et al. (2004),who show that legal, financial, and institutional environments influence capital structure decisions of firmsfrom the Asia Pacific region, Chen (2004) whose findings suggest that the capital structure choices of Chinesefirms seem to follow a “new Pecking Order”, and Cespedes et al. (2010) who report that Latin American firmsexhibit higher leverage than expected because their ownership concentration is higher than those in devel-oped countries. We extend this literature by shedding light on several issues related to capital structure in aregion characterized by a different institutional environment and that has received little, if any, attention inthe capital structure literature.
The remainder of the paper is organized as follows. Section 2 provides a brief review of capital structuretheories, describes the major characteristics of the institutional environment with a potential impact oncapital structure choices in the MENA region, and discusses predictions of firm- and country-level effects onleverage. Section 3 describes our data set and empirical method. Section 4 presents empirical results. Finally,Section 5 concludes the paper.
2. Institutions and capital structure decisions in MENA
In this section,we first, provide a brief review of the theories of capital structurewhichwe rely on to studyleverage decisions in the MENA region. We, then, provide a description of the quality of the institutionalenvironment in MENA countries. Finally, we use the insights of these theories and the characteristics of theinstitutional settings to predict the effects of firm- and country-factors on leverage.
2.1. Capital structure theories
The major theories of capital structure are the static trade-off, pecking order, and market timing models(Huang and Ritter, 2009). In contrast to the irrelevance theorem of Modigliani and Miller (1958), the statictrade-off theory argues that firms have optimal debt ratios, which they need to hold tomaximize their values.Specifically, in the presence of capital market frictions, firms have optimal debt ratios that result from atrade-off between the benefits and costs of debt. Such costs and benefits have various sources, such as thedeadweight costs of bankruptcy, agency costs, and tax benefits. In contrast to the trade-off theory, the peckingorder theory of capital structure suggests that a firm has no specific leverage ratio that maximizes its value. Inthe pecking order framework, information asymmetry induces managers to believe that equity issues will beunderpriced by the market (Myers and Majluf, 1984). This, in turn, discourages them – i.e., managers – fromissuing new equity as long as they can finance their new investments with less adverse selection-prone secu-rities, such as internal funds and debt. This preference order of financing sources suggests that a firm's ob-served leverage ratio reflects its past profitability and investment opportunities. The market timing theoryalso rejects the idea of target leverage. It rather argues that a firm's observed leverage reflects managers'past attempts to time the equity market by issuing overvalued stock shares (Baker and Wurgler, 2002). Inthe words of Baker and Wurgler, “…low leverage firms are those that raised funds when their market
102 M. Belkhir et al. / Emerging Markets Review 26 (2016) 99–129
valuations were high, as measured by the market-to-book ratio, while high leverage firms are those thatraised funds when their market valuations were low” (p. 2).
While the above-discussed theories have contributed significantly to our understanding of someof the fac-tors determining firm leverage, they also face significant challenges as stand-alonemodels of capital structure(Denis, 2012). To overcome part of these challenges, more recent literature has emphasized dynamic modelsinwhichfirmshave target leverage ratios towardswhich they attempt to adjust tomaximize their values. Thisadjustment can be slow or fast depending on the magnitude of transaction and security issuance costs – ad-justment costs. This implies that in the presence of large adjustment costs, a firm's observed leverage can de-viate significantly from its target. Numerous empirical studies have accounted for the potentially dynamicnature of capital structure, and attempted to test whether firms have leverage targets and if so, what is thespeed at which they adjust towards such targets (e.g., Fama and French, 2002; Flannery and Rangan, 2006;Lemmon et al., 2008; Huang and Ritter, 2009).
2.2. MENA region institutional environment
In this section, we provide a description of the quality of the legal and contractual environment in MENAcountries, whichmay help in predicting and understanding capital structure decisions of firms located in thisregion. In this discussion, we approach the region as a whole and emphasize institutions with implications tofirms' access to debt capital. We particularly focus on the quality of public governance, the state of insolvencyand information sharing regimes, and the financial sector.
2.2.1. Public governanceThe quality of public governance is one of the factors that determine economic agents' confidence that their
claims and property rights, includingfinancial assets, arewell protected against expropriation by both the gov-ernment and private parties. Inwell governed countries, the rule of lawprevails over any other rule – such as ofpersons or political parties – and sovereign institutions are reliable and believed to strive towards effective pro-tection of property rights and contract enforcement. Hence, lenders have better confidence that their capitalwill be recovered even in extreme cases of debtor default and may, thus, be more willing to extend credit atmore favorable terms. While MENA countries strive continuously to improve their public governance,they remain, on average, among the countries where institutions suffer from many deficiencies. Reportsby international organizations regularly observe that, in many countries, the political system continuesto hold sway over the judicial system, the media, and the legislative system. Moreover, it is usually men-tioned that in these countries, access to public services as well as to business opportunities is often de-pendent on nepotism, tribal affinity, patronage, or money. The result is rampant corruption, poor legalenforcement of contracts, and widespread property rights' insecurity, which negatively impacts firms'access to external finance in the region.1
2.3. Insolvency regimes, collateral, and credit information sharing systems
A country's insolvency regime – bankruptcy law –, typically, determines the extent to which creditors canrepossess collateral, reorganize the defaulting borrower, and recover a substantial part of the loaned capital incase of default. This is not without implications for firms' access to external finance. For instance, Araujo et al.(2012) find that reforming bankruptcy law in Brazil, in away that enhanced creditors' rights in cases of debtordefault, resulted in increases of 10% and 23% in the amount offirm total debt and long-termdebt, respectively.Djankov et al. (2007) report awide variation in creditor rights across countries, with implications for access tocredit by private businesses; countrieswhere creditors enjoy better legal protection have a greater ratio of pri-vate sector credit to GDP.
InMENA countries, one of themajor issues thatfirms and investors face is the legal framework that definesinsolvency and collateral regimes and creditor rights. Bankruptcy systems inMENA countries remain weak insettling insolvency cases through reorganization or liquidation. For instance, according to the Doing Businessreport of the World Bank (2012), creditors in these countries can expect to recover, on average, only 32.7
1 See, for instance, the MENA Quarterly Economic Brief, issued in July 2014, for evidence on poor public governance in some MENAcountries.
cents on a dollar from insolvent firms; a recovery rate which is lower than in any other region, exceptSub-Saharan Africa.2 Likewise, insolvency resolution is highly costly in MENA countries as it amounts to14% of the value of the debtor's estate, compared with 9% in OECD high-income countries. Moreover, theMENA region average time to resolve insolvency is too long – about 3.5 years. Collateral legal regimes areanother concern for creditors in MENA countries. While statistics reported by the Enterprise Survey of theWorld Bank show that access to credit is almost always contingent upon the availability of collateral, mostMENA countries suffer from the lack of reliable collateral regimes.3 As documented by Haselmann et al.(2010), the quality of collateral law is an important determinant of bank lending. Yet, inmostMENAcountries,the lawdoes not recognize non-possessory interests inmovable collateral and does not establish clear priorityrules between secured creditors after a debtor becomes in default. Consequently, MENA banks are said toface problems related to secured lending, especially in terms of registration, enforcement, and liquidation –particularly for movable collateral (e.g., Alvarez de la Campa, 2011).
Effective information sharing and credit reporting systems that provide lenders positive and negativedata on borrowers also support access to credit as they alleviate one of the major problems facing creditinstitutions – information asymmetry (See for instance, Jappelli and Pagano (2002) for empirical evidence).Information sharing systems in MENA credit markets are, bymany standards, under-developed. While creditreporting systems all over the world rely more and more on private credit bureaus (PCB), thought to collectand provide more comprehensive information about borrowers, those of MENA countries are still composedmainly of public credit registries (PCR), characterized by a lower level of depth of credit information. Accord-ing toMadeddu (2010), two-thirds of MENA countries still entirely rely on PCRs, which is a higher percentagecompared to all other geographical regions, except for Sub-Saharan Africa. While improving, the coverageof the population of borrowers – individuals and firms – is also still low compared to other regions(Business, 2013).
2.4. Financial system
It is widely believed that financial system development reduces the cost of external finance to firms(e.g., Rajan and Zingales, 1998). MENA countries have engaged, over the last two decades, in a series of liber-alization measures aimed at developing their financial sectors (Ben Naceur et al., 2008; Ben Naceur andOmran, 2011). Among the notable measures taken in this direction are the ending of government controlson deposit and lending rates and on credit allocation, the removal of high reserve requirements, and the per-mission granted to foreign investors to acquire shares through the stock market (liberalizing stock markets).These measures are expected to enhance financial development and, thereby to promote firms' access to ex-ternal finance. Yet, most assessments agree that these endeavors are far from having achieved the desiredgoals (e.g., Bourgain et al., 2012; Guyot et al., 2014). Ben Naceur and Omran (2011) note that “Despitethese reforms, security markets in theMENA region are still underdeveloped, with a limited number of listedcompanies, low free-float of shares, and thin trading” (p. 4). Only a handful of countries, such as theGCC coun-tries, have relatively developed and efficient bank sectors (Creane et al., 2004). Inmost of the other countries,however, the banking sector continues to be characterized by a heavy involvement of government-ownedbanks, known for lower efficiency in allocating credit and for deficient risk management systems. Likewise,in most of these countries, the banking sector is highly concentrated, and barriers to entry of new banks aretypically high (Turk-Ariss, 2009; Anzoategui et al., 2010).
2.5. Predictions
2.5.1. Leverage and firm-level factorsTo examine firm capital structure decisions in MENA countries, we use a set of common factors (Harris
and Raviv, 1991; Frank and Goyal, 2009) identified in most capital structure studies as having a significant
2 The recovery rate is 68.2% in OECD high-income countries.3 The Enterprise Survey shows that 72.2% of loans granted inMENA countries require collateral, and that the value of collateral needed
represents an average of 176.7% of the amount of the requested loan (Based on datasets available on www.enterprisesurveys.org,accessed on March 02, 2014).
104 M. Belkhir et al. / Emerging Markets Review 26 (2016) 99–129
influence on firm leverage. In what follows we discuss these factors and our expectations on their impact oncorporate leverage given the institutional and contracting environments that characterize MENA countries.
2.5.1.1. Firm size. Larger,more diversified,firms are expected to have higher target leverage ratios because theyhave less volatile earnings and, subsequently, face lower expected bankruptcy costs (e.g., Rajan and Zingales,1995; Fama and French, 2002). Moreover, larger firms may have better access to capital markets (Fama andFrench, 2002), and thereby Face lower costs of raising additional debt, all else equal. Kurshev andStrebulaev (unpublished manuscript) also argue that, in the presence of non-trivial fixed costs of raising ex-ternal funds, large firms have cheaper access to outside financing. The trade-off theory, thus, predicts a posi-tive effect of firm size on debt. Size may also be a proxy for information asymmetry between insiders andoutside investors. According to Fama and Jensen (1983), larger firms suffer from less information asymmetrycompared to smaller ones. As such, they are less prone to adverse selection problems, and are expected tohave easier access to external finance from both debt and equity capital markets. The pecking order theory,thus, does not predict a clear-cut relation between size and leverage. As is standard in the literature, wemea-sure firm size by the natural logarithm of total assets (SIZE). In MENA countries where institutions with animpact on firms' access to credit suffer from many deficiencies, we expect that access to debt capital will bemuch easier for larger firms, for the latter have the connections and the reputational capital, necessary for ac-cess to credit in a weak institutional and contracting environment. In a cross-country setting, we also expectthat the positive association between size and leverage attenuates in countries with relatively better qualityinstitutions.
2.5.1.2. Tangibility. The availability of tangible assets, such as property, plant, and equipment, can improve therecovery rates for creditors in cases of borrower default. As a result, this lowers expected bankruptcy costs andenhances lenders'willingness to supply credit. Additionally, tangible assets can reduce agency costs of debt bypreventing shareholders from substituting high-risk investments for low-risk ones (Frank and Goyal, 2009).By reducing expected bankruptcy costs and agency costs, tangible assets are expected to raise a firm's targetleverage. In the pecking order model, tangible assets can be associated with low information asymmetry. Thisimplies that the cost of issuing equity is relatively lower for firms with more tangible assets, holding all elseequal. As a result, firms with more tangible assets are expected to have less leverage. Across MENA countries,bankruptcy laws are weakly protective of lenders and property rights' security is low. It follows that creditorsfear expropriation and are more likely to require collateral to extend credit. Furthermore, poor collateralregimes do not enable firms and lenders to rely on assets other than tangible ones –mostly real estate assets –as loan collateral. We, thus, expect tangible assets to have a strong and consistent positive impact on firm le-verage across MENA countries. We also expect this positive impact to shrink in countries with comparativelybetter institutions – where collateral typically plays a less important role in lenders' willingness to extendcredit. We use the ratio of net fixed assets to total assets as a proxy for tangibility (TANG).
2.5.1.3. Profitability.More profitable firms face less expected bankruptcy costs. Moreover, if not shielded withimportant interest payments, these firmsmay end up paying higher amounts of corporate taxes (Modigilianiand Miller, 1963). From an agency perspective, more profits should also lead to the use of more debt as amechanism to curb managers' distorted incentives resulting from the availability of free cash flow (Jensen,1986). Therefore, in a trade-off framework, more profitable firms are likely to increase their target leverageratios. The basic model of the pecking order theory suggests that firms have a preference for internal fundsover external ones to finance their investments. Thus, contrary to the trade-off theory, the pecking order the-ory predicts that, holding investmentsfixed, leverage should be lower formore profitablefirms. In anenviron-mentwhere institutions are notwell developed to helpmitigate information asymmetry between lenders andfirms, such as in MENA countries, raising debt can be costly to firms. Thus, firms resort less to raising debt aslong as their profitability allows them to meet their investment needs. We, thus, expect that more profitablefirms have less leverage within each of our MENA countries.We use the ratio of operating income to assets asour measure of profitability (PROF).
2.5.1.4. Taxes. When interest is tax deductible, the greater the tax rates a firm faces and the more benefits itderives from using debt; greater interest payments result in more tax savings. The trade-off theory, thus, pre-dicts that firms facing greater tax rates on profits will use more leverage. We use the ratio of current income
taxes to income before taxes as a proxy for tax rates (TAX) and expect a positive cross-sectional correlationbetween TAX and firm leverage.
2.5.1.5. Bankruptcy risk. The trade-off theory implies that firms who are far away from financial distress willhave higher leverage because they enjoy low expected costs of bankruptcy. To control for the potential impactof financial distress on corporate leverage, we include Altman's Z-score asmodified byMacKie-Mason (1990)in the leverage regression equations. Altman's Z-score is a measure of the ex ante probability of distress(Graham, 2000), with higher values indicating a lower probability of distress. According to the trade-offmodel, we should observe a positive association between Z-score and leverage.
2.5.1.6. Liquidity. Firmswithmore liquid assets face lower bankruptcy costs, which enables them to raisemoredebt. More liquidity – free cash flow – is also a source of agency costs; firms with more liquidity, therefore,gain from usingmore debt to discipline their managers. Hence, according to the trade-off theory, more liquidassets will result in more leverage. However, in the pecking order theory, more liquid assets imply lessinformation asymmetry and, hence, a better ability to raise equity. This implies that higher asset liquidity isconducive to less leverage. We use the ratio of current assets to total assets as a proxy for liquidity (LIQ).
2.5.1.7. Growth opportunities. According to the agency model of capital structure, firms with more growth op-portunities should have less leverage. First, holdingprofitabilityfixed, thesefirms suffer less from the free cashflow agency problem,which reduces the benefit of using debt as amechanism to disciplinemanagers. Second,in the presence of growth opportunities, firms have incentives to use less risky debt, especially long-termdebt, to lower the agency cost associated with an investment policy where some valuable investment oppor-tunities are foregone (Myers, 1977; Barnea et al., 1981). Third, high growth firmswhich aremore prone to in-formation asymmetry may suffer more from the asset substitution agency conflict where insiders substitutehigh risk investments for low-risk ones. According to this view, high growth firms can reduce their agencycosts by having less debt (Jensen and Meckling, 1976). The pecking order theory predicts that growthfirms, which typically suffer from more information asymmetry, will accumulate more debt, holding profit-ability fixed. Based on prior literature (e.g., Adam and Goyal, 2008; Frank and Goyal, 2009), we use themarket-to-book ratio to proxy for growth opportunities (GROWTH). In MENA countries where informationasymmetry and property rights' and creditors' protection are major concerns, the sign of the within countrycross-sectional effect of GROWTH on leverage will depend on which effect – agency effect or pecking ordereffect – prevails over the other.
2.5.2. Leverage and MENA institutional factorsTo capture the role of institutional quality in firm leverage decisions across the MENA region, we rely on
several indicators of the quality of public governance and financial development. While a complex and mul-tifaceted concept, good public governance is commonly captured by some of its critical dimensions, such asthe rule of law, public sector efficiency, control of corruption, and democracy. We use three indicatorswhich capture three different dimensions of the quality of public governance: rule of law, regulatory effective-ness, and corruption.4
2.5.2.1. Rule of Law. The rule of law refers to the preeminence of law in governing behavior within a society,including of government institutions and officials. We measure the extent to which a MENA country abidesby the rule of law by the rule of law index developed by theWorld Bank (RL). This index reflects perceptionsof the extent towhich agents have confidence in and abide by the rules of society, and in particular the qualityof contract enforcement, property rights, the police, and the courts, as well as the likelihood of crime andviolence. This index ranges from −2.5 (weak rule of law) to 2.5 (strong rule of law). In countries whereinstitutions and individuals abide by the rule of law, investors are lessworried to be expropriated bymanagersand firms. This is likely to enhance their willingness to extend credit to firms at relatively better terms. We,therefore, expect that corporate leverage increases in the rule of law.
4 Ideally, one could have also used indicators thatmeasure the state of bankruptcy regimes, creditor rights, investor protection, contractenforcement, etc. However, when they are available for our sample countries, these indicators do not exhibit sufficient time-series andcross-country variation to ensure sound empirical estimations.
106 M. Belkhir et al. / Emerging Markets Review 26 (2016) 99–129
2.5.2.2. Regulatory Effectiveness. Regulatory effectiveness refers to a government's capability to enact andimplement policies and regulations that enhance the business climate and encourage entrepreneurship, pro-duction, and exchange of goods and services.We use theWorld Bank's regulatory quality index as a proxy fora country's regulatory effectiveness. This index captures perceptions of the ability of the government to for-mulate and implement sound regulations regarding the acquisition of property, licensing of new businesses,hiring of workers, importing factors of production, exporting output or capital, contracting with suppliers forneeded inputs, payment of taxes, government licenses and fees, and so forth. The index ranges from −2.5(weak effectiveness) to 2.5 (strong effectiveness). We label this measure RE and expect it to be positivelyassociated with firm leverage.
2.5.2.3. Corruption. Corruption can make it difficult to conduct business effectively, and may discourage firmsfrom raising debt capital due to the costly bribes that they need to disburse to be granted loans. In such a case,the more corruption a country has and the lower the corporate leverage will be. Yet, an alternative view sug-gests that corruption could be an efficient “lubricant” against stringent economic regulation and red-tape. Thiscould be especially true for access to credit in countries where the contractual environment is not businessfriendly and where banks are reluctant to extend credit at easy terms, as is the case in most MENA countries.By bribing bank officers, firms can get around regulations and stringent bank requirements related to collat-eral, default risk, etc. In such case, more corruption should lead to the use ofmore debt, ceteris paribus. We usetheWorld Bank index of corruption as a proxy for a country's control of corruption (CORR). The index rangesfrom−2.5 (weak control of corruption) to 2.5 (strong control of corruption).Whethermore corruption leadsto more or less corporate leverage is an empirical issue which we leave to the empirical estimations touncover.
2.5.2.4. Financial development. Financial development facilitates firms' access to external finance, especiallythrough enhancing the quality of information. Rather than considering whether a country has a market- ora bank-based financial system, in this paper, we take the view that it is the level of development of thewhole financial system represented by both equity markets and financial intermediaries that matters tofirmsfinancingdecisions. Subsequently,wemeasurefinancial development (FD) by an indicator that capturessize, activity, and efficiency of both financial intermediaries and markets. This indicator developed byDemirguc-Kunt and Levine (1999) and Levine (2002) is a principal component of finance activity, size andefficiency where finance activity is the logarithm of the total value traded ratio times the private creditratio, financial size is the logarithm of the market capitalization ratio times the private credit ratio, andfinancial efficiency is the logarithm of the total value traded ratio divided by overhead costs. Greater valuesof FD indicate a more developed financial system. Whether greater financial development leads to the useof more debt or equity is therefore an empirical issue.
Following Demirguc-Kunt and Maksimovic (1996), our multivariate analysis also controls for two macro-economic factors: the inflation rate (INF) and GDP annual growth rate (GDPG).
3. Data and empirical method
3.1. Data
Our firm-level data are collected from the Fitch-IBCA Worldscope database. Macroeconomic data – GDPand inflation rate – are obtained from the IMF's International Financial Statistics, whereas country-level insti-tutional variables are obtained from various sources, such as the Financial Structure Database and the Gover-nance Indicators Database of the World Bank, and the Heritage Foundation. Variables used in the analysis,their descriptions, and sources are reported in Table 1.
Our sample covers firms from 10 MENA countries. The countries are Bahrain, Egypt, Jordan, Kuwait,Morocco, Oman, Qatar, Saudi Arabia, Tunisia, and the UAE.5 Thus, six of our sample countries are members
5 The choice of these ten countries is dictated by the availability of data in theWorldscope database. In fact, inmany other countries ofthe region, there are only a few or no reported companies in the database, which led to their exclusion from our sample.
Table 1Description of the variables and sources.
Variable Description Source
Panel A: Variables used in the main analysisLeverage measure
Book value totaldebt ratio (BVD)
Total debt to total assets Fitch-IBCA Worldscope
Market value totaldebt ratio (MVD)
Total debt to the market value of equity plus the book value of debt Fitch-IBCA Worldscope
Firm-level variablesSize (SIZE) Natural log of total assets Fitch-IBCA WorldscopeTangibility (TANG) Net fixed assets to total assets Fitch-IBCA WorldscopeProfitability (PROF) Operating income to total assets Fitch-IBCA WorldscopeTax shield (TAX) Current income taxes to Income before taxes Fitch-IBCA WorldscopeDistance frombankruptcy (Z-score)
Liquidity (LIQ) Current assets to total assets Fitch-IBCA WorldscopeGrowthopportunity(GROWTH)
The market value of equity plus the book value of debt to total assets Fitch-IBCA Worldscope
Economic variablesGDP growth(GDPG)
Growth rate of real of GDP IMF's InternationalFinancial Statistics
Inflation (INF) Rate of increase in CPI IMF's InternationalFinancial Statistics
Institutional variablesFinancialdevelopment (FD)
Financial system development is a principal component of finance activity,size and efficiency where finance activity is the logarithm of the total valuetraded ratio times the private credit ratio, financial size is the logarithm ofthe market capitalization ratio times the private credit ratio, and financialefficiency is the logarithm of the total value traded ratio divided byoverhead costs. Suggested by Demirguc-Kunt and Levine (1999) and Levine(2002).
Index reflects perceptions of the ability of the government to formulate andimplement sound regulations regarding the acquisition of property,licensing of new businesses, hiring of workers, importing factors ofproduction, exporting output or capital, contracting with suppliers forneeded inputs, payment of taxes, government licenses and fees, and soforth. The index ranges from −2.5 (weak effectiveness) to 2.5 (strongeffectiveness).
Governance indicatorsdatabase(World Bank)
Rule of Law (RL) Index reflects perceptions of the extent to which agents have confidence inand abide by the rules of society, and in particular the quality of contractenforcement, property rights, the police, and the courts, as well as thelikelihood of crime and violence. The index ranges from−2.5 (weak law) to2.5 (strong law).
Governance indicatorsdatabase(World Bank)
Corruption (CORR) Index reflects perceptions of the extent to which public power is exercisedfor private gain, including both petty and grand forms of corruption, as wellas “capture” of the state by elites and private interests. The index rangesfrom −2.5 (weak control of corruption) to 2.5 (strong control ofcorruption).
Governance indicatorsdatabase(World Bank)
Panel B: Alternative variables used in the robustness testsLong-term debt ratio(LTDR)
The ratio of long-term debt (maturing more than one year) to total debt.Total debt is the sum of long-term debt and debt in current liabilities.
Fitch-IBCA Worldscope,authors' calculations
Non-debt tax shields(TAX1)
The ratio of depreciation and amortization to total asset Fitch-IBCA Worldscope,authors' calculations
Notes: This table describes the variables used in the paper.
of the Gulf Cooperation Council characterized by oil-export-based economies. We use annual data over theperiod 2003–2011. Following prior research, we exclude all financial firms whose capital structure decisionsobey to other factors. We require that firms have at least three consecutive years of available data over thesample period to be included in the sample. Moreover, we exclude firms with negative book equity. Our
108 M. Belkhir et al. / Emerging Markets Review 26 (2016) 99–129
final sample consists of 444 firms making up a total of 3717 firm-year observations.6 We winsorize all firm-level variables at the 1st and 99th percentiles to mitigate the potential impact of outliers on the analysis.
3.2. Empirical method
In this study, we use twowidely usedmeasures of firm capital structure: the total book-debt ratio (BVD) –a measure of book leverage – defined as the ratio of total debt to book value of assets and the total market-debt ratio (MVD) – a measure of market leverage –defined as the ratio of total debt to firm market value,where firm market value is measured as the sum of total debt plus the market value of equity.7 Followingprior work (Ozkan, 2001; Fama and French, 2002; Leary and Roberts, 2005; Flannery and Rangan, 2006;Kayhan and Titman, 2007; Lockhart, 2010; Gungoraydinoglu and Öztekin, 2011; Oztekin and Flannery,2012; Flannery et al., 2013; among others), we use a dynamic partial adjustmentmodel. This model accountsfor the potentially dynamic nature of firm capital structure. The model, thereby, allows us to test whetherthere is a target or optimal capital structure and if so, to uncover the speed at which firms move towardstheir targets. Moreover, this model allows us to further control for the potential impact of unobserved firm-specific, time-invariant, and institutional factors on each firm's target leverage. Specifically, an optimal capitalstructure model can be formalized as:
where Dij ,t⁎ is firm i's optimal or target debt ratio at time t in country j, Xij ,t and Yj ,t are, respectively, vectorsof firm-level and country characteristics (institutional, macroeconomic) that determine the target debtratio, Xij ,tYj ,t is the interaction between the firm-level and country-level determinants of capital structure,δi is an unabsorbed firm fixed effect. εit is a random error term assumed to be independently identical andnormally distributed with zero mean and constant variance, εit~ iid N(0,σ2).
In the ideal world with perfect markets (i.e., in the absence of asymmetric information and transaction oradjustment costs), firms fully and instantaneously adjust their capital structures to optimal leverage ratios inresponse to any variations infirm-level or country characteristicswithin eachperiod of time. This implies that,at any point in time, a firm's actual leverage ratio should equal its optimum level, that isDi ,j ,t=Dij,t⁎ . However,in the presence of capital market imperfections, firms' capital structures do not completely and instanta-neously adjust towards optimal leverage ratios. This implies that following a shock to the capital structure,a firm's actual leverage ratio will deviate from its optimal leverage, and then adjust partially towards the op-timal ratio each period. Accordingly, the notion of partial adjustment can be formalized as follows:
Dij;t � Dij;t�1 ¼ γij;t D�ij;t � Dij;t�1
� �ð2Þ
or
Dij;t ¼ 1� γij;t
� �Dij;t�1 þ γij;t D
�ij;t ð3Þ
γij ,t is the adjustment parameter representing the adjustment speed of a firm's actual leverage ratio
whereDij ,t towards its optimal level, Dij , t⁎ . This coefficient should strictly lie between 0 and 1, with higher valuesindicating that the cost of deviating from the target is higher than the cost of adjustment and, hence, a highspeed of adjustment towards the optimal leverage ratio.
e our data is collected fromWorldscope database, our samplefirms aremainly listedfirms that tend to be among the largestfirmsrespective counrties. We thus caution readers that our conclusions apply to large firms and may not necessarily be the same fores such as small and mid-sized firms.mples of studies that used these two measures of firm leverage include Oztekin and Flannery, 2012; Antoniou et al., 2008; etc.
Substituting Eq. (1) into the partial adjustment specification in Eq. (3) and re-arranging removes the un-observable optimal leverage Di,j ,t⁎ ,and yields the following empirical model:
8 In tlags of tdustry a
9 Seeyses of10 Indend up
Dij;t ¼ ϑ0 þ θ0 Dij;t�1 þΦx fXij;t þΦyc
Y j;t þΦxfcXij;tY j;t þ μ i þωit ð4Þ
where ϑ0=α0γij,t ,θ0=(1-γij,t) ,Φxf=βfγij,t ,Φyc=βcγij,t ,Φxfc=βfcγij ,t ,μ i=δiγij,t ,ωit=εitγij,t.The dynamic panel model in Eq. (4) is estimated using the system GMM estimator of Arellano and Bover
(1995) and Blundell and Bond (1998), which yields asymptotically efficient and consistent estimators by con-trolling for both unobserved individual heterogeneity (i.e., unobservable firm specific effects) and potentialendogeneity problems (i.e., the potential correlation between the regression errors and the explanatoryvariables due to the existence of lagged dependent variables). This estimation combines the regression indifferenceswith the regression in levels. The instruments for the regression in differences are the lagged levelsof the corresponding variables. The instruments for the regression in levels are the lagged differences of thecorresponding variables.8
As well known, the consistency of the GMM estimator depends on the assumption that the lagged valuesof the corresponding variables are valid instruments and that thefirst differenced regression residuals are freefrom second order serial correlation. To check for the validity of the instruments, we use Sargan test for over-identifying restrictions. We use Arellano-Bond AR (2) test to examine for the presence of second order serialcorrelation in the first differenced regression residuals.
Our regression equations also include industry-dummy variables to control for the potential impact of in-dustry affiliation on corporate leverage.9 We use Campbell's (1996) industry classification to subdivide oursample firms into eleven industries.10
4. Empirical results
4.1. Descriptive statistics
Table 2 reports summary statistics for our twomeasures of corporate leverage by country aswell as for thefull sample. In a nutshell, it suggests that there is a large cross-country variation in corporate leverage, withthe average BVD ranging from a minimum of 15.6% in Bahrain (median: 10.9%) to a maximum of 47.5% inOman (median: 46.3%). Using market values – MVD –, Bahrain continues to be the country where firms arethe least levered (Mean: 17.10%;median: 10.6%) andOman continues to be the countrywith themost leveredfirms (Mean: 42.4%;median: 41.2%). Table 2 also suggests that there is a largewithin-country variation of cor-porate leverage with standard deviations typically above 20%. The standard deviations of the book leverageratios show that they vary most across Omani firms (26.9%), while they vary least among Bahraini firms(14.2%). The full sample statistics reveal that the average firm in the MENA region has a book leverage ratio(BVD) of 39%, while the typical firm has a leverage ratio of 36.8% or less. Using the market leverage ratioshows that debt represents 33.4% of the market value of the average firm in the MENA region (median:27.5%). Table 3 presents mean values of our debt ratios over the sample period of 2003–2011. It shows thatwhile average debt ratios have increased over time in some countries (e.g., Bahrain, Kuwait, Morocco, andQatar) they have, however, decreased in some others (e.g., Egypt and Saudi Arabia).
Fig. 1 (Fig. 2) ranks MENA countries according to their mean values of BVD (MVD) from the lowest to thegreatest. It shows that MENA countries fall into two groups according to their corporate leverage ratios. Agroup of relatively low corporate leverage represented by Bahrain, Jordan, Saudi Arabia, Qatar, and to someextent the UAE, and another group of relatively high corporate leverage made up of Kuwait, Tunisia,Morocco, Egypt, and Oman. Fig. 2, based onmarket values, confirms this observation, for almost all countries;
his paper, we perform a two-step Blundell and Bond system GMM using STATA 10 procedure ‘xtdpdsys’with two- to five-periodhe explanatory variables as instruments. In the Eq. (6), we also include dummy variables to control for unobserved country, in-nd time-specific effects., for instance,MacKay and Phillips (2005) andMiao (2005) for evidence on the importance of including industry dummies in anal-corporate leverage.eed, Campbell (1996) identifies twelve industries including financial companies. Since we exclude the latter from our sample, wewith eleven different industries.
Table 2Summary statistics of debt ratios.
Panel A: Summary statistics of debt ratios by country
No. of firms Observations Book value total debt ratio (BVD) Market value total debt ratio (MVD)
Notes: This table presents the mean book andmarket value of total debt ratio of our sample firms in 10 MENA countries for the period of(2003–2011). Book value of total debt ratio (BVD) is measured by the ratio of total debt to total asset.Market value of total debt ratio(MVD) is measured by the ratio of total debt to the market value of equity plus the book value of debt.
the only exception is Tunisia, whichmoves to the low-corporate leverage side. Overall, our descriptive statis-tics show that leverage ratios in MENA countries are comparable to those observed in developing countries,reported in Booth et al. (2001) and Fan et al. (2012), but also to those reported by Antoniou et al. (2008)for the five most developed countries in the world – France, Germany, Japan, U.K., and U.S.
Table 4 reports mean values of the firm- and country-level variables used in the multivariate analysis ofcorporate leverage in MENA countries by country, as well as the full sample mean and standard deviationof each of these variables. We note that the UAE has the largest firms (SIZE: 5.651), followed closely byQatar (SIZE: 5.612), while Jordan (SIZE: 4.446) has the smallest firms. A remarkable difference in tax regimesacross MENA countries can be detected by looking at TAX. As regards the macroeconomic environment,Table 4 shows that there is large cross-country variation in GDP growth, with Qatar scoring the highest aver-age growth rate over the sample period (GDPG: 15.1%) and Bahrain having the lowest economic growth(GDPG: 2.5%). The average annual inflation rate in MENA countries over the sample period was 4.7%, withthe lowest average inflation observed in Morocco (INF: 1.8%) and the greatest inflation rate observed inEgypt (INF: 9.8%). The quality of institutions also varies from one MENA country to another. Financial devel-opment varies widely across countries, with Oman having the least developed financial system (FD: -0.754)and Saudi Arabia having the most developed financial system (FD: -0.109). In terms of regulatory effective-ness, Governments of Bahrain (RE: 0.74), UAE (RE: 0.62), and Oman (RE: 061) are by far the most effectivein setting up and implementing regulations that have an impact on the quality of the business environment,whereas the governments of Egypt and Morocco are the least effective ones in this matter. The rule of lawindex indicates that Qatar has the strictest rule of law (RL: 0.692) whereas Morocco has the weakest rule oflaw (RL: -0.138). Corruption is most rampant in Egypt (CORR: -0.57) and the least acute in the UAE (CORR:1.03). Overall, even thoughMENA countries are often regarded as a uniform regional blockwith similar insti-tutional characteristics, they, nevertheless, differ substantially in the quality of their institutions, which mayhave an impact on the way their firms finance their assets.
In Table 5, we report Pearson correlation coefficients between the different variables used in the analysis.We find that bothmeasures of leverage are positively and significantly correlatedwith firm size and asset tan-gibility. Consistent with the predictions of the pecking order theory, bothmeasures of leverage are negativelycorrelated with profitability. Furthermore, consistent with the predictions of the trade-off theory, BVD is pos-itively correlated with TAX. In line with the pecking order theory, LIQ is negatively correlated with bothmea-sures of leverage. As predicted by the trade-off theory of capital structure, themarket value of leverage (MVD)
Fig. 1. Mean and median book value of total debt ratios. Notes: This figure presents the mean and median book value of total debt ratio of our sample firms in 10 MENA countries for the period of(2003–2011). Book value of total debt ratio is measured by the ratio of total debt to total asset.
Fig. 2. Mean and median market value of total debt ratios. Notes: This figure presents the mean and median market value of total debt ratio of our sample firms in 10 MENA countries for the period of(2003–2011). Market value of total debt ratio is measured by the ratio of total debt to the market value of equity plus the book value of debt.
Notes: See Table 1 for detailed definition of each variable. The data set is a panel consists of 3717 firm-year observations representing 444 firms from 10 MENA countries over the period 2003–2011.
Notes: This table presents correlation coefficients between variables. The data set is a panel consists of 3717 firm-year observations representing 444 firms from 10 MENA countries over the period2003–2011. See Table 1 for the definition of variables. Numbers in parentheses indicate p- values. *, ** and *** indicate significance at the 10%, 5% and 1% levels, respectively.
is negatively correlated with firm growth opportunities (GROWTH). We also notice that most of the correla-tion coefficients between firm-level variables are reasonably low, implying that multicollinearity is not amajor concern for our analyses. We now turn to the multivariate analysis to check whether these univariatecorrelations continue to hold.
4.2. Firm-level determinants of capital structure
Table 6 reports the results of country-by-country regressions of corporate leverage on firm-specific factors.Results based on book leverage are reported in Panel A whereas those based onmarket leverage are reportedin Panel B. We first notice that the one period lagged dependent variable – BVD or MVD – has a positive andsignificant effect on firm capital structure across all the MENA countries.11 The coefficient estimates on thelagged dependent variables vary between zero and one. Such a finding suggests that MENA firms have targetcapital structures towards which they adjust over time. The speed of adjustment with which firms move to-wards their targets, however, varies from one MENA country to another implying that adjustment costs arenot uniform across the region. The fastest adjustment towards target book leverage is achieved by Bahrainifirms, followed closely by Kuwaiti and UAE firms, whereas the slowest adjustment takes place in Jordan,Oman, Morocco and Qatar. The coefficient on lagged BVD in Bahrain implies that firms close almost 80%(1–0.197) of the gap between observed and target leverage within one year. On the other extreme,Jordanian firms close slightly above half (1–0.455) of the gap within one year.
Using market leverage, Omani firms have the slowest adjustment speed towards target leverage; the co-efficient estimate on lagged MVD equals 0.581, implying that firms close almost 42% of the gap within oneyear. Panel B also shows that Moroccan firms have the fastest adjustment towards target market leverageas they close 77.1% (1–0.229) of the gapwithin one year. Overall, our results suggest that capital structure de-cisions offirms located inMENA countries are dynamic, and thatmanagers target specific leverage ratiosmea-sured in both book and market values. They also suggest that transaction costs vary substantially from onecountry to another, possibly because of differences in the quality of institutional environments. This, thereby,results in different speeds of adjustment towards target capital structures across these countries. Our resultsalso suggest that speeds of adjustment in our sample countries are generally higher than those reported in theliterature – 25% in Antoniou et al. (2008), 28% in Ebrahim et al. (2014), 34% in Flannery and Rangan (2006),and up to 41% in Oztekin and Flannery (2012). A reasonable explanation of this finding lies with the type offirms included in our sample. These firms are the largest ones in their respective countries with good reputa-tions in their national financial markets, which facilitate their access to capital at relatively low transactioncosts. This is likely to lower their adjustment costs and speed up their adjustment towards their targetleverages.
In step with the literature on other parts of the world (e.g., Rajan and Zingales, 1995; Booth et al., 2001;Antoniou et al., 2008; Frank and Goyal, 2009; Ebrahim et al., 2014), we find a positive and significant associ-ation between firm size and leverage in all countries and across the two measures of leverage, possiblyreflecting the argument that large, more diversified, firms face lower default risk. The strong positive impactof size on leverage can, in fact, be reasonably attributed to the association of firm size with the (lower) prob-ability of default given the existence of inefficient bankruptcy regimes across MENA countries. The nature ofthese regimes increases bankruptcy costs and makes access to debt capital by relatively small (riskier) firmsdifficult and particularly costly. The positive association between firm size and leverage across all our samplecountries also reinforces the belief that information asymmetry between firm insiders and capitalmarkets is amajor problem in theMENA region, including for relatively large firms. In theory, larger firms suffer from lessinformation asymmetries and should use less debt as they are more able to issuemore informationally sensi-tive securities, such as stock. Yet, this does not square with our finding of a positive association between firmsize and leverage, and suggests that MENA countries' firms do not gain much in transparency as they growlarger.
The estimated relation between asset tangibility (TANG) and corporate leverage is positive and significantin all countries and across the twomeasures of leverage. This is not a surprising result in a regionwhere bank-ruptcy laws are not strongly protective of creditors and property rights' security is low. Credit may therefore
11 The only exception is the MVD regression for Qatar where the coefficient estimate on the dependent variable is positive but statisti-cally insignificant.
Table 6Firm-level determinants of leverage: a country-by-country analysis.
Explanatory variables Country
UAE Bahrain Egypt Jordan Kuwait Morocco Oman Qatar Saudi Arabia Tunisia
Panel A: Book value of total debt ratio (BVD)BVD (t-1) 0.197***
(0.006)0.134**(0.053)
0.220**(0.017)
0.468***(0.009)
0.192**(0.025)
0.412***(0.000)
0.455***(0.000)
0.400***(0.000)
0.271***(0.009)
0.326***(0.000)
SIZE 0.094***(0.004)
0.246**(0.013)
0.037**(0.021)
0.163***(0.005)
0.120**(0.012)
0.376***(0.000)
0.341***(0.000)
0.180**(0.020)
0.184***(0.009)
0.268***(0.000)
TANG 0.246***(0.000)
0.049**(0.048)
0.171**(0.012)
0.056***(0.004)
0.303**(0.019)
0.317***(0.000)
0.122**(0.020)
0.115***(0.004)
0.307**(0.023)
0.302***(0.005)
PROF −0.193***(0.000)
−0.269(0.253)
−0.280***(0.000)
−0.302**(0.171)
−0.105(0.384)
0.0251(0.097)
−0.173**(0.047)
0.013(0.922)
0.010(0.947)
0.296(0.085)
TAX - - 0.004***(0.003)
0.002**(0.037)
0.035(0.305)
0.001**(0.046)
0.015(0.714)
0.574 (0.623) 0.009(0. 731)
0.011**(0.036)
Z-score −0.072**(0.026)
−0.095**(0.030)
−0.293***(0.000)
−0.110***(0.000)
−0.035**(0.039)
−0.070***(0.009)
−0.106***(0.003)
−0.271**(0.017)
−0.027**(0.028)
−0.154***(0.000)
LIQ −2.441***(0.000)
−0.405(0.402)
0.106(0.793)
−0.509**(0.017)
−2.12**(0.012)
−0.092**(0.030)
−0.677***(0.001)
−1.210 (0.181) −0.446**(0.048)
−0.496**(0.045)
GROWTH 0.011**(0.011)
−0.0022(0.762)
−0.007**(0.036)
0.0002(0.491)
0.001(0.192)
−0.001***(0.000)
0.013(0.210)
−0.076**(0.029)
0.000(0.953)
−0.005(0.178)
Intercept −0.075(0.729)
−0.921**(0.050)
0.907***(0.006)
−0.334**(0.020)
−0.203**(0.025)
−1.517***(0.010)
0.585***(0.006)
0.712**(0.044)
−0.891**(0.033)
−0.655***(0.001)
Sargan test 11.867(0.920)
6.006(0.998)
20.721(0.413)
23.888(0.247)
20.849(0.406)
19.716(0.475)
17.685(0.409)
12.027(0.525)
14.804(0.321)
5.714(0.999)
AR (2) test 1.073(0.283)
−0.383(0.701)
−0.763(0.445)
−1.216(0.223)
−1.894*(0.058)
−1.549(0.121)
−0.825(0.409)
−1.985*(0.057)
−0.649(0.516)
−0.804(0.420)
118M.Belkhir
etal./Emerging
Markets
Review26
(2016)99–129
Panel B: Market value of total debt ratio (MVD)MVD (t-1) 0.253***
(0.000)0.352**(0.036)
0.292***(0.000)
0.475*(0.095)
0.254***(0.000)
0.229**(0.017)
0.581***(0.000)
0.344(0.321)
0.284***(0.001)
0.321***(0.000)
SIZE 0.269***(0.004)
0.475**(0.020)
0.145**(0.049)
0.378***(0.002)
0.256***(0.000)
0.144***(0.000)
0.248**(0.020)
0.238**(0.033)
0.415***(0.000)
0.797***(0.005)
TANG 0.384***(0.000)
0.360***(0.000)
0.164**(0.049)
0.265**(0.013)
0.322***(0.000)
0.368***(0.000)
0.210**(0.025)
0.195***(0.004)
0.221***(0.000)
0.173***(0.007)
PROF −0.209(0.476)
−0.270(0.109)
−0.190(0.364)
−0.151**(0.029)
−0.102(0.171)
−0.418***(0.000)
−0.169**(0.018)
−1.683(0.137)
−0.241**(0.028)
−0.076(0.392)
TAX - - 0.0023***(0.000)
0.044**(0.037)
0.100**(0.036)
0.084**(0.021)
−0.118(0.256)
0.470(0.131)
0.003(0.842)
0.053***(0.000)
Z-score (t) −0.043(0.419)
−0.098**(0.013)
−0.063*(0.067)
−0.044***(0.007)
−0.041***(0.000)
−0.039***(0.000)
−0.040(0.115)
0.051(0.716)
−0.017***(0.010)
−0.105**(0.039)
LIQ −3.272***(0.000)
−0.078(0.195)
−4.412***(0.002)
−0.650**(0.011)
−1.741***(0.010)
−1.214(0.298)
−0.741(0.215)
−1.600**(0.044)
−0.285(0.327)
−1.065*(0.065)
GROWTH −0.099***(0.000)
0.016(0.461)
−0.004***(0.000)
−0.000(0.144)
−0.209***(0.000)
−0.176***(0.000)
−0.208***(0.000)
−0.069**(0.046)
−0.026***(0.000)
−0.095***(0.003)
Intercept −0.974*(0.093)
−1.073**(0.047)
−0.721***(0.001)
−1.393***(0.009)
−0.901***(0.000)
−0.259**(0.031)
0.489(0.144)
−0.722(0.278)
−2.152***(0.000)
−3.208**(0.036)
Sargan test 11.195(0.670)
8.325(0.871)
15.303(0.285)
6.992(0.221)
19.706(0.139)
18.070(0.582)
12.604(0.126)
12. 893(0.598)
18.959(0.188)
8.422(0.988)
AR (2) test −0.135(0.892)
−0.091(0.927)
−0.884(0.376)
−1.004(0.315)
−0.711(0.476)
−0. 394(0.693)
−0.059(0.952)
−1.594(0.110)
−1.422(0.154)
−0.232(0.816)
Notes: This table presents regression results of firm-specific determinants of debt ratio by country. See Table 1 and for the definition of the variables. Panel A reports the results of the book total debt ratio.Panel B reports the results of market total debt ratio. The data set is a panel consists of 3717 firm-year observations representing 444 firms from 10 MENA countries over the period 2003–2011. The re-gressions are estimated using the two-step system GMM estimator of Arellano and Bover (1995) and Blundell and Bond (1998) withWindmeijer (2005) small-sample correction method. The t-2 lags ofthe variables used as instruments in the difference equation, and the same lags of differenced variables are used in the levels equation. Numbers in parentheses indicate p- values. All regressions includedummies to control for time, industry and firm fixed effects. Sargan test is a test for the validity of instruments and is asymptotically distributed as χ2 under the null of valid instruments. If p-value N0.05,we confirm the validity of instruments. AR (2) is a test for the second-order serial correlation and is asymptotically distributed as N(0,1) under the null of no serial correlation. If p-value N0.05, we confirmof no serial correlation at order two in the first-differenced errors and the model is well specified. *, ** and *** indicate significance at the 10%, 5% and 1% levels, respectively.
119M.Belkhir
etal./Emerging
Markets
Review26
(2016)99–129
120 M. Belkhir et al. / Emerging Markets Review 26 (2016) 99–129
be conditional upon the availability of collateral, especially tangible assets; firms with more tangible assetscan access debt financing at relatively better terms. This finding is consistent with Flannery and Rangan(2006) and Antoniou et al. (2008). As regards economic magnitude, Panel A shows that the coefficient esti-mate on TANG is largest in Morocco, suggesting that this country's firms depend the most on tangible assetsto raise debt. One can reasonably link this finding to the quality of governance and institutions in Morocco.Among our sample countries, Morocco is only better than Egypt in terms of corruption and regulatory effec-tiveness, and is the worst in terms of rule of law. Sufficient tangible collateral may thus be the only guaranteethat creditors can have to grant loans. Bahrain on the other hand has theweakest economic effect of TANG onfirm leverage. It also has the highest score of regulatory effectiveness and the second best score in rule of law.Hence, the effect of tangible assets on corporate leverage is very likely reflecting the quality of countries'institutions.
The coefficient estimate on PROF is negative and significant in six out of the ten sample countries if we takethe book andmarket leverage regressions together. In line with the pecking order theory, firm leverage in theUAE, Egypt, Jordan, Morocco, Oman, and Saudi Arabia reflects historical profitability. This result is consistentwith the findings of several studies using international samples (Booth et al., 2001; Antoniou et al., 2008; DeJong et al., 2008; Fan et al., 2012, among others). The magnitude of the coefficient estimate on PROF in thebook leverage (market leverage) regressions suggests that the strongest negative effect of profitability on cor-porate leverage is observed in Jordan (Morocco), possibly reflecting the severity of information asymmetriesin these two countries; this may drive managers to rely primarily on internally generated funds to financetheir investments.
In both Panels A and B, we estimate a positive and significant relation between the corporate tax rate andleverage in non-GCC countries, which are Egypt, Jordan, Morocco, and Tunisia. Consistent with the trade-offmodel, in each of these countries, more tax payments lead firms to borrow more, most likely to benefitfrom the interest-tax shield. Yet, the economic magnitude of this advantage is very small; in Tunisia, wherethe coefficient estimate on TAX is the greatest, a 10 percent increase in the tax rate results in only 0.11% in-crease in corporate leverage. Apart from Kuwait in panel B, TAX has no impact on corporate leverage in anyof the GCC countries, reflecting the lenient corporate tax regimes of these oil-rich countries. In the UAE andBahrain, by law, corporations pay no taxes at all, while in Kuwait, listed companies are subject to a 2.5% in-come tax. In Saudi Arabia, the corporate income tax rate of 20% is applicable only to non-Saudi shareholders,while a religious tax (Zakat) at 2.5% is levied on Saudi and GCC nationals or companies owned by them. InQatar, the corporate tax rate is 10%, but is generally applicable to only foreign investors; wholly ownedQatari/GCC entities are exempt from corporate taxation. Oman imposes corporate income at a rate of 12%, ir-respective of the form of the company or the nationality. In both panels A and B, we find that firms with lowprobabilities of financial distress (high Z-score) use relatively less debt. This result is similar to Graham's(2000) findings for U.S firms.
Panel A and Panel B together reveal that growth opportunities (GROWTH) are negatively and significantlyrelated to leverage in all countries, except in Bahrain and Jordan. This is consistent with the agency view ofcapital structure according to which high growth firms can reduce their agency costs by using less debt(Jensen and Meckling, 1976). Antoniou et al. (2008) report similar results for their sample of five developedcountries. A cross-country comparison reveals that there is a remarkable difference in the economic magni-tude of the impact of GROWTH on leverage. Specifically, Panel B suggests that raising debt by firms withhigh growth opportunities is relativelymuch costlier in Kuwait and Oman. In sum, the country by country es-timations reveal that the growth opportunities–corporate leverage relation in the MENA region is consistentwith other regions. It also suggests that the institutional environment may play a role in the extent to whichgrowth opportunities limit firms' use of debt, as themagnitude of this inverse relation varies across countries.
Taken together, panels A and B show that we estimate a negative and significant relation between firm li-quidity (LIQ) and leverage in nine out of the ten sample countries, with Bahrain being the only country whereLIQ is not significantly associated with neither book nor market leverage. This inverse relation between afirm's asset liquidity and leverage is consistent with Myers and Rajan (1998) andMorellec (2001) theoreticalview that lower asset liquidity increases managers' costs of expropriating value from creditors, and thus, re-duces the cost of debt, thereby inducingfirms to increase their financial leverage. This view is of particular rel-evance in MENA countries where firms suffer from the lack of good corporate governance practices and therisk of expropriation is typically high. Hence, creditors may be reluctant to extend credit to firmswith impor-tant liquid assets that can be prone to easy expropriation. The alternative interpretation of this finding is that
because MENA collateral regimes are underdeveloped, and do not allow for the use of liquid assets, such asreceivables and marketable securities, as loan collateral, firms with more of these assets are less able toraise debt, ceteris paribus.
4.3. Institutions and corporate leverage in the MENA region
To estimate the impact of institutional factors on financial leverage, we pool all observations from the tenMENAcountries and regress book leverage andmarket leverage on the set offirm- and country-level variablesdescribed above. We include our four institutional factors in separate regressions to avoid problems ofmulticollinearity. We first report, in columns (1) and (7) of Table 7, the pooled regressions of book leverageand market leverage on firm-level factors. Overall, the results suggest that, in the MENA region taken as awhole, corporate leverage is positively related to firm size and tangibility and negatively related to profitabil-ity, default risk, tax payments, liquid assets and growth opportunities. Further, the coefficient estimates onmost of the firm-level variables are economically meaningful. For instance, the coefficient estimate on SIZEin column (1) indicates that, on average, a one-unit increase in firm size results in a 5.5% increase in corporateleverage in the MENA region. Likewise, based on column (1), the estimated coefficient on TANG in column(1) suggests that a one-unit increase in tangible assets leads to an increase in the leverage ratio of 16.1 per-centage points whereas the coefficient estimate on PROF implies that a one-unit increase in profitabilityleads to a decrease in the debt ratio by 20 percentage points. Moreover, a one-unit increase in the likelihoodof defaultmeasured by the Z-score lowers book leverage by 10.7%while a one-unit increase in LIQ reduces thedebt ratio by 47.5 percentage points, ceteris paribus.
In columns (2) and (8), we further control for GDP growth rate and inflation.We find that firms located incountries with greater economic growth and higher inflation rates operate with more financial leverage. Asregards economic magnitude, the estimated coefficients on GDP growth in columns (2) and (8) indicatethat a one-unit increase in GDP growth is associated with an increase in the book (market) leverage of nearly39.4 (14.7) percentage points. Similarly, columns (2) and (8) indicate that a one-unit increase in inflation isassociated with an increase in the book (market) leverage of nearly 5.7 (28.5) percentage points, ceterisparibus. We next estimate the impact of financial development on leverage by including FD as an additionalexplanatory variable. Both columns (3) and (9) suggest that firms located in countries with relatively moredeveloped financial systems use more debt; the coefficient estimate on FD is positive and significant inboth book andmarket leverage regressions. The impact of FD is also economically significant as a one-unit in-crease in the FD index is associated with an increase in the book (market) leverage of nearly three (two) per-centage points, ceteris paribus. This result suggests that debt capital supply is an important factor thatdetermines the degree of firm financial leverage in the MENA region. Financial leverage is not a merelyfirm-level decision, but also depends on the extent to which a country's financial system is able to satisfyfirms' demand for debt capital. Our finding that financial development is a significant determinant of firm fi-nancial leverage over-and-above firm-level factors is all the more reasonable in the MENA region where fi-nancial systems tend to be weak; any improvement in a country's financial system is expected to boostfirms' access to debt capital.
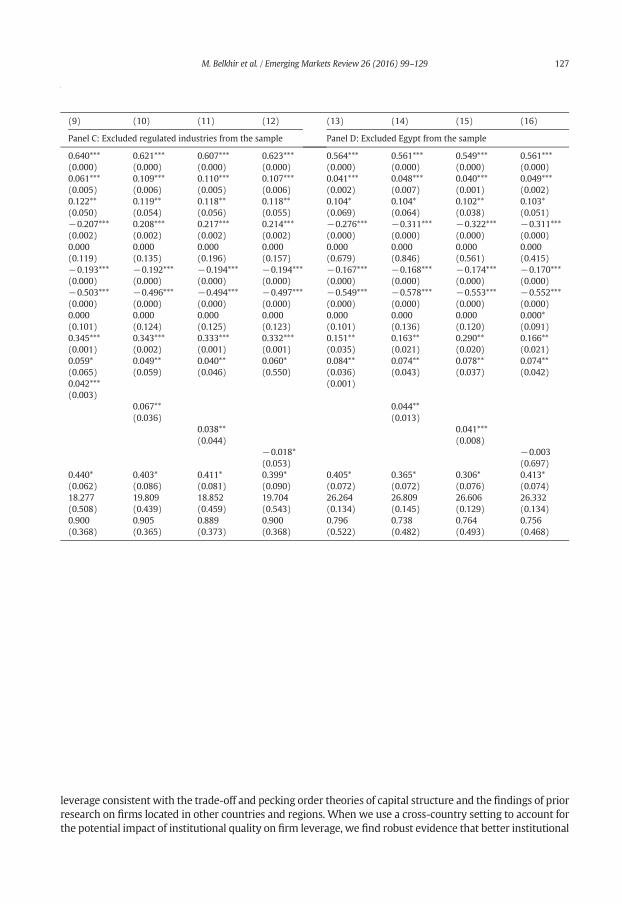
In columns (4) and (10), we estimate the impact of another measure of the institutional environment oncorporate leverage in theMENA region, namely regulatory effectiveness.We find that the coefficient estimateon RE loads positive and significant, suggesting that corporate leverage increaseswith the improvement in au-thorities' regulatory effectiveness and quality. The estimated coefficients on RE in columns (4) and (10) indi-cate that a one-unit increase in RE is associated with an increase in the book (market) leverage of nearly five(seven) percentage points. We next estimate the impact of the rule of law on corporate leverage. While thecoefficient on RL in column (5) is positive but insignificant, it is, however, positive and significant at the 1%level in column (11) indicating that market leverage increases in the strength of the rule of law. In otherwords, firms borrow more in countries where agents abide by the rule of law, property rights are betterprotected and contracts enforced more effectively. Economically, the coefficient estimate on RL in column(11) indicates that a-one unit increase in RL raises market leverage by 8.7%. Corruption control also appearsto play a significant role in determining corporate leverage in theMENA region; CORR appearswith a negativeand significant coefficient estimate in both columns (6) and (12), implying that more severe corruption(lower CORR) leads to greater borrowing by firms. This is consistent with the view that corruption can bean effective means for firms to get around regulations and stringent bank requirements related to collateral
Table 7Institutions and firm leverage in the MENA region.
Panel A: Book value of total debt ratio (BVD) Panel B: Market value of total debt ratio (MVD)
Debt (t-1) 0.557***(0.000)
0.571***(0.000)
0.569***(0.000)
0.571***(0.000)
0.559***(0.000)
0.572***(0.000)
0.315***(0.000)
0.326***(0.000)
0.345***(0.000)
0.330***(0.000)
0.305***(0.000)
0.289***(0.000)
SIZE 0.055***(0.000)
0.067***(0.000)
0.068***(0.000)
0.077***(0.000)
0.068***(0.000)
0.067***(0.000)
0.051***(0.000)
0.058***(0.000)
0.058***(0.000)
0.056***(0.000)
0.065***(0.002)
0.056***(0.000)
TANG 0.161**(0.035)
0.172*(0.083)
0.173*(0.077)
0.200**(0.022)
0.165**(0.047)
0.177**(0.038)
0.109*(0.081)
0.159*(0.057)
0.160**(0.050)
0.374**(0.042)
0.441**(0.045)
0.563**(0.035)
PROF −0.200***(0.000)
−0.200***(0.000)
−0.196***(0.000)
−0.196***(0.000)
−0.202***(0.000)
−0.200***(0.000)
−0.269***(0.000)
−0.213**(0.014)
−0.204**(0.020)
−0.224**(0.014)
−0.229***(0.007)
−0.247***(0.004)
TAX 0.001(0.462)
0.000(0.584)
0.000(0.596)
0.000(0.586)
0.000(0.601)
0.000(0.584)
0.004***(0.000)
0.004***(0.000)
0.005***(0.000)
0.004***(0.001)
0.004***(0.000)
0.004***(0.001)
Z-score −0.107***(0.000)
−0.108***(0.000)
−0.108***(0.000)
−0.107***(0.000)
−0.109***(0.000)
−0.108***(0.000)
−0.089***(0.000)
−0.081***(0.000)
−0.080***(0.000)
−0.083***(0.000)
−0.082***(0.000)
−0.085***(0.000)
LIQ −0.475***(0.000)
−0.460***(0.000)
−0.459***(0.000)
−0.470***(0.000)
−0.458***(0.000)
−0.460***(0.000)
−0.854***(0.000)
−0.901***(0.000)
−0.903***(0.000)
−0.912***(0.000)
−0.896***(0.001)
−0.892***(0.002)
Growth 0.000(0.214)
0.000(0.231)
0.000(0.255)
0.000(0.237)
0.000(0.221)
0.000(0.231)
−0.001***(0.000)
−0.001***(0.000)
−0.001***(0.000)
−0.001***(0.000)
−0.001***(0.001)
−0.001***(0.000)
RGDP 0.394***(0.000)
0.360***(0.000)
0.432***(0.000)
0.402***(0.000)
0.394***(0.000)
0.147**(0.020)
0.212*(0.082)
0.191(0.101)
0.134*(0.091)
0.136(0.228)
INF 0.057**(0.027)
0.065*(0.055)
0.072**(0.023)
0.076**(0.012)
0.057**(0.018)
0.285***(0.118)
0.272***(0.001)
0.302***(0.000)
0.335***(0.000)
0.304***(0.000)
FD0.028**(0.038)
0.017**(0.035)
RE0.055**(0.037)
0.071**(0.037)
RL0.031(0.169)
0.087***(0.006)
CORR−0.007*(0.082)
−0.077***(0.000)
Intercept 0.012(0.838)
0.074(0.274)
0.073(0.282)
0.122*(0.089)
0.083(0.220)
0.074*(0.274)
0.065(0.288)
0.053(0.388)
0.055(0.375)
0.058(0.348)
0.013(0.827)
0.086(0.156)
Sargan test 23.809(0.168)
19.376(0.115)
20.089(0.128)
19.893*(0.063)
17.588*(0.091)
19.561(0.120)
78.235(0.137)
76.266(0.151)
55.114(0.233)
72.095(0.185)
57.285(0.214)
75.465(0.149)
AR (2) test 0.575(0.564)
0.4753(0.634)
0.501(0.615)
0.483(0.628)
0.493(0.621)
0.474(0.635)
1.211(0.270)
1.754*(0.079)
1.455(0.145)
1.638(0.101)
1.650*(0.098)
1.375(0.169)
Notes: This table presents regression results offirm- country- and institutional specific determinants of debt ratio across countries. See Table 1 and for thedefinitionof the variables. Thedata set is a panel consists of3717firm-year observations representing444firms from10MENAcountries over theperiod2003–2011. The regressions are estimatedusing the two-step systemGMMestimator ofArellanoandBover (1995)andBlundell and Bond (1998)withWindmeijer (2005) small-sample correctionmethod. The t-2 lags of the variables used as instruments in the difference equation, and the same lags of differenced variables are usedin the levels equation. All models are estimatedwith a switched on clustering option and thus, the computed standard errors are robust to interdependence in cross country error terms. Numbers in parenthesesindicate p- values. All regressions includedummies to control for time, country, industry andfirmfixed effects. Sargan test is a test for the validityof instruments and is asymptotically distributed asχ2under thenullof valid instruments. If p-valueN0.05,we confirm the validity of instruments. AR (2) is a test for the second-order serial correlation and is asymptotically distributed asN(0,1) under thenull of no serial correlation. Ifp-value N0.05, we confirm of no serial correlation at order two in the first-differenced errors and the model is well specified. *, ** and *** indicate significance at the 10%, 5% and 1% levels, respectively.
and default risk, such as those prevalent inmanyMENA countries. This result is also consistentwith Fan et al.’s(2012) finding and view that “debt is expected to be used relatively more than equity when the public sectoris more corrupt, since it is easier to expropriate outside equity holders than debt holders”(p.27).
It is also worth noticing that including any of the institutional variables alters neither the statistical signif-icance nor the economic magnitude of the firm-level variables' effects on leverage. This suggests that institu-tional factors play a significant impact on corporate leverage over-and-above the impact of firm-level factors,and point to the importance of institutional quality in firms' financing decisions in the MENA region. Overall,further financial sector development, better rule of law, and more regulatory effectiveness seem to enhancefirms' access to external finance, in particular debt capital.
4.4. Additional tests: indirect impact of institutions
The results reported in Table 7 indicate that the quality of institutions has a direct impact on corporateleverage; in general, institutions of better quality lead firms to use more debt. In this section, we argue thatinstitutional quality has not only a direct impact on leverage, but also an indirect one. The latter worksthrough the impact of institutional quality on the way some firm-level factors affect leverage. Specifically,we conjecture that firm-size and collateral availability, which play a significant role in MENA firms' leveragedecisions, become less important in relatively better institutional and contractual environments. In predictingthe impact of firm size on leverage in MENA countries, we argued that larger firms are expected to use moredebt as they may have more of the connections and the reputational capital necessary to circumvent a weakinstitutional environment characterizing most MENA countries. However, as the quality of the institutionalenvironment improves, being a large firm may become less of an advantage to raise debt capital. In otherwords, in the presence of well-functioning institutions that secure property rights and guarantee abidanceby the rule of law and awell-developed financial system, creditorsmay become less reluctant to extend creditto smaller firms, thereby increasing the latters' borrowing capacity. We, therefore, expect better quality insti-tutions tomitigate the positive impact of size on corporate leverage. Likewise, we interpreted the strong pos-itive association between asset tangibility and leverage, reported in Tables 6 and 7, as a natural outcome of theunderdeveloped regulatory and contractual environment that characterizes most MENA countries; in an un-derdeveloped institutional framework, collateral is crucial to raising debt. Nevertheless, with improvementsin this framework, access to credit may become less contingent upon the availability of collateral. Hence, cor-porate leveragemay become less dependent on asset tangibility.We expect better institutional quality tomit-igate the positive impact of TANG on leverage.
To estimate the potential indirect impact of institutions on leverage, we re-estimate leverage models pre-sented in Table 7 augmented with interaction variables between the institutional quality measures and SIZEand between the institutional qualitymeasures and TANG. The results on the indirect impact of institutions onbook leverage through firm size are reported in Panel A of Table 8. Using market leverage yields qualitativelysimilar results.12 In column (1), we estimate the impact of financial development on the size-leverage relationby including an interaction variable between FD and SIZE in the leverage regression equation.While SIZE andFD continue to load positive and significant, the coefficient estimate on the interaction term is insignificant.This finding suggests that financial development has no impact on the way firm-size affects leverage; evenas the financial system develops further, larger firms continue to operate with relatively more leverage, pos-sibly due to their easier access to debt capital compared to smaller firms.
In column (2),we estimate the indirect impact of regulatory effectiveness on leverage by accounting for itspotential effect on the size-leverage relation. We find that not only the coefficient estimates on SIZE and REcontinue to load positive and significant, but also the coefficient estimate on the interaction term betweenSIZE and RE loads negative and significant, indicating that enhanced regulatory effectiveness attenuates theimpact of firm size on leverage. In column (3), we estimate the indirect impact of the rule of law on leverageby considering its potential effect on the size-leverage relation. The results indicate that only SIZE and RL arepositively associated to leverage. The coefficient estimate on the interaction term between SIZE and RL is,however, insignificant, implying that the rule of law plays only a direct impact on leverage. In column
12 These results are unreported for the sake of brevity, but are available from the authors upon request.
124 M. Belkhir et al. / Emerging Markets Review 26 (2016) 99–129
(4), we estimate the indirect impact of corruption on leverage by accounting for its potential effect on thesize-leverage relation. Our findings indicate that corruption has neither a direct nor an indirect effect onbook leverage. SIZE, however, continues to be positively and significantly associated with book leverage.
Table 8Indirect impact of institutions on book leverage (BVD).
Notes: This table presents regression results of how the interactions between institutional environments and firm size effect of debt ratioacross countries. See Table 1 and for the definition of the variables. The data set is a panel consists of 3717 firm-year observationsrepresenting 444 firms from 10 MENA countries over the period 2003–2011. The regressions are estimated using the two-step systemGMM estimator of Arellano and Bover (1995) and Blundell and Bond (1998) with Windmeijer (2005) small-sample correction method.The t-2 lags of the variables used as instruments in thedifference equation, and the same lags of differenced variables are used in the levelsequation. Allmodels are estimatedwith a switched on clustering option and thus, the computed standard errors are robust to interdepen-dence in cross country error terms. Numbers inNumbers in parentheses indicate p- values. All regressions include dummies to control fortime, country, industry and firm fixed effects. Sargan test is a test for the validity of instruments and is asymptotically distributed as χ2under the null of valid instruments. If p-value N0.05, we confirm the validity of instruments. AR (2) is a test for the second-order serialcorrelation and is asymptotically distributed as N(0,1) under the null of no serial correlation. If p-value N0.05, we confirm of no serial cor-relation at order two in the first-differenced errors and themodel iswell specified. *, ** and *** indicate significance at the 10%, 5% and 1%levels, respectively.
In panel B of Table 8, we report the results of the estimations of the indirect impact of institutions on bookleverage through asset tangibility. Again, unreported market leverage results are qualitatively the same. Incolumn (5), we find that FD and SIZE continue to be positively associated with leverage, whereas the interac-tion term between FD and TANGhas no significant impact on leverage. In column (6), we report a positive co-efficient estimate on RE as well as on TANG, and a negative coefficient estimate on the interaction termbetween RE and TANG. This finding suggests that more regulatory effectiveness mitigates firms' need formore collateral to be able to operate with higher leverage ratios. In column (7), we find that the rule of lawhas both direct and indirect impacts on firm leverage; the coefficient estimate on RL is positive and significantand the coefficient estimate on the interaction termbetweenRL and TANG is negative and significant. This im-plies that a stronger rule of law lowers the impact of asset tangibility on leverage. In column (8), we find thatthe interaction term between CORR and TANG is negative and significant, implying that as corruption dimin-ishes – higher CORR –, the impact of asset tangibility on firm leverage decreases. Notice also that the magni-tude and statistical significance of the direct impact of CORR has also increased relative to the specificationwith no interaction term, reported in column (6) of Table 7. The overall message from column (8) is thatwhile better corruption control lowers leverage it also reduces the impact of asset tangibility on leverage.
To summarize, the evidence in Tables 7 and 8 indicates that institutions in theMENA region have two typesof impacts on corporate leverage: a direct impact and an indirect one. The direct impact suggests that betterquality institutions, namely a more developed financial system, better regulatory effectiveness, and strongerrule of law, lead to the use of more debt by firms. The indirect impact suggests that better institutions also at-tenuate the impact of the way firm-level factors, namely size and assets tangibility, affect corporate leverage.
4.5. Robustness checks
In Table 9, we present additional tests intended to ensure the robustness of our results to alternativemeasures of leverage, tax shields, and sample composition. In panel A, we use the long-term debt ratio(LTDR) as our measure of leverage. A specific long-term debt ratio rather than a ratio of total debt may bethe target towards which firms attempt to adjust over time. Column (1)-(4) show that our conclusions onthe impact of our firm- and country-level variables on MENA firms' leverage continue to hold when we uselong-term debt rather than total debt as a measure of leverage. In panels B, C, and D of Table 9, we report re-sults based on BVD as a measure of financial leverage. Results – unreported for the sake of space – are quali-tatively the samewhenwe useMVD. In panel B, we use non-debt tax shields (TAX1)measured by the ratio ofdepreciation and amortization to total assets as an alternative to TAX. Using BVD as our dependent variable,we find that whereas TAX1 appears insignificant throughout columns (5) to (8), all other variables retaintheir initial signs and significance, indicating that using non-debt tax shields as an explanatory variabledoes not affect the robustness of our findings.
In panel C of Table 9, we followGraham et al. (2014) and exclude regulated industries – utilities and trans-portation companies – fromour sample. Results presented in columns (9) to (12) suggest that our conclusionsare not driven by the presence of regulated industries in our sample as we continue to report the same rela-tions between our firm- and country-level variables and financial leverage. In panel D,we exclude Egypt fromour sample to ensure that our results are not driven by the relatively heavy weight of Egyptian firms in oursample (22.5% of total observations). Results reported in columns (13) to (16) indicate that our conclusionsare not driven by the presence of Egypt in the Sample.
5. Conclusion
An increasing number of studies have been highlighting the importance of a country's institutional andcontractual framework to firms' capital structure decisions. In this paper, we investigate the state of firm le-verage in a region that has not been covered by prior research: the MENA region. We particularly focus ontwo issues: (1) whether firm-level factors – size, profitability, asset tangibility, growth, etc. – are associatedwith leverage as predicted bymajor capital structure theories, and in similar ways to the findings of previousresearchwork on other countries and regions, and (2)whether countries' institutional frameworks play a rolein firms' capital structure decisions.
Our findings suggest that MENA firms operate with leverage ratios which are not much different fromthose observed in countries from other parts of the world. Moreover, we document evidence that MENA
Notes: This table presents additional regression results of firm- country- and institutional specific determinants of debt ratio across coun-tries. See Table 1 and for the definition of the variables. In Panel A, models (1)-(4) replicate models (3)-(6) of Table 6 using Long-termdebt ratio (LTDR) as the dependent variable instead of Book value of total debt ratio (BVD). In thesemodels, the data set is a panel consistsof 3717 firm-year observations representing 444 firms from 10 MENA countries over the period 2003–2011. In Panel B, models (5)-(8) replicate models (3)-(6) of Table 6 using Non-debt tax shields (TAX1) as explanatory variable instead of debt tax shields (TAX). Inthese models, the data set is a panel consists of 3717 firm-year observations representing 444 firms from 10 MENA countries over theperiod 2003–2011. In Panel C, models (9)-(12) replicate models (3)-(6) of Table 6 excluded Egypt from the sample. In these models,the analysis ended with a sample contains 361 firms for a total of 3249 firm-year observations. In Panel D, models (13)-(16) replicatemodels (3)-(6) of Table 6 excluded regulated industries (Transportation and Utilities industries) from the sample. In these models, theanalysis ended with a sample contains 406 firms for a total of 3654 firm-year observations. The regressions are estimated using thetwo-step systemGMMestimator of Arellano and Bover (1995) and Blundell and Bond (1998)withWindmeijer (2005) small-sample cor-rectionmethod. The t-2 lags of the variables used as instruments in the difference equation, and the same lags of differenced variables areused in the levels equation. All models are estimated with a switched on clustering option and thus, the computed standard errors arerobust to interdependence in cross country error terms. Numbers in Numbers in parentheses indicate p-values. All regressions includedummies to control for time, country, industry and firm fixed effects. Sargan test is a test for the validity of instruments and is asymptot-ically distributed as χ2 under the null of valid instruments. If p-value N0.05, we confirm the validity of instruments. AR (2) is a test for thesecond-order serial correlation and is asymptotically distributed as N(0,1) under the null of no serial correlation. If p-value N0.05, we con-firm of no serial correlation at order two in the first-differenced errors and themodel is well specified. *, ** and *** indicate significance atthe 10%, 5% and 1% levels, respectively.
126 M. Belkhir et al. / Emerging Markets Review 26 (2016) 99–129
firms have target capital structures towards which they adjust partially over time. Yet, adjustment speedsvary from one country to another, possibly reflecting differences in institutional environments acrossMENA countries. We also find that size, asset tangibility, profitability, taxes, and growth are associated with
Table 9Robustness tests.
(9) (10) (11) (12) (13) (14) (15) (16)
Panel C: Excluded regulated industries from the sample Panel D: Excluded Egypt from the sample
leverage consistent with the trade-off and pecking order theories of capital structure and the findings of priorresearch on firms located in other countries and regions. When we use a cross-country setting to account forthe potential impact of institutional quality on firm leverage, we find robust evidence that better institutional
128 M. Belkhir et al. / Emerging Markets Review 26 (2016) 99–129
quality leads firms to use more debt. Specifically, firms operating in countries with relatively more developedfinancial systems, stronger rule of law, andmore regulatory effectiveness operatewith greater financial lever-age. More corruption also leads to greater leverage, possibly because it helps in overcoming hurdles, to accessto loans, due to deficient collateral and bankruptcy regimes that characterize most MENA countries.
Our findings add to the capital structure literature in two important ways. First, we enrich the growingcross-country capital structure body of research by presenting evidence from a geographical region that hasnot received attention in prior literature. This evidence suggests that a country's institutional quality mattersto corporate capital structure decisions. Second, we add to the literature that focuses on emergingmarkets byhighlighting the importance of improving developing countries' institutional environments for the sake ofbetter access to external finance by firms.
Acknowledgments
Weare grateful to SadokEl Ghoul, OmraneGuedhami, TâniaMontenegro, and two anonymous referees forvery useful comments on earlier version of this paper. Any remaining errors are our own.
World Bank (https://openknowledge.worldbank.org/handle/10986/3379 License: Creative Commons Attribution CC BY 3.0.”).Antoniou, A., Guney, Y., Paudyal, K., 2008. The determinants of capital structure: capital market-oriented versus bank-oriented institu-
tions. J. Financ. Quant. Anal. 43 (1), 59–92.Anzoategui, D., Piera, M.S., Rocha, R., 2010. Bank competition in themiddle east and north Africa region. Rev. Middle East Econ. Financ. 6 (2), 2.Araujo, A., Ferreira, R., Funchal, B., 2012. The Brazilian bankrupcy law experience. J. Corp. Financ. 18 (4), 994–1004.Arellano, M., Bover, O., 1995. Another look at the instrumental variable estimation of error-components models. Journal of econometrics
68 (1), 29–51.Baker, M., Wurgler, J., 2002. Market timing and capital structure. J. Financ. 57, 1–32.Bancel, F., Mittoo, U.R., 2004. Cross-country determinants of capital structure choice. A survey of European firms. Financ. Manag. 33,
103–132.Barnea, A., Haugen, A., Senbet, L., 1981. Market imperfections, agency problems, and capital structure: a review. Financ. Manag. 10 (3), 7–22.Ben Naceur, Omran, M., 2011. The effects of bank regulations, competition, and financial reforms on bank's performance. Emerg. Mark.
Rev. 12 (1), 1–20.Ben Naceur, S., Ghazouani, S., Omran, M., 2008. Does market liberalization spur financial and economic development in the MENA
region? J. Comp. Econ. 36 (4), 673–693.Blundell, R., Bond, S., 1998. Initial conditions and moment restrictions in dynamic panel data models. Journal of econometrics 87 (1),
115–143.Booth, L., Aivazian, V., Demirguc-Kunt, A., Maksomovic, V., 2001. Capital structure in developing countries. J. Financ. 56, 87–130.Bourgain, A., Pieretti, P., Zanaj, S., 2012. Financial openness, disclosure and bank risk-taking inMENA countries. Emerg. Mark. Rev. 13 (3),
283–300.Business, D., 2013. Doing Business 2013-Smarter Regulations for Small and Medium-Size Enterprises. The World Bank. Abgerufen am
29(04), p. 2013.Campbell, J.Y., 1996. Understanding risk and return. J. Polit. Econ. 104 (2), 298–345.Cespedes, J., Gonzalez, M., Molina, C.A., 2010. Ownership and capital structure in Latin America. J. Bus. Res. 63, 248–254.Chen, J.J., 2004. Determinants of capital structure of Chinese listed firms. J. Bus. Res. 57, 1341–1351.Cho, S., El Ghoul, S., Guedhami, O., Suh, J., 2014. Creditor rights and capital structure: evidence from international data. J. Corp. Financ. 25, 40–60.Creane, S., Goyal, R., Mushfiq, M., Sab, R., 2004. Financial sector development in the middle east and north Africa. IMF Working Paper
No.04/201. The International Monetary Fund, Washington, DC.De Jong, A., Kabir, R., Nguyen, T.T., 2008. Capital structure around the world: the roles of firm and country specific determinants. J. Bank.
Financ. 32, 1954–1969.Deesomak, R., Paudyal, K., Pescetto, G., 2004. The determinants of capital structure: evidence from the Asia Pacific region. J. Multinatl.
Financ. Manag. 14, 387–405.Demirguc-Kunt, A., Levine, R., 1999. Bank-Based or Market-Based Financial Systems: Cross-Country Comparisons. Policy Research
Working Paper 2143. World Bank, Development Research Group, Washington, D.C.Demirguc-Kunt, A., Maksimovic, V., 1996. Stockmarket development and financing choices of firms.World Bank Econ. Rev. 10, 341–369.Denis, D.J., 2012. The persistent puzzle of corporate capital structure; current challenges and new directions. Financ. Rev. 47 (4), 631–643.Djankov, S., McLiesh, C., Shleifer, A., 2007. Private credit in 129 countries. J. Financ. Econ. 84, 299–329.Ebrahim, M., Girma, S., Shah, M., Williams, J., 2014. Dynamic capital structure and political patronage: the case of Malaysia. Int. Rev.
Financ. Anal. 31, 117–128.Fama, E.F., French, K.R., 2002. Testing tradeoff and pecking order predictions about dividends and debt. Rev. Financ. Stud. 15, 1–33.Fama, E.F., Jensen, M., 1983. The market for corporate control: the scientific evidence. J. Financ. Econ. 11, 5–50.Fan, J.P.H., Titman, S., Twite, G.J., 2012. An international comparison of capital structure and debt maturity choices. J. Financ. Quant. Anal.
47, 23–56.Flannery, M.J., Rangan, K.P., 2006. Partial adjustment toward target capital structures. J. Financ. Econ. 79, 469–506.
Flannery, M.J., Kwan, S.H., Nimalendran, M., 2013. The 2007–2009 financial crisis and bank opaqueness. Journal of Financial Intermedi-ation 22 (1), 55–84.
Frank, M.Z., Goyal, V.K., 2009. Capital structure decisions: which factors are reliably important? Financ. Manag. 38, 1–37.Getzmann, A., Lang, S., Spremann, K., 2014. Traget capital structure and adjustment speed in Asia. Asia-Pac. J. Financ. Stud. 43, 1–30.Graham, J.R., 2000. How big are the tax benefits of debt? J. Financ. 55 (5), 1901–1941.Graham, J., Leary, M., Roberts, M., 2014. A century of capital structure: the leveraging of corporate America. J. Financ. Econ. (forthcoming).Gungoraydinoglu, A., Öztekin, Ö, 2011. Firm-and country-level determinants of corporate leverage: Some new international evidence.
J. Corp. Financ. 17 (5), 1457–1474.Guyot, A., Lagoarde-Segot, T., Neaime, S., 2014. Foreign shocks and international cost of equity destabilization. Evidence from the MENA
region. Emerg. Mark. Rev. 18, 101–122.Harris, M., Raviv, A., 1991. The theory of capital structure. J. Financ. 46 (1), 297–355.Haselmann, R., Pistor, K., Vig, V., 2010. How law affects lending. Review of Financial Studies 23 (2), 549–580.Huang, R., Ritter, J.R., 2009. Testing theories of capital structure and estimating the speed of adjustment. J. Financ. Quant. Anal. 44 (2),
237–271.Jappelli, T., Pagano, M., 2002. Information sharing, lending and default: cross country evidence. J. Bank. Financ. 26 (10), 2017–2045.Jensen, M.C., 1986. Agency costs of free cash flows, corporate finance and takeovers. Am. Econ. Rev. 76, 323–339.Jensen,M.C.,Meckling,W.H., 1976. Theory of the firm:managerial behaviour, agency costs and ownership structure. J. Financ. Econ. 3, 305–360.Kayhan, A., Titman, S., 2007. Firms' histories and their capital structures. J. Financ. Econ. 83 (1), 1–32.Kurshev, A., Strebulaev, I.A., 2006. Firm Size and Capital Structure (unpublished manuscript).Leary, M., Roberts, M.R., 2005. Do firms re-balance their capital structures? J. Financ. 60, 2575–2619.Lemmon, M.L., Robert, M.R., Zender, J.F., 2008. Back to the beginning: persistence and cross-section of corporate capital structure.
J. Financ. 63, 1575–1608.Levine, R., 2002. Bank-based or market-based financial systems: which is better? J. Financ. Intermed. 11 (4), 398–428.Lockhart, G.B., 2010. Adjusting to Target Capital Structure: The Effect of Credit Lines. University of Nebraska-Lincoln, Discussion paper.Mackay, P., Phillips, G.M., 2005. How does industry affect firm financial structure? Rev. Financ. Stud. 18, 1433–1466.MacKie-Mason, J.K., 1990. Do taxes affect corporate financing decisions? J. Financ. 45, 1471–1493.Madeddu, O.S.C.A.R., 2010. The Status of Information Sharing and Credit Reporting Infrastructure in theMiddle East and North Africa Re-
gion. World Bank Financial Flagship Report Online. Available at: http://siteresourcesworldbank.org/INTMNAREGTOPPOVRED/Resources/MENAFIagshipCreditRepoIting12i20i10.pdf (accessed October 11, 201 1).
Miao, J., 2005. Optimal capital structure and industry dynamics. J. Financ. 60 (6), 2621–2659.Modigliani, F., Miller, M.H., 1958. The cost of capital, corporation finance and the theory of investment. Am. Econ. Rev. 261–297.Modigiliani, F., Miller, M.H., 1963. Corporate income taxes and the cost of capital: a correction. Am. Econ. Rev. 53 (3), 433–443.Morellec, E., 2001. Asset liquidity, capital structure and secured debt. J. Financ. Econ. 6 (2), 173–206.Myers, S.C., 1977. Determinants of corporate borrowings. J. Financ. Econ. 5 (2), 147–175.Myers, S.C., 1984. The capital structure puzzle. J. Financ. 39, 575–592.Myers, S.C., Majluf, N., 1984. Corporate financing and investment decisions when firms have information that investors do not have.
J. Financ. Econ. 13, 187–224.Myers, S., Rajan, R., 1998. The paradox of liquidity. Q. J. Econ. 113, 733–771.Ozkan, A., 2001. Determinants of capital structure and adjustment to long run target: evidence from UK company panel data. J. Bus.
Financ. Account. 28, 175–198.Oztekin, O., Flannery, M.J., 2012. Institutional determinants of capital structure adjustment speeds. J. Financ. Econ. 103, 88–112.Rajan, R.G., Zingales, L., 1995. What do we know about capital structure? Some evidence from international data. J. Financ. 50, 1421–1460.Rajan, R.G., Zingales, L., 1998. Financial dependence and growth. Am. Econ. Rev. 88, 559–586.Turk-Ariss, R., 2009. Competitive behavior in middle east and north Africa banking systems. Q. Rev. Econ. Financ. 49 (2), 693–710.Windmeijer, F., 2005. A finite sample correction for the variance of linear efficient two-step GMM estimators. Journal of econometrics
126 (1), 25–51.World Bank Group, 2012. Doing Business 2012. Doing Business in a More Transparent World. The International Bank for Reconstruction