40
1 Instruction Manual for Poka-Yoke PLUS Double Entry System Version 3.0.76 Written by Kimberly A. Barchard, Yevgeniya Verenikina, and Ernesto H. Bedoy May 20, 2016

1
Instruction Manual for
Poka-Yoke PLUS Double Entry System Version 3.0.76
Written by Kimberly A. Barchard,
Yevgeniya Verenikina, andErnesto H. Bedoy
May 20, 2016

2
Table of ContentsIntroduction..........................................................................................................................................3
References................................................................................................................................4Resources and Reference......................................................................................................................5Suggestions...........................................................................................................................................5Versions................................................................................................................................................6
Poka-Yoke Double Entry System.............................................................................................6Poka-Yoke PLUS Double Entry System..................................................................................6
Poka-Yoke PLUS Double Entry System..............................................................................................7Overview..................................................................................................................................7Sheets........................................................................................................................................7Limitations................................................................................................................................8Set up........................................................................................................................................8
Create New File............................................................................................................8Dimensions...................................................................................................................8Variables Labels...........................................................................................................8Minimum and Maximum Values..................................................................................9Specifying Exact Entries..............................................................................................9
Participant IDs........................................................................................................................10Data Entry...............................................................................................................................10
Shared File..................................................................................................................11Data Checking........................................................................................................................11Fixing the Errors on the “Check” Sheet.................................................................................12Fixing the Errors on the “Double Check” Sheet....................................................................13Problem-Solving.....................................................................................................................13Recovery.................................................................................................................................14Macros....................................................................................................................................16Refresh....................................................................................................................................17
Analyzing Your Data in Excel or SPSS.............................................................................................18Copying Your Data to a New Excel File................................................................................18Analyzing the Data in SPSS...................................................................................................18
Example..............................................................................................................................................19

3
Introduction
Data entry errors reduce reliability, power, and effect sizes (Barchard & Pace, 2011). In some cases, they can introduce outliers that completely invalidate statistical analyses (Barchard & Pace, 2011; Hoaglin & Velleman, 1995; Kruskal, 1960; Wilcox, 1998). Tukey (1977) recommends researchers use holistic methods such as histograms and frequency tables to check for outliers. However, most data entry errors are within the allowable range for the variables (Barchard & Pace, 2011; Barchard & Verenikina, 2013) and so would not be detectable with holistic methods. Moreover, in-range errors can still have drastic effects on statistical results (Barchard & Pace, 2011). Therefore, it is more effective to use entry-by-entry data checking methods.
There are three commonly used entry-by-entry data checking methods. One method is visual checking: visually comparing the data on the screen to the data on the piece of paper. Another method is read aloud: having one person read the data out loud while another person checks the data on the screen. The disadvantage of these two procedures is that there is no way to know if it has been done well. If the person who is doing the checking fails to see a mismatch, there is no evidence of this in the data file. The third method is to enter the data a second time, and make sure they agree. This is called double-entry, and this is the system used here. The advantage of double-entry is that it is easy to tell if the data match: There is a record of this in the data entry file itself. If the data entry person fails to catch a mismatch, their supervisor will see the error and can correct it. Empirical evidence shows that double entry is far superior to visual checking (Barchard & Pace, 2011; Barchard & Verenikina, 2013) and read aloud (Barchard & Verenikina, 2013; Johnson, Temple, Pearsons, Webster, 2009; Kawado, Hinotsu, Matsuyama, Yamaguchi, Hashimoto, & Ohashi, 2003). For example, read aloud and visual checking had more than 20 times as many errors as double entry (Barchard & Verenikina, 2013).
Because double entry is so accurate, researchers can be confident in data quality when using a wider variety of data entry procedures. First, double-entry allows researchers to delegate data entry to research assistants, saving valuable researcher time. Alternatively, if no research assistants are available, double-entry allows the researcher to enter data when they themselves are tired or inattentive. They do not need to enter data during their most productive time of the day; they can rely upon the double-entry system to catch their errors.
This file explains how to use the Poka-Yoke Data Entry System. “Poka-yoke” (pronounced POH-Ka YOH-Kay) means “mistake-proofing” in Japanese. This term originated with Shigeo Shingo (1986), who is considered the father of the modern Toyota production system. A Poka-yoke system either completely prevents incorrect parts from being made or makes detection of imperfections particularly easy. Applied to data entry, a Poka-yoke system would involve nearly perfect data checking, and would virtually eliminate the need for after-the-fact data cleaning.” (Barchard & Pace, 2008).
The Poka-Yoke Data Entry System has three advantages. First, it is easy to use. It requires no programming or special knowledge to set up the system for a particular dataset or to enter and check the data. Second, it can be set up quickly for any type of data. For each variable, just enter the labels and the minimum and maximum values, and you are ready to start entering data. Third, it is free. This system was written in Microsoft Excel 2013, which is a program that most researchers (and most research assistants) have easy access to. As later versions of Excel become available, it will be easy to save this file in the new version of Excel, and continue using this system.

4
References
Barchard, K. A., & Pace, L. A. (2008). Meeting the challenge of high quality data entry: A free double-entry system. International Journal of Services and Standards, 4(4),359-376. doi:10.1504/IJSS.2008.020053
Barchard, K. A., & Pace, L. A. (2011). Preventing human error: The impact of data entry methods on data accuracy and statistical results. Computers in Human Behavior, 27(5), 1834-1839.doi:10.1016/j.chb.2011.04.004
Barchard, K. A., & Verenikina Y. (2013). Improving data accuracy: Selecting the best data checking technique. Computers in Human Behavior, 29, 1917-1922. doi:10.1016/j.chb.2013.02.021
Hoaglin, D. C. & Velleman, P. F. (1995). A critical look at some analyses of major league baseball salaries. American Statistician, 49(3), 277-285. doi:0.1080/00031305.1995.10476165
Johnson, C. L., Temple, G. M., Pearsons, T. N., & Webster, T. D. (2009). An evaluation of data entry error and proofing methods for fisheries data. Transactions of the American Fisheries Society, 138, 593-601. doi:10.1577/T08-075.1
Kawado, M., Hinotsu, S., Matsuyama, Y., Yamaguchi, T., Hashimoto, S., & Ohashi, Y. (2003). A comparison of error detection rates between the reading aloud method and the double data entry method. Controlled Clinical Trials, 24(5), 560-569. doi:10.1016/S0197-2456(03)00089-8
Kruskal, W. H. (1960). Some remarks on wild observations. Technometrics, 2. doi:10.1080/ 00401706.1960.10489875 Available at http://www.tufts.edu/~gdallal/out.htm
Shingo, S. (1986) Zero Quality Control: Source Inspection and the Poka-yoke System, Portland, OR: Productivity Press.
Tukey, J. W. (1977). Exploratory data analysis. Reading, MA: Addison-Wesley.Wilcox, R. R. (1998). How many discoveries have been lost by ignoring modern statistical
methods? American Psychologist, 53(3), 300-314. doi:10.1037/0003-066X.53.3.300

5
Resources and Reference
This system has been designed to assist researchers in implementing high quality data entry. It incorporates double-entry, checking for mismatches, and checking for out-of-range values. For most research projects, all you need to do is follow the instructions given here, and you will be able to use this system for your data entry. However, if you want to understand how this program works or if you want to have greater flexibility in creating a data entry system that meets your needs, consult the following paper:
Barchard, K.A. & Pace, L.A. (2008). Meeting the challenge of high quality data entry: A free double-entry system. International Journal of Services and Standards, 4, 359-376. This paper is also available from Kim Barchard, Department of Psychology, University of Nevada, Las Vegas, 4505 S. Maryland Parkway, Las Vegas, NV, 89154-5030, [email protected]
If you use this double entry system for work that is later published, we would appreciate it if you would provide the following citation for the Poka-Yoke System:
Barchard, K. A., Bedoy, E. H., Verenikina, Y., & Pace, L. A. (2016, January). Poka-Yoke Double Entry System Version 3.0.75. Unpublished file for Excel 2013 that allows double entry, checking for mismatches, and checking for out-of-range values. Available at http://faculty.unlv.edu/barchard/doubleentry/ or from Kimberly A. Barchard, Department of Psychology, University of Nevada, Las Vegas, [email protected]
or this citation for the Poka-Yoke PLUS System:Barchard, K. A., Bedoy, E. H., Verenikina, Y., & Pace, L. A. (2016, January). Poka-Yoke PLUS Double Entry System Version 3.0.75. Unpublished file for Excel 2013 that allows double entry, double corrections, checking for mismatches, and checking for out-of-range values. Available at http://faculty.unlv.edu/barchard/doubleentry/ or from Kimberly A. Barchard, Department of Psychology, University of Nevada, Las Vegas, [email protected]
Suggestions
If you have any suggestions for improvements to either the data entry system or these instructions, please send them to Kimberly A. Barchard at [email protected]

6
Versions
There are two version of the Poka-Yoke System:
Poka-Yoke Double Entry System
Each data point is typed twice, on the “First Entry” and “Second Entry” sheets. Mismatches and out-of-range errors are highlighted on the “Check” sheet. The user corrects the highlighted values on the “Check” sheet by referring to the original paper data sheet. This “Check” sheet is the final data set.
This method of double entry is the industry standard for double entry, and is sufficient for most research projects.
Poka-Yoke PLUS Double Entry System
Like in the Poka-Yoke system, each data point is typed twice, on the “First Entry” and “Second Entry” sheets. Mismatches and out-of-range errors are highlighted on the “Check” sheet and again on the “Double Check” sheet. The user corrects the highlighted values on the “Check” sheet by referring to the original paper data sheet.
The Poka-Yoke PLUS system goes further. The user corrects the highlighted values again, on the “Double Check” sheet. The “Triple Check” sheet compares the “Check” and “Double Check” sheets. The “Triple Check” sheet highlights mismatches and out-of-range errors. The user corrects the highlighted values in the “Triple Check” sheet by referring to the original paper data sheet. This “Triple Check” sheet is the final data set.
The purpose of correcting the errors twice is to ensure that the corrections themselves are done correctly.
This method of double entry should be used when the accuracy of the data is particularly important, or when a greater number of data errors are expected.

7
Poka-Yoke PLUS Double Entry System
Overview
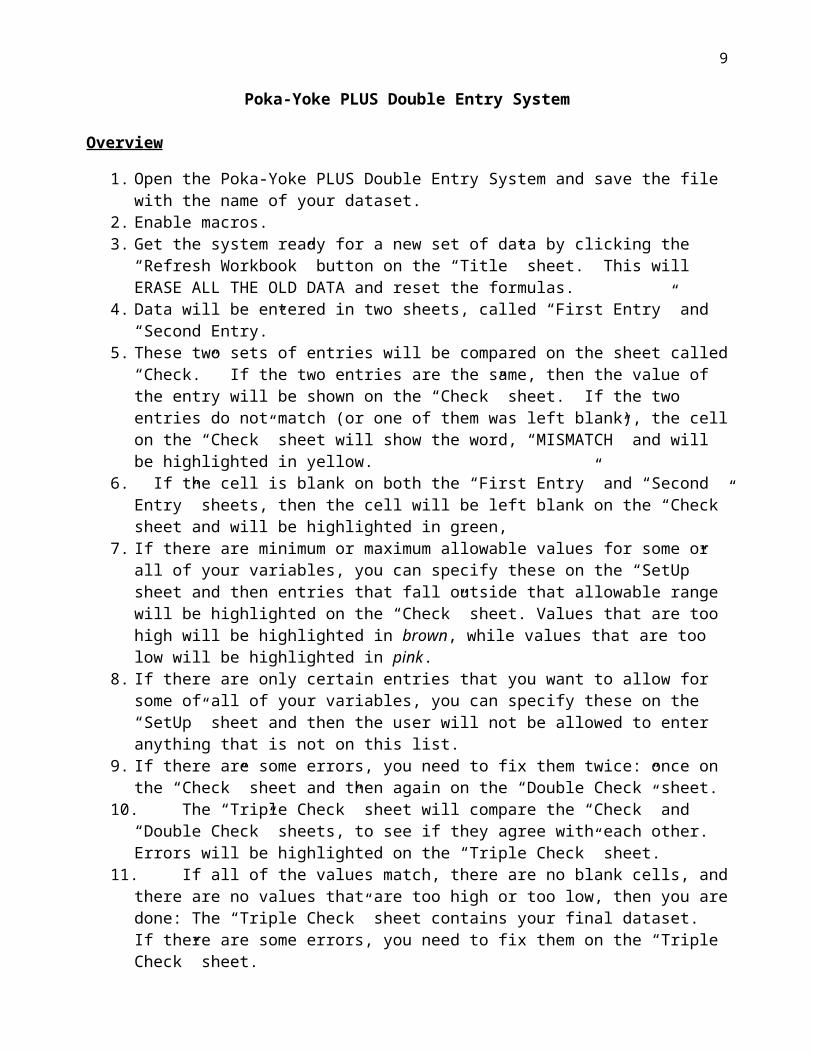
1. Open the Poka-Yoke PLUS Double Entry System and save the file with the name of your dataset.
2. Enable macros.3. Get the system ready for a new set of data by clicking the “Refresh Workbook” button on
the “Title” sheet. This will ERASE ALL THE OLD DATA and reset the formulas.4. Data will be entered in two sheets, called “First Entry” and “Second Entry.” 5. These two sets of entries will be compared on the sheet called “Check.” If the two entries
are the same, then the value of the entry will be shown on the “Check” sheet. If the two entries do not match (or one of them was left blank), the cell on the “Check” sheet will show the word, “MISMATCH” and will be highlighted in yellow.
6. If the cell is blank on both the “First Entry” and “Second Entry” sheets, then the cell will be left blank on the “Check” sheet and will be highlighted in green,
7. If there are minimum or maximum allowable values for some or all of your variables, you can specify these on the “SetUp” sheet and then entries that fall outside that allowable range will be highlighted on the “Check” sheet. Values that are too high will be highlighted in brown, while values that are too low will be highlighted in pink.
8. If there are only certain entries that you want to allow for some of all of your variables, you can specify these on the “SetUp” sheet and then the user will not be allowed to enter anything that is not on this list.
9. If there are some errors, you need to fix them twice: once on the “Check” sheet and then again on the “Double Check” sheet.
10. The “Triple Check” sheet will compare the “Check” and “Double Check” sheets, to see if they agree with each other. Errors will be highlighted on the “Triple Check” sheet.
11. If all of the values match, there are no blank cells, and there are no values that are too high or too low, then you are done: The “Triple Check” sheet contains your final dataset. If there are some errors, you need to fix them on the “Triple Check” sheet.
12. Thus, if the data are entered perfectly on the “First Entry” and “Second Entry” sheets, then the “Check” Sheet contains your final data. But if there were errors, you must fix those errors twice and then the “Triple Check” sheet now contains your final data.
Sheets
Set Up This is where you will specify the names of the variables and any limits on their possible values.
First Entry This is where data will be entered the first time.Second Entry This is where data will be entered the second time.Summary This sheet summarizes the errors on the “Check” sheet.Check This sheet compares the “First Entry” and “Second Entry” sheets to
identify mismatches and out-of-range values. You will fix errors here.Double Check This sheet compares the “First Entry” and “Second Entry” sheets
AGAIN to identify mismatches and out-of-range values. You will fix errors here AGAIN.
Triple Check This sheet compares the “Check” and “Double Check” sheets to identify mismatches and out-of-range values. You will fix errors here.
Triple Check Summary This sheet summarizes the errors on the “Triple Check” sheet.

8
Limitations
1. This version of the Poka-Yoke Double Entry System was designed for Microsoft Excel 2010 or Excel 2013. You can use it with Excel 2007, but it will not provide highlighting to indicate the location of out-of-range values and the allowable entries function will not work.
2. This version of the Poka-Yoke Double Entry System does not allow users to insert or delete columns. If you do so, this will destroy the Data Validation function and may make it impossible to enter data. If you discover that some columns are in the wrong locations, you can copy the data to another file, rearrange the columns, and then use Paste Special, Values Only, to put the data back into the Poka-Yoke file.
Set up
Create New File1. Open the Poka-Yoke PLUS Double Entry System and save the file with the name of your
dataset. 2. Excel will warn you that macros have been disabled. Click “Enable Content”. See the
Macros section below if you need more information.3. Refresh the system by clicking the “Refresh” button on the “Title” sheet.
a. Note: You MUST Refresh the system when you start a new dataset, because the process of checking data results in changes to the file itself. If you re-use a file and simply delete the previous data (perhaps by Refreshing the “First Entry” and “Second Entry” sheets), the system will not detect all errors. You absolutely MUST Refresh the “Check,” “Double Check,” and “Triple Check” sheets, and it is wise to Refresh the entire system.
b. If you want to use the same “Setup” information as you had on a previous dataset, you can copy that information into the “Setup” sheet.
Dimensions1. The Poka-Yoke PLUS Double Entry System has been designed for 100 variables and 300
participants. 2. If you have more than 100 variables or more than 300 participants, divide your data entry
into two or more files.
Variables Labels1. Create a list of the measures that will be entered. Decide what order they will be entered in.2. For each measure, create a short abbreviation of the name. For example, the Emotion
Management Scale might be abbreviated EM. If you plan to analyze your data in SPSS, do not put any spaces in the abbreviation, and start your abbreviation with a letter (not a number or symbol). See the hint box below for more suggestions.
3. For each measure, count the number of items.4. Set up the data entry on the “First Entry” sheet. The variable labels will be given on the first
row. The first cell (cell A1) names the variable that is used to identify the person who is doing the data entry. Here it is called “Enterer,” but you can change that to “RA” or “YOUR name” if you like. The next cell, (cell B1) names the variable that is used to identify the participant: Here it is called “ID,” but you can change that to “Participant ID,” or “Participant Name,” if you like. After these, enter the labels of the other variables in the first row.
9
Hint
There are two ways to create the variable labels:Method 1: Type each of the labels by hand.Method 2: Use the mouse to automatically fill in the labels. This method will work well if
all the labels have the scale abbreviation, followed by the item number (e.g., EM1, EM2, EM3, etc.). Here's how to set up labels automatically. Type the first two labels in cells C1 and D1. Then select cells C1 and D1. Notice that there is a tiny little square box at the bottom right hand corner of cell D1. When you hover the mouse over this little box, it turns into a black "plus sign". Click and hold the mouse, while pulling right. This will create all of the appropriate variable labels for the other variables.
Minimum and Maximum Values1. Some or all of your variables may have minimum or maximum values. If so, it may be
helpful if out-of-range values are highlighted. To specify the minimum and maximum values, switch to the “Set Up” sheet.
2. The first row shows the names of your variables. They have been automatically copied into the first row.
3. In the second row, type the minimum allowable value for each variable. For example, if values range from 1 to 5, the minimum value is 1.
4. In the third row, type the maximum allowable values. For example, if values range from 1 to 5, the maximum value is 5.
5. If some of your variables do not have minimum or maximum values, leave those cells blank.6. You can change minimum and maximum values later, if desired.
Examples
Agreement scale that ranges from -10 to 10: Set the minimum value to -10 and the maximum value to 10.
Frequency scale that ranges from 1 to 7: Set the minimum value as 1 and the maximum value as 7.
Math test where participants could plausibly give any positive number as their answer: Set the minimum value to 0 (or 1) and leave the maximum value blank.
ID values that between 1001 and 1227: Set the minimum value to 1001 and the maximum value to 1227.
ID values that are always three digits: Set the minimum value to 100 and the maximum value to 999.
Letters and words: Leave the minimum and maximum values blank.
Specifying Allowable Entries1. For some of your variables, there may be only a short list of allowable entries. If so, it may
be helpful to prevent anyone from entering anything that is not on that list.2. For each relevant variable, you can specify the allowable entries on the “Set Up” sheet,
starting in row 10.3. When someone is entering data, Poka-Yoke will prevent them from entering anything that
isn’t on the allowable list. Note that spaces count (“ male” and “male ” and “male” are all considered different) and differences in capitalization count (“Male” and “male” are considered different.)

10
4. If you are going to use this feature, you should set up the list of allowable entries before anyone does any data entry. This feature does not erase, highlight, or count non-listed entries after the fact.
5. You can add to or subtract from the list of allowable entries, after data entry has begun (for example, if you find that some of your participants speak another language).
6. Usually, you will specify either maximum and minimum values or allowable entries, not both. However, there may be situations where you want to specify both. For example, for the variable age, you might want to force the user to type whole numbers (and so set allowable entries to numbers between 1 and 100). This would prevent the user from typing 19.5 and nineteen. But if your study used undergraduates, you might want to set min to 18 and max to 30 so that high and low values get flagged. This would allow you to check extreme values without disallowing them.
Examples
Sex, recorded as Male, FemaleSex, recorded as M, FSex, recorded as 0, 1Likert-type responses, recorded as 1, 2, 3, 4, 5Likert-type responses, recorded as Strongly Agree, Agree, Neutral, Disagree,
Strongly DisagreeLikert-type responses, recorded as SA, A, N, D, SDMultiple-choice item, recorded as a, b, c, dFrequency sale, recorded as 1, 2, 3, 4, 5, 6, 7Agreement scale, recorded as -10, -9, -8, -7, -6, -5, -4, -3, -2, -1, 0, 1, 2, 3, 4, 5, 6, 7,
8, 9, 10IDs, recorded as 101, 102, 103, 104, … 215 (there is no limit to the number of values
you specify as acceptable)Language, recorded as English, Spanish, French, Farsi (you can add more languages
to the list later)
Participant IDs
1. Every participant MUST be given an ID in column C of the “First Entry” and “Second Entry” sheets. The IDs can be numbers or letters.
2. You can enter all IDs when you first set up the data set, or you can enter the IDs one at a time, while you enter data.
3. IDs are used to count the number of participants, and are an integral part of the data checking. If your participants do not have IDs, enter the row number in this column, so that the Poka-Yoke PLUS Double Entry System can count your participants correctly.
Data Entry
1. Enter all data in the sheet called “First Entry.” See the hint box below.2. Enter all data in the sheet called “Second Entry.” 3. Ideally, a different person will enter the data in the “Second Entry” sheet. If one person
must do both sets of entry, it is best if they complete all data entry for the “First Entry” sheet first, and then they do all data entry for the “Second Entry” sheet. Ideally, these entries

11
should be done on different days, or even different weeks. This way, they are less likely to remember what the data were from the first set of entries.
4. If you have already started data entry in another file (in either Excel or SPSS), you can copy that data into this file. First, make sure that the items in the previous data entry file include one row for each person and one column for each variable. Next, copy and paste the data into the sheet called "First Entry", using Paste Special, Values only. It is essential that you only paste the values. If you use Ctrl-V to paste everything that is in those cells, this may mess up Data Validation and prevent you from entering data. After you’ve pasted the old data into “First Entry”, you can complete the "Second Entry" for each participant, and you will know that it was entered correctly.
Hints
If you are entering numerical data, then we recommend that you hold the questionnaire in your left hand, and enter numbers on the numeric keypad using your right hand. You can use your thumb to hit the right arrow key to advance to the next cell.
As you scroll down in the worksheets, you will notice that they have been divided into four parts. The top part has the column headings (which tell you which column you are in), the left part tells you the ID number, and the bottom right part has the data itself. We used the Freeze Pane function to do this. The reason we set up the sheets this way is so that you will still be able to see the column headings, even when you have entered hundreds of rows of data.
We recommend that you ask research assistants to do your data entry. Although it is certainly possible to do the data entry yourself, it is more efficient to ask a research assistant to do it instead, and it is easy for you to check the work your research assistants are doing. You may want to try entering two or three participants yourself, first, to make sure that the file is set up correctly, and so that you can answer any questions that your research assistants have.
Shared File
1. You may want multiple people to enter data simultaneously. There are two ways to do this.a. First, you can store the file on a server that can be accessed from multiple terminals,
and save the file as a Shared Workbook. To designate this file as a Shared Workbook, in Excel 2013 click on the Review tab. In the Changes panel, click “Share Workbook”. Check the box that says “Allow changes by more than one user at the same time. This also allows workbook merging.”
b. Second, you can label your variables in the “First Entry “sheet, and then save two copies of the file. Ask one person to enter data in the “First Entry” sheet of one file, and ask another person to enter data into the “Second Entry “sheet of the other file. When data entry is finished, copy the data from the second file into the “Second Entry” sheet of the first file. Then use the regular instructions to check that the data match.

12
Data Checking
1. When all data entry is finished, click on the “Summary” Sheet. It will tell you six things: a. How many participants you have. b. How many variables you have (including ID and the name of the Enterer). c. How many of the entries disagree between the “First Entry” and “Second Entry”
sheets. d. How many of the entries were left blank on both the “First Entry” and “Second
Entry” sheets.e. How many of the entries in the “Check” sheet are too low (smaller than the
minimum allowable value). f. How many of the entries in the “Check” sheet are too high (larger than the maximum
allowable value). 2. Check that the number of participants is correct. If it isn’t, examine the IDs on the “First
Entry” sheet and the “Second Entry” sheet. The number of participants should be exactly 1 less than the number of rows that have data in them on the “First Entry” and “Second Entry” sheets, because the variable names take up one row. Fix any missing IDs and blank lines.
3. Check that the number of variables is correct. If you have a 10-item questionnaire, there should be 12 variables, because Poka-Yoke counts the Enterer (column A) and ID (column B) as 2 variables. If the number of variables is incorrect, examine the variable names in the first row of the “Set Up” sheet. Fix any missing variables names and blank columns.
4. Finally, check the Mismatches, Blanks, Too Low, and Too High summary variables. If all of these are 0, then your work is done. The “Triple Check” sheet now contains your final dataset.
5. If one or more of these summary values is non-zero, this means there are errors. You will need to fix these errors. To ensure the accuracy of your corrections, you will correct the data twice, first on the “Check” sheet, and then on the “Double Check” sheet.
Fixing the Errors on the “Check” Sheet
1. Click on the “Check” sheet to see the location of the errors. Errors will be highlighted.a. In each cell, if the two sets of entries disagree (or if one of the two entries was left
blank), the cell will be left blank. The cell will be highlighted in yellow, so that it is easy to see. See the hint box below for more information. You need to fix this error.
b. If the first and second entry are both blank, the cell will be left blank. The cell will be highlighted in green, so it is easy to see. You need to fix this error.
c. If the two sets of entries agree, that value will be shown.d. If you specified minimum or maximum values for some or all of the variables, then
values that are too high will be highlighted in brown, and values that are too low will be highlighted in pink. See the hint box below for more information. You need to fix these errors.
2. You will fix each of the errors, one at a time. a. In the “Check” sheet, find the first ID that has an error. b. Locate the paper data sheet for this ID. c. Type the correct value in the highlighted cell on the “Check” sheet. d. Indicate that you have corrected this cell by italicizing the entry. e. Then proceed to the next ID that has an error.

13
3. Once all errors have been fixed, examine the “Summary” sheet again. If the Mismatches, Blanks, Too Low, and Too High summary variables are all 0, then your work is done. If not, examine the “Check” sheet more carefully, to locate and fix your remaining errors.
Hints
The “Check” sheet will highlight a cell in yellow if there are any differences between the two entries. Differences in spacing are considered mismatches. However, this version of Poka-Yoke is not case sensitive. Thus, “male” and “ male” and “male ” are all considered to be different, but “male”, “Male”, and “MALE” are all considered to be the same.
If two different people completed the first and second entries, as we recommend, then on the “Check” sheet, the column that gives their names will show the word, “DIFFERENT”, and will be highlighted blue. That is normal and does NOT indicate any mistakes. Now that you are checking the data, you can type YOUR name in the first column. Alternatively, you can leave it as it is.
If the two entries disagree, then the cell will show the word, “MISMATCH,” on the “Check” sheet. Therefore, if only one of the two entries was outside the allowable range (either too high or too low), this will be displayed as a “MISMATCH” on the “Check” sheet. In order for a value to be highlighted as too high or too low, the two entries must first match each other.
Fixing the Errors on the “Double Check” Sheet
1. Click on the “Double Check” sheet. Like the “Check” sheet, the “Double Check” sheet looks for errors on the “First Entry” and “Second Entry” sheets. Fix all of the errors on the “Double Check” sheet. Indicate that you have corrected each cell by italicizing or bolding the entry.
2. Ideally, a different person will correct the errors on the “Double Check” sheet. If this is not possible, then fix the errors on the “Check” and “Double Check” sheets on different days. In no case should you fix a particular error on the “Check” sheet and then switch to the “Double Check” sheet immediately to fix the error there: That would eliminate the benefit of fixing the errors twice.
3. Once all errors have been fixed on both the “Check” and “Double Check” sheets, look at the sheet named “Triple Check Summary” to determine if all errors have been fixed. If the Mismatches, Blanks, Too Low, and Too High summary variables are all 0, then the “Check” and “Double Check” sheets match and your work is done. The “Triple Check” sheet now contains your final dataset.
4. If the Mismatches, Blanks, Too Low, and Too High summary variables are NOT all 0, then examine the “Triple Check” sheet to locate the errors. Fix the errors on the “Triple Check” sheet. Indicate that you have corrected each cell by italicizing or bolding the entry. When you have fixed all errors, the “Triple Check” sheet will contain your final dataset.

14
Problem-Solving
1. All your data disappeared. Try scrolling to the left. The data sheets are divided into four quadrants. The top section shows the variables. The left section shows the IDs. The biggest section is the bottom right section. It contains all your data. If you have scrolled too far to the right, you may be past the last variable. Scroll left.
2. All your variable labels disappeared. Try scrolling up. The data sheets are divided into four quadrants. The top section shows the variable labels. Click inside this section, and scroll up. Then click inside the bottom right section, where your data are, and continue your work.
3. The “Summary” sheet says I have fewer variables than I actually do. Make sure all variables are labeled on the “Set Up” sheet. Poka-Yoke counts the number of variables you labeled on the “Set Up” sheet. This number is displayed on the “Summary” sheet. If you forget to label some (or all) of your variables, then the “Summary” sheet will display the wrong number. For example, if you label 3 variables, forget to label the next one, and then label 3 more variables, the “Summary” sheet will say there are 6 variables. To fix this error, put a variable label in every column on the “Set Up” sheet.
4. The “Summary” sheet says I have fewer participants than I actually do. Make sure that there are no blank rows on your “First Entry” and “Second Entry” sheets. The “Summary” sheet will not count rows if the entire row is blank for both the “First Entry” and “Second Entry” sheets.
5. Some of your variables do not appear on the “Check” sheet or the “Double Check” sheet. Make sure that all variables have labels on the “Set Up” sheet. Poka-Yoke counts the number of variables you labeled on the “Set Up” sheet. This number is displayed on the “Summary” sheet. If you forget to label some (or all) of your variables, then the “Summary” sheet will display the wrong number, and “Check” sheet will not display all variables. For example, if you label 3 variables, forget to label the next one, and then label 3 more variables, the “Summary” sheet will say there are 6 variables, and the “Check” sheet will display the FIRST 6 variables. To fix this error, put a variable label in every column on the “Set Up” sheet.
1. The Poka-Yoke Data Entry System is memory intensive. If your computer has less than 4G of RAM, the system may be a bit slow if you are working with a large data sheet. This can interfere with efficient data entry. To speed up the data entry, you can change the settings for Excel so that it only checks the data sheets when you save the file. To do this, click the File menu, click Options (near the bottom), click Formulas. In the Calculation Options section, change “Automatic” to “Manual”. Make sure the box for “Recalculate workbook before saving” is checked. Click OK. Once you have changed this setting, data entry should be very fast, because Excel is not checking your work as you go. The formulas will update only when the file is being saved. Remember to save the file when you do want to examine the Check and Summary sheets.
Recovery
1. We have tried to make the Poka-Yoke System robust. Nonetheless, it may be possible for you to accidentally destroy the error-checking ability of the Poka-Yoke sheets. If you do, you may be able to UNDO that action right away. Press Ctrl+Z to undo the last action. You can press Ctrl+Z repeatedly to undo several actions. If undo doesn’t work, you have two other methods of fixing your file.

15
2. If the problems only occur on the “Check,” “Double Check” or “Triple Check” sheet, you can Refresh that sheet to return it to its original state. For example, perhaps you forgot to Refresh the system before starting a new dataset or perhaps you were attempting to fix the errors on the “Check” sheet and you accidentally over-wrote other cells. Once you have Refreshed the “Check” sheet, it will compare the “First Entry” and “Second Entry” sheets to each other. You will be able to identify and correct any discrepancies between these sheets.
i. To Refresh the “Check,” “Double Check” or “Triple Check” sheet, click the Refresh button, which is located in column CZ, in row 1.
ii. Do NOT click any of the other Refresh buttons if you are trying to fix a dataset.
1. The “Refresh” button on the “Title” sheet will refresh every sheet in the workbook. It will erase all your data! Moreover, Ctrl+Z will NOT undo that action. It’s permanent!
2. If you Refresh the “First Entry” or “Second Entry” sheets, you will erase your data! Moreover, Ctrl+Z will NOT undo that action. It’s permanent!
iii. Once you have Refreshed the “Check” sheet, you will need to examine the “Check” and “Summary” sheets to identify and correct the errors that exist in the dataset.
3. You can recover your data by copying it to a new file.a. Open a blank version of the Poka-Yoke PLUS Double Entry System and save it with
the name of your dataset (give it a slightly different name from your corrupted file).b. Copy the data from the old file and paste it into the new file. c. You will need to copy three sheets.
i. For the First Entry sheet, you should copy only those cells that have data. Do not copy the first row (which is filled automatically by Poka-Yoke) and do not attempt to copy column A (which is hidden). Make sure you paste these data to the FIRST ENTRY sheet, and that the data end up in the correct cells (if the data are in columns B-F on your original sheet, they should be in columns B-F of your new sheet). .
ii. For the Second Entry sheet, you should copy only those cells that have data. Do not copy the first row (which is filled automatically by Poka-Yoke) and do not attempt to copy column A (which is hidden). Make sure you paste these data to the SECOND ENTRY sheet, and that the data end up in the correct cells (if the data are in columns B-F on your original sheet, they should be in columns B-F of your new sheet).
iii. For the “Set Up” sheet, you should copy all of the rows that you used. This includes the first three rows (with the variable labels, minimum and maximum values), and it also includes any rows (after row 10) that contain allowable entries. Make sure you paste these values to the “Set Up” sheet, and that the values end up in the correct cells (if the values are in columns B-F on your original sheet, they should be in columns B-F of your new sheet).
d. Once you have copied these sheets, you are ready to continue data entry and data checking in the new file.

16
Macros:
1. The Poka-Yoke Data Entry System uses Macros. They must be enabled in order for all of Poka-Yoke functions to work.
2. When you first open Poka-Yoke, Excel will show you a “Security Alert” informing you that macros have been disabled. Click “Enable Content”.
Refresh
Each worksheet, except for the “Summary” and “Triple Check Summary” sheets, has a Refresh button. The Refresh buttons return the sheets to their original states, before any data were entered or checked.
i. The “Refresh” button on the “Title” sheet will refresh every sheet in the workbook. This button is located in columns K and L, just to the right of the instructions.
ii. The “Refresh” button on the “First Entry” and “Second Entry” pages will erase the data on each of those sheets. These buttons are located at the top of the sheets, in column CZ. If you erase your data accidentally, undo that action by clicking Ctrl+Z.
iii. The “Refresh” button on the “Check” and “Double Check” sheets will return these sheets to their original states, in which they compare the “First Entry” and “Second Entry” sheets. If you have corrected any entries on the “Check” or “Double Check” sheet, those corrections will be erased. The Refresh button is located at the top of the “Check” and “Double Check” sheet, in column CZ. If you erase your corrections accidentally, undo that action by clicking Ctrl+Z.
iv. The “Refresh” button on the “Triple Check” sheet will return this sheet to its original state, in which it compares the “Check” and “Double Check” sheets. If you have corrected any entries on the “Triple Check” sheet, those corrections will be erased. The Refresh button is located at the top of the “Triple Check” sheet, in column CZ. If you erase your corrections accidentally, undo that action by clicking Ctrl+Z.

17
Analyzing Your Data in Excel or SPSS
Copying Your Data to a New Excel File
You need to copy and paste the final data from the “Triple Check” sheet to a new Excel sheet. This is important, because the Poka-Yoke PLUS Double Entry System uses formulas. To analyze the data, you need a dataset that contains only values. Therefore, use Paste Special, Values only. Do not use Ctrl-V to paste the data: this will copy the formulas, not the values.
You will not be able to copy the headings on row 1 from the “Triple Check” sheet. Instead, copy that row from the “Set Up” sheet.
Analyzing the Data in SPSS
If you want to analyze your data in SPSS, you must first copy and paste the data into a new Excel file, as described above. Then save and close the new Excel file. If you do not close the Excel file, then SPSS will not be willing to open that file.
Next, open SPSS. Click on File, Open, Data. Under "Files of type:", select "Excel (*.xls, *.xlsx, *.xlsm)". Browse to the location of your Excel data entry file and select the file. Click Open. Make sure that the box that says "Read variable names from the first row of data" is checked.
Scroll to the bottom of the dataset. There are likely to be almost 300 blank rows. If so, select those rows and click the Delete key.
Scroll to the right of the dataset. There are likely to be dozens of blank columns. If so, select those columns and click the Delete key.
Save your dataset.
Hints
Deleting variables can be tricky. SPSS will allow you to delete any variable that exists. When you are on the Data View tab, just select the column and press the delete key. But SPSS will not allow you to delete a variable that does not exist. These columns are headed by the word “var”. If you select several columns, some of which have blank data and some of which do not have a variable, SPSS will not do anything when you press the delete key (or when you select Edit, Clear). Therefore, when you are trying to delete variables, make sure that you only select the variables you want to delete. Do not select columns that are headed by the word “var”.
If you entered your data in multiple Excel files, import each Excel data file into SPSS separately and then merge the files: Use File / Merge Files.

18
Example
1. Along with these instructions, you should have received an example files for the Poka-Yoke Double Entry System. This file demonstrates how the systems can be used to enter the data on the next five pieces of paper.
2. To practice correcting errors using the example files, save these files with new file names, so that the original example files remain intact.
3. For the Poka-Yoke PLUS Double Entry System, notice the following:a. The “Title” sheet
i. Provides the version number, reference, and contact information.b. The “Set Up” sheet
i. Allows you to name all variables on row 1. These variable names will be automatically copied onto the other sheets.
ii. Allows you to specify minimum and maximum values, if applicable.1. IDs are six digit numbers, and so the minimum value is 0 and the
maximum value is 9999992. The text question about sex does not have minimum and maximum
values.3. Ages are expected to be 18 and higher, but less than 100.4. Reading and Writing use a scale from 1 to 10, and so these are the
minimum and maximum values.5. The number of cats, dogs, and birds cannot be a negative number.6. How much someone likes cats, birds, and dogs was rated using a scale
from -10 to +10, and so these are the minimum and maximum values.7. The multiple choice question about favorite color does not have
minimum and maximum values.8. The text question about favorite city does not have minimum and
maximum values.9. The eight items on the personality test use a scale from 1 to 5, and so
these are the minimum and maximum values.10. If you change the minimum and maximum values for some variables,
you will change which entries are highlighted on the “Check” sheet and how many entries are considered too high or too low on the “Summary” sheet.
11. If you erase the minimum and maximum values, this will erase some of the highlighting on the “Check” sheet and reduce the number of values considered too high or too low on the “Summary” sheet.
iii. Allows you to specify specific entries that are allowed.1. The Sex question only allows the responses “Male” and “Female”.2. The multiple choice question about favorite color only allows the
entries a, b, c, and d.3. If you add another allowable entry for one of these variables, then you
will be allowed to type that entry on the “First Entry” sheet. If you erase the allowable entries for these variables, you will be allowed to type anything for these variables.
c. The “First Entry” sheeti. This is where you will enter data the first time.

19
ii. The first two variables are Enterer and ID. These should be the first two variables in every dataset.
iii. If you have specified allowable entries on the “Set Up” sheet, you will not be allowed to enter anything else for those variables.
iv. This sheet uses Freeze Panes so that the variable names are always visible in the first row and so that the IDs are always visible in the first column.
d. The “Second Entry” sheeti. This is where you will enter data the second time. Ideally, the second entry
will be completed by a different person.ii. If you have specified allowable entries on the “Set Up” sheet, you will not be
allowed to enter anything else for those variables.e. When the data were entered in the “First Entry” and “Second Entry” sheets, there
were a few errors. These errors have been fixed on the “Check” sheet. Therefore, there is no highlighting on the “Check” sheet, and the “Summary” sheet says that there are 0 errors.
f. These errors have NOT yet been fixed on the “Double Check” sheet. Therefore, there is highlighting on the “Double Check” sheet that shows the locations of the five original errors.
g. The “Triple Check” sheet contains highlighting because it compares the “Check” and “Double Check” sheets. There are five errors on the “Double Check” sheet that have not yet been fixed, and so these are highlighted on the “Triple Check” sheet. Moreover, we introduced a new error when we were fixing the errors on the “Check” sheet. This new error is also highlighted on the “Triple Check” sheet.
h. The “Triple Check Summary” sheet says there are six errors on the “Triple Check” sheet. It also shows which variables contain errors: The variables with errors are highlighted.
i. To fix the errors, you should consult the attached pieces of paper and type the correct values into the highlighted cells on the “Triple Check” sheet. You should then look at the “Triple Check Summary” sheet to see if there are any additional errors.
j. After all errors have been fixed, the final dataset is the one on the “Triple Check” sheet.

20
Personality Study
ID: 382736
Background Information
Sex: MaleAge: 19
Write a number from 1-10 to indicate how comfortable you are in English:
Reading 8Writing 8
How many cats do you own? 2How many dogs do you own? 0How many birds do you own? 0
On a scale from -10 (dislike) to +10 (like), how much do you like each of the following:
Cats 7Dogs 0Birds -2
Which is your favorite color? ca. Redb. Bluec. Greend. Other
What is your favorite American city? New York
Personality Test
Please use the rating scale below to describe how accurately each statement describes you.
Very Inaccurate Moderately Inaccurate
Neutral Moderately Accurate
Very Accurate
1 2 3 4 5
1. Stick to the rules. 42. Love order and regularity. 53. Boast about my virtues. 24. Cheer people up. 35. Break my promises. 16. Like to tidy up. 47. Take charge. 58. Look at the bright side of life. 4

21
Personality Study
ID: 982638
Background Information
Sex: FemaleAge: 22
Write a number from 1-10 to indicate how comfortable you are in English:
Reading 9Writing 9
How many cats do you own? 1How many dogs do you own? 1How many birds do you own? 0
On a scale from -10 (dislike) to +10 (like), how much do you like each of the following:
Cats 6Dogs 8Birds 3
Which is your favorite color? aa. Redb. Bluec. Greend. Other
What is your favorite American city? San Diego
Personality Test
Please use the rating scale below to describe how accurately each statement describes you.
Very Inaccurate Moderately Inaccurate
Neutral Moderately Accurate
Very Accurate
1 2 3 4 5
1. Stick to the rules. 52. Love order and regularity. 43. Boast about my virtues. 14. Cheer people up. 45. Break my promises. 16. Like to tidy up. 37. Take charge. 28. Look at the bright side of life. 3

22
Personality Study
ID: 625899
Background Information
Sex: MaleAge: 20
Write a number from 1-10 to indicate how comfortable you are in English:
Reading 6Writing 5
How many cats do you own? 0How many dogs do you own? 0How many birds do you own? 5
On a scale from -10 (dislike) to +10 (like), how much do you like each of the following:
Cats 3Dogs 3Birds 9
Which is your favorite color? da. Redb. Bluec. Greend. Other
What is your favorite American city? San Francisco
Personality Test
Please use the rating scale below to describe how accurately each statement describes you.
Very Inaccurate Moderately Inaccurate
Neutral Moderately Accurate
Very Accurate
1 2 3 4 5
1. Stick to the rules. 32. Love order and regularity. 23. Boast about my virtues. 34. Cheer people up. 55. Break my promises. 26. Like to tidy up. 37. Take charge. 48. Look at the bright side of life. 4

23
Personality Study
ID: 438767
Background Information
Sex: MaleAge: 21
Write a number from 1-10 to indicate how comfortable you are in English:
Reading 10Writing 10
How many cats do you own? 0How many dogs do you own? 0How many birds do you own? 0
On a scale from -10 (dislike) to +10 (like), how much do you like each of the following:
Cats 4Dogs 7Birds 5
Which is your favorite color? aa. Redb. Bluec. Greend. Other
What is your favorite American city? Las Vegas
Personality Test
Please use the rating scale below to describe how accurately each statement describes you.
Very Inaccurate Moderately Inaccurate
Neutral Moderately Accurate
Very Accurate
1 2 3 4 5
1. Stick to the rules. 42. Love order and regularity. 33. Boast about my virtues. 34. Cheer people up. 55. Break my promises. 16. Like to tidy up. 47. Take charge. 48. Look at the bright side of life. 4

24
Personality Study
ID: 767431
Background Information
Sex: FemaleAge: 18
Write a number from 1-10 to indicate how comfortable you are in English:
Reading 9Writing 9
How many cats do you own? 1How many dogs do you own? 2How many birds do you own? 0
On a scale from -10 (dislike) to +10 (like), how much do you like each of the following:
Cats 8Dogs 8Birds 2
Which is your favorite color? ba. Redb. Bluec. Greend. Other
What is your favorite American city? Los Angeles
Personality Test
Please use the rating scale below to describe how accurately each statement describes you.
Very Inaccurate Moderately Inaccurate
Neutral Moderately Accurate
Very Accurate
1 2 3 4 5
1. Stick to the rules. 52. Love order and regularity. 53. Boast about my virtues. 24. Cheer people up. 45. Break my promises. 16. Like to tidy up. 57. Take charge. 38. Look at the bright side of life. 3


