Rapid Dispersant Effectiveness Monitoring Equipment for Oil Spill Response Xiubin Qi 1,* , Ian Helmond 2 , Emma Crooke 1 , Matthew Sherlock 3 , Andrew S. Ross 1 , Kenneth Lee 4 and Paul Irving 5 1 CSIRO Energy Flagship, Kensington, WA, Australia 2 Swansea, TAS, Australia 3 CSIRO Oceans and Atmosphere Flagship, Hobart, TAS, Australia 4 CSIRO Oceans and Atmosphere Flagship, Kensington, WA, Australia 5 The Australian Maritime Safety Authority, Canberra ACT, Australia * Corresponding author: [email protected]Abstract The project is a CSIRO (Commonwealth Scientific and Industrial Research Organisation) -AMSA (Australian Maritime Safety Authority) co-investment research project aiming to develop a readily and rapidly deployable dispersant effectiveness monitoring system. The deployment of the kit is part of the national offshore oil spill response plan. Through this project, we have successfully completed all major milestones, which included literature review, sensor design and manufacture, towed platform development, laboratory meso scale assessment of sensors and field trial of the first prototype. The commonly used SMART (Special Monitoring Applied Response Technologies) kit, which was previously deployed after the Montara and Deep Water Horizon incidents, relies on the response increase of one fluorometer channel to give a qualitative indication of oil dispersion. In comparison, the new monitoring kit we developed contains multiple channels of chemical sensors. It is capable of providing in situ monitoring of property change of chemically dispersed oil in addition to overall increase of dispersed oil in water and therefore can yield more quantitative assessment of oil dispersant effectiveness. The towed platform that the sensors are mounted on has the unique flexibility to be deployed in two different modes for fixed depth (~1 m) subsurface water monitoring and water column profiling respectively. 1 Introduction When oil enters the marine environment, it can further migrate to the water column and to the atmosphere through various paths: evaporation, sedimentation, dissolution and dispersion. Sea surface wave, current and chemical dispersant can all facilitate the dispersion of oil slicks and penetration into the water column. The percentage of oil which is transferred as small droplets into the water phase under specific conditions is defined as dispersant efficiency (DE). Generally, there are four categories of dispersant efficacy assessment methods: Laboratory bench scale test, such as the Swirling Flask method. It has evolved into different forms but the operating principles are similar, which generally involve adding the premixed oil/dispersant sample to a bottle half filled with seawater and introducing mixing energy and then setting the sample bottle aside to allow reformation of oil slick. Water samples are collected from the bottom and analyzed to quantify amount of oil dispersed in the water phase. It has its advantages of being quick, simple, and cost effective yet also has its intrinsic weakness of being incapable of mimicking field conditions. Laboratory meso scale testing such as the Mackay method, can control water temperature and simulate flow of surface air during oil dispersion process. It is very useful to study effect of 722 Qi, X, I. Helmond, E. Crooke, M. Sherlock, A.S. Ross, K. Lee, and P. Irving, Rapid Dispersant Effectiveness Monitoring Equipment for Oil Spill Response, Proceedings of the Thirty-Eighth AMOP Technical Seminar, Environment Canada, Ottawa, ON, pp. 722-734, 2015.
Transcript
Rapid Dispersant Effectiveness Monitoring Equipment for Oil Spill Response
Xiubin Qi1,*, Ian Helmond2, Emma Crooke1, Matthew Sherlock3, Andrew S. Ross1, Kenneth Lee4 and Paul Irving5
1CSIRO Energy Flagship, Kensington, WA, Australia 2Swansea, TAS, Australia
3CSIRO Oceans and Atmosphere Flagship, Hobart, TAS, Australia 4CSIRO Oceans and Atmosphere Flagship, Kensington, WA, Australia 5The Australian Maritime Safety Authority, Canberra ACT, Australia
The project is a CSIRO (Commonwealth Scientific and Industrial Research Organisation) -AMSA (Australian Maritime Safety Authority) co-investment research project aiming to develop a readily and rapidly deployable dispersant effectiveness monitoring system. The deployment of the kit is part of the national offshore oil spill response plan. Through this project, we have successfully completed all major milestones, which included literature review, sensor design and manufacture, towed platform development, laboratory meso scale assessment of sensors and field trial of the first prototype. The commonly used SMART (Special Monitoring Applied Response Technologies) kit, which was previously deployed after the Montara and Deep Water Horizon incidents, relies on the response increase of one fluorometer channel to give a qualitative indication of oil dispersion. In comparison, the new monitoring kit we developed contains multiple channels of chemical sensors. It is capable of providing in situ monitoring of property change of chemically dispersed oil in addition to overall increase of dispersed oil in water and therefore can yield more quantitative assessment of oil dispersant effectiveness. The towed platform that the sensors are mounted on has the unique flexibility to be deployed in two different modes for fixed depth (~1 m) subsurface water monitoring and water column profiling respectively. 1 Introduction When oil enters the marine environment, it can further migrate to the water column and to the atmosphere through various paths: evaporation, sedimentation, dissolution and dispersion. Sea surface wave, current and chemical dispersant can all facilitate the dispersion of oil slicks and penetration into the water column. The percentage of oil which is transferred as small droplets into the water phase under specific conditions is defined as dispersant efficiency (DE). Generally, there are four categories of dispersant efficacy assessment methods: Laboratory bench scale test, such as the Swirling Flask method. It has evolved into different forms but the operating principles are similar, which generally involve adding the premixed oil/dispersant sample to a bottle half filled with seawater and introducing mixing energy and then setting the sample bottle aside to allow reformation of oil slick. Water samples are collected from the bottom and analyzed to quantify amount of oil dispersed in the water phase. It has its advantages of being quick, simple, and cost effective yet also has its intrinsic weakness of being incapable of mimicking field conditions. Laboratory meso scale testing such as the Mackay method, can control water temperature and simulate flow of surface air during oil dispersion process. It is very useful to study effect of
722
Qi, X, I. Helmond, E. Crooke, M. Sherlock, A.S. Ross, K. Lee, and P. Irving, Rapid Dispersant Effectiveness Monitoring Equipment for Oil Spill Response, Proceedings of the Thirty-Eighth AMOP Technical Seminar, Environment Canada, Ottawa, ON, pp. 722-734, 2015.
weathering on dispersant efficacy. Large scale assessment conducted in a wave tank. The advantages of this method is that it can simulate and control various natural conditions such as wave, current, temperature, etc. for systematic study of oil dispersion process (Li et al., 2008; Li et al., 2009; Li et al., 2009). Field assessment of oil dispersion: In 1995, Lunel presented results on a dispersant test at sea (Lunel, 1995). It employed remote sensing, surface sampling, and continuous-flow fluorometry to determine the extent of the subsurface plume of dispersed oil. The experiment involved continuous controlled release of oil treated with dispersant to create a steady state plume of oil. This made it possible to conduct replicate measurement to quantify the dispersion process that varies over both space and time. 2 System Design Rationale All the above dispersant efficacy tests can yield useful information for predicting performance of a dispersant to a specific oil in the field. However none can replace field monitoring which provides direct and in situ confirmation of a dispersant's effectiveness. In the field, an open system, it is impossible to accurately measure DE as defined in the literature, so the term “Dispersant Effectiveness” is used instead. In order to choose an effective chemical dispersant, it is important to be able to quantify the dispersant effectiveness of different dispersants to the oil of interest. SMART (Special Monitoring of Applied Response Technologies) DE monitoring kit was developed for this purpose. It is composed of a Turner C3 fluorometer targeting crude oils and relies on its response increase to give a qualitative indication of oil dispersion. However when the amount of surface oil slick is unknown, one cannot only rely on the amplitude of enhanced fluorometer response to rank the dispersant effectiveness. Additional property information of dispersed oil can be indispensable in evaluating the dispersion effectiveness. Without overly complicating the design, we aim to capture multiple dimension of information associated with dispersed oil to extract both the overall increase in hydrocarbon concentration in water and changes of characteristic features of oils at various dispersed states. Sensor selection is based on systematic oil dispersion study from the literature: Bugden and Kepkay presented using EEMS (excitation–emission matrix spectroscopy) (Bugden et al., 2008; Kepkay et al., 2008) to study the changes of fluorescence fingerprints of a series of crude oils when chemically dispersed. It was discovered that well dispersed oil showed dramatic enhancement of fluorescence over the 455 nm bandwidth, possibly corresponding to >3 rings of polyaromatic hydrocarbons. The author recommended that the ratios between the intensity of 455nm emission and the intensity at 340 nm at 280 nm of excitation wavelength could be used for identifying and monitoring chemically dispersed oil in the ocean. Li reported using a particle analyzer to measure in situ oil droplet particle size distribution during the evaluation of natural and chemical dispersion efficiency of crude oils under different wave and current conditions (Li et al., 2011). An entropy grouping of the in situ dispersed oil droplet-size spectra has classified the multi-modal droplet-size distributions into different groups, and the grouped results can be correlated with different level of oil dispersion efficiency. Therefore, it is decided to incorporate a multi-channel fluorometer and a particle analyzer in the dispersant effectiveness monitoring kit. Each sensor has its advantages and disadvantages (Summarized in Table 1) and can offer complementary information on dispersed oil state. The fluorometer has three channels with custom filter settings detecting fluorescence light emitted
723
Qi, X, I. Helmond, E. Crooke, M. Sherlock, A.S. Ross, K. Lee, and P. Irving, Rapid Dispersant Effectiveness Monitoring Equipment for Oil Spill Response, Proceedings of the Thirty-Eighth AMOP Technical Seminar, Environment Canada, Ottawa, ON, pp. 722-734, 2015.
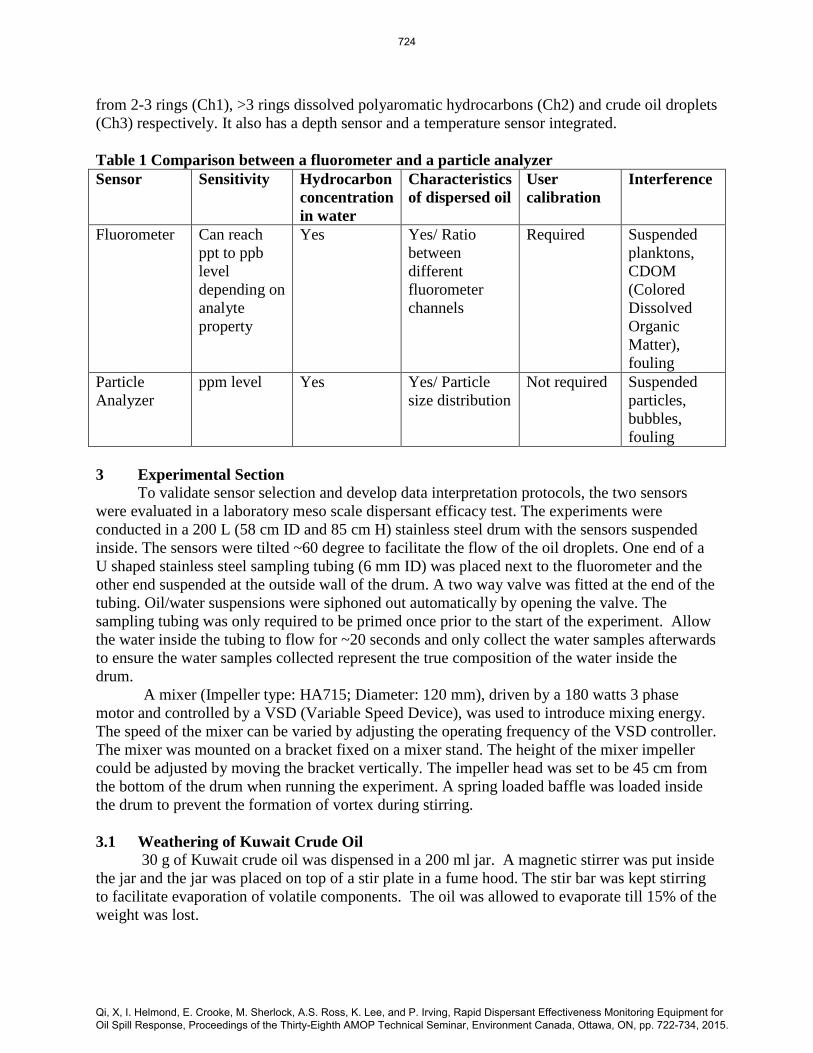
from 2-3 rings (Ch1), >3 rings dissolved polyaromatic hydrocarbons (Ch2) and crude oil droplets (Ch3) respectively. It also has a depth sensor and a temperature sensor integrated. Table 1 Comparison between a fluorometer and a particle analyzer Sensor Sensitivity Hydrocarbon
concentration in water
Characteristics of dispersed oil
User calibration
Interference
Fluorometer Can reach ppt to ppb level depending on analyte property
Yes Yes/ Ratio between different fluorometer channels
Not required Suspended particles, bubbles, fouling
3 Experimental Section To validate sensor selection and develop data interpretation protocols, the two sensors were evaluated in a laboratory meso scale dispersant efficacy test. The experiments were conducted in a 200 L (58 cm ID and 85 cm H) stainless steel drum with the sensors suspended inside. The sensors were tilted ~60 degree to facilitate the flow of the oil droplets. One end of a U shaped stainless steel sampling tubing (6 mm ID) was placed next to the fluorometer and the other end suspended at the outside wall of the drum. A two way valve was fitted at the end of the tubing. Oil/water suspensions were siphoned out automatically by opening the valve. The sampling tubing was only required to be primed once prior to the start of the experiment. Allow the water inside the tubing to flow for ~20 seconds and only collect the water samples afterwards to ensure the water samples collected represent the true composition of the water inside the drum. A mixer (Impeller type: HA715; Diameter: 120 mm), driven by a 180 watts 3 phase motor and controlled by a VSD (Variable Speed Device), was used to introduce mixing energy. The speed of the mixer can be varied by adjusting the operating frequency of the VSD controller. The mixer was mounted on a bracket fixed on a mixer stand. The height of the mixer impeller could be adjusted by moving the bracket vertically. The impeller head was set to be 45 cm from the bottom of the drum when running the experiment. A spring loaded baffle was loaded inside the drum to prevent the formation of vortex during stirring. 3.1 Weathering of Kuwait Crude Oil 30 g of Kuwait crude oil was dispensed in a 200 ml jar. A magnetic stirrer was put inside the jar and the jar was placed on top of a stir plate in a fume hood. The stir bar was kept stirring to facilitate evaporation of volatile components. The oil was allowed to evaporate till 15% of the weight was lost.
724
Qi, X, I. Helmond, E. Crooke, M. Sherlock, A.S. Ross, K. Lee, and P. Irving, Rapid Dispersant Effectiveness Monitoring Equipment for Oil Spill Response, Proceedings of the Thirty-Eighth AMOP Technical Seminar, Environment Canada, Ottawa, ON, pp. 722-734, 2015.
3.2 Preparation of Oil/Dispersant Stock Mixture 10 g of oil (Kuwait crude oil or IFO 180) was dispensed into a pre labelled 100 ml glass jar, 0.2 or 0.5 g of dispersant was added into it to prepare stock mixtures with 1:20 or 1:50 of DOR. A magnetic stir bar was placed in the jar and kept mixing the mixture for ~20 min to create stock mixers to be used in the serial addition experiment. 3.3 Serial Addition Experiment A total of 5 kg of NaCl (98%) was fully dissolved in ~30 L of deionized water and the salt water was then poured into the drum prefilled with 90 L of deionized water. The mixer controller's frequency was set to 10 Hz. The drum was filled up with deionized water to the 150 L marked line. The mixer was kept stirring for 20-30 min to make homogeneous salt solutions. To run a serial addition experiment, 0.5 g, 1.5 g, 1.5 g, 1.5 g of stock mixture were added in order with a syringe to the salt water under mixing. The mass of the syringe before and after mixture dispense was weighed to decide the actual mass of the stock mixture added to the drum. After each addition the solution was allowed to homogenize for 15 min before sample collection. To understand the effect of mixing energy change during oil dispersion, the speed of the mixer was varied. The detailed operating conditions were listed in Table 2. Table 2 Mixer setting during the serial addition experiment
Sampling point Total stock mixture added
Mixer VSD frequency (Corresponding mixing RPM)
1 0 9 Hz (180 RPM) 2 ~0.5 g 9 Hz (180 RPM) 3 ~2 g 9 Hz (180 RPM) 4 ~3.5 g 9 Hz (180 RPM) 5 ~3.5 g 15 Hz (340 RPM) 6 ~5 g 15 Hz (340 RPM) 7 ~5 g 9 Hz (180 RPM) 8 ~5 g 0 Hz (0 RPM)
3.4 Sample Collection 1 L of oil/water sample was collected in a dark amber glass bottle for TPH (C10-C36) analysis on a Varian 3900 GC/FID with a non-polar HP1 capillary column after extraction. 40 ml of oil/water sample was collected for BTEX and TPH (C6-C9) analysis on a HP 6890 GC/MS with a DB-624 column with initial column after purge and trap pretreatment. The results were combined to give TPH (C6-C36) concentration. 3.5 Cleaning After each experiment, the experimental setup and sensors was cleaned with absorbent pad (dust free), Decon solution and rinsed multiple times with deionized water. The sensor windows were cleaned with isopropanol. The sampling tubing was cleaned with deionized water, ethanol and then DCM (dichloromethane) to completely remove any oil residue left inside the tubing. 4 Results and Discussion In order to decide which channel can be used to better quantify the hydrocarbon content in
725
Qi, X, I. Helmond, E. Crooke, M. Sherlock, A.S. Ross, K. Lee, and P. Irving, Rapid Dispersant Effectiveness Monitoring Equipment for Oil Spill Response, Proceedings of the Thirty-Eighth AMOP Technical Seminar, Environment Canada, Ottawa, ON, pp. 722-734, 2015.
water, a correlation matrix was created between three sensor response variables, (Ch1, Ch2 and Ch3) and TPH for 1:20 DOR Kuwait oil (Figure 1). All sensor data were baseline corrected by subtracting the initial sensor response value. It is clearly demonstrated that among the three channels, Ch3 shows a higher correlation factor of 0.9006 and has the best linear correlation with TPH. It is least susceptible to variation of mixing energy and more sensitive to variation of TPH concentration than the other two channels. This can be explained by that the Ch3 mainly targets fluorescence light emitted from crude oil droplets instead of dissolved polyaromatic molecules, while oil droplets make most contribution to the total amount of hydrocarbons in water. There have been multiple examples of evaluation of commercial hydrocarbon sensors with different filter settings by varying oil dispersed oil concentration and monitoring the sensor responses (Conmy et al., 2014). The results usually show nearly perfect linearity for most sensors in the testing range with R2 close to 1. For all these assessment, the testing conditions were well controlled with constant level of mixing energy and the same oil at the same oil/dispersant ratio was used. While in our case, the mixing energy varied during the experiments.
Figure 1 Correlation matrix between Ch1, Ch2, Ch3 and TPH for DOR 1:20 Kuwait oil. It is worth noting that when the correlation matrix (not shown) for DOR 1:45 Kuwait
726
Qi, X, I. Helmond, E. Crooke, M. Sherlock, A.S. Ross, K. Lee, and P. Irving, Rapid Dispersant Effectiveness Monitoring Equipment for Oil Spill Response, Proceedings of the Thirty-Eighth AMOP Technical Seminar, Environment Canada, Ottawa, ON, pp. 722-734, 2015.
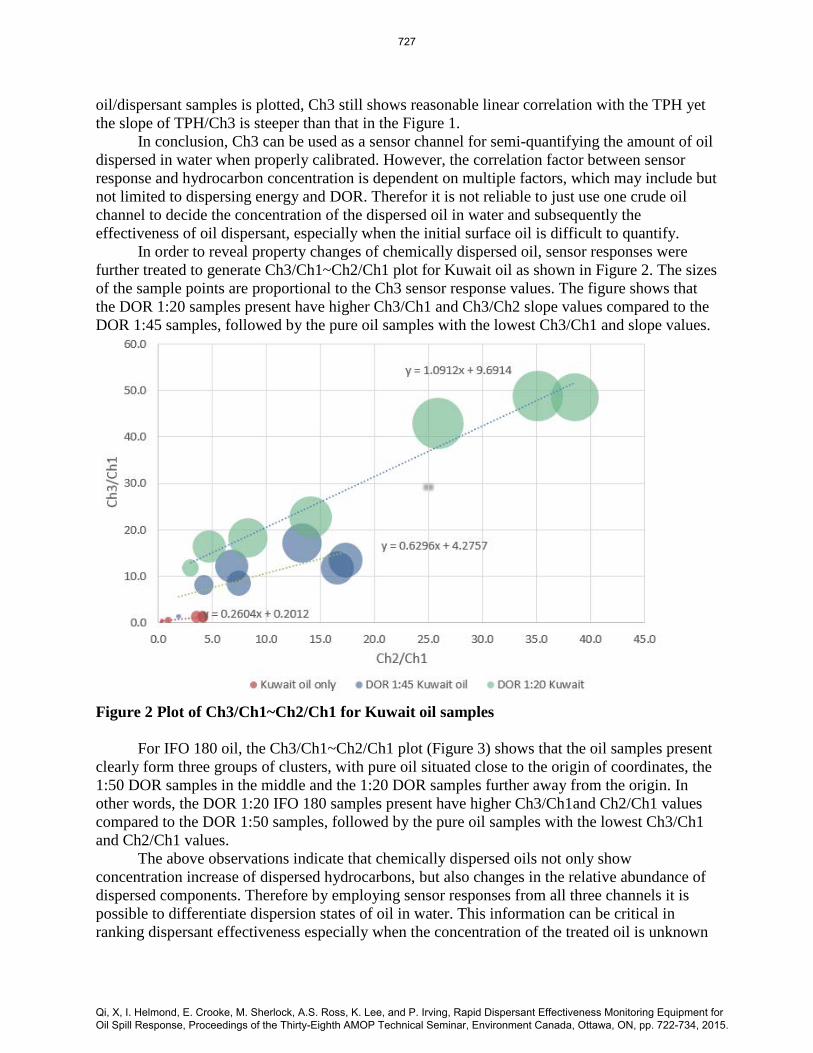
oil/dispersant samples is plotted, Ch3 still shows reasonable linear correlation with the TPH yet the slope of TPH/Ch3 is steeper than that in the Figure 1. In conclusion, Ch3 can be used as a sensor channel for semi-quantifying the amount of oil dispersed in water when properly calibrated. However, the correlation factor between sensor response and hydrocarbon concentration is dependent on multiple factors, which may include but not limited to dispersing energy and DOR. Therefor it is not reliable to just use one crude oil channel to decide the concentration of the dispersed oil in water and subsequently the effectiveness of oil dispersant, especially when the initial surface oil is difficult to quantify. In order to reveal property changes of chemically dispersed oil, sensor responses were further treated to generate Ch3/Ch1~Ch2/Ch1 plot for Kuwait oil as shown in Figure 2. The sizes of the sample points are proportional to the Ch3 sensor response values. The figure shows that the DOR 1:20 samples present have higher Ch3/Ch1 and Ch3/Ch2 slope values compared to the DOR 1:45 samples, followed by the pure oil samples with the lowest Ch3/Ch1 and slope values.
Figure 2 Plot of Ch3/Ch1~Ch2/Ch1 for Kuwait oil samples For IFO 180 oil, the Ch3/Ch1~Ch2/Ch1 plot (Figure 3) shows that the oil samples present clearly form three groups of clusters, with pure oil situated close to the origin of coordinates, the 1:50 DOR samples in the middle and the 1:20 DOR samples further away from the origin. In other words, the DOR 1:20 IFO 180 samples present have higher Ch3/Ch1and Ch2/Ch1 values compared to the DOR 1:50 samples, followed by the pure oil samples with the lowest Ch3/Ch1 and Ch2/Ch1 values. The above observations indicate that chemically dispersed oils not only show concentration increase of dispersed hydrocarbons, but also changes in the relative abundance of dispersed components. Therefore by employing sensor responses from all three channels it is possible to differentiate dispersion states of oil in water. This information can be critical in ranking dispersant effectiveness especially when the concentration of the treated oil is unknown
727
Qi, X, I. Helmond, E. Crooke, M. Sherlock, A.S. Ross, K. Lee, and P. Irving, Rapid Dispersant Effectiveness Monitoring Equipment for Oil Spill Response, Proceedings of the Thirty-Eighth AMOP Technical Seminar, Environment Canada, Ottawa, ON, pp. 722-734, 2015.
and one cannot only rely on the amplitude of enhanced fluorometer response to rank the dispersant effectiveness.
Figure 3 Plot of Ch3/Ch1~Ch2/Ch1 for IFO 180 oil samples The increase of sensor response in Ch3 can be due to a combination of causes: the overall increase of suspended oil droplets or/and the breakdown of larger droplets into smaller ones, which consequently increases the number of surface molecules accessible to emit fluorescence light. The particle size information can be very critical in predicting the stability of oil droplets as smaller oil droplets are more stable suspending in the water column rather than floating to water surface. A particle analyser can provide the particle size distribution information and in turn, total volume of suspended particles. Figure 4 shows the concentration for particles at different sizes detected by the particle analyzer at the end of each set of experiment for Kuwait oil (DOR 1:45 Kuwait oil, Pure Kuwait oil and DOR 1:20 Kuwait oil), at same load of oil and under the same mixing energy. It is illustrated that the total oil droplet volume concentration increases with increasing dispersant ratio. Figure 5 shows the histogram further normalized to unit area. The shape of the distribution histograms reveals that the pure oil sample forms large particles while the two chemically dispersed oil mixtures have particles extending to the smaller size range. The relative concentration of larger particles compared to smaller particles was also significantly reduced for the chemically dispersed samples. One disadvantage of a particle analyser is its relatively lower sensitivity and higher detection limit (ppm level) compared to a fluorometer (ppt to ppb level). In our meso scale experiment using the IFO 180 oil at variable DOR ratios, the particle analyzer only responded to the final addition of the DOR 1:20 IFO 180 stock mixture due to the low concentration of
728
Qi, X, I. Helmond, E. Crooke, M. Sherlock, A.S. Ross, K. Lee, and P. Irving, Rapid Dispersant Effectiveness Monitoring Equipment for Oil Spill Response, Proceedings of the Thirty-Eighth AMOP Technical Seminar, Environment Canada, Ottawa, ON, pp. 722-734, 2015.
suspended oil droplets in the drum when using the pure IFO 180 oil and the DOR 1:50 stock mixtures. Therefore it is impossible to compare the particle analyzer responses for the three IFO 180 experiments.
Figure 4 Particle size distribution histogram for Kuwait oil samples
Figure 5 Normalized particle size distribution curve for Kuwait oil samples
729
Qi, X, I. Helmond, E. Crooke, M. Sherlock, A.S. Ross, K. Lee, and P. Irving, Rapid Dispersant Effectiveness Monitoring Equipment for Oil Spill Response, Proceedings of the Thirty-Eighth AMOP Technical Seminar, Environment Canada, Ottawa, ON, pp. 722-734, 2015.
5 Deployment Platform Design and Construction Design of the deployment platform was based on field deployment report of the SMART kit during the Montana and GOM oil spill response surveys (Tan, 2011), to avoid or minimize operating issues encountered previously. A lot of instruments may perform extremely well in a controlled laboratory environment, however when operating in the field, which means being exposed to a wide variety of electromagnetic noise, bubbles, turbulence and ambient light interferences, data collected under this condition can be a real challenge to analyze or make meaningful interpretations. During a GOM (Gulf of Mexico) oil spill response survey, the responses of the Turner C3 sensor of the SMART monitoring kit showed several spikes. It was suggested that spikes were possibly due to sensor breaching sea surface rather than due to higher concentration of dispersed oil. Therefore careful considerations should be taken to design the deployment platform onto which the sensors are mounted.
The design criteria of our platform include the following requirements: 1. It keeps the mounted sensors away from the bow wave to minimize interference to sensors caused by bubbles and turbulence and avoids introducing artificial mixing energy to oil dispersion. 2. It allows the mounted sensors continuously monitoring water 1m below sea surface. 3. It should be lightweight, easy to handle, or disassembled into pieces <32 kg for transport by air if required. 4. It should be readily workable on small vessels, minimal requirement on vessel infrastructure such as boom or crane.
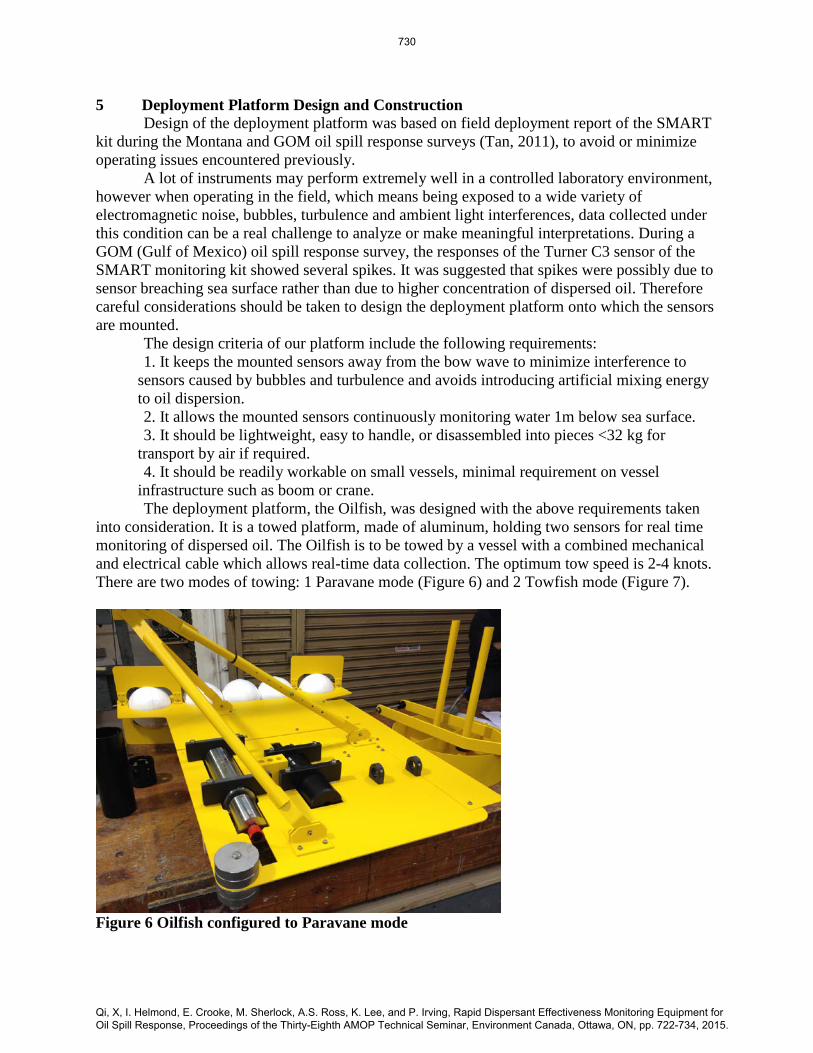
The deployment platform, the Oilfish, was designed with the above requirements taken into consideration. It is a towed platform, made of aluminum, holding two sensors for real time monitoring of dispersed oil. The Oilfish is to be towed by a vessel with a combined mechanical and electrical cable which allows real-time data collection. The optimum tow speed is 2-4 knots. There are two modes of towing: 1 Paravane mode (Figure 6) and 2 Towfish mode (Figure 7).
Figure 6 Oilfish configured to Paravane mode
730
Qi, X, I. Helmond, E. Crooke, M. Sherlock, A.S. Ross, K. Lee, and P. Irving, Rapid Dispersant Effectiveness Monitoring Equipment for Oil Spill Response, Proceedings of the Thirty-Eighth AMOP Technical Seminar, Environment Canada, Ottawa, ON, pp. 722-734, 2015.
Figure 7 Oilfish configured to Towfish mode In the Paravane mode, Oilfish is configured to be towed from the starboard side of the vessel, clear of vessel-induced mixing. The instrument mounting plate is attached to the float plate. This sets the instrument measuring depth to 1 m below the surface as defined by the floats. The 3 arm towing frame provides a tow cable attachment point that allows an adjustable angle of attack. This should be set to give an angle of attack of approximately 5 degrees. The towing frame is set for the vertical angle of the tow cable to be 15 degrees when Oilfish is vertical in the water. For a tow cable length of 8 m this angle is produced with a cable attachment point of 1.5 m above sea level on the vessel, e.g. attached to the gunnel. A cable length of 5 m corresponds to an attachment height of 1 m. This angle is not critical, but arranging the tow cable length and height of attachment point to keep Oilfish approximately vertical will keep the fish on the surface over a range of speeds. Departure from the vertical will cause a small vertical component of the predominately horizontal lift force to be produced, either up or down depending on the direction of the angle of departure. In the Towfish mode, Oilfish is towed behind the vessel at a depth determined by the vessel speed and the length of cable paid out. It should be deployed deep enough to clear the vessel-induced mixing in the wake. Alternatively it could be towed from a boom out the side of the vessel. The tailfin, towing bridle and balance weights are attached to the instrument mounting plate. The balance weight should be sufficient to cause the fish to sit approximately horizontal when immersed in water with the vessel stationary. This takes 4 stainless steel weights in the present configuration. The measuring depth can be determined with the depth sensor in the fluorometer, which needs to be adjusted to zero when Oilfish is on deck. 6 Field Trials The Oil fish underwent two sea trials following the construction of the first prototype. During the first trial on board the South Cape, a 1500W inverter hooked to a car battery was used to provide 220V of power to the laptop and two sensors. In order to test the platform with sensors running in live, power/data cables connected to the sensors are cable tied to a spectra
731
Qi, X, I. Helmond, E. Crooke, M. Sherlock, A.S. Ross, K. Lee, and P. Irving, Rapid Dispersant Effectiveness Monitoring Equipment for Oil Spill Response, Proceedings of the Thirty-Eighth AMOP Technical Seminar, Environment Canada, Ottawa, ON, pp. 722-734, 2015.
towing rope. One end of the towing rope was connected to the Oilfish via a stainless steel shackle. The sensor cable was looped close to the towing point to ensure most tension was on the tow rope and minimize any tension applied to the sensor cable. The cables were properly aligned straight so there was no tension in the cable which may apply additional force to the platform during deployment. The monitoring kit was tested at speed ranging from 2-4 knots. In Paravane mode, the float of the Oilfish kept it floating on the surface at low speed. At high speed range, the top of the Oilfish could be slightly immerged in water, but the actual depth of the sensor could be monitored in real time from the integrated pressure sensor. The rudder, which was bent 10 degree and attached to the bottom of the main panel, helped to push the kit further away from the vessel. A davit crane was used to operate the Oil fish in Towfish mode, which made it possible to position the platform away from the bow of the ship and adjust the tow rope to pay off rope. The Oilfish operated steadily at 4 knots of tow speed. The second trial was onboard the Linnaeus close to Port Hilary. The sea state was rippled to slight. Instead of being deployed off the side of the vessel, the kit was towed behind the vessel. It was demonstrated that in Paravane mode,
1) The Oilfish was not very sensitive to the load. When the number of floats and balance weight varied it could still cope with the changes and maintained stable operation. 2) The Oilfish was tested at up to 6 knots of speed. 5 to 5.5 knots seemed to be its limit to maintain stability. 3) The platform could re-establish balance and back to be vertical in water if knocked flat by the wave.
7 Conclusion Through a project co-funded by CSIRO and AMSA, we developed an integrated system for field monitoring of dispersant effectiveness. We have successfully completed all major milestones, which included literature review, sensor design and manufacture, towed platform development, laboratory meso scale assessment of sensors and field trials of the first prototype. Compared to the commonly used SMART (Special Monitoring Applied Response Technologies) kit, which relies on the response increase of one fluorometer channel to give a qualitative indication of oil dispersion, the new monitoring kit we developed is composed of a multichannel fluorometer and a particle analyzer. Laboratory meso scale assessment of the sensors validated the sensor selection. It was demonstrated that the two sensors were capable of capturing both increase of hydrocarbon concentration and characteristic property changes of chemically dispersed oil in water. The information was further processed to differentiate oils at different dispersion states to give more quantitative ranking of oil dispersant effectiveness. The towed platform that the sensors were mounted on has the unique flexibility to be deployed in two different modes for fixed depth subsurface water monitoring and water column profiling at variable depths respectively. Sea trial of the complete monitoring kit has demonstrated that the monitoring kit could be readily deployed off a vessel with minimum infrastructure and maintained stable operation at up to 5 knots of tow speed. 8 Ackowledgements Special thanks to Koon-Bay Ho (National Measurement Institute) and Michael Simeoni (Intertek Geotech) for the constructive discussion and advice on conducting the laboratory assessment. We would like to acknowledge CSIRO Engineering Technical Services team who
732
Qi, X, I. Helmond, E. Crooke, M. Sherlock, A.S. Ross, K. Lee, and P. Irving, Rapid Dispersant Effectiveness Monitoring Equipment for Oil Spill Response, Proceedings of the Thirty-Eighth AMOP Technical Seminar, Environment Canada, Ottawa, ON, pp. 722-734, 2015.
built the platform and Cameron White (CSIRO Energy), Crew of RV Southcape for assisting with testing the monitoring kit. We would also extend our gratitude to Nick Mortimer (CSIRO O&A), Andreas Marouchos (CSIRO O&A), Neil Sturrock (CSIRO Energy), Patrick Merrigan (CSIRO Mineral Resources), Stuart Dahl (CSIRO B&IS), Adam Mehab (Aqualab Scientific), Nick Matthew (Analytical Solutions Australia), Carol Lam (University of Western Australia) and Keith Shadbolt (Department of Transport, Western Australia) for their advice, assistance and support during this project. 9 References Boehm, P.D., D.S. Page, J.S. Brown, J.M. Neff, J.R. Bragg, and R.M. Atlas, “Distribution and Weathering of Crude Oil Residues on Shorelines 18 Years after the Exxon Valdez Spill”, Environmental Science & Technology, 42:9210-9216, 2008. Bugden, J. B. C., C.W. Yeung, P.E. Kepkay and K. Lee, “Application of ultraviolet fluorometry and excitation–emission matrix spectroscopy (EEMS) to fingerprint oil and chemically dispersed oil in seawater”, Marine Pollution Bulletin, 56:677-685, 2008. Conmy R. N., P.G. Coble, J. Farr, A.M. Wood, K. Lee,W.S. Pegau, I.D. Walsh, C.R. Koch, M.I. Abercrombie, M.S. Miles, M. R. Lewis, S.A. Ryan, B. J. Robinson, T.L. King, C.R. Kelble and J. Lacoste, “Submersible Optical Sensors Exposed to Chemically Dispersed Crude Oil: Wave Tank Simulations for Improved Oil Spill Monitoring”, Environmental Science & Technology, 48:1803-1810, 2014. Kepkay, P. E., C.W. Yeung, J.B.C. Bugden, Z. Li and K. Lee, “Ultraviolet fluorescence spectroscopy (UVFS): A new means of determining the effect of chemical dispersant on oil spills”,.in Proceedings of the 2008 International Oil Spill Conference, Savannah, Georgia, 1: 639-643, 2008. Li, Z., K. Lee, T., King, M.C. Boufadel and A.D. Venosa, “Assessment of chemical dispersant effectiveness in a wave tank under regular non-breaking and breaking wave conditions”, Marine Pollution Bulletin, 56:903-912, 2008. Li, Z., K. Lee, T. King, and P. Kepkay, “Evaluating chemical dispersant efficacy in an experimental wave tank: 1, Dispersant effectiveness as a function of energy dissipation rate”, Environmental Engineering Science, 26:1139-1148, 2009. Li, Z., K. Lee, T. King, M.C. Boufadel and A.D. Venosa, “Evaluating crude oil chemical dispersion efficacy in a flow-through wave tank under regular non-breaking wave and breaking wave conditions”, Marine Pollution Bulletin, 58:735-744, 2009. Li, Z., K. Lee, T. King, H. Niu, M.C. Boufadel and A.D. Venosa, “Application of entropy analysis of in situ droplet-size spectra in evaluation of oil chemical dispersion efficacy”, Marine Pollution Bulletin, 62:2129-2136, 2011.
733
Qi, X, I. Helmond, E. Crooke, M. Sherlock, A.S. Ross, K. Lee, and P. Irving, Rapid Dispersant Effectiveness Monitoring Equipment for Oil Spill Response, Proceedings of the Thirty-Eighth AMOP Technical Seminar, Environment Canada, Ottawa, ON, pp. 722-734, 2015.
Lunel. T., “In-situ fluorometry and SMART protocol – The Montara wellhead experience”, in Proceedings of the 1995 International Oil Spill Conference, Long Beach, California, 1: 147-155, 1995. Tan, S. H., “Dispersant effectiveness at sea”, in Proceedings of the 1995 International Oil Spill Conference, Portland, Oregon, 2011: abs141, 2011.
734
Qi, X, I. Helmond, E. Crooke, M. Sherlock, A.S. Ross, K. Lee, and P. Irving, Rapid Dispersant Effectiveness Monitoring Equipment for Oil Spill Response, Proceedings of the Thirty-Eighth AMOP Technical Seminar, Environment Canada, Ottawa, ON, pp. 722-734, 2015.