INSTRUMENTATION DATA ACQUISITION AND MANAGEMENT AT SALUDA DAM Joseph Mann 3 Saluda Dam Project is the largest ongoing seismic dam remediation project in the United States. Remediation includes construction of a new Dam directly at the toe of the existing earthen embankment built in the early 1930s. The Saluda Dam is classified as high- hazard. The city of Columbia (population 400,000) is 10 miles downstream. In the event of a breach, the city would be subject to flooding, almost certainly involving loss of life. Construction at the toe of a 200- ft tall dam, impounding a 2,100,000 ac- ft reservoir is a dangerous task. The concept demands a detailed, effective Instrumentation and Monitoring Program to ensure safety and stability of the existing Dam, while a new Dam is being built. The Monitoring Program, developed by RIZZO, consists of two equally important parts: Instrumentation and Visual Observations. Instruments include more than 130 piezometers, 100 inclinometers, 8 tiltmeters and numerous shear strips and laser lines. This paper addresses topics such as choice of instrumentation and installation techniques, and discusses what worked and what did not. With hundreds of instruments to install, choice of an inexpensive and fast installation technique was an important task. Developing an efficient data acquisition and management system was important to the success of the Program. RIZZO utilized multi-channel data loggers, radio links and a wireless network to deliver real time data directly to the main computer for interpretation. This paper presents an overview of the automation system setup, discusses data quality control methods and addresses encountered problems. Obtaining real time data from hundreds of instruments, although a very difficult task on its own, is not nearly enough for a successful Monitoring Program. The key is listening to the Dam, reading the signs, interpreting them and making recommendations based on the collected information. How much information is too much, relative to the risk of unknowns and potential cost of construction delays? Did we install enough instruments and in the right places? Do they correlate with construction activities and visual observations? These are just a few puzzles RIZZO had to solve. 1 Monitoring Coordinator, Paul C. Rizzo Associates, Expo Mart Suite 270-E 105 Mall Boulevard, Monroeville, PA 15146 2 Assistant Project Engineer, Paul C. Rizzo Associates, Expo Mart Suite 270-E 105 Mall Boulevard, Monroeville, PA 15146 ' 3 Assistant Project Engineer, Paul C. Rizzo Associates, 6160 St. Andrews Road, Suite 6, Columbia, SC 29212
Transcript
INSTRUMENTATION DATA ACQUISITION AND MANAGEMENT ATSALUDA DAM
Joseph Mann3
Saluda Dam Project is the largest ongoing seismic dam remediation project in the UnitedStates. Remediation includes construction of a new Dam directly at the toe of the existingearthen embankment built in the early 1930s. The Saluda Dam is classified as high-hazard. The city of Columbia (population 400,000) is 10 miles downstream. In the eventof a breach, the city would be subject to flooding, almost certainly involving loss of life.Construction at the toe of a 200- ft tall dam, impounding a 2,100,000 ac- ft reservoir is adangerous task. The concept demands a detailed, effective Instrumentation andMonitoring Program to ensure safety and stability of the existing Dam, while a new Damis being built.
The Monitoring Program, developed by RIZZO, consists of two equally important parts:Instrumentation and Visual Observations. Instruments include more than 130piezometers, 100 inclinometers, 8 tiltmeters and numerous shear strips and laser lines.This paper addresses topics such as choice of instrumentation and installation techniques,and discusses what worked and what did not. With hundreds of instruments to install,choice of an inexpensive and fast installation technique was an important task.
Developing an efficient data acquisition and management system was important to thesuccess of the Program. RIZZO utilized multi-channel data loggers, radio links and awireless network to deliver real time data directly to the main computer for interpretation.This paper presents an overview of the automation system setup, discusses data qualitycontrol methods and addresses encountered problems.
Obtaining real time data from hundreds of instruments, although a very difficult task onits own, is not nearly enough for a successful Monitoring Program. The key is listeningto the Dam, reading the signs, interpreting them and making recommendations based onthe collected information. How much information is too much, relative to the risk ofunknowns and potential cost of construction delays? Did we install enough instrumentsand in the right places? Do they correlate with construction activities and visualobservations? These are just a few puzzles RIZZO had to solve.
1 Monitoring Coordinator, Paul C. Rizzo Associates, Expo Mart Suite 270-E 105 Mall Boulevard,Monroeville, PA 151462 Assistant Project Engineer, Paul C. Rizzo Associates, Expo Mart Suite 270-E 105 Mall Boulevard,Monroeville, PA 15146 '3 Assistant Project Engineer, Paul C. Rizzo Associates, 6160 St. Andrews Road, Suite 6, Columbia, SC29212
This is the last in a series of papers written by the authors on the Instrumentation andMonitoring Program implemented at Saluda Dam. Saluda Dam is a 75-year-old 200-ft-tall and 1.5-mile-long earth embankment located near Columbia, South Carolina. Thedam is currently being remediated to prevent catastrophic failure due to liquefactionduring a seismic event. The remediation involves building a dry dam at the toe of theexisting one that would serve as a water retaining structure if the existing dam fails. Thefirst paper, "Dangerous Place to Dig" (Sossenkina E., April 2004), addressed analysesand design of the remedial scheme. One of the biggest challenges engineers faced wasdesigning an open cut excavation at the toe of such a large dam. Draining the lake wasnot an option, so excavation had to be performed with essentially full pool, makingconditions even more dangerous. To minimize the risk, it was decided to excavate andbackfill in small portions, or cells, use extensive dewatering of the dam and foundation,and work around the clock to limit the time excavations stayed open. Even with theseprecautions, excavation is the time when the dam is the most vulnerable and when carefulmonitoring of conditions is a must. Engineers developed and implemented acomprehensive Instrumentation and Monitoring Program. The program uses theobservational approach advocated by Dr. Ralph Peck (Peck, R.B., 1969). It emphasizes a"listening to the dam" concept of interpreting the data, correlating it with constructionactivities, and staying a step ahead. The second paper in the series, "Listening to theDam" (Sossenkina E., September 2004), gave examples of this approach at work on theSaluda project. This paper illustrates the thought process for how and why certaininstruments were chosen, discusses automation options, and describes the "nuts andbolts" of the data acquisition system.
To select the instruments engineers first had to identify potential problems and theirtrigger mechanisms, define the geotechnical questions that need to be answered, andselect parameters to be monitored. In this case, the main concerns were global stability ofthe dam and local stability of the excavation. Several construction activities wereidentified as having a potential impact on dam stability:
• Dewatering of the embankment fill and its foundation;• Excavation at the toe;• Construction of a haul road for heavy CAT 777 trucks on the slope above
excavation; and• Partial pool drawdown.
The primary instruments to detect and predict slope failure or bottom heave arepiezometers and inclinometers. Inclinometers measure subsurface deformation caused byslope movement. Piezometers measure pore pressure within the embankment andfoundation soils. Inclinometers were supplemented by surface monument surveying andlaser lines. Data from these instruments were used to identify the extent of any
movement and to guide subsequent remedial actions. The driving factors in selection ofinstruments were ease and speed of installation, minimum interference with construction,automation capability, durability, and reliability.
For inclinometers, engineers decided to go with standard Slope Indicator productsbecause of previous experience with the field equipment and data interpretation software.
Deciding on the type of piezometer was more difficult. Prior to remedial construction, thedam was equipped with open standpipe (Casagrande-type) piezometers. Theseinstruments proved to be reliable and easy to use; however, they did not fit requirementsfor the new installation, i.e. fast installation, quick response time, ability to measurenegative pore water pressure, automating capability, and minimal interference withconstruction. Engineers considered pneumatic and vibrating wire (vw) piezometers, butdecided on vibrating wire mostly because of previous experience and familiarity with theproduct. Vibrating wire piezometers "pluck" a wire attached to a diaphragm. As thetension in the wire and thus its vibrating frequency vary in proportion to the pore pressureagainst the diaphragm, the pore pressure can be determined. Two of the typical concernswith vw piezometers are lightning protection and long-term reliability. In our case, thechosen model had lightning protection, a plasma surge arrestor, built in. Long-termreliability was not a concern because the construction monitoring program was scheduledto last less than two years.
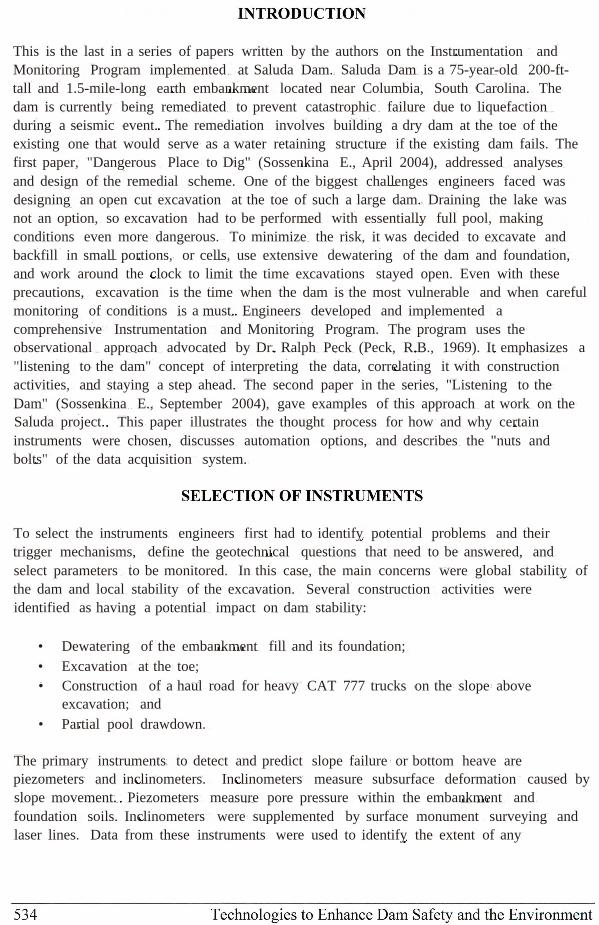
The next step was choosing a model and finalizing the details. To help with the decision,a field test program was designed. Recent research suggests that a sand pack isunnecessary with vibrating wire piezometers, that is, piezometers can be simply groutedin a borehole (Mikkelsen P.E., 2003). Elimination of the sand pack reduces installationtime and simplifies the process. Despite the promising research, concerns about site-specific performance of a fully grouted piezometer remained. The field test wasperformed to compare measurement of pore pressure with 1) standard vw piezometers(Geokon 4500S) in sand pack, 2) spring-activated vw piezometers (Geokon 4500MLP)fully grouted in borehole, and 3) Casagrande-type piezometers. First, two boreholes weredrilled next to an existing multi-level Casagrande-type piezometer. Two standard vwpiezometers, one in foundation soil and one in the embankment fill, were installed in oneof the new boreholes. Transducers were set in a I-ft-thick sand pack and located at thesame depths as the screen intervals of the Casagrande-type piezometer. Bentonite pelletswere poured on top of the sand packs to create a 0.5 ft-thick plug. The remainder of theborehole was then grouted with a Portland cement and high yield bentonite mix grout,consisting of two 94 lb. bags of Portland Type I cement and two 50 lb bags of high yieldbentonite mixed in 150 gallons of water. In the other borehole, spring-activated vwpiezometers were placed at the same elevations. Once the springs on the piezometerswere activated to hold the transducers against the borehole walls, the entire borehole wasgrouted with the previously described grout mix (no sand pack was used for thisinstallation). Additional standard vw transducers were placed in the Casagrandepiezometer standpipes to allow for automated readings. The test consisted of variablepumping of nearby deep wells and recording piezometer response, with readings taken at
\
I-minute intervals. The test results confirmed that the sand pack could be eliminatedwithout affecting quality of data. Accordingly, engineers proceeded with spring-activated
vw piezometersinstalled in fullygrouted boreholes.Observations of thetest set continuedfor the next severalmonths.~easurementstakenduring the activedewatering phase ofthe project arepresented on Figure1. The data indicatethat fully groutedpiezometers react asfast as thoseinstalled in sand
pack. However, the vw piezometers in sand pack appear to be slightly more sensitive tofluctuations in pumping rates. Casagrande-type piezometers have the longest time lag andare the least sensitive of the three.
8'~ 225Q
~ 223U02~ 221
§0: 219
The next step in development of the instrumentation program was selecting instrumentlocations. Since excavation was to be performed in discrete cells, each cell had to have atleast one instrumented cross-section. Typically, the instrumented cross-section waslocated in the middle of the cell, where the 3-D effects of surrounding unexcavated cellsare minimal and therefore where the dam is most vulnerable. Old construction drawingswere used to identify features of the dam (old drains and drainage tunnels, railroadtrestles left behind, etc.) that could increase risk of excavation and needed specialattention. Depending on the height of the dam, instruments were installed in two or threerows on the downstream slope above excavation. The first row was placed closest to theedge of the excavation, with the second and third further upstream. Each row containedmulti-level instruments installed at different depths within the embankment andfoundation to evaluate local and global failure planes. Where possible, engineers placednew instruments to supplement existing ones. Such placement provides a continuity ofreadings and is useful for interpretation. New measurements can be compared tohistorical data and behavior evaluated relative to baseline conditions. Typically,inclinometers and piezometers were placed in pairs. Such placement helps to identifyreasons for abnormal readings and evaluate trigger mechanisms. For example, if apiezometer indicates a sudden change in pore pressure, but the nearby inclinometer isstable, it could indicate a malfunctioning dewatering component. However, if
deformation is noted at the same depth where pore pressure rise is observed, it couldindicate a much more serious problem, such as a developing slide.
Engineers also had to evaluate effectiveness of the dewatering program. Instruments wereplaced to check whether pore pressure was lowered to the target levels specified by slopestability analyses and, therefore, whether it would be safe to proceed with excavation.Piezometers placed near a pumping well could be too close to the tip of the cone ofdepression and paint an overly optimistic picture, or be too far away and miss the cone ofdepression altogether. Based on field pump tests, laboratory permeability tests andexperience in the field, engineers determined that the best location for piezometers iswithin 20-150 ft of a dewatering well. To ensure that the instruments survivedconstruction, locations had to be carefully coordinated with the contractor. On one hand,instruments need to be close to the "action" to recognize adverse effects of constructionbefore they have a chance to develop into a global problem and, on the other hand, farenough away to avoid damage or destruction.
With 24 excavation cells and multiple rows of multi-level instruments to be installed, costwas a big factor. Dr. Peck said, "The fundamental rule today should be that noinstrument should be installed that is not needed to answer a specific question pertinent tothe safe performance of the dam". Engineers had to decide how many instruments wereenough. A total of 100 inclinometers and 130 piezometers were deployed on site. Havewe installed too many? Considering the consequences of dam failure, the hard to predictbehaviorofthe 75-year-old semi-hydraulic fill embankment, the number of unknowns,and a wide range of construction activities to be evaluated, a high number of instrumentsand accompanying costs were well justified. The value of avoiding a failure or delays,such as stopping to evaluate developing conditions or install additional instrumentation,to the $275 Million project made the instrumentation program cost effective.
Data obtained from an instrument is only as reliable as the care with which thatinstrument was installed. An instrument deployed or installed improperly will supplyunreliable data and through careless drilling may even affect the stability of the dam andon-site structures.
Inclinometers and vibrating-wire piezometers needed to be installed in the embankmentfill and foundation of Saluda Dam, thus, drilling was necessary. The downstream slope ofthe dam is covered with riprap benches, which provide easy access for a drill rig, but poseanother type of challenge. The riprap layer varies in thickness from 10ft at the top to asmuch as 25 ft near the toe. Drilling through riprap is not an easy task. With so manyinstruments to be installed, choosing a quick drilling method was a key. Conventional topdrive rotary or auger-drilling methods using air or water proved to be ineffective. Thesolution engineers ultimately came up with was the use of sonic drilling technology.Sonic drilling employs the use of high frequency, resonant energy to advance a drill bitinto subsurface formations. The resonant energy is generated by two counter-rotating
weights. When the resonant sonic energy coincides with the natural frequency of the drillstring, resonance occurs. This results in the maximum amount of energy being deliveredto the bit face, and minimizes the friction of the soil immediately adjacent to the drillstring, resulting in very fast penetration rates (Pro sonic Corp.). The sonic vibrationactually liquefies the material at the face of the bit and displaces the material to the sideof the hole, thus minimizing the by-product coming to the top of the hole.
Prior to installation, each vw piezometer was checked and calibrated based on themanufacturer supplied calibration sheets. Saturation of the piezometer was important toremove air from the filter. All piezometers were submerged in water for no less than 24hours prior to installation. During saturation the filter assembly was removed from thepiezometer casing and allowed to fully saturate.
For installation of vibrating wire piezometers,boreholes were drilled with sonic drilling technologyto a pre-determined depth below the phreatic surface.Most installations on site were multilevel with two ormore transducers grouted in a single borehole, asshown on Figure 2a. As described earlier, the type ofpiezometer used for all installations on site was aspring-loaded low-air entry vibrating wire piezometer(Geokon 4500MLP) that presses the transducer firmlyagainst the borehole wall. First, all transducers,starting with the bottom one, were locked in place. Atremie tube was then used to fully grout the boreholewith a cement-bentonite mix from the bottom to thetop in one operation. The mix used is a standardgrout mix recommended by Slope Indicator andMikkelsen (2003) and described in detail earlier. Inthe field, the weight of the mix was approximately9.5Ib/gal and the viscosity, measured with a MarshFunnel, was typically 40 see/liter.
13~
13~
PRE-DETERMINEDDEPTH
-U. 8 In. BOREHOLE
VIBRATING WIRE PIEZOMETER
Inclinometers on site were installed in boreholes keyed 2 feet into bedrock, as shown onFigure 2b. The inclinometer casing is a 2.75-inch-diameter Slope Indicator ABS plasticcasing with snap-together joints. After drilling the borehole and before installation of thecasing, an end-cap was affixed to the bottom of the inclinometer casing. The joints of thecasing were sealed with duct tape to prevent grout seeping into the casing and the casingwas filled with water to overcome buoyancy effects in the borehole. Once the casing wasplaced fully within the borehole, the annulus between the borehole walls andinclinometer casing was fully grouted from bottom to top in one operation. The mix usedin the inclinometer installations was the same mix used for vibrating-wire piezometers.This method of installation produces uplift pressure on the inclinometer casing duringgrouting, which was overcome by loading the top of the casing at surface (theinclinometer casing was held in place with the drill rig). Restraining casing at the top can
cause the casing to bend (snake)within the borehole (Dunnicliff, 2000)and therefore is not recommended.The problem is more severe fordeeper installations, where buoyancyforce is greater. At Saluda, more than100 inclinometers with depthsranging from 18 to 158 feet wereinstalled using this method. Ingeneral, with small diameterboreholes restricting the movementduring installation, numerousinstruments closely spaced, andcareful reading procedures, we foundthe data to be of an acceptablequality. However, for someinclinometers, significant snaking didoccur and the casing eventuallydisengaged at the snapped-togetherjoints causing a large kink to appearin the displacement plot. Data over
the depth where this occurred had to be disregarded. Based on the experience, we wouldnot recommend this installation technique and in the future would use one of thetechniques suggested by Dunnicliff (2000).
i:II ;%:
,_2.75 in. 0.0. GROOVED1% INCUNOMETER CASING
~ 4 in. DIA. BOREHOLE ENTIREDEPTH - 6 in. CASING USEDONLY IN AREAS OF LOOSERIPRAP PRONE TO CAVINGIN.
Successful deployment of instruments needs to be matched with a high caliber oforganization in the field, office management, and reporting. Labeling instruments may bean obvious step, but without proper boring logs, site plan views, and tidy organization ofinstruments, quality of data could be compromised.
Suitability to automation was an important criterion in selection of instruments,especially piezometers. Several factors were considered when determining the level ofautomation needed:
• Excavation at the toe of the Dam going on 24/7 would produce rapidly changingsite conditions;
• A large number of instruments were to be installed;• Frequency of readings for instruments near active excavations needed to be high;• Data reduction needed to be done in a timely manner to facilitate quick decision-
making; and• High consequences of failure.
Evaluation of the factors led to the conclusion that the monitoring system should be asfully automated as feasibly possible. However, the more complicated the setup, the moresusceptible it is to malfunctions. Therefore, several redundancies and checks were builtinto the system to ensure its uninterrupted functioning and validity of the data. Forexample, measurements collected automatically were routinely checked against manualreadings and data from nearby instruments was crosschecked and compared to eachother. Manually read observation wells were used to check nearby vibrating wirepiezometers and GPS surveying was used to verify surface movement picked up byinclinometers. Visual observations of site conditions played a key role in data validation.An often overlooked positive aspect of automation is that the less time spent on datacollection and reduction, the more time is left for interpretation and visual observation.Once the desired level of automation was determined, equipment was chosen for fieldimplementation. Reliability, ruggedness and relative simplicity were importantparameters in choosing the components.
One main advantage of vibrating wire piezometers is that they are easily automated.Dataloggers supplied by Geokon, Inc. (Model MICRO-10) were used to read piezometersinstalled in the slope above the excavation. Piezometers were wired first to a multiplexer,which was then linked directly to the datalogger. The dataloggers are capable of reading96 instruments (6 multiplexers x 16 instruments per multiplexer), although a maximum of32 instruments per datalogger was used on the project. This "all eggs in one basket"approach can backfire if dataloggers malfunction. For this reason, the dataloggers needto be rugged and reliable. An environmental box was used to shield dataloggers againstprecipitation and a grounding rod was used for lightning protection. In addition, thedataloggers were equipped with two redundant sources of power - AC power and a solarpanel-to-battery setup. The AC power was taken from a nearby utility pole while thesolar panel charged a deep-cycle marine battery, which in turn charged the datalogger'sinternal battery. In the unlikely event that a datalogger was down for an extended periodof time, manual readings could also be taken directly using the multiplexers. Theseadded levels of protection afforded engineers more confidence in the use of thedataloggers.
Readings collected by the dataloggers were transmitted back to the trailer via radio link,as shown on Figure 3. The dataloggers and the trailer were equipped with 2.4-Ghzspread spectrum radios. More specifically, a 9-dBi corner reflector antenna at thedatalogger transmited the signal to a 3-dBi omni-directional antenna at the trailer. Wefound that with this setup the signal could be transmitted reliably to a maximum distanceof approximately 1.5 miles. Because the datalogger was to move with excavation as itprogressesd along the toe, each potential location was tested for radio connectivity.Initial problems with noise on the signal were overcome by increasing the signal strength.This was done with simple measures such as raising the antenna and securing the mast.
In some cases, such as near active construction or where extra long cable lengths wereneeded, running cables from piezometers to a central datalogger location was notpractical. Those piezometers were equipped with single-channel dataloggers (LC-1), also
supplied by Geokon, Inc. Data stored in LC-I dataloggers were downloaded in the fieldwith laptop computers. The LC-I loggers proved to be very rugged, reliable and easy touse. With the help of a wireless Cisco network, the LC-I data was automaticallyuploaded to a shared network drive. The Cisco Aeronet® network was composed of anomni-directional antenna with coverage of the downstream slope of the Dam, accesspoint, two bridges, and a yagi (point-to-point) antenna that transmitted to another yagiantenna atop the trailer, as shown on Figure 3.
l\lulmltmilil:ilUit"UmB.s
Wi•• h!~~.I\~rk tI)&riktl.vrrl~ racealDOl
:M:llJti.l'ioxw
Figure 3: Schematic illustration of the Automatic Data Acquisition System
Inclinometers were not nearly as feasible to automate as vibrating wire piezometersbecause of the scale of the project and the number of inclinometers installed. Optionssuch as in-place inclinometers and time-domain reflectometry (TDR) were looked intobut dismissed based on cost and level of accuracy needed. A standard Slope Indicatortorpedo probe read manually by field technicians was chosen for inclinometer readings.With an average depth of 100 ft, a typical inclinometer reading took 30 minutes tocomplete.
Although the reading process itself was not automated, data reduction in a lot of wayswas. Inclinometer readings were electronically recorded in the field by the DigitiltDataMate readout unit and later downloaded to a computer using DMMWin software.Both products are manufactured and distributed by Slope Indicator, Inc. Under normalcircumstances, datasets were retrieved and interpreted in the trailer at the end of the shift.
Although, with a laptop computer linked to the wireless network, it was possible for atechnician to complete a reading, download it, and compare it with previous readings, allwhile still in the field and with little extra effort. In general, such level of automationwas sufficient and allowed for timely data interpretation and decision making.
The majority of piezometers on site were wired to an automated system. Accordingly,data collection and reduction required little extra effort after system setup was completed.During active excavations, automated piezometer readings were taken as often as everyhalf-hour and on average one data point was collected every two hours. However, specialapplications, such as pump tests and borrow area blast monitoring, warranted a readinginterval of a few seconds. To maintain baseline conditions and fully evaluate dewateringeffects, all piezometers not connected to the automated system were read manually witheither a water level indicator (observation well, Slope Indicator) or GK-403 readout box(vibrating wire, Geokon, Inc.) at least once per week. With the excavation scheduled tolast for more than a year, the large amount of data collected would be very difficult tomanage without an efficient and reliable database.
The key attribute that was looked for in potential database programs was flexibility.Piezometer measurements collected with all four methods used on site (datalogger,single-channel logger, water level indicator, or GK-403 readout box) had to be located inone database file with minimal time and effort needed for data input and reduction. Thedatabase also had to be powerful enough to catalog large amounts of data, since close to 1million data points were input over the last two years. Multilogger DB® (CanarySystems) was chosen for this task. The program was suitable for both manual andautomated input of the data. Most importantly it allowed for seamless input of all datainto a single database file regardless of the data acquisition method. Readings takenmanually in the field needed to be entered into the database by hand, while data from thedataloggers was automatically uploaded and placed in the same database alongside themanual data. A capable charting program is included with Multilogger DB® to simplifydata interpretation and reporting. As a precautionary measure, the database was backedup periodically. The database proved to be an indispensable and very effective tool forthe project.
During excavation, when Dam stability was most at risk, inclinometers above andsurrounding an active excavation cell were read at the highest frequency - 6 datasets perday per inclinometer from as many as 18 inclinometers for a given cell. Constructionprogressed 24 hours a day, 7 days a week, demanding a similar monitoring schedule. Inthe cells where excavation was complete or had not yet begun, measurements were takenat least once a week to maintain baseline conditions and evaluate effects of otherconstruction activities. Such a high frequency of readings and overall requirements of themonitoring program led to an unusually large amount of inclinometer data. Reducing andmanaging inclinometer data were done with Slope Indicator's software packagesDMMWin® and DigiPro®. Both packages have proven to be reliable during construction
monitoring. The DMMWin software can analyze data statistics, calculate checksums andcorrect for errors. DigiPro is useful for comparison of multiple data sets and preparingvarious charts.
Collecting a vast amount of data and incorporating it into a database is just half of thebattle. It is equally important to monitor and record all external factors that may influenceinstrument readings. Engineers carefully tracked all construction activities andenvironmental conditions on site with photo journals, daily logs, and reports.Coordination with personnel who have worked on the dam for many years, were familiarwith site conditions and had a thorough understanding of historical data proved to beextremely important for proper data interpretation.
Development of the Instrumentation and Monitoring Program for Saluda Dam is a goodillustration of the systematic approach to planning monitoring programs. Proceedingthrough a series of logical steps and following a carefully orchestrated thought process, asrecommended by Dunnicliff(1988), helped engineers address the needs of the projectand design a reliable instrumentation system. The construction began in 2002 withinstallation of the dewatering system and launch of the Instrumentation and MonitoringProgram. We are currently in the third year of the remedial construction and completionof the project is scheduled for the summer of2005. The excavation phase lastedapproximately 18 months and put the Monitoring Program through a vigorous test.
Despite the extensive subsurface explorations and numerous sophisticated analyses,engineers knew little about the dam when the project began. How would the dam react tothe excavation? How much movement and pore pressure fluctuations can it tolerate?Each dam is unique; no calculations and computer-aided analyses can predict whatexactly it will do when subjected to stress. Some circumstances were as designed and
anticipated, some were better than anybody could have hoped for, and some were a totalsurprise. Overall, the dam tolerated excavation at the toe and extensive modifications ofthe downstream slope better than engineers anticipated. At no time was it under seriousdistress. Nevertheless, in several instances instrumentation and/or visual observationsexceeded the established threshold levels. In all cases instruments provided timelymeasurements and the established interpretation procedures enabled engineers to catchproblems early on and remediate them, if necessary. Remedial measures includedconstruction of retaining walls to support excavation, protecting slopes with filterblankets to prevent piping, and buttressing the toe to provide additional support and arrestpotential movements. Aside from routine maintenance and occasional troubleshootingafter heavy lightning storms, instruments and automation systems proved to be veryreliable and well suited for the application. The main lesson learned from this project was- "expect the unexpected and be flexible". Threshold levels had to be revised anddefinition of "normal behavior" adjusted as construction progressed and engineerslearned more about the dam. Correlating data to construction activities and visualobservations is fundamental to the observation approach and was essential to success ofour program. The key was listening to the dam, reading the signs, interpreting them andmaking recommendations based on the collected information.
1. Dunnicliff, J. (1988), "Geotechnical Instrumentation for Monitoring FieldPerformance", John Wiley, New York.
2. Dunnicliff, J, Mikkelsen P.E "Overcoming Buoyancy during Installation ofInclinometer Casing", Geotechnical News, Vol 18, No 4, December 2000, p. 23
3. Mikkelsen, P.E., Green, Gordon E., "Piezometers in Fully Grouted Boreholes",FMGM - Field Measurements in Geomechanics, Oslo, Norway (2003).
4. Peck, R.B., "Advantages and Limitations of the Observational Method in AppliedSoil Mechanics", Publication # 116. Ninth Rankine Lecture. Geotechnique, June1969, 19, pp 171-187
5. Sossenkina, E., Newhouse, S., Glunt, M., "Dangerous Place to Dig: Excavation atthe Toe of Saluda Dam", Proceedings: Fifth International Conference on CaseHistories in Geotechnical Engineering, New York, NY, April 2004.
6. Sossenkina, E., Newhouse, S., Glunt, M., Mann, J., "Listening to the Dam:Instrumentation and Monitoring Program - Saluda Dam Remediation", Proceedingsof the ASDSO (Association of State Dam Safety Officials) 21 5t Annual Conference,September 26-30,2004, Phoenix, Arizona.