Instrumented elephant seals reveal the seasonality in chlorophylland light-mixing regime in the iron-fertilized Southern Ocean
Stéphane Blain,1,2 Sophie Renaut,1,2 Xiaogang Xing,3,4 Hervé Claustre,3,4
and Christophe Guinet5
Received 19 September 2013; revised 28 November 2013; accepted 2 December 2013; published 19 December 2013.
[1] We analyze an original large data set of concurrent in situmeasurements of fluorescence, temperature and salinityprovided by sensors mounted on the elephant seals ofKerguelen Island. Our results were mainly gathered in regionsof the Southern Ocean where the typical iron limitation isrelieved by natural iron fertilization. Thus the role of light asthe proximal factor of control of phytoplankton can beexamined. We show that self-shading, and consequentlystratification, are major factors controlling the integratedbiomass during the bloom induced by iron fertilization. Whenthe mixed layer was the shallowest, the maximum ChlML
achievable by the given light-mixing regime was however notreached, most likely due to silicic acid limitation. We alsoshow that a favorable light-mixing regime prevails after thespring equinox and is maintained for roughly sevenmonths (October–April). Citation: Blain, S., S. Renaut, X. Xing,H. Claustre, and C. Guinet (2013), Instrumented elephant seals revealthe seasonality in chlorophyll and light-mixing regime in the iron-fertilized Southern Ocean, Geophys. Res. Lett., 40, 6368–6372,doi:10.1002/2013GL058065.
1. Introduction
[2] Seasonality is a major characteristic of the temporalevolution for marine ecosystems at high latitudes. Salinity,heat fluxes, and wind stress alter the stratification of the upperocean with modifications of light and nutrients which sup-port growth of phytoplankton. The Southern Ocean mixedlayer is very sensitive to climate variability, but the conse-quences for the dynamics of phytoplankton blooms are con-troversial [Lovenduski and Gruber, 2005; Sallée et al.,2010]. Resolving this issue is crucial because phytoplanktonblooms impact the magnitude of the biological pump of CO2
[Marinov et al., 2006], and they sustain a unique marine food
web. In the Southern Ocean, the general oceanic circulationsupplies the enlightened surface layer with nutrients andCO2-rich waters. During the northward transport of thesewaters, phytoplankton only consumes a fraction of theavailable nutrients, allowing CO2 to escape to the atmosphere.This CO2 leakage significantly impacts climate [Sigman et al.,2010]. The inefficient functioning of the biological pump ofCO2 in the Southern Ocean is mainly attributed to iron limita-tion of phytoplankton. This was clearly demonstrated by bothartificial iron fertilization experiments [Boyd et al., 2007;Smetacek et al., 2012] and investigations in naturally iron-fertilized regions [Blain et al., 2007; Pollard et al., 2009].However, all these experiments were conducted duringsummer when the mixed layer is the shallowest [Boydet al., 2007]. In the Southern Ocean the stratification ofthe upper water column is relatively weak compared tolow-latitude waters, and during most of the year strongwinds contribute to create deep mixed layers potentiallyunfavorable for phytoplankton growth [Boyd, 2002].[3] During the past decade, our knowledge of the temporal
and spatial variability of the mixed layer depth (MLD) in theSouthern Ocean was greatly improved by in situ measure-ments of temperature, salinity, and pressure with autonomoussensors mounted on Argo floats [Sallée et al., 2010] orelephant seals [Charrassin et al., 2008]. Robust climatologiesof the MLD are now available, which show how climatevariability (e.g., southern annular mode) impacts the MLD[Sallée et al., 2010]. The spatial and temporal variabilityof phytoplankton biomass is estimated from remote-sensedocean color [Arrigo et al., 2008; Allison et al., 2010].Satellite-derived products have also been used to study thephysiological responses of phytoplankton during iron fertiliza-tion [Westberry et al., 2013]. However, concurrent in situMLD and chlorophyll data covering the entire annual cyclefor a large region are still missing, hampering our furtherunderstanding of the effect of the light-mixing regime on thedynamics of phytoplankton blooms.[4] The southern elephant seals (Mirounga Leonina) are
deep-diving predators that spend several months at sea in all dif-ferent provinces of the Southern Ocean, from the sea ice zone tosubtropical waters (Figure 1). In previous studies, instrumentedsouthern elephant seals have provided valuable data for study-ing frontal structures and sea ice formation rates [Charrassinet al., 2008]. In our study we used these animals to get insightinto the seasonality of chlorophyll and light-mixing regime.
2. Material and Methods
2.1. Deployment and Calibration of Sensors
[5] The data were collected by 23 elephant seals (MiroungaLeonina) of the Kerguelen Island. The tags were deployed
Additional supporting information may be found in the online version ofthis article.
1Laboratoire d’Océanographie Microbienne, Université de Paris 06,Banyuls sur mer, France.
2Laboratoire d’Océanographie Microbienne, CNRS, Banyuls sur mer,France.
3Laboratoire d’Océanographie de Villefranche, Université de Paris 06,Villefranche-sur-Mer, France.
4Laboratoire d’Océanographie de Villefranche, CNRS, Villefranche-sur-Mer, France.
5Centre d’Etudes Biologiques de Chizé, CNRS, Villiers-en-Bois, France.
Corresponding author: S. Blain, Laboratoire d’Océanographie Microbienne,Université de Paris 06,Avenue du Fontaulé, Banyuls surmer, FR-66650, France.([email protected])
GEOPHYSICAL RESEARCH LETTERS, VOL. 40, 6368–6372, doi:10.1002/2013GL058065, 2013
during five different periods between 2007 and 2011, trans-mitting 4498 profiles among which 3388 were usable[see Guinet et al., 2013, Table 1]. In our study we used asubset of this data set (1819 profiles from 21 tags; Table S1in the supporting information) collected in high-chlorophyllregions. The animals were equipped with a multisensorssatellite relay data logger, developed by the Sea MammalResearch Unit (UK). Pressure, temperature, and salinity weremeasured with an accuracy of 2 dbar, 0.02–0.03°C and0.03–0.05, respectively [Charrassin et al., 2008]. In situfluorescence was measured using the compact in situ fluo-rometer Cyclops-7 (Turner designs). During the upcasts,fluorescence measurements took place every 2 s and wereaveraged for a depth interval of 10 m, the mean value beingattributed to the depth of the mid interval. Therefore, eachprofile contained 18 values between 5 and 175 m. Two pro-files were transmitted per 24 h. The fluorescence profilesmeasured during the day were affected by quenching. Wecorrected this effect using a new method which assumes thatchlorophyll is homogenously distributed in the mixed layerand that the quenching effect is negligible at depths belowthe mixed layer depth (MLD) [Xing et al., 2012]. Theretrieval of chlorophyll concentrations ([Chl]) from fluores-cence measurements provided by different sensors requireda careful cross calibration of all the sensors. This wasdone before deployment by comparison of the fluorescencesignal with discrete chlorophyll measurements by high-performance liquid chromatography of samples taken at thesame depth [Xing et al., 2012]. For the first two deploy-ments, such predeployment calibration was not achievedand a posttreatment utilizing the relative variations ofsurface chlorophyll concentrations derived from ModerateResolution Imaging Spectroradiometer (MODIS) was applied[Guinet et al., 2013]. For each regions defined below,the mean chlorophyll profile was calculated for periods of15 days.
2.2. Definitions of the Regions
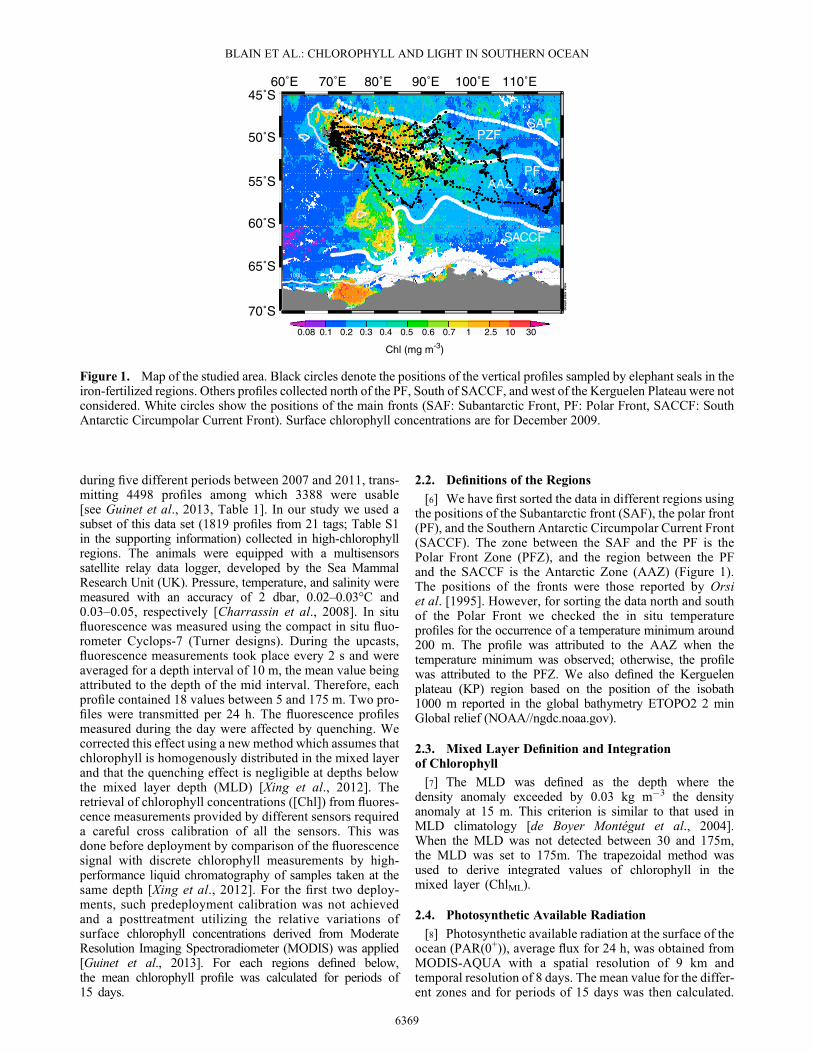
[6] We have first sorted the data in different regions usingthe positions of the Subantarctic front (SAF), the polar front(PF), and the Southern Antarctic Circumpolar Current Front(SACCF). The zone between the SAF and the PF is thePolar Front Zone (PFZ), and the region between the PFand the SACCF is the Antarctic Zone (AAZ) (Figure 1).The positions of the fronts were those reported by Orsiet al. [1995]. However, for sorting the data north and southof the Polar Front we checked the in situ temperatureprofiles for the occurrence of a temperature minimum around200 m. The profile was attributed to the AAZ when thetemperature minimum was observed; otherwise, the profilewas attributed to the PFZ. We also defined the Kerguelenplateau (KP) region based on the position of the isobath1000 m reported in the global bathymetry ETOPO2 2 minGlobal relief (NOAA//ngdc.noaa.gov).
2.3. Mixed Layer Definition and Integrationof Chlorophyll
[7] The MLD was defined as the depth where thedensity anomaly exceeded by 0.03 kg m�3 the densityanomaly at 15 m. This criterion is similar to that used inMLD climatology [de Boyer Montégut et al., 2004].When the MLD was not detected between 30 and 175m,the MLD was set to 175m. The trapezoidal method wasused to derive integrated values of chlorophyll in themixed layer (ChlML).
2.4. Photosynthetic Available Radiation
[8] Photosynthetic available radiation at the surface of theocean (PAR(0+)), average flux for 24 h, was obtained fromMODIS-AQUA with a spatial resolution of 9 km andtemporal resolution of 8 days. The mean value for the differ-ent zones and for periods of 15 days was then calculated.
60˚E 80˚E
70˚S
65˚S
60˚S
55˚S
50˚S
45˚S70˚E 90˚E 100˚E 110˚E
Chl (mg m-3)
0.08 0.1 0.2 0.3 0.4 0.5 0.6 0.7 1 2.5 10 30
Figure 1. Map of the studied area. Black circles denote the positions of the vertical profiles sampled by elephant seals in theiron-fertilized regions. Others profiles collected north of the PF, South of SACCF, and west of the Kerguelen Plateau were notconsidered. White circles show the positions of the main fronts (SAF: Subantarctic Front, PF: Polar Front, SACCF: SouthAntarctic Circumpolar Current Front). Surface chlorophyll concentrations are for December 2009.
BLAIN ET AL.: CHLOROPHYLL AND LIGHT IN SOUTHERN OCEAN
6369
PAR(0�) was calculated using a reduction of 7.6% of PAR(0+) to take into account the radiation diminution when PARpassed through the sea surface [Morel, 1991]. Theattenuation coefficient of PAR with depth (KPAR) wasestimated using the empirical formulation of Riley [1956].This relationship provides similar results to those derivedfrom in situ PAR and Chl profiles in the Crozet region[Venables and Moore, 2010]. The mean PAR in the mixedlayer was estimated as
PARML ¼ 1
MLD∫
MLD
0PAR 0�ð Þexp�KPARzdz
¼ PAR 0�ð ÞKPARMLD
1� exp�KPARMLD� �
: (1)
[9] For given values of PARML , MLD, and PAR(0�) wealso calculated the corresponding [Chl] using Riley’s formu-lation and equation (1).
3. Results
[10] The climatology of profiles of [Chl] and MLD wereconstructed for the three following zones, PFZ, AAZ, andKP, where the annual coverage was sufficient (Figures S1,S2, and S3).[11] We detailed here the case of the AAZ. The annual
cycle of integrated chlorophyll in the mixed layer(ChlML) presented four distinct phases (Figure 2). ChlML
increased continuously from the beginning of our observa-tions (mid-October) until mid-December and was associatedwith a concomitant increase in PAR(0�) and a shoaling ofthe mixed layer. During this period, the average PAR over
the mixed layer was nearly constant, PARML ¼ 3:5molphoton m�2 d�1 (Figures 2b and 3a). In December the bloomstopped (i.e., loss terms exceeded growth) and ChlML
decreased abruptly in early January whereas the mixedlayer was shoaling and the surface irradiance started todecrease. The third phase of the seasonal cycle extendedfrom mid-January until May when ChlML was constant.During this phase,PARML decreased continuously. The mixedlayer deepened, leading to an entrainment of Chl in the newlyformed mixed layer. The effect of entrainment on integratedchlorophyll was evaluated (Figure 2b). Entrainment addeda minor amount of chlorophyll, and this process can thereforebe neglected. Finally, in May, ChlML decreased to reachwinter values.
4. Discussion
[12] During the productive season, all three regions consid-ered in our study are characterized by high [Chl] compared tothe surrounding waters [Fauchereau et al., 2011]. Naturaliron fertilization enhances phytoplankton growth in these re-gions. Based on a global analysis of the satellite images ofchlorophyll conducted for the entire Southern Ocean be-tween January 1997 and December 2007, the blooms in theseregions are characterized by high seasonality [Thomallaet al., 2011]. This gives support to the idea that our data setis representative of a typical mean seasonal cycle inthese regions.[13] During the first phase of the bloom we observed a
strong coupling between light availability and integratedbiomass. In the absence of other factors than light-limitingphytoplankton growth, a steady state value of PARML and
a
b
Figure 2. Climatology of PAR, MLD, and integrated chlorophyll for the AAZ. (a) Solid circles denote surface PAR, andopen circles denote mean MLD with the confidence interval (99%) given by the dotted lines. (b) Black bars denote the mixedlayer integrated chlorophyll (ChlML) with error bar for confidence interval (99%). White bars are for integrated chlorophyll,corrected for the contribution due to the mixing during deepening (ChlML,cor). Open circles denote mean PAR in the mixedlayer PARML
� �calculated from equation (1) with the dotted envelop corresponding to the confidence interval (99%).
BLAIN ET AL.: CHLOROPHYLL AND LIGHT IN SOUTHERN OCEAN
6370
of ChlML can be reached because the light gradient depends onthe light attenuation by phytoplankton [Huisman, 1999]. Inthis case, so-called self-shading conditions, for a givenPARML ; ChlML increases when the MLD decreases andsurface irradiance increases. Our conclusion on self-shadingcontrol of ChlML in iron-fertilized regions of the SouthernOcean are in accordance with previous results of artificial ironfertilization experiments where self-shading was also invokedas the ultimate limit for chlorophyll biomass or inorganic car-bon drawdown [De Baar et al., 2005]. Our estimate of the crit-ical PARML corresponding to self-shading is 3.5 mol photonm�2 d�1. It represents likely an upper limit because we used15 days ChlML averaged over a wide area with blooms atdifferent stages of development. An estimate of the lower limitof PARML could be provided by local and short-termobservations. During European Iron Fertilization Experiment[Smetacek et al., 2012], the MLD was 97 ± 20 m and [Chl]increased up to 2.5 mg m�3, a concentration reachable consid-ering a critical value of PARML ¼ 2mol photon m�2 d�1
(Figure S4). Nelson and Smith [1991] pointed out the role ofself-shading in the context of iron fertilization of theSouthern Ocean. However, their quantitative conclusion thatthe stimulation of primary production is minor is now refutedby numerous observations.[14] The second phase of the seasonal cycle started concom-
itantly with the PAR(0�) decrease. This observation raises theissue whether light limitation could have triggered the declineof the bloom. Considering the threshold PARML ¼ 3:5molmol photon m�2 d�1 for the limitation of biomass by self-shading and the seasonal variations of PAR(0�) and MLD,we calculated the maximum [Chl] that could accumulate inthe mixed layer throughout the year (Figure 3b). The compar-ison with the observed values shows that the bloom stoppedwell before the maximum of [Chl] = 3 mg m�3 was reached.Consequently, light limitation (i.e., self-shading) could notbe the cause of the bloom decline. We note also that soon afterthe beginning of the decline of the bloom, the light-mixing re-gime became more favorable with PARML increased up to 6mol photon m�2 d�1, which is the highest value reached
throughout the season. This is due to the abrupt decrease oflight attenuation related to [Chl] decrease, which largely com-pensates the effect of the PAR(0�) decrease and of the MLDdeepening, on the gradient of light. The occurrence of more fa-vorable light conditions did not modify the decreasing trend ofChlML. Therefore, another factor aside from light caused theend of the bloom and the decrease of ChlML. It is possible thatthe occurrence of limiting concentrations of silicic acid for di-atoms [Mosseri et al., 2008] have decreased the growth ratebelow the loss rates (mortality and grazing), but alternative hy-pothesis favoring the increase of loss rate (e.g., grazing) can-not be ruled out. Physiological changes could also havealtered the fluorescence yield of the cells but, it is unlikely thatit could account for the large decrease of roughly 75% of theChlML observed between the second half of December andthe end of January. During this period of the year, the fluores-cence per unit of chlorophyll derived from satellite shows littlevariations [Westberry et al., 2013].[15] Following the collapse of the spring bloom steady
state ChlML were observed. A planktonic ecosystem hasemerged where significant phytoplankton growth balancedgrazing and sinking. As observed in similar fertilizedenvironments [Poulton et al., 2007; Quéguiner, 2013], thephytoplankton community could contain nonsiliceous organ-isms (e.g., Phaeocystis) and slow-growing diatoms. Thiscommunity was likely adapted to summer and fall environ-mental conditions (light and nutrients). Finally, in June,ChlML decreased coinciding with PARML ¼ 1mol photonm�2 d�1 which could be the irradiance threshold that limitsthe autumnal phytoplankton community.[16] Another approach that has been widely used to address
the role of light-mixing regime on dynamics of phytoplanktonbiomass is the comparison of theMLD to the critical depth Zcr,above which integrated gain and loss of biomass are balanced.Sverdrup [1953] derived an analytical expression linking theincident irradiance, Zcr, and the compensation light Ic requiredfor photosynthesis to balance loss rates. The latter was difficultto estimate because it must account for any loss terms and notonly for phytoplankton or community respiration [Smetacekand Passlow, 1990]. Nelson and Smith [1991] revisited
a b
Figure 3. Changes of chlorophyll in the mixed layer as a function of light during the seasonal cycle. (a) Variations ofPARMLand MLD-integrated chlorophyll in the Antarctic zone (AAZ). Error bars are confidence intervals (99%). Numberswithin circles denote the month of the year. (b) Variations of the mean concentration of chlorophyll observed in the mixedlayer in the Antarctic zone (open circles). Gray circles denote the calculated maximum concentration of chlorophyll that couldaccumulate if self-shading occurs, assuming the critical value of PARML ¼ 3:5mol photon m�2 d�1. Numbers within circlesdenote the month of the year.
BLAIN ET AL.: CHLOROPHYLL AND LIGHT IN SOUTHERN OCEAN
6371
Sverdrup’s theory for the Southern Ocean and proposed Ic = 3mol photon m�2 d�1 as the best empirical estimate. Morerecently, Ic = 1.4 mol photon m�2 d�1 was proposed for ahigh-chlorophyll region of the Southern Ocean [Venablesand Moore, 2010]. We have used this latter value of Ic as afirst estimate to compute Zcr in our region (Figure S5). Frommid-October to March, Zcr is well below the MLD suggestingthat the light-mixing regime is favorable for net growthof phytoplankton, confirming similar conclusions obtainedwith a different approach [Venables and Moore, 2010].The onset of the bloom should have occurred earlier thanmid-October. Due to the lack of elephant seal’s data for thisperiod, we have estimated Zcr based on incident lightand MLD climatology [de Boyer Montégut et al., 2004](Figure S5). At the spatial and temporal resolutions weconsidered, our observations did not contradict Sverdrup’smodel for the initiation of the bloom. However, a higher-resolution data set will be required to examine alternativeexplanations like the decoupling theory [Behrenfeld,2010], the role of mixing versus mixed layers [Chiswell,2011; Taylor and Ferrari, 2011] or of instabilities insurface currents [Mahadevan et al., 2012].
[17] Acknowledgments. This project was funded by the ANR, CNES,and IPEV. Analyses and visualizations of satellite chlorophyll used in thispaper were produced with the Giovanni online data system and developedand maintained by the NASA GES DISC. We also thank IngridObernosterer, Ian Salter, and Marina Levy for their careful reading of themanuscript and two anonymous reviewers for their constructive comments.[18] The Editor thanks two anonymous reviewers for their assistance in
evaluating this paper.
ReferencesAllison, D. B., D. Stramski, and B. G. Mitchell (2010), Seasonal andinterannual variability of particulate organic carbon within the SouthernOcean from satellite ocean color observations, J. Geophys. Res., 115,C06002, doi:10.1029/2009JC005347.
Arrigo, K. R., G. L. van Dijken, and S. Bushinsky (2008), Primary produc-tion in the Southern Ocean, 1997–2006, J. Geophys. Res., 113, C08004,doi:10.1029/2007JC004551.
Behrenfeld, M. J. (2010), Abandoning Sverdrup’s critical depth hypothesison phytoplankton blooms, Ecology, 91(4), 977–989.
Blain, S., et al. (2007), Effect of natural iron fertilisation on carbon seques-tration in the Southern Ocean, Nature, 446(7139), 1070–1075,doi:10.1038/nature05700.
Boyd, P. W. (2002), Environmental factors controlling phytoplanktonprocesses in the Southern ocean, J. Phycol., 38, 844–861.
Boyd, P. W., et al. (2007), Mesoscale iron enrichment experiments1993–2005: Synthesis and future directions, Science, 315, 612–617,doi:10.1126/science.1131669.
Charrassin, J.-B., et al. (2008), Southern Ocean frontal structure and sea-iceformation rates revealed by elephant seals, Proc. Natl. Acad. Sci., 105(33),11,634–11,639, doi:10.1073/pnas.0800790105.
Chiswell, S. (2011), Annual cycles and spring blooms in phytoplankton:Don’t abandon Sverdrup completely, Mar. Ecol. Prog. Ser., 443, 39–50,doi:10.3354/meps09453.
De Baar, H. J. W., et al. (2005), Synthesis of iron fertilization experiments:From the iron age in the age of enlightenment, J. Geophys. Res., 110,C09S16, doi:10.1029/2004GC002601.
De Boyer Montégut, C., G. Madec, A. S. Fischer, A. Lazar, and D. Iudicone(2004), Mixed layer depth over the global ocean: An examination ofprofile data and a profile-based climatology, J. Geophys. Res., 109,C12003, doi:10.1029/2004JC002378.
Fauchereau, N., A. Tagliabue, L. Bopp, and P. M. S. Monteiro (2011), The re-sponse of phytoplankton biomass to transient mixing events in the SouthernOcean, Geophys. Res. Lett., 38, L17601, doi:10.1029/2011GL048498.
Guinet, C., et al. (2013), Calibration procedures and first data set of SouthernOcean chlorophyll a profiles collected by elephant seal equipped with anewly developed CTD-fluorescence tags, Earth Syst. Sci. data, 5, 15–29,doi:10.5194/essd-5-15-2013.
Huisman, J. (1999), Population dynamics of light-limited phytoplankton:Microcosm experiments, Ecology, 80(1), 202–210, doi:10.1890/0012-9658(1999)080[0202:PDOLLP]2.0.CO;2.
Lovenduski, N. S., and N. Gruber (2005), Impact of the Southern AnnularMode on Southern Ocean circulation and biology, Geophys. Res. Lett.,32, L11603, doi:10.1029/2005GL022727.
Mahadevan, A., E. D’Asaro, C. Lee, and M. J. Perry (2012), Eddy-drivenstratification initiates North Atlantic spring phytoplankton blooms,Science, 337(6090), 54–58, doi:10.1126/science.1218740.
Marinov, I., A. Gnanadesikan, J. R. Toggweiler, and J. L. Sarmiento (2006),The Southern Ocean biogeochemical divide, Nature, 441, 964–967,doi:10.1038/nature04883.
Morel, A. (1991), Light and marine photosynthesis: A spectral modelwith geochemical and climatological implications, Prog.Oceanogr.,26, 263–306.
Mosseri, J., B. Quéguiner, L. Armand, and V. Cornet-Barthaux (2008),Impact of iron on silicon utilization by diatoms in the Southern Ocean:A case study of Si/N cycle decoupling in a naturally iron-enriched area,Deep Sea Res. Part II, 55(5–7), 801, doi:10.1016/j.dsr2.2007.12.003.
Nelson, D. M., and W. O. Smith (1991), Sverdrup revisited: Criticaldepths, maximum chlorophyll levels, and the control of SouthernOcean productivity by the irradiance-mixing regime, Limnol. Oceanogr.,36(8), 1650–1661.
Orsi, A. H., I. T. Whitworth, and J. W. D. Nowlin (1995), On the meridionalextent and fronts of the Antarctic Circumpolar Current, Deep Sea Res.Part I, 42(5), 641.
Pollard, R. T., et al. (2009), Southern Ocean deep-water carbon exportenhanced by natural iron fertilization, Nature, 457(7229), 577–580,doi:10.1038/nature07716.
Poulton, A. J., C. M. Moore, S. Seeyave, M. I. Lucas, S. Fielding, andP. Ward (2007), Phytoplankton community composition around theCrozet Plateau, with emphasis on diatoms and Phaeocystis, Deep SeaRes. Part II, 54, 2085–2015, doi:10.1016/j.dsr2.2007.06.010.
Quéguiner, B. (2013), Iron fertilization and the structure of planktonic com-munities in high nutrient regions of the Southern Ocean, Deep Sea Res.Part II, 90, 43–54, doi:10.1016/j.dsr2.2012.07.024.
Riley, G. A. (1956), Oceanography of Long Island Sound, 1952–1954.Production and utilization of organic matter, Bull. Bingham. Oceanogr.Collect., 15, 324–343.
Sallée, J. B., K. G. Speer, and S. R. Rintoul (2010), Zonally asymmetricresponse of the Southern Ocean mixed-layer depth to the SouthernAnnular Mode, Nat. Geosci., 3(4), 273–279, doi:10.1038/ngeo812.
Sigman, D. M., M. P. Hain, and G. H. Haug (2010), The polar ocean andglacial cycles in atmospheric CO2 concentration, Nature, 466(7302),47–55, doi:10.1038/nature09149.
Smetacek, V., and U. Passlow (1990), Spring bloom initiation andSverdrup’s critical-depth model, Limnol. Oceanogr., 35(1), 228–234.
Smetacek, V., et al. (2012), Deep carbon export from a Southern Ocean iron-fertilized diatom bloom, Nature, 487(7407), 313–319, doi:10.1038/nature11229.
Sverdrup, H. U. (1953), On conditions for the vernal blooming of phyto-plankton, J. Conseil Int.Explor. la Mer., 287–295.
Taylor, J. R., and R. Ferrari (2011), Shutdown of turbulent convection as anew criterion for the onset of spring phytoplankton blooms, Limnol.Oceanogr., 56(6), 2293–2307, doi:10.4319/lo.2011.56.6.2293.
Thomalla, S. J., N. Fauchereau, S. Swart, and P. M. S. Monteiro (2011),Regional scale characteristics of the seasonal cycle of chlorophyll inthe Southern Ocean, Biogeosciences, 8(10), 2849–2866, doi:10.5194/bg-8-2849-2011.
Venables, H., and C. M.Moore (2010), Phytoplankton and light limitation inthe Southern Ocean: Learning from high-nutrient, high-chlorophyll areas,J. Geophys. Res., 115, C02015, doi:10.1029/2009JC005361.
Westberry, T. K., M. J. Behrenfeld, A. J. Milligan, and S. C. Doney (2013),Retrospective satellite ocean color analysis of purposeful and naturalocean iron fertilization, Deep Sea Res. Part I, 73, 1–16, doi:10.1016/j.dsr.2012.11.010.
Xing, X., H. Clautre, S. Blain, F. D’Ortenzio, D. Antoine, J. Ras, andC. Guinet (2012), Quenching correction for in vivo chlorophyll fluores-cence acquired by autonomous platforms: A case study with instrumentedelephant seals in the Kerguelen region (Southern Ocean), Limnol.Oceanogr. Methods, 10, 483–495, doi:10.4319/lom.2012.10.483.
BLAIN ET AL.: CHLOROPHYLL AND LIGHT IN SOUTHERN OCEAN