27
@xaprb Instrumenting Systems For Arbitrary Observability Baron Schwartz - Velocity NY 2017
| Date post: | 21-Jan-2018 |
| Category: |
Technology |
| Upload: | vividcortex |
| View: | 32 times |
| Download: | 2 times |
@xaprb
Instrumenting Systems For Arbitrary ObservabilityBaron Schwartz - Velocity NY 2017

@xaprb
The Boring StuffFounder of VividCortex, I wrote some stuff
@xaprb on twitter, you know what to do
linkedin.com/in/xaprb while you still can
xaprb.com
Slides will be posted
2
@xaprb
What is Observability?● Observability● Instrumentation● Telemetry● Analytics● Monitoring
3
@xaprb
Useful Types of Instrumentation● Events● Logs● Metrics● Traces
4
@xaprb
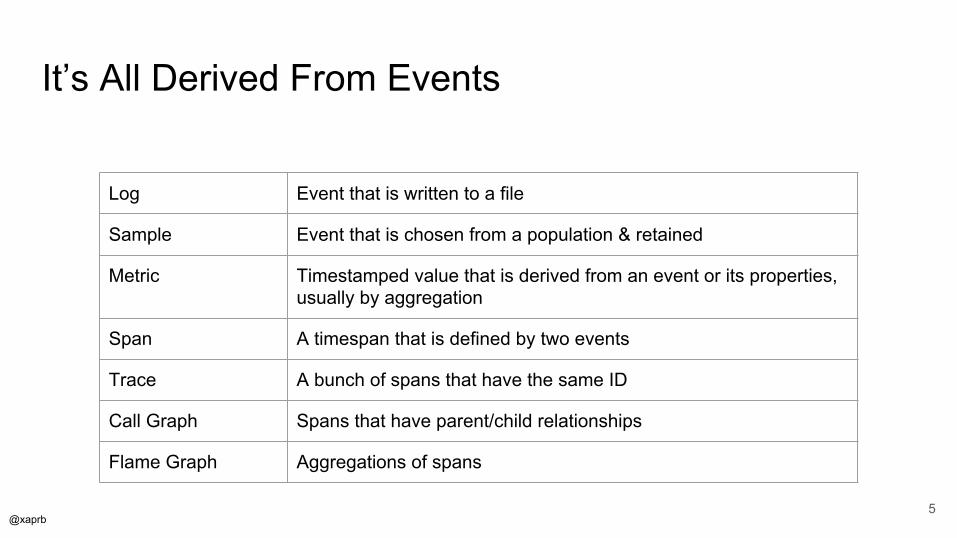
It’s All Derived From Events
Log Event that is written to a file
Sample Event that is chosen from a population & retained
Metric Timestamped value that is derived from an event or its properties, usually by aggregation
Span A timespan that is defined by two events
Trace A bunch of spans that have the same ID
Call Graph Spans that have parent/child relationships
Flame Graph Aggregations of spans
5

@xaprb
Tradeoffs● Metrics are compact, aggregated,
aggregatable, efficient, but can’t be disaggregated.
● Logs/events are full fidelity but relatively expensive at full capture.
● Samples are biased and ignore/miss lots of crucial things.
6
@xaprb
Metrics or Events?Many folks have love-hate relationships with metrics. Some prefer events.
● Some people log lots of things that are just “this happened” signals that are better as metrics.
● But some of the most valuable insights you can get from events require you to aggregate them into metrics first!
7
@xaprb
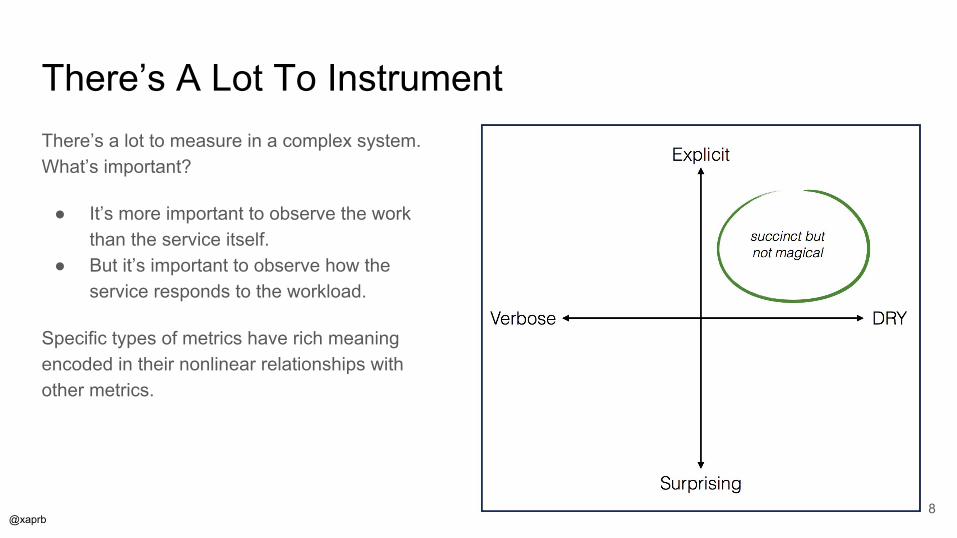
There’s A Lot To InstrumentThere’s a lot to measure in a complex system. What’s important?
● It’s more important to observe the work than the service itself.
● But it’s important to observe how the service responds to the workload.
Specific types of metrics have rich meaning encoded in their nonlinear relationships with other metrics.
8
@xaprb
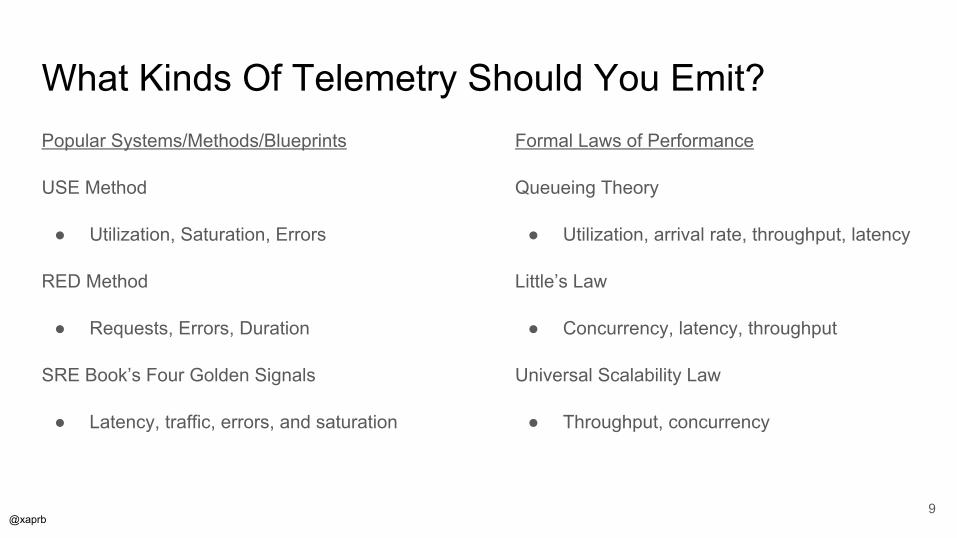
What Kinds Of Telemetry Should You Emit?Popular Systems/Methods/Blueprints
USE Method
● Utilization, Saturation, Errors
RED Method
● Requests, Errors, Duration
SRE Book’s Four Golden Signals
● Latency, traffic, errors, and saturation
Formal Laws of Performance
Queueing Theory
● Utilization, arrival rate, throughput, latency
Little’s Law
● Concurrency, latency, throughput
Universal Scalability Law
● Throughput, concurrency
9
@xaprb
The Zen of PerformanceThe unifying concept in observing a service is two perspectives on requests.
External (customer’s) view is singular:
● Request, and its latency and success.
Internal (operator’s) view is over a population (workload):
● Requests and their latency distribution, rates, and concurrency.● System resources/components and their throughput, utilization, and backlog.
10

@xaprb
Begin With A Process ListIt’s more valuable to focus on work than resources. Most server/service systems have a process list or table.
● UNIX: `ps` shows the process table● Apache: ServerStatus● MySQL: SHOW PROCESSLIST● PostgreSQL: pg_stat_activity● MongoDB: db.currentOp()● Your service can too, it’s pretty simple
11
@xaprb
Process Lists Are Always Pretty SimilarThe request itself
● SQL, commandline, etc
State of request
● Working or waiting? Where? Status/State?● Stages of execution
Timings
● Timestamp of start; ideally stage timings too
12
@xaprb
The Service Layer Process List at VividCortexAt VividCortex, we baked a process list into all of our APIs. It has an HTTP API and makes it simple to see what’s in-flight across our whole infra.
The code is simple and open source: github.com/VividCortex/pm
It’s easy to use. Just hook it into your API framework/boilerplate, and you’ll have a process list for free in all your APIs. You can optionally do extra stuff like setting status of requests. Easy.
https://www.vividcortex.com/blog/2014/11/06/inside-distributed-architecture/
13
@xaprb
The Process List Is FoundationalIf you believe in instrumenting the work your systems are doing, the process list is the central place to start.
● The process list itself is the current state of the work.● The simplest implementation is really easy: just instrument begin/end.● State changes to individual processes are events.● These events can be sent as messages to be logged or turned into metrics.● Observers can subscribe to events/messages.● You can poll the list and generate historical metrics.
You can make this more sophisticated (instrument function enter/exit, etc)...
14
@xaprb
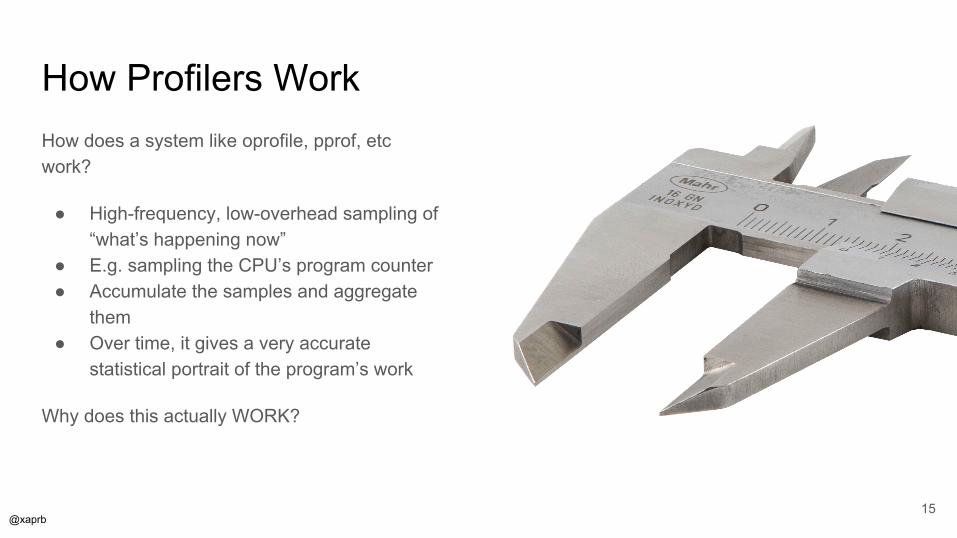
How Profilers WorkHow does a system like oprofile, pprof, etc work?
● High-frequency, low-overhead sampling of “what’s happening now”
● E.g. sampling the CPU’s program counter● Accumulate the samples and aggregate
them● Over time, it gives a very accurate
statistical portrait of the program’s work
Why does this actually WORK?
15
@xaprb
Little’s law relates concurrency, residence time, and throughput.
N=RX or L= W
It’s simple and intuitive. Example:
● Take 1000 samples of a program during 1 sec
● You see funcA 832 times and funcB 418 times
● funcA is called 25 times, funcB is called 800 times
● What’s the hot spot? Where’s most time spent? Which func is slower?
Little’s Law
16
@xaprb
Instrumenting Code Can Be A DragCode shouldn’t look like you pair-programmed with an APM vendor.
Runtimes and instrumented kernels are awesome.
Maybe you should just buy Dynatrace?
17
@xaprb
Instrumentation Isn’t AnswersYou still need to turn the telemetry into actionable insights. Analytics is hard.
18

@xaprb
Metrics Can Be PowerfulThe ROI on metrics can be surprisingly high.
Aggregation into specific, carefully chosen metrics can give powerful insights.
19
@xaprb
Example: Linux’s /proc/diskstatsThe data source for iostat. Docs: https://www.mjmwired.net/kernel/Documentation/iostats.txt
● IOPS completed● Total non-idle time (“# of milliseconds spent doing I/Os”)● Sum of all ops’ latencies (“weighted time”)
What can we get from this? A LOT.
20
@xaprb
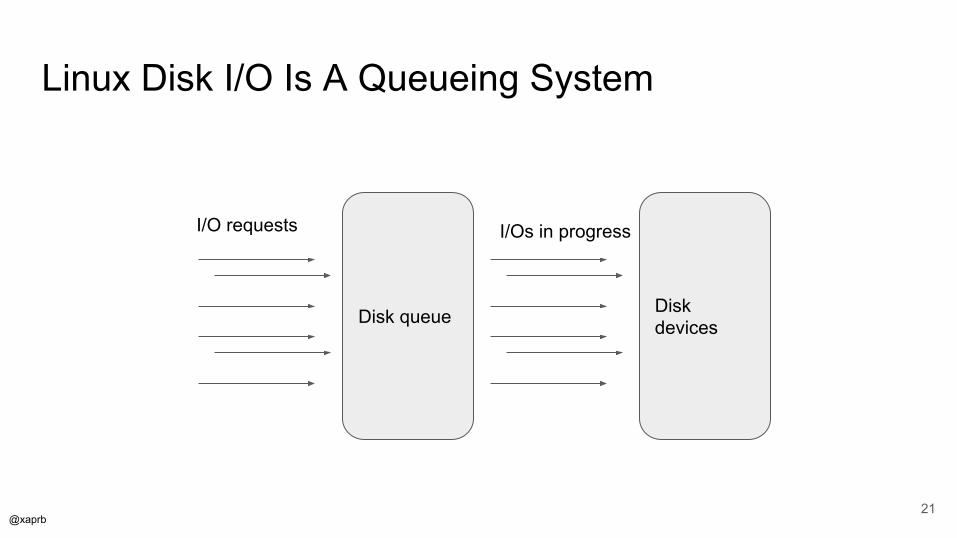
Linux Disk I/O Is A Queueing System
Disk queue
I/O requests I/Os in progress
Disk devices
21

@xaprb
Derived Insights From DiskstatsConcurrency (avgqu-sz)
● Weighted time / interval
Throughput
● I/Os completed / interval
Utilization (%util)
● Total non-idle time / interval
Latency (await) (including queue time)
● Weighted time / completions
Service time (svctm)
● Utilization / completions*
* The utilization law is just Little’s Law, = S
22

@xaprb
Imitation = FlatteryIf you want the most value for the least effort, a simplified clone of /proc/diskstats isn’t the worst thing to build.
See https://www.xaprb.com/blog/2011/10/06/fundamental-performance-and-scalability-instrumentation/
23

@xaprb
More Powerful Metrics RelationshipsQueueing theory explains what happens as utilization increases.
The relationship between utilization and response time is decidedly nonlinear!
24

@xaprb
Even MoreThe Universal Scalability Law explains the relationship between concurrency, throughput, and expansion of service time.
It’s easy to see when you’re approaching the point of diminishing returns! Just plot concurrency vs throughput.
The USL explains why and what to fix.
The USL, queueing theory, etc give you a deeper understanding of how your systems react to the workload you give them.
25

@xaprb
If You Like To Nerd Out...
26
Your artisanal hand-brewed free copy is waiting at vividcortex.com/resources
@xaprb
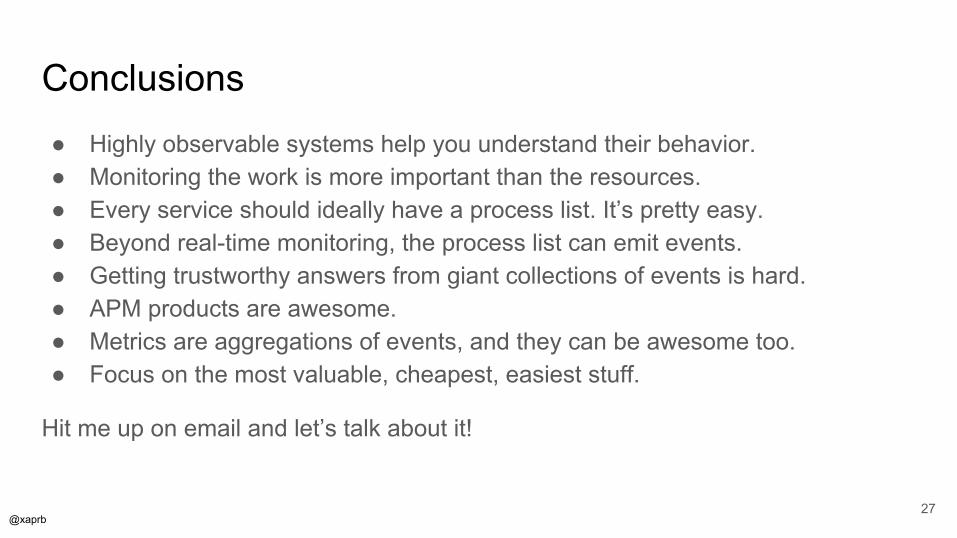
Conclusions● Highly observable systems help you understand their behavior.● Monitoring the work is more important than the resources.● Every service should ideally have a process list. It’s pretty easy.● Beyond real-time monitoring, the process list can emit events.● Getting trustworthy answers from giant collections of events is hard.● APM products are awesome.● Metrics are aggregations of events, and they can be awesome too.● Focus on the most valuable, cheapest, easiest stuff.
Hit me up on email and let’s talk about it!
27


