42
1 Insurance Association of Turkey & Turkish Insurance Market 18 April 2016
| Date post: | 08-Sep-2018 |
| Category: |
Documents |
| Upload: | truongtuyen |
| View: | 231 times |
| Download: | 0 times |
1
Insurance Association of
Turkey &
Turkish Insurance Market
18 April 2016
2
Turkish Insurance Market: An
Overview

3
As of today;
37Non Life
1 Reinsurance
4 Life
19 Life and
Pension
A total of 61 companies are
actively operating
Number of Insurance Companies

4
Company employees 19.353
75.000employedMore than
Brokers 119Loss adjusters 1 305
Agents 15 587
Number of employees
5
Prim Üretimi 2010 – 2015
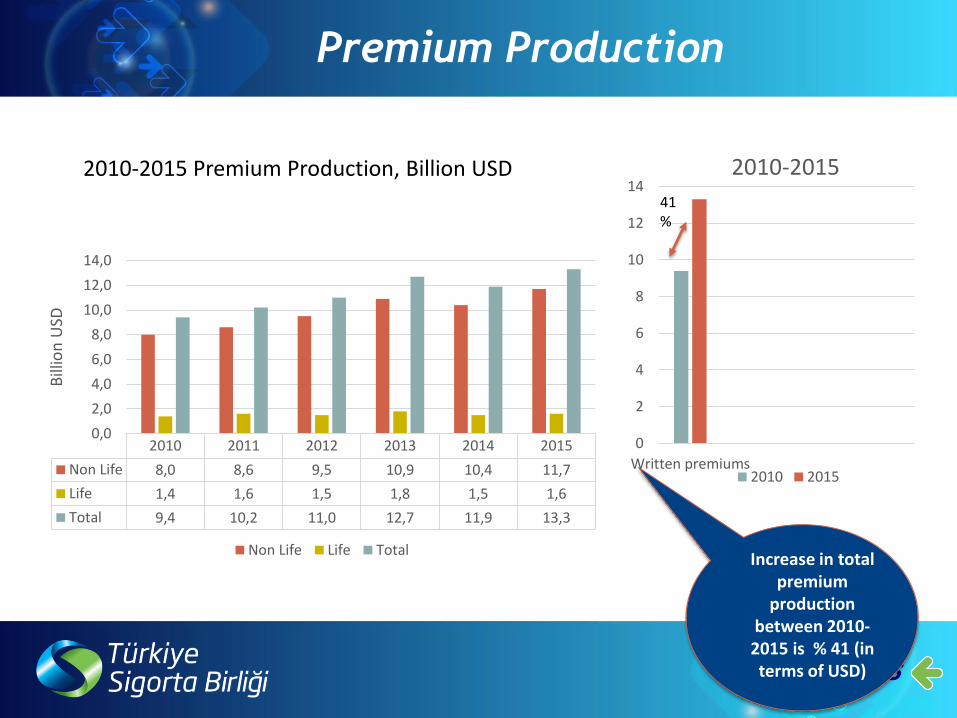
Increase in total premium
productionbetween 2010-2015 is % 41 (in terms of USD)
Premium Production
2010 2011 2012 2013 2014 2015
Non Life 8,0 8,6 9,5 10,9 10,4 11,7
Life 1,4 1,6 1,5 1,8 1,5 1,6
Total 9,4 10,2 11,0 12,7 11,9 13,3
0,0
2,0
4,0
6,0
8,0
10,0
12,0
14,0
Bill
ion
USD
Non Life Life Total
0
2
4
6
8
10
12
14
Written premiums
2010-2015
2010 2015
2010-2015 Premium Production, Billion USD
41%
Size of Private Pension Funds in Turkey
6
0
2
4
6
8
10
12
14
16
18
2010 2011 2012 2013 2014 2015 2016April
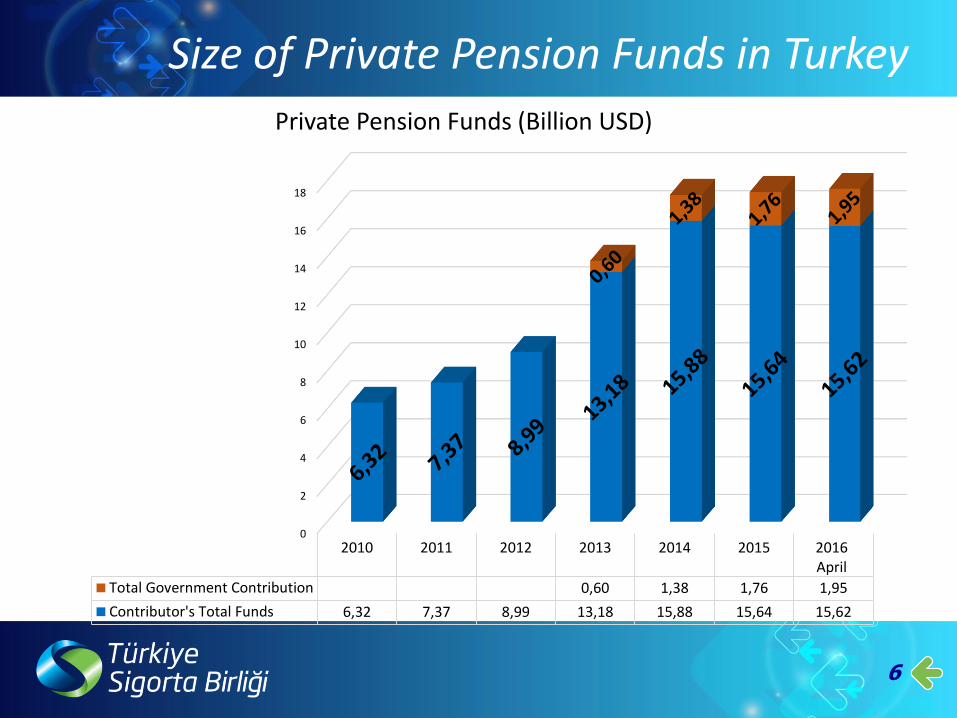
Total Government Contribution 0,60 1,38 1,76 1,95
Contributor's Total Funds 6,32 7,37 8,99 13,18 15,88 15,64 15,62
Private Pension Funds (Billion USD)
7
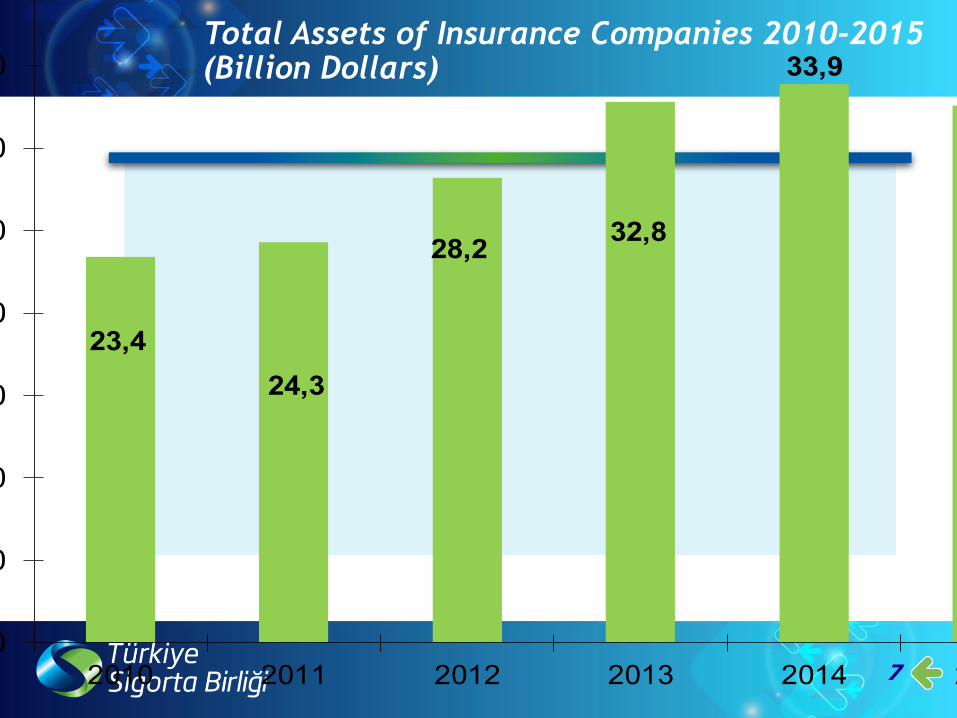
Total Assets of Insurance Companies 2010-2015 (Billion Dollars)
23,4
24,3
28,232,8
33,9
32,6
0,0
5,0
10,0
15,0
20,0
25,0
30,0
35,0
40,0
2010 2011 2012 2013 2014 2015
Ass
ets
(bill
ion d
olla
rs)
Assets
Assets
8
0
10
20
30
40
50
60
70
80
20102011
20122013
2014
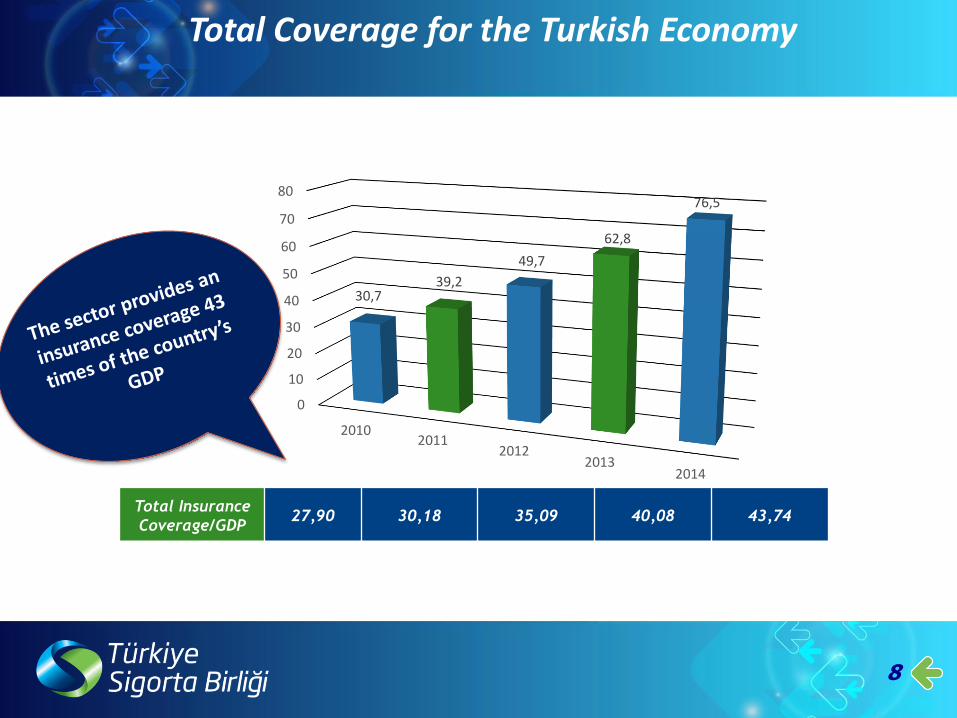
30,739,2
49,7
62,8
76,5
Total Insurance
Coverage/GDP27,90 30,18 35,09 40,08 43,74
Verilen Toplam Teminat Tutarı (Trilyon TL)
Total Coverage for the Turkish Economy
9
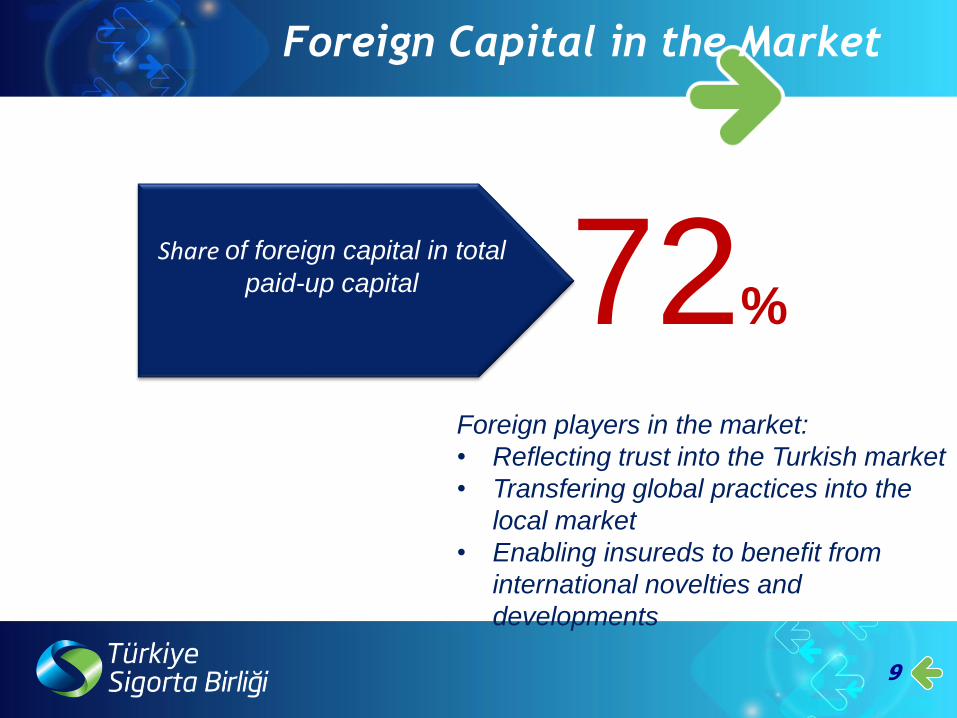
72%
Foreign players in the market:
• Reflecting trust into the Turkish market
• Transfering global practices into the
local market
• Enabling insureds to benefit from
international novelties and
developments
Foreign Capital in the Market
Share of foreign capital in total
paid-up capital

10
Prim Üretimi Dağılımı (2015)
ACCIDENT4% HEALTH/SICKNESS
11%
OWN DAMAGE18%
MARINE2%
FIRE/NATURAL FORCES
14%GENERAL LOSES
MTPL24%
GENERAL LIABILITY2%
OTHER3%
LlFE12%
GWP broken down by branches
TSB, 2015
11
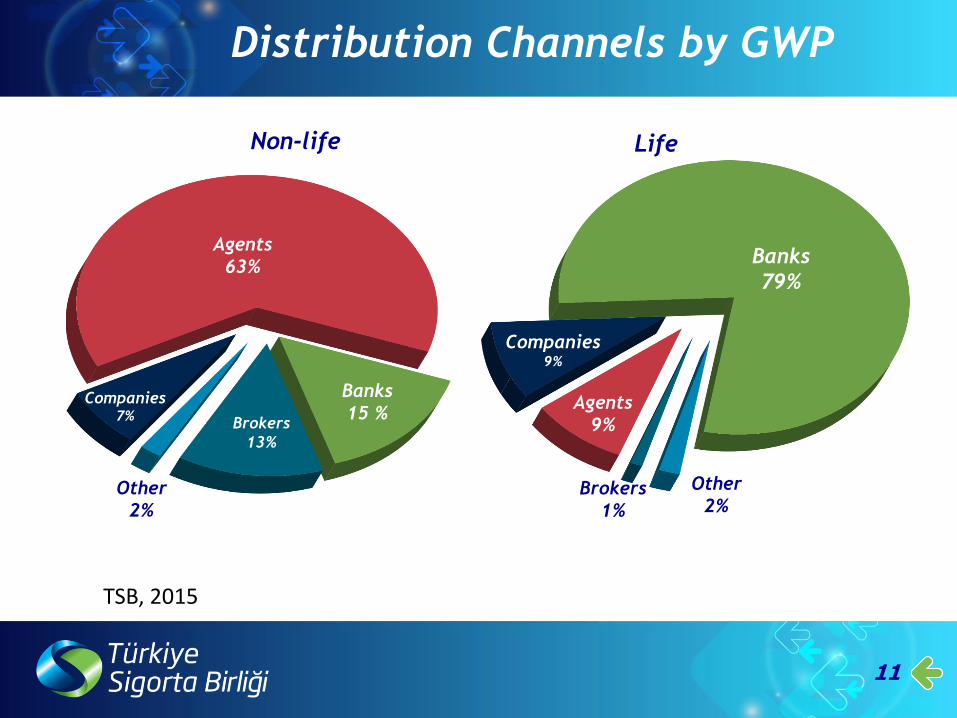
Dağıtım Kanalları (2015)
Agents
63%
Banks
15 %Brokers
13%
Other
2%
Companies7%
Banks
79%
Brokers
1%
Other
2%
Agents
9%
Companies9%
Non-life Life
Distribution Channels by GWP
TSB, 2015
12
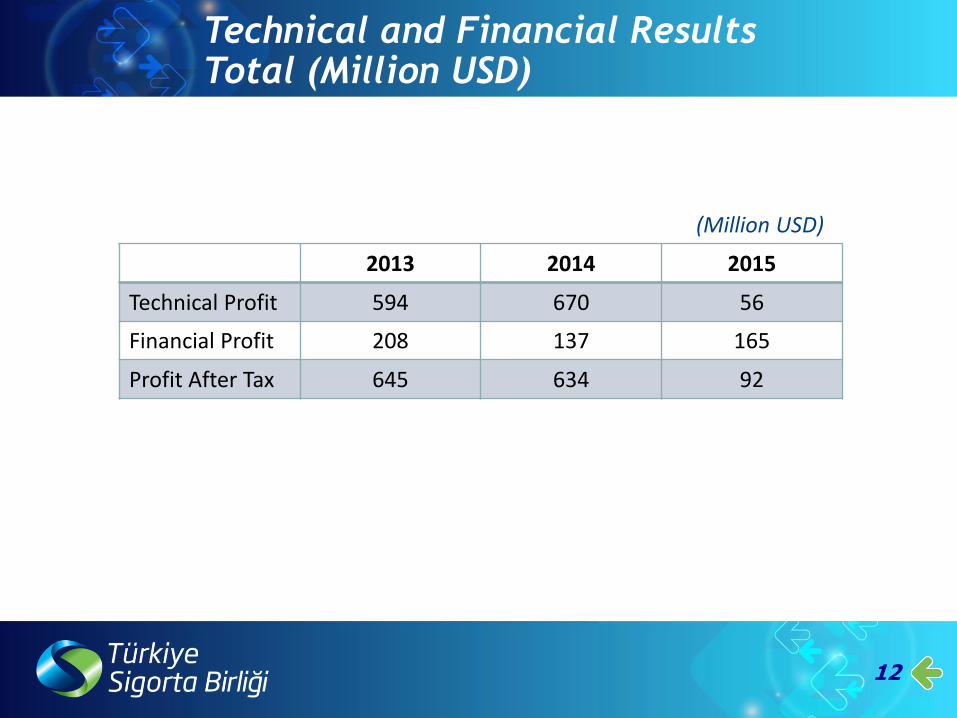
Technical and Financial ResultsTotal (Million USD)
2013 2014 2015
Technical Profit 594 670 56
Financial Profit 208 137 165
Profit After Tax 645 634 92
(Million USD)
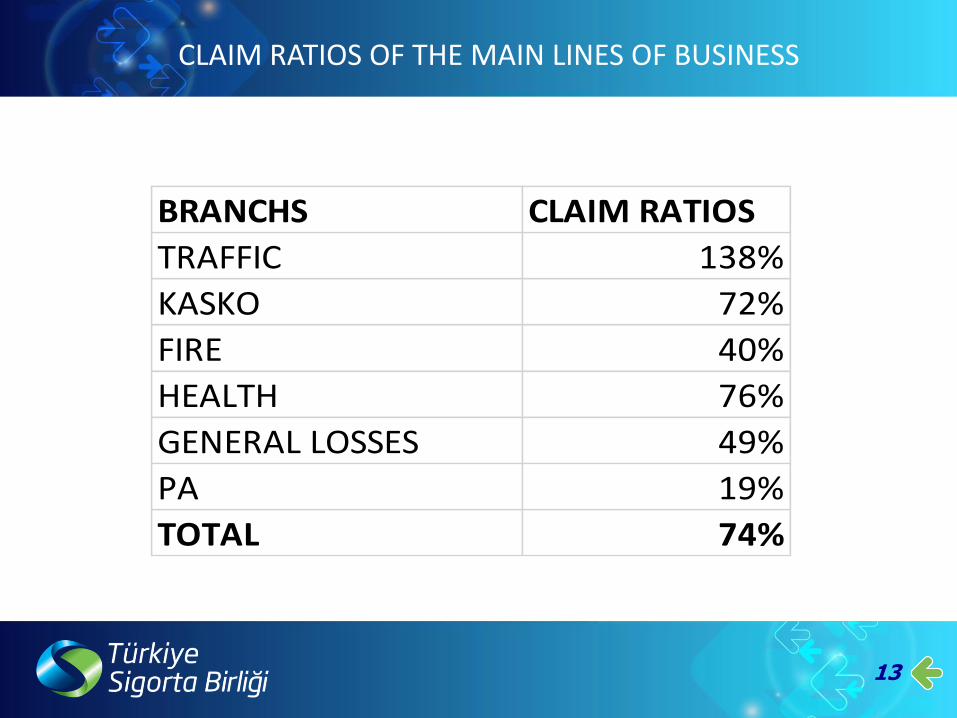
CLAIM RATIOS OF THE MAIN LINES OF BUSINESS
13
BRANCHS CLAIM RATIOS
TRAFFIC 138%
KASKO 72%
FIRE 40%
HEALTH 76%
GENERAL LOSSES 49%
PA 19%
TOTAL 74%
14
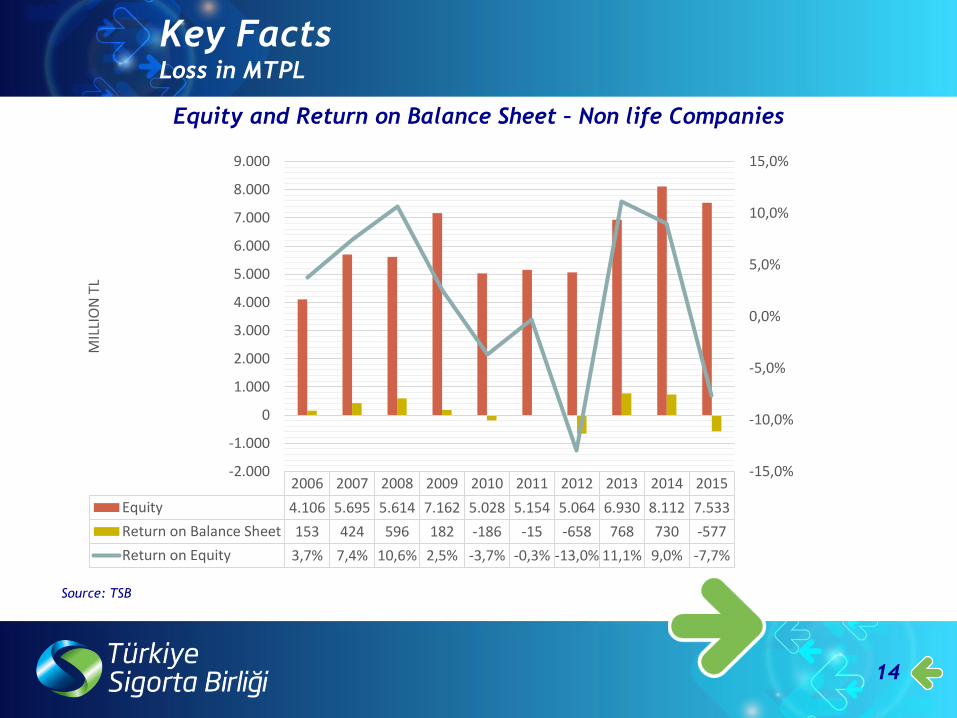
2006 2007 2008 2009 2010 2011 2012 2013 2014 2015
Equity 4.106 5.695 5.614 7.162 5.028 5.154 5.064 6.930 8.112 7.533
Return on Balance Sheet 153 424 596 182 -186 -15 -658 768 730 -577
Return on Equity 3,7% 7,4% 10,6% 2,5% -3,7% -0,3% -13,0% 11,1% 9,0% -7,7%
-15,0%
-10,0%
-5,0%
0,0%
5,0%
10,0%
15,0%
-2.000
-1.000
0
1.000
2.000
3.000
4.000
5.000
6.000
7.000
8.000
9.000
MIL
LIO
NTL
Equity and Return on Balance Sheet – Non life Companies
Key FactsLoss in MTPL
Source: TSB
15
Prospects for the
Turkish Insurance
Sector:
Turkish Insurance Sector Vision
16
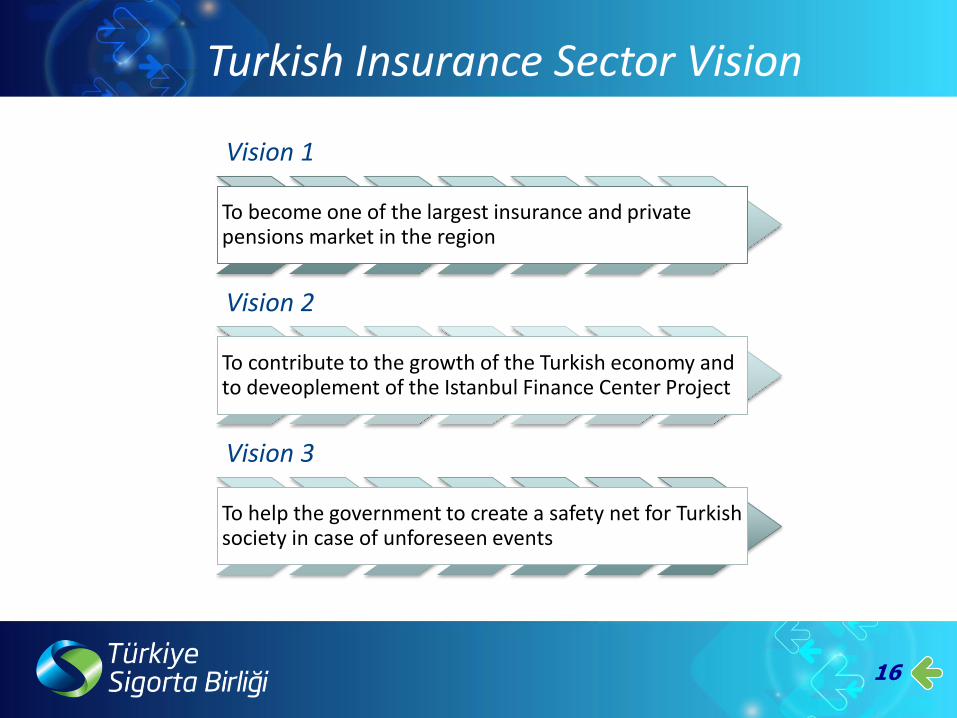
Vision 1
To become one of the largest insurance and privatepensions market in the region
Vision 2
To contribute to the growth of the Turkish economy andto deveoplement of the Istanbul Finance Center Project
Vision 3
To help the government to create a safety net for Turkishsociety in case of unforeseen events
SEKTÖR PRIM ÜRETIMI (MILYAR TL)
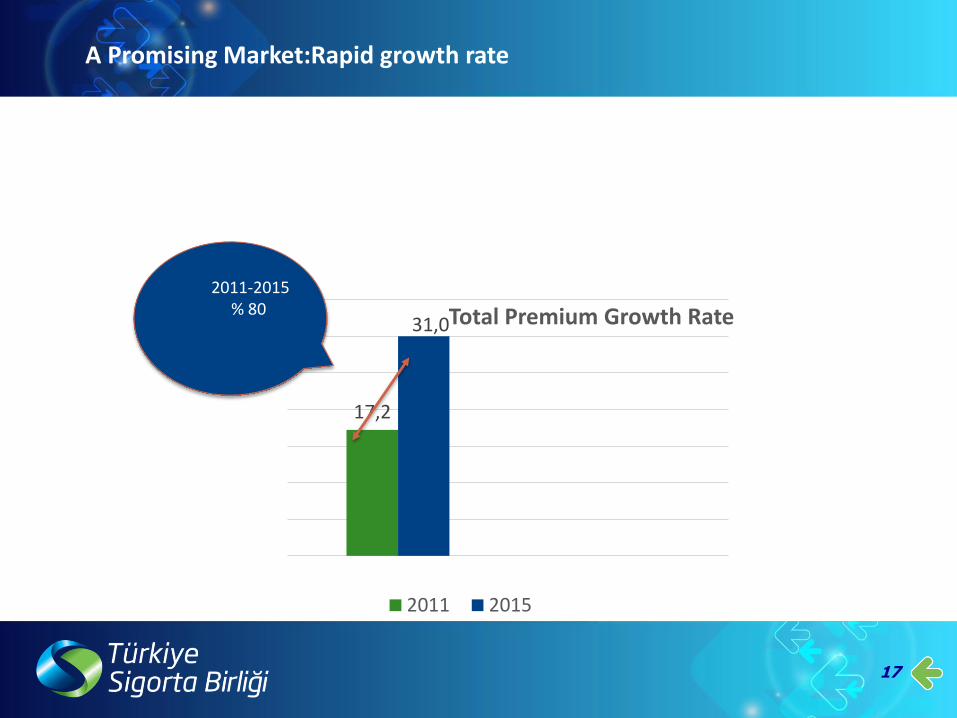
A Promising Market:Rapid growth rate
17
17,2
31,0Total Premium Growth Rate
2011 2015
2011-2015 % 80
18
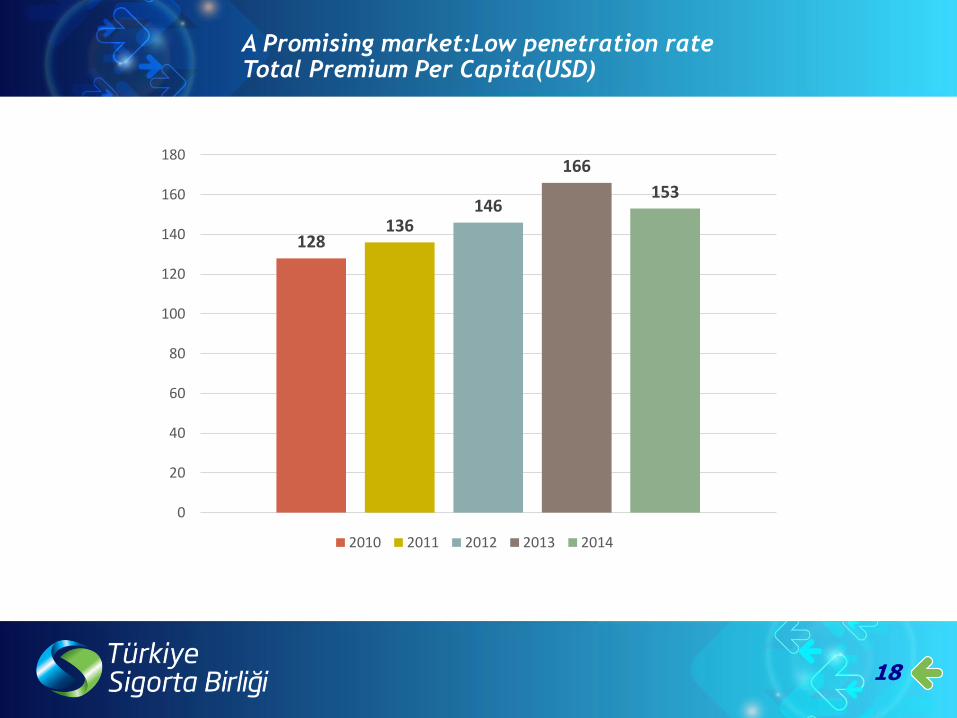
A Promising market:Low penetration rateTotal Premium Per Capita(USD)
128136
146
166
153
0
20
40
60
80
100
120
140
160
180
2010 2011 2012 2013 2014

19
Life/Non-life PER PREMIUM PRM /GDP
Developed Countries 3.666 $ 8,15%
Emerging Countries 135 $ 2,71%
World 662 $ 6,17%
Turkey 153 $ 1,4 %
Oranı – Sektörün Büyüme Potansiyeli
WORLD TURKEY
Source : SIGMA 2014
LIFE 55%
NON LIFE45%
LIFE 12%
NON-LIFE…
A Promising market:Low penetration rate

20
A Promising market:Low penetration RateOECD COUNTRIES :PRIVATE PENSIONS /GDP
Source: OECD Global Pension Statistics
4.9
36,6
Bireysel Emeklilik Sistemi Katılım Oranı – Sektörün Büyüme Potansiyeli
21
Fırsat Sunan Demografik Yapı / İletişime Açık Genç Nüfus
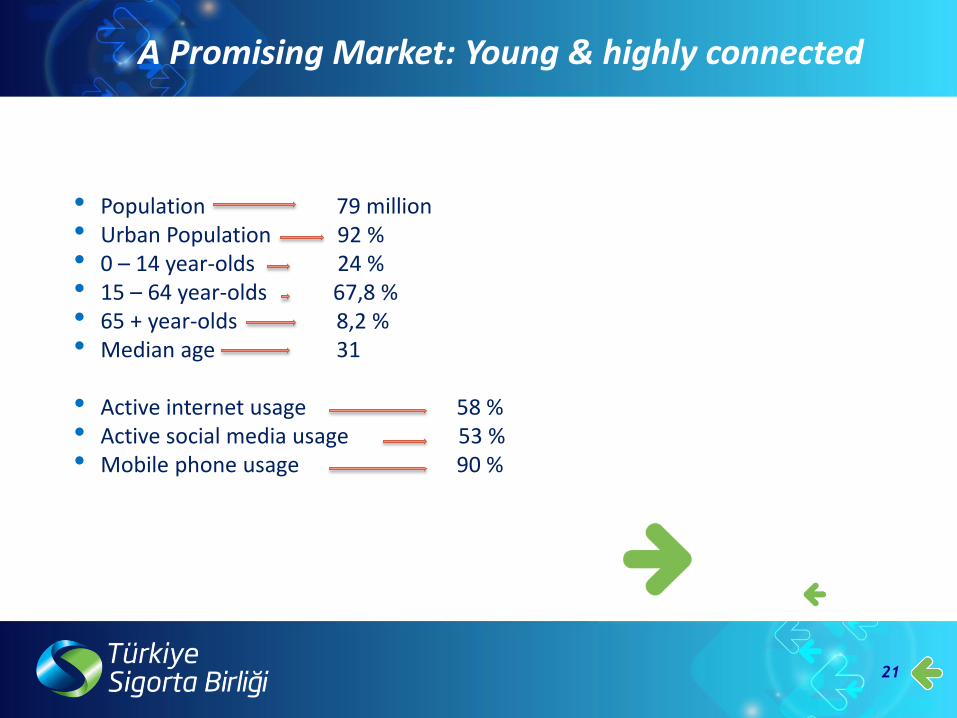
• Population 79 million• Urban Population 92 %• 0 – 14 year-olds 24 %• 15 – 64 year-olds 67,8 %• 65 + year-olds 8,2 %• Median age 31
• Active internet usage 58 %• Active social media usage 53 %• Mobile phone usage 90 %
A Promising Market: Young & highly connected
22
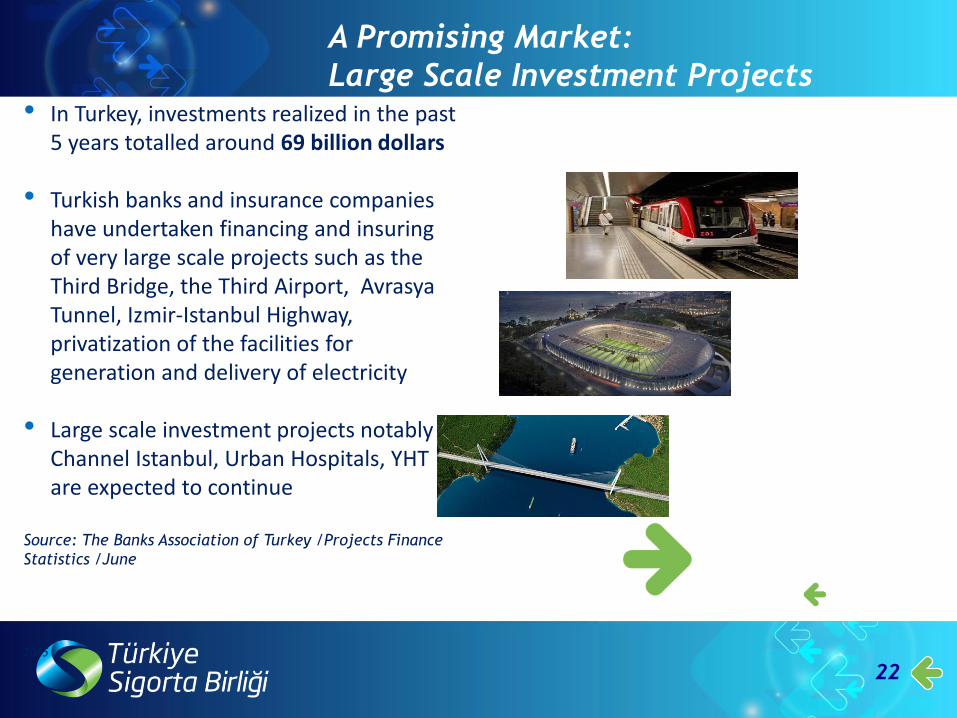
Büyük Yatırım Projeleri• In Turkey, investments realized in the past5 years totalled around 69 billion dollars
• Turkish banks and insurance companieshave undertaken financing and insuringof very large scale projects such as theThird Bridge, the Third Airport, Avrasya Tunnel, Izmir-Istanbul Highway, privatization of the facilities forgeneration and delivery of electricity
• Large scale investment projects notablyChannel Istanbul, Urban Hospitals, YHT are expected to continue
Source: The Banks Association of Turkey /Projects Finance
Statistics /June
2015
A Promising Market:
Large Scale Investment Projects
23
KOBİ’lerin SigortalanmasıIn Turkey, SMEs
constituting 99,77% of total enterprises .
account for ;
• 78% of total employment;
• 55% of added value;
• 65,5% of total sales;
• 50% of total investments;
• 60,1% of total exports ;
• 50% of SMEs, operate without an insurance
• Insuring SMEs is a significant opportunity for insurance Market.
Source: Data of Ministry of Science, Industry and Technology.
A Promising Market: SME’S

24
• The rules and regulations are in compliance with the EU norms and thesector is highly regulated and supervised sector.
• The authority and the association have been working together to achievecompliance with the Solvency 2 regulations
Sonuç
A Promising Market:Sound and ClearFinancials
25
Pazarlamaya Yönelik FırsatlarTurkey present a promising market with opportunities to all local and foreign investors considering these parameters.
. Insurance companies can reach out to consumers who lack insurance awarenessand to young people by using:
• Digital marketing tools
• Designing and offering tailor-made products &
• Putting customer satisfaction in the center
Market Opportunities
26
Yeni Ürünlere Yönelik FırsatlarTurkish Insurance Market continues its development with new products:
• Regulations have been enacted related to annuity products
• A model on complementary health insurance is on its way
• Legal protection insurance for employees is in the governmentprogramme in 2016
• Despite its potential, surety insurance is still a neglected branch
• Demand for products such as long term care insurance is expected torise as a result of socio-cultural changes in the society particularşyurbanisation, cultural and demographic changes
Market Opportunities
27
Motor Third Party
Liability Insurance
(MTPL)
28
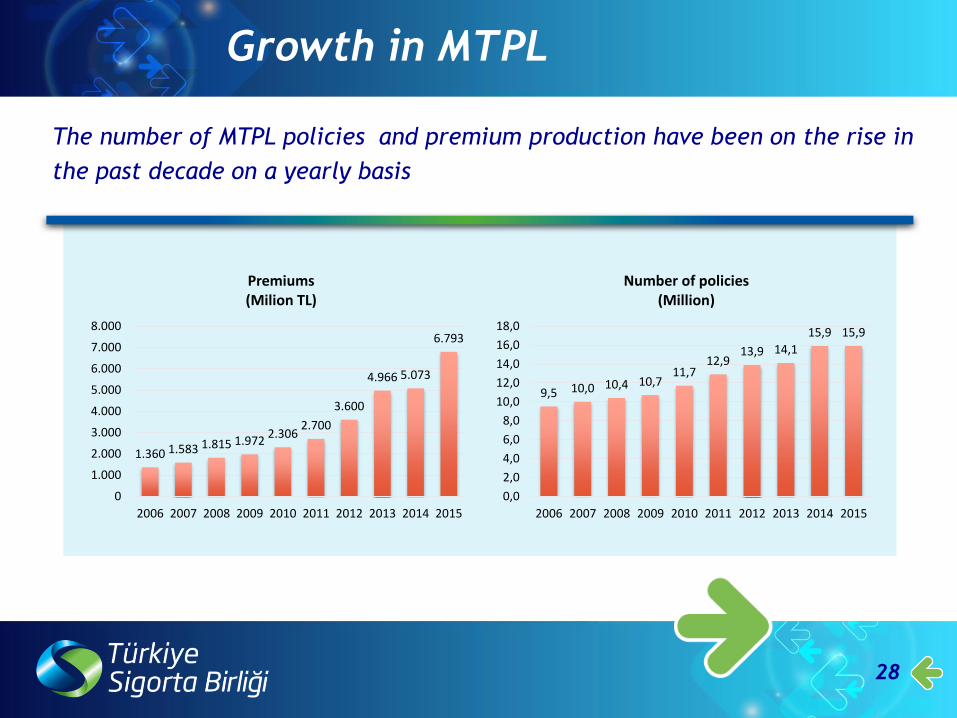
Growth in MTPL
The number of MTPL policies and premium production have been on the rise in
the past decade on a yearly basis
1.360 1.583 1.815 1.9722.306
2.700
3.600
4.966 5.073
6.793
0
1.000
2.000
3.000
4.000
5.000
6.000
7.000
8.000
2006 2007 2008 2009 2010 2011 2012 2013 2014 2015
Premiums(Milion TL)
9,5 10,0 10,4 10,711,7
12,913,9 14,1
15,9 15,9
0,0
2,0
4,0
6,0
8,0
10,0
12,0
14,0
16,0
18,0
2006 2007 2008 2009 2010 2011 2012 2013 2014 2015
Number of policies(Million)
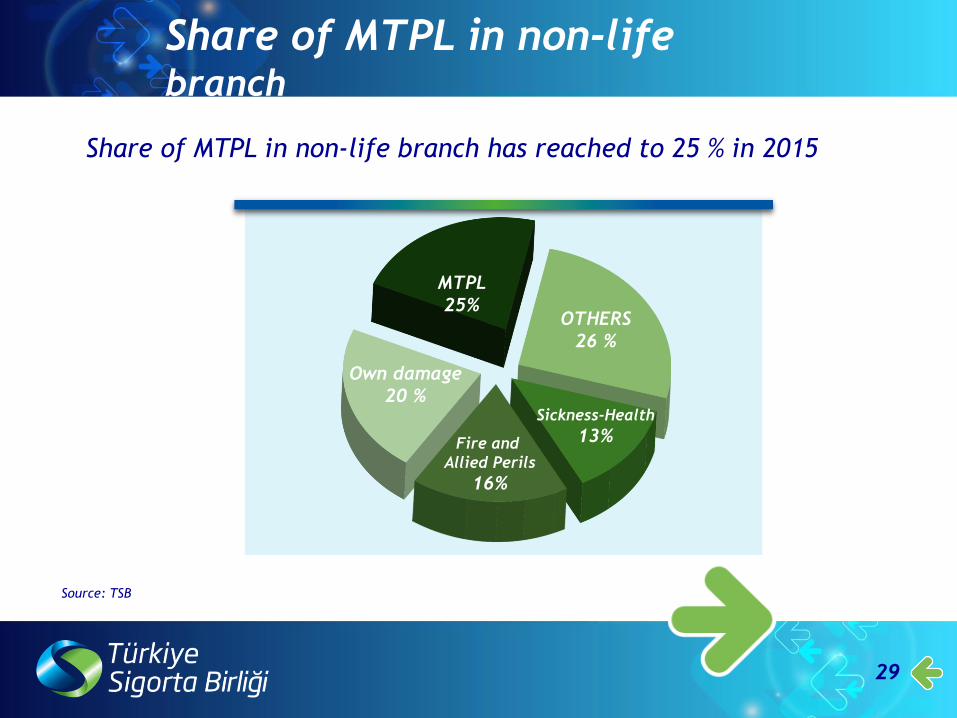
Share of MTPL in non-life branch
Share of MTPL in non-life branch has reached to 25 % in 2015
29
MTPL
25%
Own damage
20 %
OTHERS
26 %
Sickness-Health
13%Fire and
Allied Perils
16%
Source: TSB

30
Loss in MTPL
In the last decade, companies reported loss in MTPL for each and every
single period
Total amount of loss : 7 billion TL
-119 -245 -467
-296 -587 -462
-1.285
-654 -885
-2.345 -2.500
-2.000
-1.500
-1.000
-500
0
Teknik Zarar
Source: TSB
31
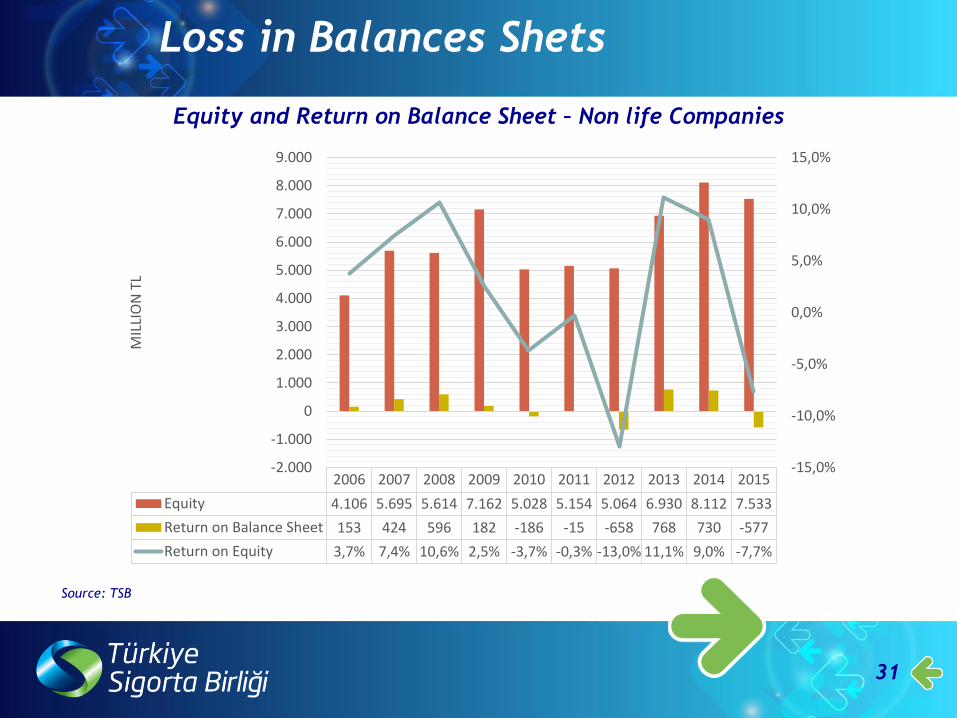
2006 2007 2008 2009 2010 2011 2012 2013 2014 2015
Equity 4.106 5.695 5.614 7.162 5.028 5.154 5.064 6.930 8.112 7.533
Return on Balance Sheet 153 424 596 182 -186 -15 -658 768 730 -577
Return on Equity 3,7% 7,4% 10,6% 2,5% -3,7% -0,3% -13,0% 11,1% 9,0% -7,7%
-15,0%
-10,0%
-5,0%
0,0%
5,0%
10,0%
15,0%
-2.000
-1.000
0
1.000
2.000
3.000
4.000
5.000
6.000
7.000
8.000
9.000
MIL
LIO
NTL
Equity and Return on Balance Sheet – Non life Companies
Loss in Balances Shets
Source: TSB

32
Reasons for Making Loss in
MTPL
33
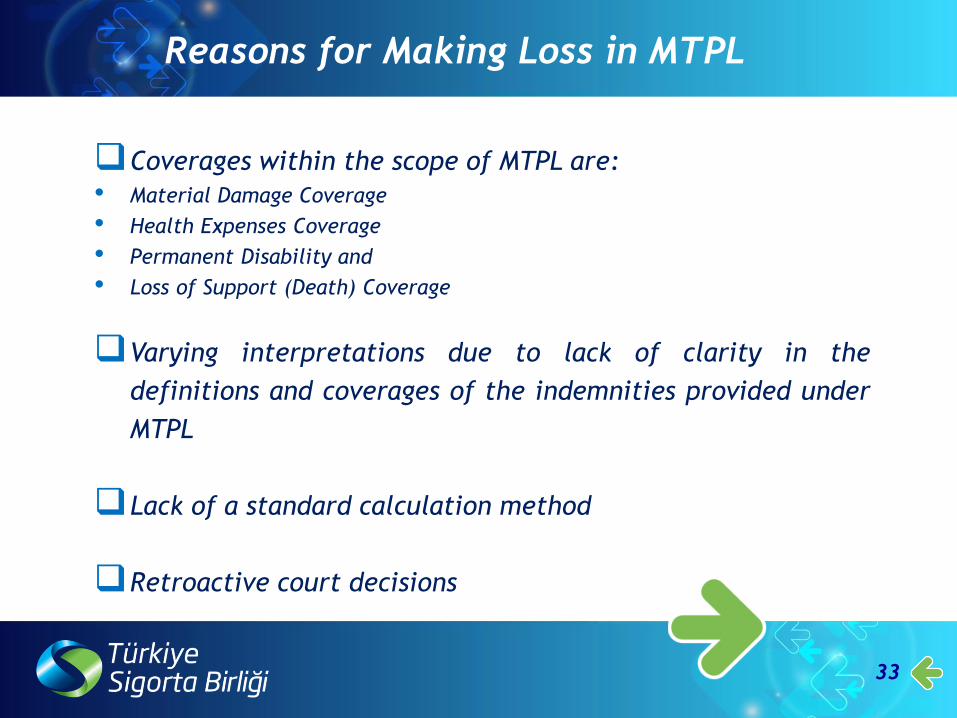
Reasons for Making Loss in MTPL
Coverages within the scope of MTPL are:
• Material Damage Coverage
• Health Expenses Coverage
• Permanent Disability and
• Loss of Support (Death) Coverage
Varying interpretations due to lack of clarity in the
definitions and coverages of the indemnities provided under
MTPL
Lack of a standard calculation method
Retroactive court decisions
34
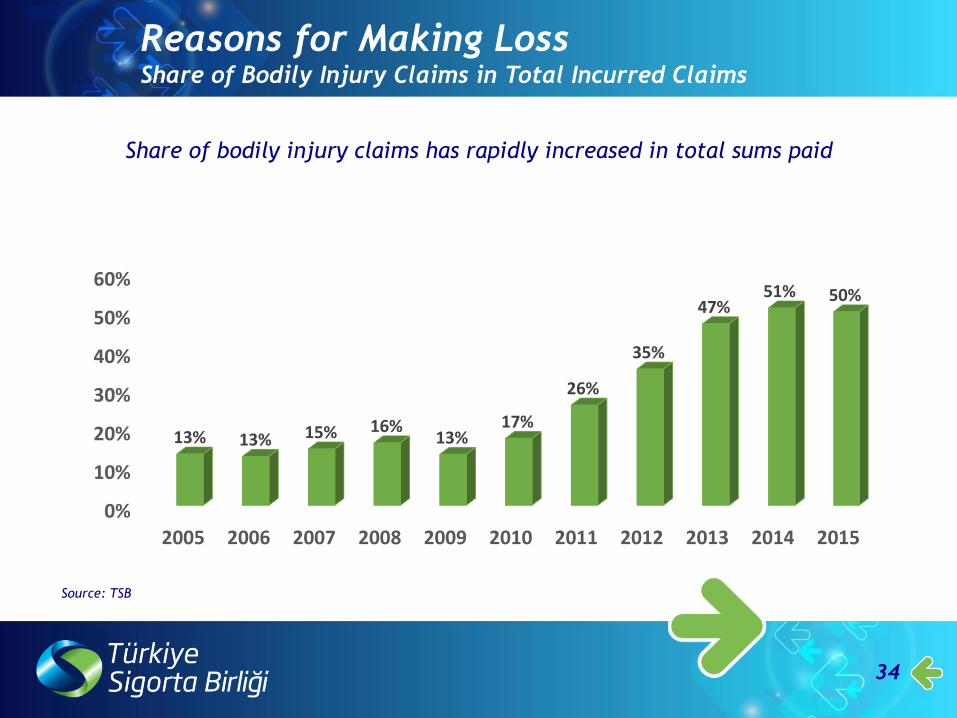
Reasons for Making LossShare of Bodily Injury Claims in Total Incurred Claims
Share of bodily injury claims has rapidly increased in total sums paid
0%
10%
20%
30%
40%
50%
60%
2005 2006 2007 2008 2009 2010 2011 2012 2013 2014 2015
13% 13% 15% 16%13%
17%
26%
35%
47%51% 50%
Source: TSB
35
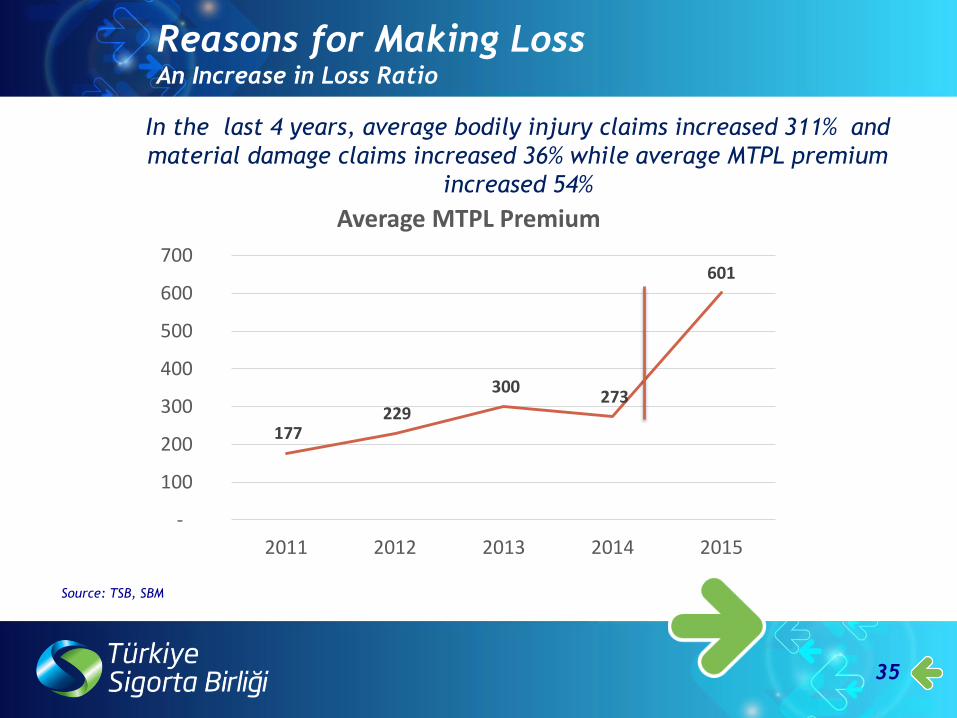
In the last 4 years, average bodily injury claims increased 311% and
material damage claims increased 36% while average MTPL premium
increased 54%
177 229
300 273
601
-
100
200
300
400
500
600
700
2011 2012 2013 2014 2015
Average MTPL Premium
Reasons for Making LossAn Increase in Loss Ratio
Source: TSB, SBM
36
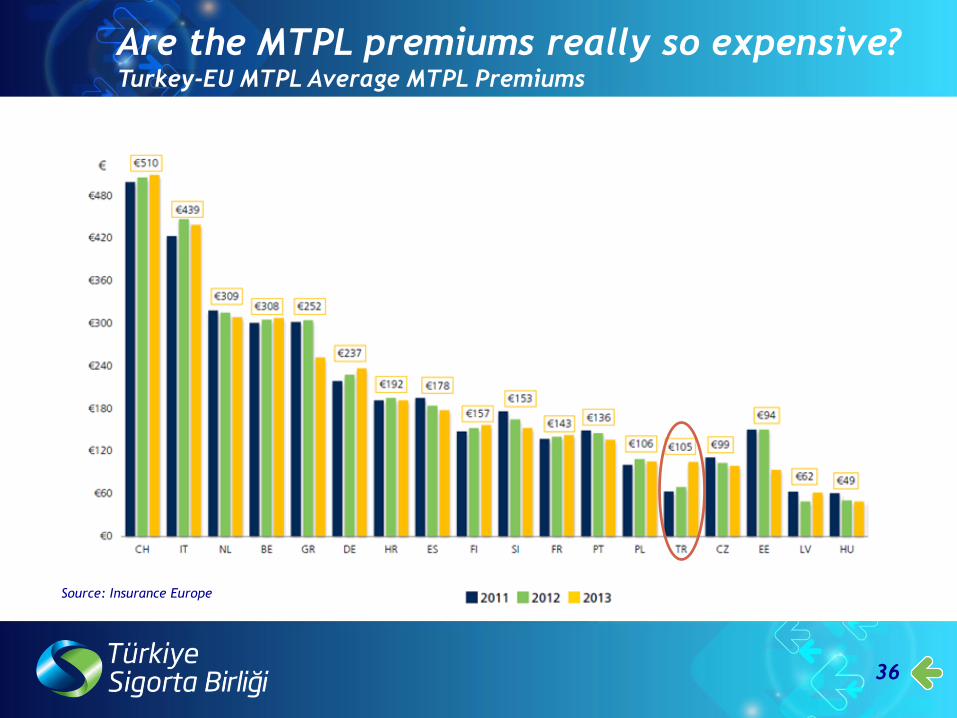
Source: Insurance Europe
Are the MTPL premiums really so expensive?Turkey-EU MTPL Average MTPL Premiums
37
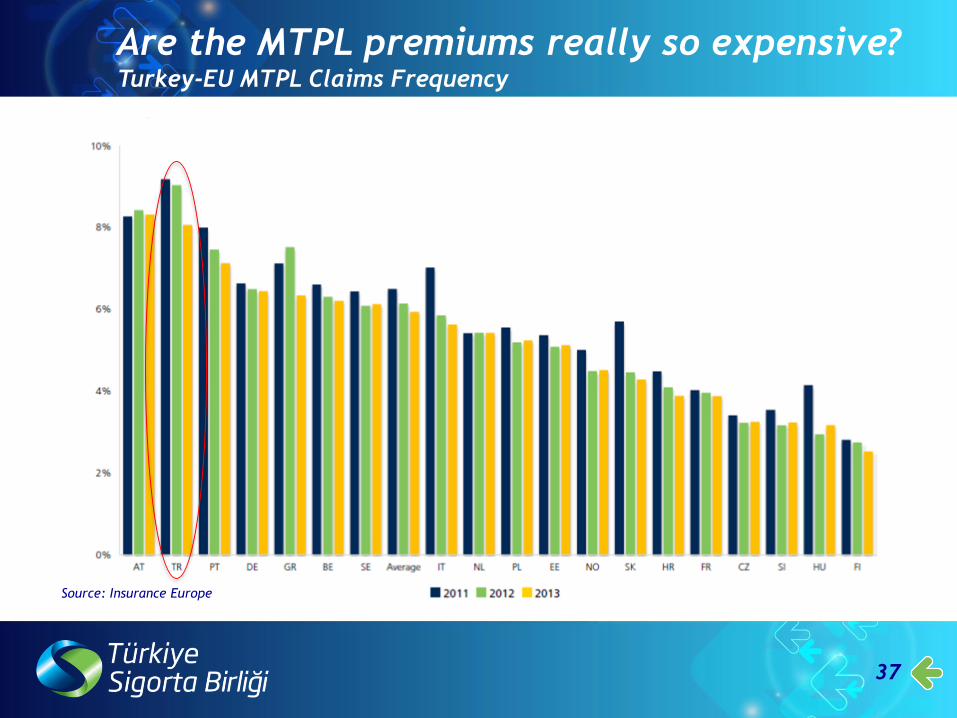
Are the MTPL premiums really so expensive?Turkey-EU MTPL Claims Frequency
Source: Insurance Europe
38
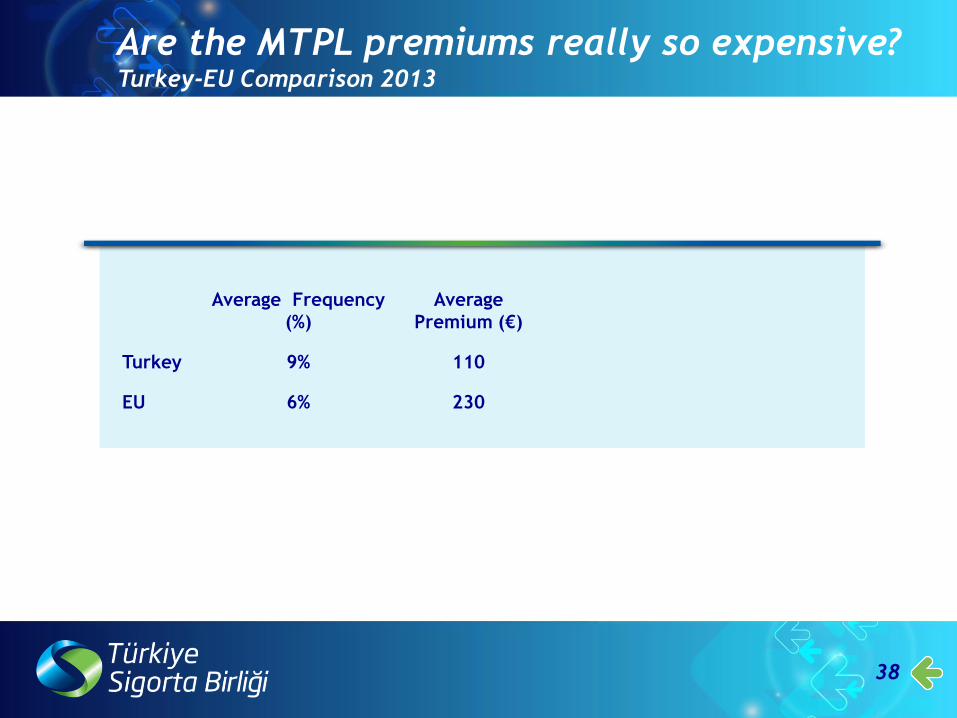
Are the MTPL premiums really so expensive?Turkey-EU Comparison 2013
Average Frequency
(%)
Average
Premium (€)
Turkey 9% 110
EU 6% 230
39
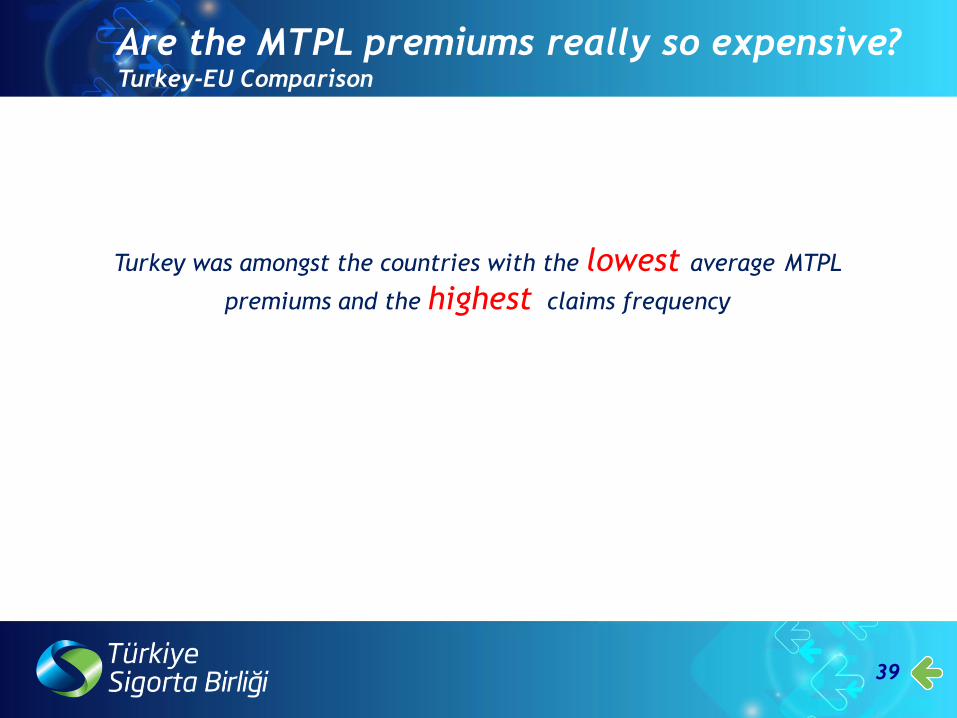
Turkey was amongst the countries with the lowest average MTPL
premiums and the highest claims frequency
Are the MTPL premiums really so expensive?Turkey-EU Comparison

• SO WHAT IS THE SOLUTION??
40
41
THE GOOD NEWS IS…
Regulatory changes needed in the Highway Traffic
Law realized Last Week in the Parliamentum,
Finally…

42
Thank you...


