Page 1
ORIGINAL PAPER
Integrated analysis of transcriptome and lipid profiling revealsthe co-influences of inositol–choline and Snf1 in controlling lipidbiosynthesis in yeast
Pramote Chumnanpuen • Jie Zhang •
Intawat Nookaew • Jens Nielsen
Received: 6 February 2012 / Accepted: 8 May 2012 / Published online: 24 May 2012
� Springer-Verlag 2012
Abstract In the yeast Saccharomyces cerevisiae many
genes involved in lipid biosynthesis are transcriptionally
controlled by inositol–choline and the protein kinase Snf1.
Here we undertook a global study on how inositol–choline
and Snf1 interact in controlling lipid metabolism in yeast.
Using both a reference strain (CEN.PK113-7D) and a
snf1D strain cultured at different nutrient limitations (car-
bon and nitrogen), at a fixed specific growth rate of
0.1 h-1, and at different inositol choline concentrations, we
quantified the expression of genes involved in lipid bio-
synthesis and the fluxes towards the different lipid com-
ponents. Through integrated analysis of the transcriptome,
the lipid profiling and the fluxome, it was possible to obtain
a high quality, large-scale dataset that could be used to
identify correlations and associations between the different
components. At the transcription level, Snf1 and inositol–
choline interact either directly through the main phospho-
lipid-involving transcription factors (i.e. Ino2, Ino4, and
Opi1) or through other transcription factors e.g. Gis1,
Mga2, and Hac1. However, there seems to be flux regu-
lation at the enzyme levels of several lipid involving
enzymes. The analysis showed the strength of using both
transcriptome and lipid profiling analysis for mapping the
co-influence of inositol–choline and Snf1 on phospholipid
metabolism.
Keywords Inositol–choline � Snf1 � Co-influence �Lipid profiling � Transcriptome
Abbreviations
AcCoA Acetyl coenzyme A
AceAcCoA Acetoacetyl coenzyme A
CDP-DAG Cytidine diphosphate-diacylglycerol
Cho Choline
DAG Diacylglycerol
Etn Ethanolamine
ES Ergosterol
FA Fatty acid or fatty acyl-CoA
Glc-6-P Glucose 6-phosphate
G-3-P Glycerol 3-phosphate
HIC High inositol–choline
IC Inositol–choline
LIC Low inositol–choline
MaCoA Malonyl coenzyme A
PA Phosphatidic acids
PC Phosphatidylcholine
PE Phosphatidylethanolamine
PI Phosphatidylinositiol
PL Phospholipids
PS Phosphatidylserine
Pyr Pyruvate
SE Sterylester
ST Strain factor
TAG Triacylglycerol
TF Transcription factor
UASINO Inositol-sensitive upstream activating
sequence
Communicated by S. Hohmann.
Electronic supplementary material The online version of thisarticle (doi:10.1007/s00438-012-0697-5) contains supplementarymaterial, which is available to authorized users.
P. Chumnanpuen � J. Zhang � I. Nookaew � J. Nielsen (&)
Systems and Synthetic Biology, Department of Chemical
and Biological Engineering, Chalmers University
of Technology, Kemivagen 10, 412 96 Gothenburg, Sweden
e-mail: [email protected]
123
Mol Genet Genomics (2012) 287:541–554
DOI 10.1007/s00438-012-0697-5
Page 2
Introduction
Eukaryotic cells have evolved complex regulatory net-
works to control energy metabolism and the utilization of
different carbon sources (Gancedo 1998; Usaite et al.
2009). In yeast the Snf1 kinase complex is one of the key
regulators in this regulatory network, and it belongs to a
remarkably conserved serine/threonine kinase family
called AMP-activated kinase (AMPK) that exists in all
eukaryotes (Thomas and Polge 2007). The Snf1 kinase was
firstly identified as a key enzyme in releasing glucose
repression on glucose depletion (Celenza and Carlson
1984), and later found to be involved in the regulation of
transcription through posttranslational modifications of
histone H3 and Gcn5 (Lo et al. 2001; Liu et al. 2010) and
interaction with RNA polymerase II holoenzyme (Kuchin
et al. 2000). Snf1 is activated by phosphorylation on
Thr210 by its upstream kinases in response to activation by
the Snf4 subunit (Nath et al. 2003; Sutherland et al. 2003).
Once activated, Snf1 induces the genes in gluconeogenesis,
glyoxylate cycle and b-oxidation of fatty acids (FA) by
regulating a set of transcription factors (Soontorngun et al.
2007; Ratnakumar and Young 2010) and suppresses lipid
biosynthesis by inactivating Acetyl-CoA carboxylase
(Acc1), the committed step of FA synthesis (Woods et al.
1994). Besides those aforementioned processes, Snf1 is
also involved in other processes such as the general stress
response, pseudohyphal growth, ageing and ion homeo-
stasis (Alepuz et al. 1997; Kuchin et al. 2002; Lin et al.
2003; Portillo et al. 2005; Hong and Carlson 2007; Shirra
et al. 2008; Ye et al. 2008; Usaite et al. 2009). Considering
the role of snf1 at the level of protein–protein interactions
retrieved from the BioGRID database (Stark et al. 2011),
Snf1 associates with 335 proteins, which are enriched in
the GO-terms phosphorylation and proteins phosphoryla-
tion (hypergeometric test: P = 1.5E-5) within the GO-
terms transcription, DNA-dependent and regulation on
transcription, DNA-dependent (hypergeometric test: P =
1.5E-5). Remarkably, the GO term phospholipid metabo-
lism is also over-represented within the Snf1 interaction
network (hypergeometric test: P = 1.28E-3), inferring
the important role of Snf1 in controlling phospholipid
metabolism.
Snf1 is involved in many stress response processes in
yeast, including inositol biosynthesis. At high inositol
concentrations, transcription of the INO1 gene (a key gene
required for an early rate-controlling step in phosphoino-
sitol biosynthesis) is strongly repressed by the transcrip-
tional repressor OPI1 (Jackson and Lopes 1996). On the
contrary, at low inositol concentrations, the basic helix-
loop-helix proteins Ino2 and Ino4 heterodimerize and bind
to the INO1 promoter to activate its transcription (Am-
broziak and Henry 1994). This kind of mechanism can also
be observed in many phospholipid involving genes that
contain the conserved UASINO (inositol-sensitive upstream
activating sequence) element, also known as ICRE (inosi-
tol/choline responsive-element), in their promoters. Acti-
vation of INO1 and other UASINO-containing genes
requires the transcription factors (TFs) Ino2 and Ino4,
which bind as a heterodimer directly to UASINO sites
(Lopes and Henry 1991; Ambroziak and Henry 1994;
Schwank et al. 1995). Nevertheless, The negative regula-
tor, Opi1, required for repression of the UASINO-containing
genes (Greenberg et al. 1982; White et al. 1991), was
shown to reside in the endoplasmic reticulum (ER) as a part
of a protein complex that also contains the membrane
spanning protein Scs2 under the signaling of inositol and
PA (Gavin et al. 2002; Loewen et al. 2003). It has been
known that the rate of phospholipid synthesis is dramati-
cally increased when inositol is added to the growth
medium (Kelley et al. 1988; Loewen et al. 2004). Recently,
genome-wide transcription analysis revealed that growth in
the presence of inositol also affects the expression level of
over 100 genes (Santiago and Mamoun 2003; Jesch et al.
2005). However, the combination of inositol and choline
increased the number of repressed genes compared with
inositol alone and enhanced the repression level of a subset
of genes whose expression are affected by inositol (Jesch
et al. 2005).
The Snf1 kinase is able to directly activate the tran-
scription of the INO1 gene, encoding inositol-1-phosphate
synthase required for inositol biosynthesis (Donahue and
Henry 1981; Graves and Henry 2000). Since Snf1 is
required for histone H3 modification at the promoter site of
UASINO-genes (Arndt et al. 1995; Henry and Patton-Vogt
1998), the expression level of INO1 is down regulated in a
snf1 deletion strain (Lo et al. 2001, 2005; Shirra et al.
2001). Consequently, a snf1D strain is inositol auxotrophic
and addition of inositol into the culture medium is needed
to compensate the failure of INO1 expression. This indi-
cates a co-influence of Snf1 and inositol on lipid
metabolism.
To elucidate the co-influence of Snf1 and inositol–
choline on lipid metabolism of S. cerevisiae, we undertook
a global study of lipid metabolism by performing three
perturbations following a robust factorial experimental
design. The first factor is the level of inositol–choline (IC
factor), which is known to directly influence lipid metab-
olism (Jesch et al. 2005). The second factor is a genetic
difference factor or a strain factor (ST factor), which is the
comparison of SNF1 deficiency with the reference strain.
The third factor is nutrient limitation (carbon and nitrogen)
factor that results in a global perturbation of the lipid pool
inside the cell (Sattur and Karanth 1989a, b). Using a
systems biology approach (Canelas et al. 2010) a global
regulatory model for lipid metabolism could be established,
542 Mol Genet Genomics (2012) 287:541–554
123
Page 3
and in particular we could identify which genes involved in
lipid biosynthesis that are correlated with the fluxes
towards different lipid components.
Materials and methods
Materials
All chemicals were reagent grade. Phospholipids, fatty acid
methyl ester and neutral lipids standards were purchased
from Sigma.
Agar spot test on SD media with different inositol
concentrations
Both reference and snf1D strains were grown on SD agar
plate (containing Yeast Nitrogen Base without amino acids
and inositol, Formedium LTD, England). The SD agar
plates were supplemented with 0, 1.39, 75 or 220 lM of
inositol.
Strains, cultivation, and fermentation profile
The S. cerevisiae strains used in this study were a proto-
trophic strain CEN.PK 113-7D (Mata Mal2-8c SUC2) (van
Dijken et al. 2000) and its derivative snf1D supplied by
Peter Kotter (Frankfurt, Germany). Steady-state aerobic
chemostat cultures were grown at 30 �C in 1.2 L bioreac-
tors (DASGIP, Germany) with working volume of 0.5 L
using a dilution rate of 0.10 (±0.005) h-1. For the
C-limited cultures, the medium composition was the same
as used by (Zhang et al. 2011). For N-limited cultivation,
the medium was the same as the one used in C-limited
cultivations except that the concentrations for (NH4)2SO4
and glucose were 1.0 and 60 g/L, respectively. The pH was
controlled at 5.00 ± 0.05 with 2 M KOH and dissolved
oxygen was kept above 30 %. Chemostat cultivation
ensured that metabolic and regulatory changes observed
were specific to disruptions of Snf1 and also the addition of
IC, and not complicated by external effects resulting from
different growth rates. For HIC condition, the media con-
tained 75 lM of inositol and 1 mM of choline (Klig et al.
1985; Bailis et al. 1987). The chemostat culture with low
inositol concentration and associated data on transcription
analysis were also used in a study on the interaction of Snf1
and Tor1 (Zhang et al. 2011).
Samples were harvested from the cultivation media
every second hour and immediately filtered through a
0.45 lm pore-size cellulose acetate filter (VWR) and
stored at -20 �C until analysis. Biomass production was
evaluated by measuring of optical density (OD600) and dry
cell weight. Glucose, glycerol, ethanol, and acetate
concentrations were determined by HPLC analysis using an
Aminex HPX-87H column (Biorad, Hercules, CA)
(Zaldivar et al. 2002).
Transcriptome analysis
Transcriptome data acquisition
Samples for RNA extraction were taken after 50 h (i.e. 5
retention times) of steady-state by rapidly taking 20 mL of
culture and mixing with 30 mL of crushed ice in a 50 mL
Falcon tube to cool down the samples immediately. The
cells were harvested by centrifuging at 4,000 rpm and 2 �C
for 3 min, and then frozen in liquid nitrogen and stored at
-80 �C until subsequent RNA extraction. The cells were
mechanically disrupted using FastPrep homogenizer (MP
Biomedicals) and total RNA was isolated using the RNeasy
Mini Kit (QIAGEN). The quality of total RNA was
assessed using an Agilent 2100 Bioanalyzer (Agilent
Technologies) with RNA 6000 Nano LabChip kit (Agilent
Technologies). The labeled RNA was synthesized using the
GeneChip 3’ IVT Express Kit (Affymetrix), which was
then hybridized onto the GeneChip Yeast Genome 2.0
Arrays (Affymetrix). Staining and washing of the hybrid-
ized arrays were carried out on the GeneChip� Fluidics
Station 450 (Affymetrix) and scanned using the GeneChip
Scanner 300 7G (Affymetrix). All transcriptome data of
this study can be found at Gene Expression Omnibus with
accession number GSE32418.
Available for reviewer on private page at: http://www.
ncbi.nlm.nih.gov/geo/query/acc.cgi?token=pjsfvwusiqawebe
&acc=GSE32418.
Transcriptome data analysis
The transcriptome data were analyzed using Bioconductor
in R. Raw data were normalized and processed together
with Probe Logarithmic Intensity Error method. The
3-factor and 2-factor ANOVA analysis was performed to
determine the genes whose expression level is significantly
changed due to three factors, limiting nutrient (CN), sup-
plement inositol–choline (IC) and strains (ST), as well as
their co-influence effect. The calculated p values of dif-
ferent hypothesis were corrected for multiple testing by
false discovery rate (FDR) using the Benjamini–Hochberg
method (Benjamini and Hochberg 1995). A cut-off value of
adjusted p value \0.01 was set to assess statistical signif-
icance. Detailed summary of the results can be found in
supplementary text file ‘‘C only Pval&FC’’ for C-limited
conditions and ‘‘N only Pval&FC’’ for N-limited condi-
tions. To evaluate intrinsic variation between transcriptome
samples to assess quality of data and also robustness of
biological replications, principal component analysis
Mol Genet Genomics (2012) 287:541–554 543
123
Page 4
(PCA) was employed. Then, the result is visualized by two
first principle components as illustrated on Fig. 2a. All
analyzes and plots were performed in R suite software.
Lipid data acquisition
Total lipid extraction
The lipid extraction method was adapted from Bligh and
Dyer (Bligh et al. 1959). First, 15 mg of freeze-dried cell
pellets were treated with 1 unit lL-1 of zymolyase
digesting buffer (1.2 M glycerol, 100 mM sodium thio-
glycolate, 50 mM Tris-sulfate, pH 7.5) at 37 �C for
15 min, followed by centrifugation at 3,000 rpm for 3 min
to collect the spheroplast, which was mixed with internal
standards (heptadecanoic acid and glyceryl tri-heptade-
canoate, 25 lg of each). After the addition of 7 mL of
chloroform–methanol (2:1, v/v), the mixture was shaken
horizontally at 300 rpm 4 �C for 3 h, mixed with 1.7 mL
of sodium chloride solution (0.73 %) and centrifuged at
3,000 rpm 4 �C for 4 min for phase separation. The lower
(organic)-phase was collected and the remaining was re-
extracted with 5 mL of chloroform–methanol (85:15 v/v).
The lower (organic)-phase was collected and pooled with
the previous organic fraction and kept at -20 �C until
further analysis.
Lipid class separation, identification, and quantification
using HPLC-CAD
Lipid separation and quantification were performed using
the method modified from Silversand and Haux (Silversand
and Haux 1997). Lipid separation was accomplished by
HPLC (Dionex) equipped with charge aerosol detector;
CAD (Corona) and the gas connected was nitrogen gas
with 35 psi gas pressure. All the separated fractions were
then collected by automated fraction collector; AFC-3000
(Dionex). A 20 lL volume of sample was injected in to the
Luna 5 lm HILIC 200 A 100 9 3.0 mm LC Column
(Phenomenex). The flow-rate was 0.8 mL/min and the
column temperature was kept at 25 �C during all runs. The
chromatogram was record at 10 Hz frequency and gain for
100 pA. The polar and neutral lipid classes were separated
by three solvent mixtures and gradient systems as follow:
(A) hexane–acetic acid (99:1, v/v); (B) acetone–isopropa-
nol–acetic acid (29:70:1, v/v/v); (C) water–acetone–iso-
propanol–acetic acid (9:20:70:1, v/v/v/v). Triethylamine
(0.08 %, v/v) was added to the solvent C to adjust pH. The
samples were injected at time 0 and the gradient profile
started at 100 % of Solvent A and the solvent B was
gradually increased to 5 % in 14 min and it was always
kept at 5 % along the process. At 15 min time point, sol-
vent C was slowly entering to the system and rising up to
40 % in 5 min. Then solvent C was slowly increased until
45 % in 20 min. Finally, the gradient was reduced from 5
to 0 % of solvent B and from 45 to 0 % of solvent C in
5 min and then maintained at 100 % of solvent A for
5 min. In total, the solvent program for the separation of all
lipid classes took 45 min.
Identification and quantification
Pure lipid standards were analyzed individually using
chromatography to confirm their retention times and purity.
Lipid standards were also co-eluted together with samples
to identify peaks in unknown samples. Solutions of known
concentrations of different lipid classes were mixed and
lipid standard curves were generated to study the linearity
of the detection method and to quantify lipid classes in
unknown samples. Calibration curves were prepared for
5–1,000 lg mL-1 of PA, PE, PC, PS, PI, ES, TAG, FA,
and ES. Each concentration of the standard solutions was
injected twice and the average log10 peak area for each
lipid was plotted against the absolute amount of lipid.
Correlation (r2) was determined for all curves by linear
regression.
FAMEs analysis
We used standard procedure developed in our laboratory
which is based on the previous protocol by Khoomrung
et al. (2012). Briefly, 10 mg of freeze-dried samples was
mixed with 4 mL of hexane, 2 mL of 14 % BF3 (in
Methanol) and 5 lg of internal standard (17:0 fatty acid
standard was added. The sample was then flushed into the
tube’s head space with nitrogen gas for 30 s and closed
tightly with a Teflon screw cap. The tube was placed in a
vessel containing 30 mL of milliQ water and then sealed
with TFM screw cap. The tube was heated using micro-
wave digestion system (milestone start D, Sorisole Berg-
amo, Italy) equipped with rotor PRO-24. The temperature
programming of microwave digestion was ramped (from
room temperature) to 120 �C within 6 min and maintained
for 10 min. After cooling down sample at the room tem-
perature, 2 mL of milliQ water was added and shaken
vigorously for 1 min and centrifuged at 2,500 rpm for
5 min. The upper phase (hexane phase which contained the
FAMEs) was analysed by GC–MS.
The FAMEs were separated and quantified using Focus
GC ISQ single quardrupole GC–MS (Thermo Fisher sci-
entific, Germany). The separation of FAMEs was per-
formed on Zebron (ZB-WAX) GC column (30 m 9 0.25
mm I. D., 0.25 lm film thickness) from Phenomenex,
Macclesfield, UK. Sample was injected in splitless injec-
tion mode (1 lL at 240 �C) and Helium was a carrier gas
(1 mL/min). The column temperature was initially set at
544 Mol Genet Genomics (2012) 287:541–554
123
Page 5
50 �C (1.5 min), then temperature was ramped to 180 �C
(25 �C/min) for 1 min, then increased to 220 �C (10 �C/
min) and held for 1 min. Finally, temperature was
increased to 250 �C (15 �C/min) and held for 3.0 min.
Mass transfer line and ion source were set at 250 and
200 �C, respectively. The FAMEs were detected with
electron ionization (70 eV) in scan mode (50–650 m/z) and
selected ion monitoring mode at m/z 55, 67, 74 and 79 (for
quantitative analysis). The identification of unknown
FAMEs was achieved by comparing their retention times
and mass spectrum profiles with known standards (Sigma-
Aldrich, USA). The quantification of FAMEs was per-
formed using QuanBrowser function in Xcalibur software
version 2.0 (Thermo Fisher Scientific). According to the
serial dilution of FAME mix standards and were normal-
ized according to the internal standard fatty acid C17:0.
The average molecular weights of each PL (Table S1) were
used for mg/gDW and mmol/gDW units conversion (were
later used for metabolic fluxes analysis).
Integrated analysis
The statistical adjusted p values of each hypothesis testing
were overlaid on the three curetted biological networks
graph of Gene Ontology (Ashburner et al. 2000), Tran-
scription factor-gene interaction (Abdulrehman et al. 2011)
and genome-scale metabolic model iIN800 (Nookaew et al.
2008) (metabolite-gene interaction). Briefly, the networks
were transformed to be bipartite graph then the adjusted
p values derived from each hypothesis as previously
described in transcriptome in analysis section. After that,
reporter algorithm (Oliveira et al. 2008) was performed to
evaluate the functional enrichment of cellular responses
based on each statistical hypothesis. The algorithm estimated
meta-significant values (reporter p value) of each GO term,
Transcription factors (TF) and metabolites (feature) that are
in response to each perturbation factor. Features that have
reporter p value \0.001 were considered and presented in
heatmaps. The list of gene members associated within the
three features can be found in supplementary text file ‘‘C only
Pval&FC’’ for C-limited conditions and ‘‘N only Pval&FC’’
for N-limited conditions.
Results
High and Low inositol–choline condition and media
design
As previously reported for yeast, inositol is essential in a
snf1D deletion strain (Shirra et al. 2001; Sanz 2003). To
quantify the required inositol levels for a snf1D yeast
strain, a spot test of snf1D on different concentrations of
inositol were performed (Fig. 1a). Since Snf1 kinase pos-
itively regulates the expression of INO1 (Shirra et al. 2001;
Lo et al. 2005), the snf1D yeast strain could, as reported
earlier, not grow on SD agar media without inositol (see
Fig. 1a). However, myo-inositol is included in a concen-
tration of 25 mg/L (corresponding to about 139 lM) in the
minimal medium we normally use in our laboratory (Ver-
duyn et al. 1992), and the spot test showed that even a 100
times lower amount (1.39 lM) is enough to support the
growth of snf1D while higher concentrations (up to
200 lM) only provide marginal improvements in growth.
Based on this we used an experimental design where
1.39 lM inositol and 0 mM choline represent low inositol–
choline (LIC) condition and 75 lM inositol and 1 mM
choline represent high inositol–choline (HIC) condition
(see Fig. 1b).
Strains, cultivation, and fermentation profile
Two strains (the reference and snf1D) were grown in aer-
obic chemostat cultures at 30 �C in 1.2 L bioreactors
(DASGIP, Germany) with working volume of 0.5 L using a
dilution rate of 0.10 (±0.005) h-1. Key physiological
information from all the fermentations is collected in
Table 1. Deletion of SNF1 and the IC level obviously
influence biomass formation as reflected in the biomass
yields. At C-limited condition, deletion of SNF1 resulted in
a substantial reduction of biomass yields by 34 and 22 % at
HIC and LIC conditions, respectively. At N-limited con-
dition, in contrast, there were no significant difference in
biomass yield for both the wild type strain and snf1D at
both HIC and LIC condition. This is can be explained by
low (or no) activity of Snf1 at N-limited conditions (also
characterized by conditions of high glucose concentra-
tions). Focusing on the IC effect on biomass yield of both
reference and snf1D, we found that an increase in IC level
caused a 5–15 % and 30–60 % increase in biomass yield
for C-limited and N-limited, respectively.
Global transcriptome changes due to IC level
and deletion of Snf1 in nutrient-limited condition
We used the Affymetrix DNA microarray platform to
measure the expression level of all genes and access the
global effect caused by deletion of SNF1, by the inositol–
choline level, and the combination of the two under two
different kinds of nutrient-limitation (C- and N-limitation).
The transcriptome data of the 8 different conditions,
derived from 24 yeast 2.0 Affymetrix DNA microarrays,
were decomposed using principal component analysis
(PCA) and 3-factor ANOVA analysis (a = 0.01) to obtain
the global responses of gene expression at the different
conditions. It is seen that the biological replicates are well
Mol Genet Genomics (2012) 287:541–554 545
123
Page 6
grouped (Fig. 2a), showing very high reproducibility.
Furthermore, the transcriptome data are presented in a
Venn diagram (Fig. 2b) showing that the number of sig-
nificant genes in response to the nutrient limited (CN)
factor was about 2 times of that in response to the Snf1
deficiency factor (ST) and the inositol–choline (IC) factors,
showing that a change from carbon to nitrogen limitation is
the dominant factor. This is consistent with the PCA that
also illustrated that the impact of nutrient limitation is the
main factor separating the samples in the first principal
component. We therefore re-analyzed the transcriptome
data using 2-factor ANOVA analysis of the C-limited and
N-limited data sets separately (Fig. 2c) to get better insight
into the effect of the ST and IC factors. Based on this we
found that there were more genes being significantly
changed at C-limitation than that at N-limitation. The
variance between the reference and the snf1D strain (rep-
resented by the distance between reference-snf1D, Fig. 2a)
was very small at N-limited condition supported by the
very small number of significant genes affected by the
Fig. 1 Spot test on SD agar plates with different inositol concentra-
tions after 24 h (a). Illustration of the 3 factor factorial design and
schematic analysis of our workflow for integrated analysis involving
transcriptome-lipid profiling analysis of the inositol–choline effect on
lipid biosynthesis in snf1D yeast strain (b)
Table 1 Key physiological parameters for all conditions in chemostat cultivations
Strains Conditions YSXa YSE
b YSGc YSA
d
Reference LIC, C-limited 0.515 ± 0.007 n.d. 0.008 ± 0.001 n.d.
Reference LIC, N-limited 0.097 ± 0.002 0.292 ± 0.029 0.002 ± 0.000 0.004 ± 0.001
snf1D LIC, C-limited 0.384 ± 0.003 n.d. 0.014 ± 0.002 n.d.
snf1D LIC, N-limited 0.102 ± 0.000 0.252 ± 0.044 0.007 ± 0.000 0.005 ± 0.001
Reference HIC, C-limited 0.539 ± 0.010 n.d. 0.019 ± 0.001 n.d.
Reference HIC, N-limited 0.128 ± 0.004 0.485 ± 0.0479 0.008 ± 0.000 0.007 ± 0.001
snf1D HIC, C-limited 0.442 ± 0.008 n.d. 0.021 ± 0.001 n.d.
snf1D HIC, N-limited 0.164 ± 0.011 0.483 ± 0.030 0.012 ± 0.001 0.010 ± 0.002
a Biomass yield on glucose (unit: g biomass formed/g glucose consumed)b Ethanol yield on glucose (unit: g ethanol formed/g glucose consumed)c Glycerol yield on glucose (unit: g glycerol formed/g glucose consumed)d Acetate yield on glucose (unit: g acetate formed/g glucose consumed)
546 Mol Genet Genomics (2012) 287:541–554
123
Page 7
strain (ST) factor at N-limitation (see Venn diagram in
Fig. 2c). This is due to low activity of Snf1 at N-limited
growth conditions (Usaite et al. 2009; Zhang et al. 2011),
but still deletion of SNF1 influences the transcription of
around 250 genes at these conditions illustrating the key
role this protein kinase has on regulation of cellular
function.
Subsequently, functional enrichment in response to each
perturbed factor was calculated using our reporter algo-
rithm (reference to Oliveira et al. paper), and the results are
summarized in Fig. 2d. With this approach we identify GO
terms that are enriched in response to the different factors,
and this allows for direct interpretation of which biological
processes are affected in response to the different factors
evaluated. It is seen that the identified GO terms (biological
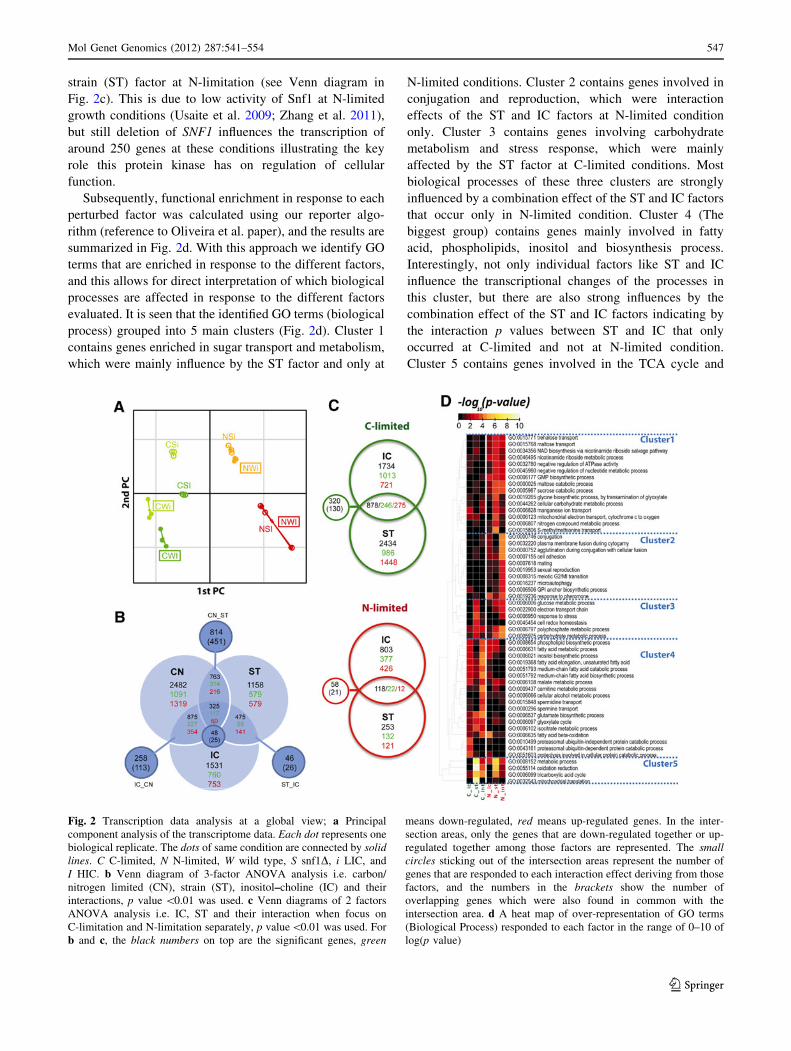
process) grouped into 5 main clusters (Fig. 2d). Cluster 1
contains genes enriched in sugar transport and metabolism,
which were mainly influence by the ST factor and only at
N-limited conditions. Cluster 2 contains genes involved in
conjugation and reproduction, which were interaction
effects of the ST and IC factors at N-limited condition
only. Cluster 3 contains genes involving carbohydrate
metabolism and stress response, which were mainly
affected by the ST factor at C-limited conditions. Most
biological processes of these three clusters are strongly
influenced by a combination effect of the ST and IC factors
that occur only in N-limited condition. Cluster 4 (The
biggest group) contains genes mainly involved in fatty
acid, phospholipids, inositol and biosynthesis process.
Interestingly, not only individual factors like ST and IC
influence the transcriptional changes of the processes in
this cluster, but there are also strong influences by the
combination effect of the ST and IC factors indicating by
the interaction p values between ST and IC that only
occurred at C-limited and not at N-limited condition.
Cluster 5 contains genes involved in the TCA cycle and
Fig. 2 Transcription data analysis at a global view; a Principal
component analysis of the transcriptome data. Each dot represents one
biological replicate. The dots of same condition are connected by solidlines. C C-limited, N N-limited, W wild type, S snf1D, i LIC, and
I HIC. b Venn diagram of 3-factor ANOVA analysis i.e. carbon/
nitrogen limited (CN), strain (ST), inositol–choline (IC) and their
interactions, p value \0.01 was used. c Venn diagrams of 2 factors
ANOVA analysis i.e. IC, ST and their interaction when focus on
C-limitation and N-limitation separately, p value\0.01 was used. For
b and c, the black numbers on top are the significant genes, green
means down-regulated, red means up-regulated genes. In the inter-
section areas, only the genes that are down-regulated together or up-
regulated together among those factors are represented. The smallcircles sticking out of the intersection areas represent the number of
genes that are responded to each interaction effect deriving from those
factors, and the numbers in the brackets show the number of
overlapping genes which were also found in common with the
intersection area. d A heat map of over-representation of GO terms
(Biological Process) responded to each factor in the range of 0–10 of
log(p value)
Mol Genet Genomics (2012) 287:541–554 547
123
Page 8
mitochondrial functions, which were strongly affected by
the ST factor at both C-limited and N-limited conditions as
previously known (Woods et al. 1994; Sanz 2003; Thomas
and Polge 2007).
To identify transcriptional regulation of metabolism in
response to deletion of SNF1 and/or IC effect, we overlaid
the transcriptome onto the iIN800 genome-scale metabolic
model of S. cerevisiae (Nookaew et al. 2008) and used our
reporter feature method (Patil and Nielsen 2005; Oliveira
et al. 2008). This method is useful for the identification of
reporter metabolites and reporter transcription factors
(TFs). The former represents metabolites around which
significant transcriptional activity occur in response to a
given perturbation and reporter transcription factor identify
TFs that are likely to have altered activity in response to a
perturbation, i.e. a large fraction of genes regulated by this
TF have altered expression. The results of this analysis
(reporter metabolites and TFs) are reported as heatmaps in
Figs. S4 and S5, and it is found that this analysis is in
agreement with the results of the reporter GO term analysis
in the sense that the same biological functions are found to
be changed. However, the list of reporter metabolites and
reporter TFs allows for identification of changes at the
molecular level. The lists of gene members corresponding
to each reporter GO term and each TFs can be found in
supplementary text files ‘‘GO_member.txt’’ and ‘‘TF_
member.txt’’, respectively.
Lipid composition and content
To link the transcription level to alterations in the cellular
lipid composition, we measured different lipid classes at all
conditions (with biological triplicate samples). This also
allowed us to obtain insight into how the inositol–choline
level and the Snf1 activity affected the lipid biosynthesis at
the metabolic level. For each sample, four neutral lipids
(i.e. SE, TAG, FA, and ES) and five phospholipids (such as
PA, PE, PC, PS, and PI) were separated and quantified (see
Fig. S2-3). Moreover, the FA distributions in each
phospholipid class and total fatty acids were monitored
(supp. Tables 4–8). The FA analysis of the total lipid pool
confirmed that the C16 and C18 fatty acids were the two
major FAs in yeast. About 70–80 % of yeast FAs are
monounsaturated (Fig. S1) via a reaction catalysed by the
ER-bound D9 desaturase Ole1 (Tehlivets et al. 2007). The
major parts of the lipid composition were phospholipids and
storage lipids (TAG and ES), each in the range of 20–40 %
at all conditions. Both SE and free FAs were detected in
very small amounts, around 2–8 %, at all conditions. The
IC effect had influence on the total lipid composition, and
we found that at HIC conditions, the percentages of phos-
pholipids were lower whereas the storage lipids (such as
TAG and ES) were higher compared with LIC.
Flux distribution in lipid pathway is highly influenced
by IC and Snf1
To explore the carbon channeling in lipid metabolism, the
fluxes in lipid biosynthesis (in units of lmol/gDW/h) were
calculated from the measured lipid profiles at all conditions
(Fig. 3) and this provides a clear picture of the changes in
the flux distribution in response to the different factors
evaluated. These fluxes were affected by many factors at
several levels, such as gene transcription, protein phos-
phorylation, and enzyme activity. Thus, at N-limited con-
dition, where there is excess glucose available, the fluxes
from AcCoA were about 3 and 2 fold higher when com-
pared to those at C-limited conditions for LIC and HIC
conditions, respectively. According to the reporter metab-
olite analysis (Fig. S4.), AcCoA was found to be signifi-
cantly different in response to the IC factor. At LIC
condition, the flux to the phospholipid pools is larger than
that to the storage lipids (i.e. TAG and SE). On the other
hand, the flux to storage lipids at HIC condition was greater
than that at LIC (since the IC effect result in down-regu-
lation of the whole set of phospholipid synthesis genes).
Interestingly, we found Gis1 as one of the most significant
TFs that were strongly affected by the ST factor at
C-limitation and both the ST and IC factors at N-limited
condition. Since Snf1 has protein–protein interaction with
Gis1p as a repressor (Balciunas and Ronne 1999), the
expression level of Gis1 genes were increasing at HIC
condition only at N-limited conditions where Snf1 is
inactive. Interestingly, this TF has interactions (directly or
indirectly) with several genes involved in lipid biosynthesis
(i.e. FAA2, ERG28, and DPP1) and also carbohydrate
metabolism (i.e. PGM2, HOR2, TPK1, ICL1, and PCK1).
Moreover, we also found inositol-3-phosphate as a signif-
icant reporter metabolite in response to the IC factor at
both C-limited and N-limited conditions. This directly
resulted from addition of inositol–choline to the culture
medium. Thus, through our experimental design we
obtained significant alteration in the fluxes of the different
branches of lipid metabolism, and in the following we will
discuss how the changes in these different fluxes are linked
to the transcriptome and the different factorial effects.
Discussions
Effect of inositol–choline, Snf1, and nutrient limitations
on FA biosynthesis
It has been reported that Snf1 kinase regulates negatively
the activity of acetyl-CoA carboxylase Acc1 (the first
enzyme of the fatty acid synthesis pathway), resulting in
the inhibition of lipid biosynthesis (Woods et al. 1994;
548 Mol Genet Genomics (2012) 287:541–554
123
Page 9
Usaite et al. 2009) (see Fig. 5). There is, however, also a
transcriptional response as we also found several Acyl-
CoAs as reporter metabolites as well as malonyl-CoA,
which is a key precursor for FA biosynthesis (Fig. S4).
Several FA types were reporter metabolites in response to
the IC factor at C-limited condition and both the IC and ST
factors at N-limited conditions.
According to reporter GO terms as presented in Fig. 2d,
FA synthesis related genes (i.e. ELO1 and OLE1) had
significant changes in expression in response to the IC
factor (especially at C-limited conditions). At N-limited
conditions there is accumulation of ethanol (Table 1), and
this could repress the synthesis of Fox1-3 proteins that are
the core enzymes of fatty acid b-oxidation in the specific
part of the peroxisome which is associated with lipid
droplet (Hiltunen et al. 2003). This repression of b-oxida-
tion may explain the accumulation of TAG at these con-
ditions. Pip2 and Oaf1 were found to be significant reporter
TFs in response to the IC factor and these transcription
factors are regulating genes involved in FA b-oxidation,
and these genes are also regulated only in response to the
IC factor. This is supported by findings by Jesch et al.
(2005), who found that the IC factor results in down
regulation of FA b-oxidation genes (Jesch et al. 2005).
Interestingly, we also found Mga2, which is the TF con-
trolling the expression of the OLE1 gene (Zhang et al.
1999), as a reporter TF at C-limited condition in response
to the IC factor. This explains the increased OLE1
expression (Fig. 4a); i.e. the expression level is higher at
C-limited condition than at N-limited condition and seems
to be up regulated at HIC condition (especially in the snf1Dstrain). This result supports the evidence that inositol can
induce OLE1 expression but repress INO1 expression
(Gaspar et al. 2006). To further evaluate this, the correla-
tion between the OLE1 gene and %unsaturation of phos-
pholipids and total lipid were examined, and a Pearson’s
correlation coefficient of 0.84 (p value about 2.55e-7) was
found between OLE1 gene expression and the %unsatura-
tion of phospholipids, whereas there was no correlation
found to the %unsaturation of the total lipids. As seen in
Fig. 4 the expression of OLE1 (in Log2 scale) has small
changes in low magnitude, but still there is clear changes in
expression identified by the one-way ANOVA analysis
(P = 1.86E-13). This strongly suggests that the %unsatu-
ration of FA in phospholipids were highly regulated at the
transcriptional level, and this may be an important factor
Fig. 3 Fluxes through the different reactions of lipid biosynthetic
pathway for LIC (a) and HIC (b). All fluxes are shown in units of
lmol/gDW/h. The upper value (normal font) is for the reference
strain, the lower (italic font) is for snf1D strain, normal font (left) and
bold font (right) indicate the value from C-limitation and in
N-limitation respectively. The level, in units of mg/gDW, of the
different lipid species is shown in the table. (C C-limited, N N-limited,
W wild type, S snf1D, i LIC, and I HIC)
Mol Genet Genomics (2012) 287:541–554 549
123
Page 10
for controlling membrane fluidity that is exquisitely regu-
lated by the ubiquitin/proteasome system (Braun et al.
2002). This is in agreement with our integrated analysis of
the transcriptome data as illustrated in Fig. 2, where we
found a GO term associated with proteasomal ubiquitin
dependent and independent protein catabolic processes in
response to the IC factor at both C-limitation and N-limi-
tation. Consequently, the correlations between the genes
coding for fatty acid elongase enzyme i.e. ELO1, ELO2,
and ELO3 against %C18 FA in total lipid were also cal-
culated and the Pearson’s correlation coefficient of 0.70,
0.38 and 0.49 were found between ELO1, ELO2 and ELO3
on %C18 FA, respectively. Moreover, Hac1, which is the
key transcription factor controlling the unfolded protein
response (UPR), was also found to be significantly
responding to IC (Fig. S5). This shows that the IC effects
on fatty acid desaturation process is also linked to the UPR
pathway through the desaturation of fatty acids occurring
in the endoplasmic reticulum membrane, in consistency
with what has been reported by Jesch et al. (2005).
IC and Snf1 are controlling phospholipids biosynthesis
The rate of phospholipid synthesis is substantially
decreased when inositol is added to the growth medium
(Kelley et al. 1988; Loewen et al. 2004). At all HIC con-
ditions, UASINO-containing genes were significantly down
regulated, at 70 % on average (for more information,
please see supplementary text files) when compared with
LIC. This evidence is consistent with the IC effects on
phospholipid via the down regulation of UASINO-contain-
ing genes reported by Jesch et al. (2005) and, therefore, led
to a dramatic decrease in the phospholipid pools at HIC
condition.
There is also a clear effect of Snf1 on UASINO-con-
taining genes since these genes change expression between
C-limitation and N-limtation where Snf1 is active and
inactive, respectively (Usaite et al. 2009; Zhang et al.
2011) (mean adjusted p value = 1.39E-4, 3.33E-2 for C-
and N-limited, respectively, for more information see
supplementary text file ‘‘Specific Pval&FC Lipids and
genes’’). Furthermore, when Snf1 is active it will inhibit
Acc1 (acetylCoA carboxylase) and hereby result in
reduced level of lipids in the cell as seen in Fig. 3. The
expression of UASINO-containing genes in the reference
strain at C-limitation and LIC condition were therefore not
as high as those in the snf1D strain and the reference strain
at N-limitation where there is increased activity of Acc1
(see Fig. 3). There therefore seems to be co-ordination
between regulation of the Acc1 activity and expression of
down-stream UASINO genes. Recently, it has been found
that mutations in ACC1 and FAS1 (encoding fatty acid
synthase) suppress the inositol auxotrophy of the snf1Dmutants, indicating that this auxotroph arises in part from
increased Acc1 activity in the mutant (Sanz 2003). Con-
sidering the lipid content at all conditions, the reference
strain at C-limitation and LIC condition still was the one
that had the highest level of phospholipid (almost 50 %
w/w total lipid). This may be caused by the high PA level
since it this was found to be highest at this condition
(Figs. 3, S3). This may lead to inhibition of the master
negative regulator of phospholipid biosynthesis, Opi1,
which is associated with the nuclear/ER membrane through
interaction with the integral membrane protein Scs2
(Fig. 5). At HIC conditions the PA will be consumed to
produce PI, and this may result in reduced levels of PA in
the cells (Fig. S3; Table S3). This can be directly sensed by
Opi1, a component of the endoplasmic reticulum (ER)-
localized lipid sensing complex (Loewen et al. 2003).
Since Opi1 is free and hence able to migrate into the
nucleus, where it interacts with Sin3 to inhibit the Ino2/
Ino4 complex resulting in down-regulation of the whole set
of UASINO-containing genes (Loewen et al. 2004; Kumme
et al. 2008) leading to a 40 % reduction in the phospholipid
pool at HIC condition (see Figs. 3, S2). Moreover, the lack
of Snf1 activity in the snf1D strain also resulted in a 50 %
reduced phospholipid pools due to down regulation of
INO1 at both C- and N- limited conditions. These effects
are captured by our integrative analysis where Ino2, Ino4
and Opi1 were all found as reporter TFs in both IC and ST
conditions (Fig. S6), but Opi1 had the highest significant
score derived from the integrated analysis (Fig. S6), which
Fig. 4 Correlation between fatty acid ratio and their specific enzyme
coding genes(C C-limited, N N-limited, W wild type, S snf1D, i LIC,
and I HIC). a Correlation between %unsaturation and OLE1expression. b Correlation between %C18 FA and each FA elongase
coding genes (ELO1, ELO2, and ELO3) expression
550 Mol Genet Genomics (2012) 287:541–554
123
Page 11
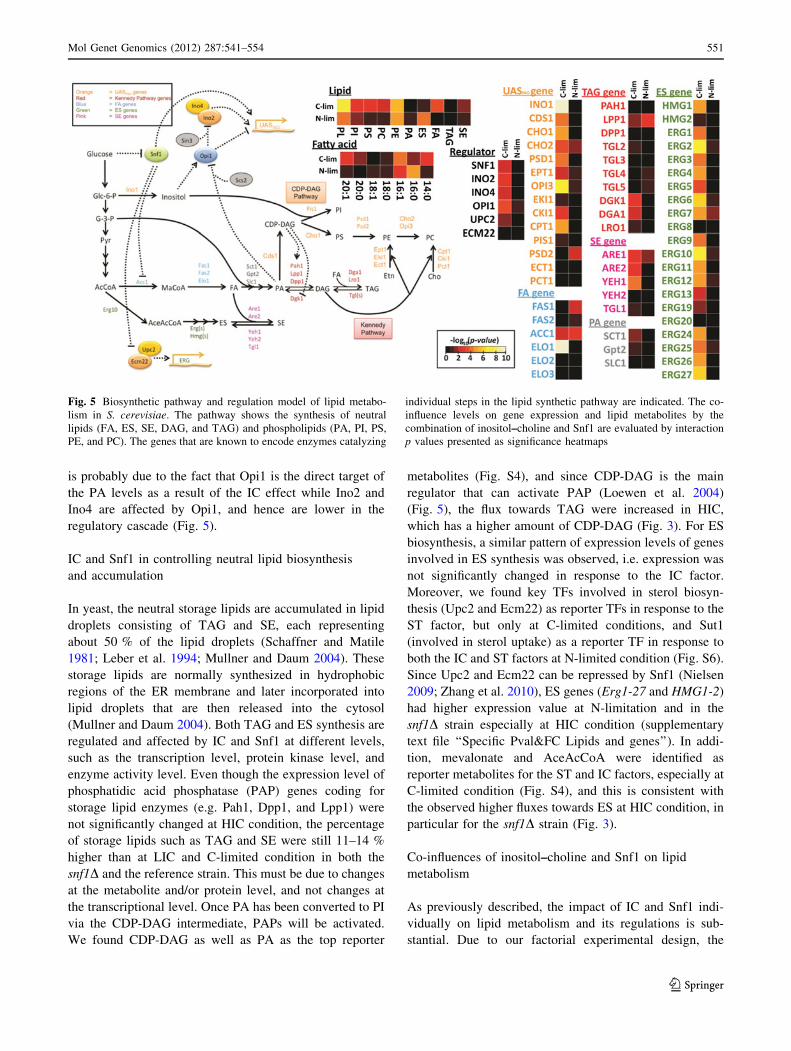
is probably due to the fact that Opi1 is the direct target of
the PA levels as a result of the IC effect while Ino2 and
Ino4 are affected by Opi1, and hence are lower in the
regulatory cascade (Fig. 5).
IC and Snf1 in controlling neutral lipid biosynthesis
and accumulation
In yeast, the neutral storage lipids are accumulated in lipid
droplets consisting of TAG and SE, each representing
about 50 % of the lipid droplets (Schaffner and Matile
1981; Leber et al. 1994; Mullner and Daum 2004). These
storage lipids are normally synthesized in hydrophobic
regions of the ER membrane and later incorporated into
lipid droplets that are then released into the cytosol
(Mullner and Daum 2004). Both TAG and ES synthesis are
regulated and affected by IC and Snf1 at different levels,
such as the transcription level, protein kinase level, and
enzyme activity level. Even though the expression level of
phosphatidic acid phosphatase (PAP) genes coding for
storage lipid enzymes (e.g. Pah1, Dpp1, and Lpp1) were
not significantly changed at HIC condition, the percentage
of storage lipids such as TAG and SE were still 11–14 %
higher than at LIC and C-limited condition in both the
snf1D and the reference strain. This must be due to changes
at the metabolite and/or protein level, and not changes at
the transcriptional level. Once PA has been converted to PI
via the CDP-DAG intermediate, PAPs will be activated.
We found CDP-DAG as well as PA as the top reporter
metabolites (Fig. S4), and since CDP-DAG is the main
regulator that can activate PAP (Loewen et al. 2004)
(Fig. 5), the flux towards TAG were increased in HIC,
which has a higher amount of CDP-DAG (Fig. 3). For ES
biosynthesis, a similar pattern of expression levels of genes
involved in ES synthesis was observed, i.e. expression was
not significantly changed in response to the IC factor.
Moreover, we found key TFs involved in sterol biosyn-
thesis (Upc2 and Ecm22) as reporter TFs in response to the
ST factor, but only at C-limited conditions, and Sut1
(involved in sterol uptake) as a reporter TF in response to
both the IC and ST factors at N-limited condition (Fig. S6).
Since Upc2 and Ecm22 can be repressed by Snf1 (Nielsen
2009; Zhang et al. 2010), ES genes (Erg1-27 and HMG1-2)
had higher expression value at N-limitation and in the
snf1D strain especially at HIC condition (supplementary
text file ‘‘Specific Pval&FC Lipids and genes’’). In addi-
tion, mevalonate and AceAcCoA were identified as
reporter metabolites for the ST and IC factors, especially at
C-limited condition (Fig. S4), and this is consistent with
the observed higher fluxes towards ES at HIC condition, in
particular for the snf1D strain (Fig. 3).
Co-influences of inositol–choline and Snf1 on lipid
metabolism
As previously described, the impact of IC and Snf1 indi-
vidually on lipid metabolism and its regulations is sub-
stantial. Due to our factorial experimental design, the
Fig. 5 Biosynthetic pathway and regulation model of lipid metabo-
lism in S. cerevisiae. The pathway shows the synthesis of neutral
lipids (FA, ES, SE, DAG, and TAG) and phospholipids (PA, PI, PS,
PE, and PC). The genes that are known to encode enzymes catalyzing
individual steps in the lipid synthetic pathway are indicated. The co-
influence levels on gene expression and lipid metabolites by the
combination of inositol–choline and Snf1 are evaluated by interaction
p values presented as significance heatmaps
Mol Genet Genomics (2012) 287:541–554 551
123
Page 12
co-influences resulting from cross talking between inosi-
tol–choline and Snf1 could, however, also be evaluated.
With our experimental setup it is possible to see the effects
from the deletion of SNF1 and also the substrate limitations
that leads to changes in Snf1 activity (i.e. with the ST
factor it is presence versus absence of Snf1 and for
C-limitation Snf1 is active and for N-limitation it is inac-
tive). So we have two slightly different co-influences of
inositol–choline with active Snf1 and inositol–choline with
inactive Snf1. Based on the integrative analysis Fig. 5
summarizes the key regulation of the lipid biosynthesis
pathways confirmed and identified by our study. The co-
influences between Snf1 and inositol–choline are also
reported as a heatmap in the figure for each gene expres-
sion and measured lipids (adjusted interaction p values).
The summarized figure provides compelling evidence of
substantially co-influences of inositol–choline and Snf1 in
terms of regulating the lipid metabolism. We can conclude
that the co-influence of inositol–choline and Snf1 depends
on the active state of Snf1 at both the transcription and
lipid metabolite levels. Interestingly, INO1 was substan-
tially influenced by both factors, which should be the
consequence of the response of the regulators Ino2, Ino4
and Opi1, and this leads to changes in phospholipid
metabolism. Transcription of genes in the ergosterol and
sterol-ester synthesis pathway was also influenced by cross
talking of inositol–choline and Snf1. Surprisingly, tran-
scription of ACC1, encoding the rate controlling enzyme in
fatty acid biosynthesis, was significantly influenced at both
C- and N-limitation indicating a special response to the
combination of IC and Snf1 (both in active or inactive
form). This evidence may link to the fact that inositol
auxotrophy in a snf1D strain can be rescued by inhibiting
Acc1 activity (Woods et al. 1994), probably due to a
decreased flux through fatty acid synthesis, which may
allow the mutant to synchronize fatty acid synthesis with
the reduction of inositol synthesis when Snf1 is absent, and
hereby ensure that phospholipid biosynthesis is balanced
with the demand for cellular growth. Besides, we found
that the interaction between IC and Snf1 did not influence
the expression levels of most of the lipid genes much in
N-limited condition (except a few genes e.g. ACC1, CHO2,
PSD2, LPP1 and FAS1) since the global transcriptional
responses caused by the ST factor were so small at
N-limited conditions (where Snf1 were inactive).
Thus, in conclusion through integrated analysis of the
transcriptome, lipid profiling, and flux analysis derived
from a robust experimental design we were able to get
insight into how gene expression is linked to the fluxes in
lipid biosynthesis at the global level. Among the interesting
findings is an effect of inositol–choline, but not by Snf1, on
the UPR pathway via the transcription factor Hac1. This
evidence points to an interesting link between lipid
metabolism and the protein secretory pathway, both
involving activities in the endoplasmic reticulum. Globally,
both Snf1 and inositol–choline influence and also co-
influence lipid metabolism, especially phospholipid bio-
synthesis were affected via the transcription factors (i.e.
Ino2, Ino4, and Opi1) or indirectly through other tran-
scription factors e.g. Gis1, Mga2, Upc2, Ecm22, Pip2,
Oaf1, Sut1, Hac1, etc. Our data also suggested that storage
lipid synthesis and accumulation seem to be controlled at
the enzyme activity level (i.e. Dpp1, Lpp1, Pah1, and
Dgk1). Thus, through our genome-wide analysis of lipid
metabolism we managed to both confirm earlier findings
and map several novel regulatory circuits involved in
controlling how carbon is directed into the different bran-
ches of lipid metabolism.
Acknowledgments This work was financed by Chalmers Founda-
tion, the Knut and Alice Wallenberg Foundation and the Swedish
Research Council (Vetenskapsradet). We also acknowledge funding
from the EU-funded project UNICELLSYS. Pramote Chumnanpuen
also would like to thank the Office of the Higher Education Com-
mission, Thailand for support by a stipend for his Ph.D. program
under the program Strategic Scholarships for Frontier Research
Network. We also thank Nils-Gunnar Carlsson for valuable assistance
with running the HPLC-CAD, Tobias Osterlund and Klaas Buijs for
helpful suggestions on manuscript preparation.
References
Abdulrehman D, Monteiro PT, Teixeira MC, Mira NP, Lourenco AB,
dos Santos SC, Cabrito TR, Francisco AP, Madeira SC, Aires
RS, Oliveira AL, Sa-Correia I, Freitas AT (2011) YEASTRACT:
providing a programmatic access to curated transcriptional
regulatory associations in Saccharomyces cerevisiae through a
web services interface. Nucleic Acids Res 39(Database issue):
D136–D140
Alepuz PM, Cunningham KW, Estruch F (1997) Glucose repression
affects ion homeostasis in yeast through the regulation of the
stress-activated ENA1 gene. Mol Microbiol 26(1):91–98
Ambroziak J, Henry SA (1994) INO2 and INO4 gene products,
positive regulators of phospholipid biosynthesis in Saccharomy-ces cerevisiae, form a complex that binds to the INO1 promoter.
J Biol Chem 269(21):15344–15349
Arndt KM, Ricupero-Hovasse S, Winston F (1995) TBP mutants
defective in activated transcription in vivo. EMBO J 14(7):1490–
1497
Ashburner M, Ball CA, Blake JA, Botstein D, Butler H, Cherry JM,
Davis AP, Dolinski K, Dwight SS, Eppig JT, Harris MA, Hill
DP, Issel-Tarver L, Kasarskis A, Lewis S, Matese JC, Richard-
son JE, Ringwald M, Rubin GM, Sherlock G (2000) Gene
ontology: tool for the unification of biology. The Gene Ontology
Consortium. Nat Genet 25(1):25–29
Bailis AM, Poole MA, Carman GM, Henry SA (1987) The
membrane-associated enzyme phosphatidylserine synthase is
regulated at the level of messenger-RNA abundance. Mol Cell
Biol 7(1):167–176
Balciunas D, Ronne H (1999) Yeast genes GIS1-4: multicopy
suppressors of the Gal- phenotype of snf1 mig1 srb8/10/11 cells.
Mol Gen Genet 262(4–5):589–599
552 Mol Genet Genomics (2012) 287:541–554
123
Page 13
Benjamini Y, Hochberg Y (1995) Controlling the false discovery
rate—a practical and powerful approach to multiple testing.
J Roy Stat Soc B Met 57(1):289–300
Bligh EG, Dyer WJ (1959) A rapid method of total lipid extraction
and purification. Can J Biochem Physiol 37(8):911–917
Braun S, Matuschewski K, Rape M, Thoms S, Jentsch S (2002) Role
of the ubiquitin-selective CDC48(UFD1/NPL4)chaperone (seg-
regase) in ERAD of OLE1 and other substrates. EMBO J 21
(4):615–621
Canelas AB, Harrison N, Fazio A, Zhang J, Pitkanen JP, van den
Brink J, Bakker BM, Bogner L, Bouwman J, Castrillo JI,
Cankorur A, Chumnanpuen P, Daran-Lapujade P, Dikicioglu D,
van Eunen K, Ewald JC, Heijnen JJ, Kirdar B, Mattila I,
Mensonides FI, Niebel A, Penttila M, Pronk JT, Reuss M,
Salusjarvi L, Sauer U, Sherman D, Siemann-Herzberg M,
Westerhoff H, de Winde J, Petranovic D, Oliver SG, Workman
CT, Zamboni N, Nielsen J (2010) Integrated multilaboratory
systems biology reveals differences in protein metabolism
between two reference yeast strains. Nat Commun 1:145
Celenza JL, Carlson M (1984) Cloning and genetic mapping of SNF1,
a gene required for expression of glucose-repressible genes in
Saccharomyces cerevisiae. Mol Cell Biol 4(1):49–53
Donahue TF, Henry SA (1981) myo-Inositol-1-phosphate synthase.
Characteristics of the enzyme and identification of its structural
gene in yeast. J Biol Chem 256(13):7077–7085
Gancedo JM (1998) Yeast carbon catabolite repression. Microbiol
Mol Biol Rev 62(2):334–361
Gaspar ML, Aregullin MA, Jesch SA, Henry SA (2006) Inositol
induces a profound alteration in the pattern and rate of synthesis
and turnover of membrane lipids in Saccharomyces cerevisiae.
J Biol Chem 281(32):22773–22785
Gavin AC, Bosche M, Krause R, Grandi P, Marzioch M, Bauer A,
Schultz J, Rick JM, Michon AM, Cruciat CM, Remor M, Hofert
C, Schelder M, Brajenovic M, Ruffner H, Merino A, Klein K,
Hudak M, Dickson D, Rudi T, Gnau V, Bauch A, Bastuck S,
Huhse B, Leutwein C, Heurtier MA, Copley RR, Edelmann A,
Querfurth E, Rybin V, Drewes G, Raida M, Bouwmeester T,
Bork P, Seraphin B, Kuster B, Neubauer G, Superti-Furga G
(2002) Functional organization of the yeast proteome by
systematic analysis of protein complexes. Nature 415(6868):
141–147
Graves JA, Henry SA (2000) Regulation of the yeast INO1 gene. The
products of the INO2, INO4 and OPI1 regulatory genes are not
required for repression in response to inositol. Genetics 154(4):
1485–1495
Greenberg ML, Goldwasser P, Henry SA (1982) Characterization of a
yeast regulatory mutant constitutive for synthesis of inositol-1-
phosphate synthase. Mol Gen Genet 186(2):157–163
Henry SA, Patton-Vogt JL (1998) Genetic regulation of phospholipid
metabolism: yeast as a model eukaryote. Prog Nucleic Acid Res
Mol Biol 61:133–179
Hiltunen JK, Mursula AM, Rottensteiner H, Wierenga RK, Kastani-
otis AJ, Gurvitz A (2003) The biochemistry of peroxisomal
beta-oxidation in the yeast Saccharomyces cerevisiae. FEMS
Microbiol Rev 27(1):35–64
Hong SP, Carlson M (2007) Regulation of snf1 protein kinase in
response to environmental stress. J Biol Chem 282(23):16838–
16845
Jackson JC, Lopes JM (1996) The yeast UME6 gene is required for
both negative and positive transcriptional regulation of phospho-
lipid biosynthetic gene expression. Nucleic Acids Res 24(7):
1322–1329
Jesch SA, Zhao X, Wells MT, Henry SA (2005) Genome-wide
analysis reveals inositol, not choline, as the major effector of
Ino2p-Ino4p and unfolded protein response target gene expres-
sion in yeast. J Biol Chem 280(10):9106–9118
Kelley MJ, Bailis AM, Henry SA, Carman GM (1988) Regulation of
phospholipid biosynthesis in Saccharomyces cerevisiae by
inositol. Inositol is an inhibitor of phosphatidylserine synthase
activity. J Biol Chem 263(34):18078–18085
Khoomrung S, Chumnanpuen P, Jansa-ard S, Nookaew I, Nielsen J
(2012). Fast and accurate preparation fatty acid methyl esters by
microwave-assisted derivatization in yeast Saccharomyces cere-visiae. Accepted in Applied Microbiology and Biotechnology
Klig LS, Homann MJ, Carman GM, Henry SA (1985) Coordinate
regulation of phospholipid biosynthesis in Saccharomyces cere-visiae—pleiotropically constitutive opil mutant. J Bacteriol
162(3):1135–1141
Kuchin S, Treich I, Carlson M (2000) A regulatory shortcut between
the Snf1 protein kinase and RNA polymerase II holoenzyme.
Proc Natl Acad Sci USA 97(14):7916–7920
Kuchin S, Vyas VK, Carlson M (2002) Snf1 protein kinase and the
repressors Nrg1 and Nrg2 regulate FLO11, haploid invasive
growth, and diploid pseudohyphal differentiation. Mol Cell Biol
22(12):3994–4000
Kumme J, Dietz M, Wagner C, Schuller HJ (2008) Dimerization of
yeast transcription factors Ino2 and Ino4 is regulated by
precursors of phospholipid biosynthesis mediated by Opi1
repressor. Curr Genet 54(1):35–45
Leber R, Zinser E, Zellnig G, Paltauf F, Daum G (1994) Character-
ization of lipid particles of the yeast, Saccharomyces cerevisiae.
Yeast 10(11):1421–1428
Lin SS, Manchester JK, Gordon JI (2003) Sip2, an N-myristoylated
beta subunit of Snf1 kinase, regulates aging in Saccharomycescerevisiae by affecting cellular histone kinase activity, recom-
bination at rDNA loci, and silencing. J Biol Chem 278(15):
13390–13397
Liu Y, Xu X, Kuo M-H (2010) Snf1p regulates Gcn5p transcriptional
activity by antagonizing Spt3p. Genetics 184(1):91–105
Lo WS, Duggan L, Emre NC, Belotserkovskya R, Lane WS,
Shiekhattar R, Berger SL (2001) Snf1-a histone kinase that
works in concert with the histone acetyltransferase Gcn5 to
regulate transcription. Science 293(5532):1142–1146
Lo WS, Gamache ER, Henry KW, Yang D, Pillus L, Berger SL
(2005) Histone H3 phosphorylation can promote TBP recruit-
ment through distinct promoter-specific mechanisms. EMBO J
24(5):997–1008
Loewen CJ, Gaspar ML, Jesch SA, Delon C, Ktistakis NT, Henry SA,
Levine TP (2004) Phospholipid metabolism regulated by a
transcription factor sensing phosphatidic acid. Science 304
(5677):1644–1647
Loewen CJ, Roy A, Levine TP (2003) A conserved ER targeting
motif in three families of lipid binding proteins and in Opi1p
binds VAP. EMBO J 22(9):2025–2035
Lopes JM, Henry SA (1991) Interaction of trans and cis regulatory
elements in the INO1 promoter of Saccharomyces cerevisiae.
Nucleic Acids Res 19(14):3987–3994
Mullner H, Daum G (2004) Dynamics of neutral lipid storage in
yeast. Acta Biochim Pol 51(2):323–347
Nath N, McCartney RR, Schmidt MC (2003) Yeast Pak1 kinase
associates with and activates Snf1. Mol Cell Biol 23(11):3909–
3917
Nielsen J (2009) Systems biology of lipid metabolism: from yeast to
human. FEBS Lett 583(24):3905–3913
Nookaew I, Jewett MC, Meechai A, Thammarongtham C, Laoteng K,
Cheevadhanarak S, Nielsen J, Bhumiratana S (2008) The
genome-scale metabolic model iIN800 of Saccharomyces cere-visiae and its validation: a scaffold to query lipid metabolism.
BMC Syst Biol 2:71
Oliveira AP, Patil KR, Nielsen J (2008) Architecture of transcrip-
tional regulatory circuits is knitted over the topology of bio-
molecular interaction networks. BMC Syst Biol 2:17
Mol Genet Genomics (2012) 287:541–554 553
123
Page 14
Patil KR, Nielsen J (2005) Uncovering transcriptional regulation of
metabolism by using metabolic network topology. Proc Natl
Acad Sci USA 102(8):2685–2689
Portillo F, Mulet JM, Serrano R (2005) A role for the non-phosphor-
ylated form of yeast Snf1: tolerance to toxic cations and activation
of potassium transport. FEBS Lett 579(2):512–516
Ratnakumar S, Young ET (2010) Snf1 dependence of peroxisomal
gene expression is mediated by Adr1. J Biol Chem 285(14):
10703–10714
Santiago TC, Mamoun CB (2003) Genome expression analysis in
yeast reveals novel transcriptional regulation by inositol and
choline and new regulatory functions for Opi1p, Ino2p, and
Ino4p. J Biol Chem 278(40):38723–38730
Sanz P (2003) Snf1 protein kinase: a key player in the response to
cellular stress in yeast. Biochem Soc Trans 31(Pt 1):178–181
Sattur AP, Karanth NG (1989a) Production of microbial lipids: II.
Influence of C/N ratio-model prediction. Biotechnol Bioeng
34(6):868–871
Sattur AP, Karanth NG (1989b) Production of microbial lipids: III.
Influence of C/N ratio-experimental observations. Biotechnol
Bioeng 34(6):872–874. doi:10.1002/bit.260340618
Schaffner G, Matile P (1981) Structure and composition of bakers-
yeast lipid globules. Biochemie Und Physiologie Der Pflanzen
176(7):659–666
Schwank S, Ebbert R, Rautenstrauss K, Schweizer E, Schuller HJ
(1995) Yeast transcriptional activator INO2 interacts as an
Ino2p/Ino4p basic helix-loop-helix heteromeric complex with
the inositol/choline-responsive element necessary for expression
of phospholipid biosynthetic genes in Saccharomyces cerevisiae.
Nucleic Acids Res 23(2):230–237
Shirra MK, McCartney RR, Zhang C, Shokat KM, Schmidt MC,
Arndt KM (2008) A chemical genomics study identifies Snf1 as
a repressor of GCN4 translation. J Biol Chem 283(51):35889–
35898
Shirra MK, Patton-Vogt J, Ulrich A, Liuta-Tehlivets O, Kohlwein SD,
Henry SA, Arndt KM (2001) Inhibition of acetyl coenzyme A
carboxylase activity restores expression of the INO1 gene in a
snf1 mutant strain of Saccharomyces cerevisiae. Mol Cell Biol
21(17):5710–5722
Silversand C, Haux C (1997) Improved high-performance liquid
chromatographic method for the separation and quantification of
lipid classes: application to fish lipids. J Chromatogr B Biomed
Sci Appl 703(1–2):7–14
Soontorngun N, Larochelle M, Drouin S, Robert F, Turcotte B (2007)
Regulation of gluconeogenesis in Saccharomyces cerevisiae is
mediated by activator and repressor functions of Rds2. Mol Cell
Biol 27(22):7895–7905
Stark C, Breitkreutz BJ, Chatr-Aryamontri A, Boucher L, Oughtred
R, Livstone MS, Nixon J, Van Auken K, Wang X, Shi X, Reguly
T, Rust JM, Winter A, Dolinski K, Tyers M (2011) The
BioGRID interaction database: 2011 update. Nucleic Acids Res
39(Database issue):D698–D704
Sutherland CM, Hawley SA, McCartney RR, Leech A, Stark MJ
(2003) Elm1p is one of three upstream kinases for the
Saccharomyces cerevisiae SNF1 complex. Curr Biol 13:1299
Tehlivets O, Scheuringer K, Kohlwein SD (2007) Fatty acid synthesis
and elongation in yeast. Biochim Biophys Acta 1771(3):255–270
Thomas M, Polge C (2007) SNF1/AMPK/SnRK1 kinases, global
regulators at the heart of energy control? Trends Plant Sci 12(1):
20–28
Usaite R, Jewett MC, Oliveira AP, Yates JR 3rd, Olsson L, Nielsen J
(2009) Reconstruction of the yeast Snf1 kinase regulatory
network reveals its role as a global energy regulator. Mol Syst
Biol 5:319
van Dijken JP, Bauer J, Brambilla L, Duboc P, Francois JM, Gancedo
C, Giuseppin MLF, Heijnen JJ, Hoare M, Lange HC, Madden
EA, Niederberger P, Nielsen J, Parrou JL, Petit T, Porro D,
Reuss M, van Riel N, Rizzi M, Steensma HY, Verrips CT,
Vindelov J, Pronk JT (2000) An interlaboratory comparison of
physiological and genetic properties of four Saccharomycescerevisiae strains. Enzyme Microb Tech 26(9–10):706–714
Verduyn C, Postma E, Scheffers WA, Vandijken JP (1992) Effect of
benzoic-acid on metabolic fluxes in yeasts—a continuous-culture
study on the regulation of respiration and alcoholic fermentation.
Yeast 8(7):501–517
White MJ, Hirsch JP, Henry SA (1991) The OPI1 gene of
Saccharomyces cerevisiae, a negative regulator of phospholipid
biosynthesis, encodes a protein containing polyglutamine tracts
and a leucine zipper. J Biol Chem 266(2):863–872
Woods A, Munday MR, Scott J, Yang X, Carlson M, Carling D
(1994) Yeast SNF1 is functionally related to mammalian AMP-
activated protein kinase and regulates acetyl-CoA carboxylase in
vivo. J Biol Chem 269(30):19509–19515
Ye T, Elbing K, Hohmann S (2008) The pathway by which the yeast
protein kinase Snf1p controls acquisition of sodium tolerance is
different from that mediating glucose regulation. Microbiol-Sgm
154:2814–2826
Zaldivar J, Borges A, Johansson B, Smits HP, Villas-Boas SG,
Nielsen J, Olsson L (2002) Fermentation performance and
intracellular metabolite patterns in laboratory and industrial
xylose-fermenting Saccharomyces cerevisiae. Appl Microbiol
Biotechnol 59(4–5):436–442
Zhang J, Olsson L, Nielsen J (2010) The beta-subunits of the Snf1
kinase in Saccharomyces cerevisiae, Gal83 and Sip2, but not
Sip1, are redundant in glucose derepression and regulation of
sterol biosynthesis. Mol Microbiol 77(2):371–383
Zhang J, Vaga S, Chumnanpuen P, Kumar R, Vemuri GN, Aebersold
R, Nielsen J (2011) Mapping the interaction of Snf1 with
TORC1 in Saccharomyces cerevisiae. Mol Syst Biol 7:545
Zhang S, Skalsky Y, Garfinkel DJ (1999) MGA2 or SPT23 is required
for transcription of the delta9 fatty acid desaturase gene, OLE1,
and nuclear membrane integrity in Saccharomyces cerevisiae.
Genetics 151(2):473–483
554 Mol Genet Genomics (2012) 287:541–554
123