Mitsubishi Heavy Industries Technical Review Vol. 47 No. 2 (June 2010) 1 *1 Manager, Transportation Systems and Advanced Technology Division *2 Manager, Hiroshima Research and Development Center, Technical Headquarters *3 Hiroshima Research and Development Center, Technical Headquarters *4 Nagoya Research & Development Center, Technical Headquarters Integrated APM/LRT Simulator for Energy Evaluation YASUYUKI SUZUKI *1 KYOTARO ONISHI *1 HIROSHI YAMASHITA *2 KATSUAKI MORITA *3 NORITAKA YANAI *3 MASAYA MITAKE *4 In response to the growing interest in environmentally friendly energy-efficient transportation systems, Mitsubishi Heavy Industries, Ltd. (MHI) has developed a simulation system for evaluating the operational aspects and energy efficiency of guided transportation systems. The simulator can be used to analyze not only conventional systems that use a contact line to supply electricity to trains, but also energy-smart transportation systems that use a battery. Improvements in system design efficiency and optimal system planning are now possible because the simulator enables the comprehensive evaluation and energy analysis of complete transportation systems as well as single trains. This article provides an overview of the simulator. | 1. Introduction Environmentally-friendly transportation systems are attracting greater attention as environmental issues become a global concern. MHI provides safe and comfortable ground transportation systems around the world, including an automated people mover (APM), a new system equipped with rubber tires, and steel-wheeled light-rail transit (LRT) systems. At the same time, MHI is actively pursuing the development of high-performance batteries with greater energy and output densities. Aimed at use in guided transportation systems, and hybrid and electric vehicles, battery performance is improving rapidly. The need for energy-efficient transportation systems is expected to grow. System conditions such as gradient, operational conditions, number of cars, and requirements for battery systems vary greatly depending on the client’s route specifications. The use of simulation techniques for overall system evaluation is crucial to be able to respond swiftly to each client’s specific needs, and to offer a system that enables transportation of the required capacity with optimal energy efficiency. MHI’s transportation system simulator allows the company to improve system design efficiency and to offer optimal client-specific system solutions. The program also features animation capabilities that provide users better visual and intuitive understanding of train performance characteristics. | 2. Simulator overview As shown in Figure 1, the simulator recreates the overall behavior of a transportation system by linking models of components, such as the power, trains, operation control system, and signaling system, with a separate ground model. The ground model controls the network structure of the tracks, track circuit, and gradient data. While the train model performs runs between stations based on departure commands from the operation control system model, it also requires gradient information from the ground model and effective thrust force from the power model for accurate kinetic calculations. The travel distance data from the kinetic calculations are sent to the ground model, which returns data on the post-travel vehicle position and gradient, as well as speed signals for automatic train operation. The signaling system model performs speed signal setting and turnout control for the track circuit based on route requests from the operation control system model, train positions, and turnout status.
*1 Manager, Transportation Systems and Advanced Technology Division
*2 Manager, Hiroshima Research and Development Center, Technical Headquarters
*3 Hiroshima Research and Development Center, Technical Headquarters
*4 Nagoya Research & Development Center, Technical Headquarters
Integrated APM/LRT Simulator for Energy Evaluation
YASUYUKI SUZUKI*1 KYOTARO ONISHI*1
HIROSHI YAMASHITA*2 KATSUAKI MORITA*3
NORITAKA YANAI*3 MASAYA MITAKE*4
In response to the growing interest in environmentally friendly energy-efficient
transportation systems, Mitsubishi Heavy Industries, Ltd. (MHI) has developed a simulation system for evaluating the operational aspects and energy efficiency of guided transportation systems. The simulator can be used to analyze not only conventional systems that use a contact line to supply electricity to trains, but also energy-smart transportation systems that use a battery. Improvements in system design efficiency and optimal system planning are now possible because the simulator enables the comprehensive evaluation and energy analysis of complete transportation systems as well as single trains. This article provides an overview of the simulator.
|1. Introduction
Environmentally-friendly transportation systems are attracting greater attention as environmental issues become a global concern. MHI provides safe and comfortable ground transportation systems around the world, including an automated people mover (APM), a new system equipped with rubber tires, and steel-wheeled light-rail transit (LRT) systems. At the same time, MHI is actively pursuing the development of high-performance batteries with greater energy and output densities. Aimed at use in guided transportation systems, and hybrid and electric vehicles, battery performance is improving rapidly. The need for energy-efficient transportation systems is expected to grow. System conditions such as gradient, operational conditions, number of cars, and requirements for battery systems vary greatly depending on the client’s route specifications. The use of simulation techniques for overall system evaluation is crucial to be able to respond swiftly to each client’s specific needs, and to offer a system that enables transportation of the required capacity with optimal energy efficiency.
MHI’s transportation system simulator allows the company to improve system design efficiency and to offer optimal client-specific system solutions. The program also features animation capabilities that provide users better visual and intuitive understanding of train performance characteristics.
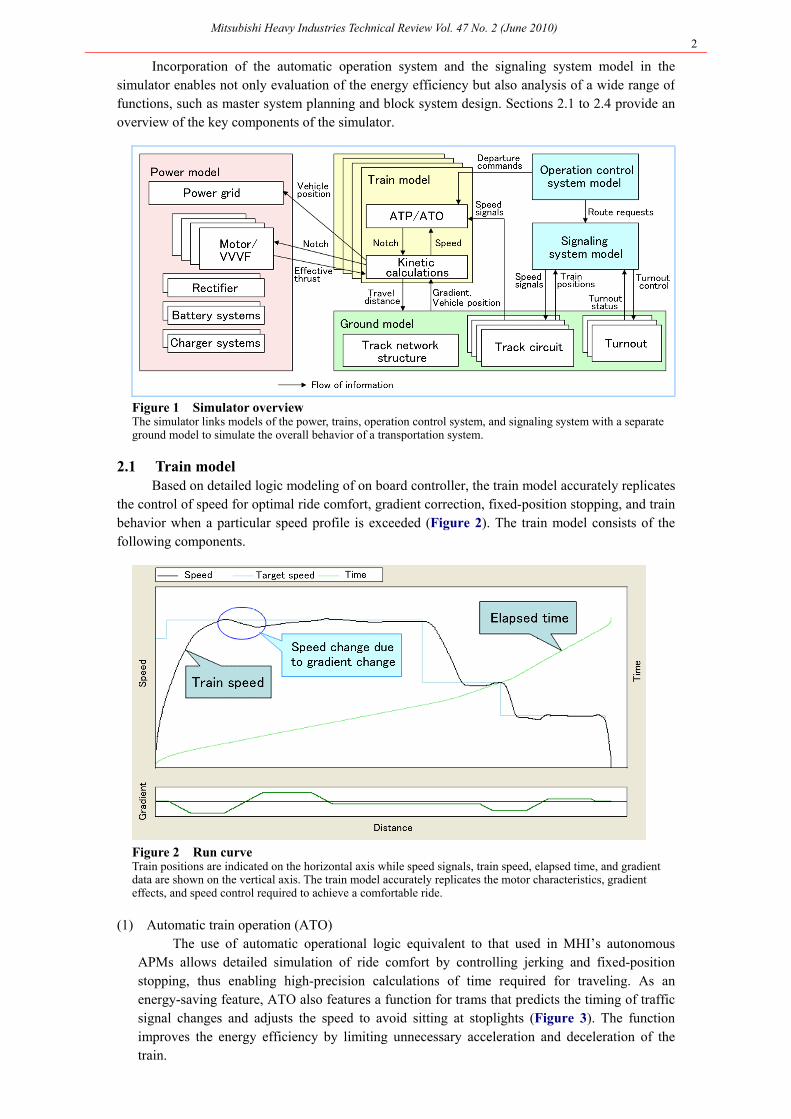
|2. Simulator overview As shown in Figure 1, the simulator recreates the overall behavior of a transportation system
by linking models of components, such as the power, trains, operation control system, and signaling system, with a separate ground model.
The ground model controls the network structure of the tracks, track circuit, and gradient data. While the train model performs runs between stations based on departure commands from the operation control system model, it also requires gradient information from the ground model and effective thrust force from the power model for accurate kinetic calculations. The travel distancedata from the kinetic calculations are sent to the ground model, which returns data on thepost-travel vehicle position and gradient, as well as speed signals for automatic train operation. The signaling system model performs speed signal setting and turnout control for the track circuit based on route requests from the operation control system model, train positions, and turnout status.
Incorporation of the automatic operation system and the signaling system model in the simulator enables not only evaluation of the energy efficiency but also analysis of a wide range of functions, such as master system planning and block system design. Sections 2.1 to 2.4 provide an overview of the key components of the simulator.
Figure 1 Simulator overview The simulator links models of the power, trains, operation control system, and signaling system with a separate ground model to simulate the overall behavior of a transportation system.
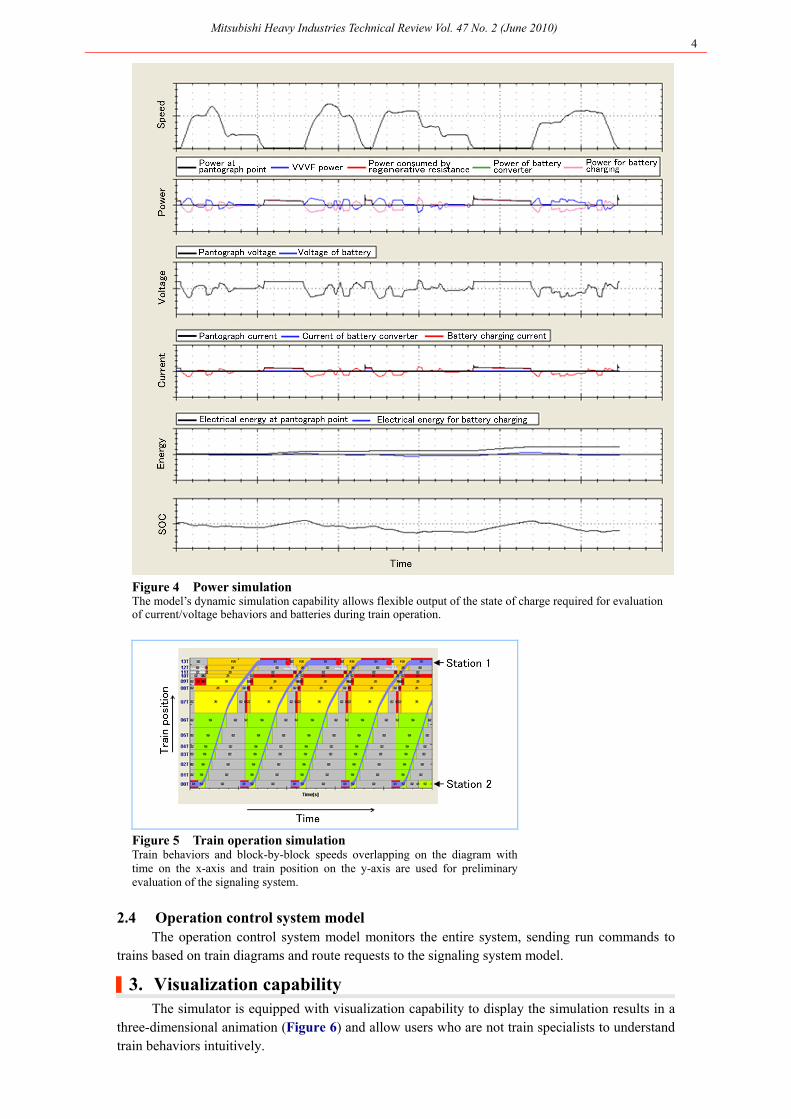
2.1 Train model Based on detailed logic modeling of on board controller, the train model accurately replicates
the control of speed for optimal ride comfort, gradient correction, fixed-position stopping, and train behavior when a particular speed profile is exceeded (Figure 2). The train model consists of the following components.
Figure 2 Run curve Train positions are indicated on the horizontal axis while speed signals, train speed, elapsed time, and gradient data are shown on the vertical axis. The train model accurately replicates the motor characteristics, gradient effects, and speed control required to achieve a comfortable ride.
(1) Automatic train operation (ATO) The use of automatic operational logic equivalent to that used in MHI’s autonomous
APMs allows detailed simulation of ride comfort by controlling jerking and fixed-position stopping, thus enabling high-precision calculations of time required for traveling. As an energy-saving feature, ATO also features a function for trams that predicts the timing of traffic signal changes and adjusts the speed to avoid sitting at stoplights (Figure 3). The function improves the energy efficiency by limiting unnecessary acceleration and deceleration of the train.
Figure 3 Run curve comparison of normal and energy-saving operations The speed of the train is kept low when nearing traffic lights to avoid deceleration and save energy based on prediction of the traffic signal changes. The acceleration/deceleration frequency is thus reduced without changing the overall running time.
(2) Automatic train protection (ATP)
The simulator features an automatic train control system for a preliminary study of the minimum headway, a key requirement for guided transportation systems. The simulator also includes automatic train protection (ATP) to prevent collisions and derailments. This feature decelerates the train when approaching too close to the train in front or when a turnout has been switched. The ATP system is equivalent to the automatic train control system (ATC) commonly used in Japan, and operates in concert with the wayside signaling system model described below.
(3) Kinetic calculations Kinetic calculations of the train motion are performed by applying the motor’s effective
thrust, gradient, and travel resistance based on a notch command supplied by the ATP/ATO systems. The effect of insufficient power due to voltage drops can also be simulated because effective thrust is determined by a circuit network calculation in the power model.
2.2 Power model In the power model, devices such as the contact line-powered systems, substations, battery
systems, and charger systems can be positioned at any point along a route. The power rails can either be set over the full length of the route (common practice), partially set, or not set at all. The train type can be selected as either standard contact line-powered or battery-powered, with the option of placing multiple trains on the route.
The model’s capacity for dynamic simulation allows flexible output of the state of charge required for evaluation of current/voltage behaviors and batteries at multiple points during train operation (Figure 4). The resulting data can be used for analysis of voltage drops on the contact line, and substation and battery capacities to determine the specifications of each device. The model also provides data for overall system power consumption in addition to individual data for each train and facility. 2.3 Signaling system model
The signaling system model consists of the interlocks and the ATP required to conduct accurate simulation of complex train operations such as re-entering a main line. (1) Interlock
The interlock controls turnouts, the signal aspect based on the track circuit status, the turnout status, and the route requests received from the operation control system.
(2) ATP The ATP sends speed signals to the track circuit appropriate to the number of open
sections on the route. The ATO and ATP described in Section 2.1 permit automated train operation based on these speed signals. Inclusion of this signaling system model allows an overlapping display of accurately simulated train behavior and block-by-block speed data (Figure 5), which can be used for preliminary evaluation of the signaling system.
Figure 4 Power simulation The model’s dynamic simulation capability allows flexible output of the state of charge required for evaluation of current/voltage behaviors and batteries during train operation.
Figure 5 Train operation simulation Train behaviors and block-by-block speeds overlapping on the diagram with time on the x-axis and train position on the y-axis are used for preliminary evaluation of the signaling system.
2.4 Operation control system model The operation control system model monitors the entire system, sending run commands to
trains based on train diagrams and route requests to the signaling system model.
|3. Visualization capability The simulator is equipped with visualization capability to display the simulation results in a
three-dimensional animation (Figure 6) and allow users who are not train specialists to understand train behaviors intuitively.
(1) The train in the foreground is already on the main track and is now passing the turnout.
(2) The train in the foreground has passed the turnout; the turnout is now being switched over.
(3) The switch is complete; the route for the second train is now clear.
(4) The second train enters the turnout.
Figure 6 Three-dimensional animated display showing an example of a turnout area
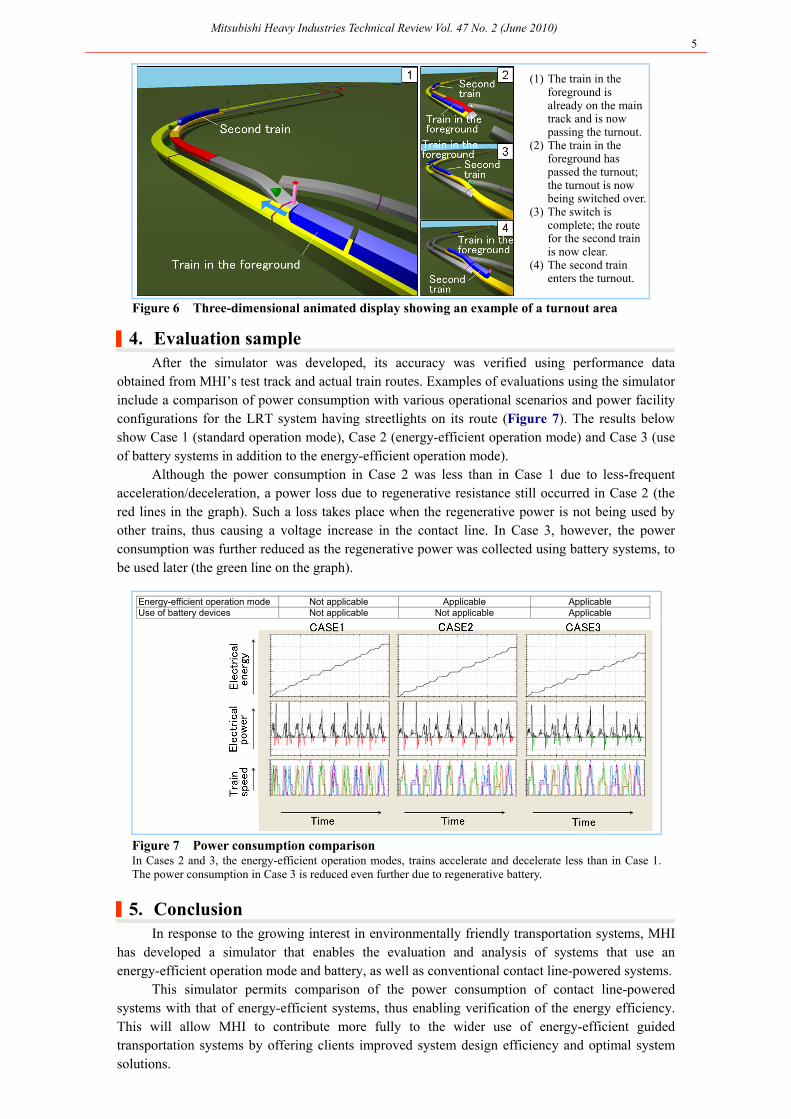
|4. Evaluation sample After the simulator was developed, its accuracy was verified using performance data
obtained from MHI’s test track and actual train routes. Examples of evaluations using the simulator include a comparison of power consumption with various operational scenarios and power facility configurations for the LRT system having streetlights on its route (Figure 7). The results below show Case 1 (standard operation mode), Case 2 (energy-efficient operation mode) and Case 3 (use of battery systems in addition to the energy-efficient operation mode).
Although the power consumption in Case 2 was less than in Case 1 due to less-frequent acceleration/deceleration, a power loss due to regenerative resistance still occurred in Case 2 (the red lines in the graph). Such a loss takes place when the regenerative power is not being used by other trains, thus causing a voltage increase in the contact line. In Case 3, however, the power consumption was further reduced as the regenerative power was collected using battery systems, to be used later (the green line on the graph).
Energy-efficient operation mode Not applicable Applicable Applicable Use of battery devices Not applicable Not applicable Applicable
Figure 7 Power consumption comparison In Cases 2 and 3, the energy-efficient operation modes, trains accelerate and decelerate less than in Case 1. The power consumption in Case 3 is reduced even further due to regenerative battery.
|5. Conclusion In response to the growing interest in environmentally friendly transportation systems, MHI
has developed a simulator that enables the evaluation and analysis of systems that use an energy-efficient operation mode and battery, as well as conventional contact line-powered systems.
This simulator permits comparison of the power consumption of contact line-powered systems with that of energy-efficient systems, thus enabling verification of the energy efficiency. This will allow MHI to contribute more fully to the wider use of energy-efficient guided transportation systems by offering clients improved system design efficiency and optimal system solutions.