Leonid Moroz SoftInWay, Inc., 1500 District Avenue, Burlington, MA 01803 e-mail: [email protected]Glenn Doerksen Sulzer Turbo Services Houston Inc., 11518 Old La Porte Road, La Porte, TX 77571 e-mail: [email protected]Fernando Romero Sulzer Turbo Services Houston Inc., 11518 Old La Porte Road, La Porte, TX 77571 e-mail: [email protected]Roman Kochurov 1 SoftInWay, Inc., 1500 District Avenue, Burlington, MA 01803 e-mail: [email protected]Boris Frolov SoftInWay, Inc., 1500 District Avenue, Burlington, MA 01803 e-mail: [email protected]Integrated Approach for Steam Turbine Thermostructural Analysis and Lifetime Prediction at Transient Operations In order to achieve the highest power plant efficiency, original equipment manufacturers continuously increase turbine working parameters (steam temperatures and pressures), improve components design, and modify start-up cycles to reduce time while providing more frequent start-up events. All these actions result in much higher levels of thermo- stresses, a lifetime consumption of primary components and an increased demand for accurate thermostructural and low cycle fatigue (LCF) simulations. In this study, some aspects of methodological improvement are analyzed and proposed in the frame of an integrated approach for steam turbine components thermostructural analysis, reliability, and lifetime prediction. The full scope of the engineering tasks includes aero/thermody- namic flow path and secondary flows analysis to determine thermal boundary conditions (BCs), detailed thermal/structural two-dimensional and three-dimensional (3D) finite ele- ment (FE) models preparation, components thermal and stress–strain simulation, rotor–casing differential expansion and clearances analysis, and finally, turbine unit life- time estimation. Special attention is paid to some of the key factors influencing the accu- racy of thermal stresses prediction, specifically, the effect of “steam condensation” on thermal BC, the level of detailing for thermal zones definition, thermal contacts, and mesh quality in mechanical models. These aspects have been studied and validated against test data, obtained via a 30 MW steam turbine for combined cycle application based on actual start-up data measured from the power plant. The casing temperatures and rotor–stator differential expansion, measured during the commissioning phase of the turbine, were used for methodology validation. Finally, the evaluation of the steam turbine HPIP rotor lifetime by means of a LCF approach is performed. [DOI: 10.1115/1.4037755] 1 Introduction Steam turbine accelerated start and operation flexibility together with long-term service life are the most desired and con- flicting requirements for the unit operation. Starting the turbine quickly can save fuel cost but results in premature component fail- ure due to low cycle fatigue (LCF). The main factor that limits turbine start-up time is thermal stresses. Thermal stresses occur in the turbine rotor and casing components (mostly high pressure (HP) and intermediate pressure (IP) cylinders) resulting in LCF and lifetime reduction. Cyclic life evaluation is based on the thermostresses analysis and requires a high level of finite element (FE) model detailing in order to pre- dict stress concentration in the fillets, grooves, etc. The details on thermal stresses initiation due to transient operation can be found in Ref. [1]. Another limiting factor is the differential rotor–casing expansion, which may lead to critical clearances reduction and damage. For steam turbine components, the thermal state is strongly influenced by the condensation process, which takes place primar- ily during the initial phase of cold start-up (CS) and continues until the rotor surface temperature becomes higher than the steam saturation temperature. Effect of “condensation” on thermal stresses depends on rotor and casing initial temperatures and steam conditions. When starting up from ambient metal tempera- ture (pure CS), the condensation provides increased speed of com- ponents temperature growth and consequently highest stresses. This effect becomes weaker with the metal initial temperature get- ting closer to steam saturation temperature. Convection condition accuracy and, especially, the effect of steam condensation during CS, are the key factors to realistically predict turbine unit thermal state during transients. The fundamentals of heat and mass transfer processes and basic principles of heat transfer coefficient (HTC) simulation are con- sidered in the monographs [2,3]. The pioneer work about film condensation for pure vapor is published by Nusselt [4]. He considered smooth and uniform liq- uid film on the wall surface and expressed condensation heat transfer coefficients as a ratio of thermal conductivity and thick- ness of laminar film condensate. A large number of correlations for predicting heat transfer coefficients during film condensation inside pipes have been proposed over the last 80 yr described in Refs. [5–7] and many other publications, where Nusselt correla- tions were improved and experimentally validated. The simple dimensionless correlation which has been verified by comparison with a wide variety of experimental data is developed in Ref. [5]. Experimental analysis of steam condensation in the vertical tube and HTC comparison against theoretically calculated results is performed in Ref. [6]. Some recommendations based on a sum- mary of calculated and experimental data are presented in Ref. [7]. Based on the results presented in these articles, the condensa- tion HTCs are significantly higher than that of dry conditions and could reach up to 12,000 W/(m 2 K). Despite the fact that for steam turbine components condensa- tion effect imposes most of the uncertainty that exists for thermo- structural analysis, there is very limited published information on condensation HTC simulation methodology and experimental results. Some theoretical approaches to account for the effect of condensation on HTC in different parts of steam turbine 1 Corresponding author. Contributed by the Turbomachinery Committee of ASME for publication in the JOURNAL OF ENGINEERING FOR GAS TURBINES AND POWER. Manuscript received July 17, 2017; final manuscript received July 18, 2017; published online October 3, 2017. Editor: David Wisler. Journal of Engineering for Gas Turbines and Power FEBRUARY 2018, Vol. 140 / 022604-1 Copyright V C 2018 by ASME Downloaded From: http://gasturbinespower.asmedigitalcollection.asme.org/ on 10/16/2017 Terms of Use: http://www.asme.org/about-asme/terms-of-use
Integrated Approach for SteamTurbine ThermostructuralAnalysis and Lifetime Predictionat Transient OperationsIn order to achieve the highest power plant efficiency, original equipment manufacturerscontinuously increase turbine working parameters (steam temperatures and pressures),improve components design, and modify start-up cycles to reduce time while providingmore frequent start-up events. All these actions result in much higher levels of thermo-stresses, a lifetime consumption of primary components and an increased demand foraccurate thermostructural and low cycle fatigue (LCF) simulations. In this study, someaspects of methodological improvement are analyzed and proposed in the frame of anintegrated approach for steam turbine components thermostructural analysis, reliability,and lifetime prediction. The full scope of the engineering tasks includes aero/thermody-namic flow path and secondary flows analysis to determine thermal boundary conditions(BCs), detailed thermal/structural two-dimensional and three-dimensional (3D) finite ele-ment (FE) models preparation, components thermal and stress–strain simulation,rotor–casing differential expansion and clearances analysis, and finally, turbine unit life-time estimation. Special attention is paid to some of the key factors influencing the accu-racy of thermal stresses prediction, specifically, the effect of “steam condensation” onthermal BC, the level of detailing for thermal zones definition, thermal contacts, and meshquality in mechanical models. These aspects have been studied and validated against testdata, obtained via a 30 MW steam turbine for combined cycle application based on actualstart-up data measured from the power plant. The casing temperatures and rotor–statordifferential expansion, measured during the commissioning phase of the turbine, wereused for methodology validation. Finally, the evaluation of the steam turbine HPIP rotorlifetime by means of a LCF approach is performed. [DOI: 10.1115/1.4037755]
1 Introduction
Steam turbine accelerated start and operation flexibilitytogether with long-term service life are the most desired and con-flicting requirements for the unit operation. Starting the turbinequickly can save fuel cost but results in premature component fail-ure due to low cycle fatigue (LCF).
The main factor that limits turbine start-up time is thermalstresses. Thermal stresses occur in the turbine rotor and casingcomponents (mostly high pressure (HP) and intermediate pressure(IP) cylinders) resulting in LCF and lifetime reduction. Cyclic lifeevaluation is based on the thermostresses analysis and requires ahigh level of finite element (FE) model detailing in order to pre-dict stress concentration in the fillets, grooves, etc. The details onthermal stresses initiation due to transient operation can be foundin Ref. [1]. Another limiting factor is the differential rotor–casingexpansion, which may lead to critical clearances reduction anddamage.
For steam turbine components, the thermal state is stronglyinfluenced by the condensation process, which takes place primar-ily during the initial phase of cold start-up (CS) and continuesuntil the rotor surface temperature becomes higher than the steamsaturation temperature. Effect of “condensation” on thermalstresses depends on rotor and casing initial temperatures andsteam conditions. When starting up from ambient metal tempera-ture (pure CS), the condensation provides increased speed of com-ponents temperature growth and consequently highest stresses.
This effect becomes weaker with the metal initial temperature get-ting closer to steam saturation temperature.
Convection condition accuracy and, especially, the effect ofsteam condensation during CS, are the key factors to realisticallypredict turbine unit thermal state during transients.
The fundamentals of heat and mass transfer processes and basicprinciples of heat transfer coefficient (HTC) simulation are con-sidered in the monographs [2,3].
The pioneer work about film condensation for pure vapor ispublished by Nusselt [4]. He considered smooth and uniform liq-uid film on the wall surface and expressed condensation heattransfer coefficients as a ratio of thermal conductivity and thick-ness of laminar film condensate. A large number of correlationsfor predicting heat transfer coefficients during film condensationinside pipes have been proposed over the last 80 yr described inRefs. [5–7] and many other publications, where Nusselt correla-tions were improved and experimentally validated. The simpledimensionless correlation which has been verified by comparisonwith a wide variety of experimental data is developed in Ref. [5].Experimental analysis of steam condensation in the vertical tubeand HTC comparison against theoretically calculated results isperformed in Ref. [6]. Some recommendations based on a sum-mary of calculated and experimental data are presented in Ref.[7]. Based on the results presented in these articles, the condensa-tion HTCs are significantly higher than that of dry conditions andcould reach up to 12,000 W/(m2 K).
Despite the fact that for steam turbine components condensa-tion effect imposes most of the uncertainty that exists for thermo-structural analysis, there is very limited published information oncondensation HTC simulation methodology and experimentalresults. Some theoretical approaches to account for the effect ofcondensation on HTC in different parts of steam turbine
1Corresponding author.Contributed by the Turbomachinery Committee of ASME for publication in the
JOURNAL OF ENGINEERING FOR GAS TURBINES AND POWER. Manuscript received July 17,2017; final manuscript received July 18, 2017; published online October 3, 2017.Editor: David Wisler.
Journal of Engineering for Gas Turbines and Power FEBRUARY 2018, Vol. 140 / 022604-1Copyright VC 2018 by ASME
Downloaded From: http://gasturbinespower.asmedigitalcollection.asme.org/ on 10/16/2017 Terms of Use: http://www.asme.org/about-asme/terms-of-use
components and validation against test data can be found inmonographs [8] and [9].
Basic principles and methodology for steam turbine service lifeprediction based on its thermal state were developed in Ref. [10].In Ref. [11], a list of studies performed until the year 2015 forsteam turbine components thermomechanical analyses methodol-ogy with finite element analysis (FEA) approach and a briefreview is given. Valuable results also with regard to experimentalvalidation published in Ref. [12], where conjugate heat transfernumerical models are compared against experimental data of alarge intermediate pressure steam turbine module. Cold start-upanalysis for IP steam turbine rotor is performed in Ref. [13], andprobabilistic sensitivity study was done in order to identify theinfluence of boundary conditions (BCs) uncertainty on the calcu-lated lifetime consumption for the rotor.
Based on the published works, it can be concluded that thermo-structural methodology for steam turbine components is welldeveloped. But not enough information is given with regard tosome specific details on condensation thermal boundary condi-tions, like, for example, start/finish time of condensation for eachthermal zone, the impact of condensation on thermal stresses andcyclic life. Most of the known recommendations on condensationeffect focused on HTC adjustment with a proper correction func-tion, based on experimental validation.
In this paper, the authors made attempt to improve the accuracyof steam turbine thermostructural analysis by condensation effectconsideration with a new proposed differential algorithm to deter-mine condensation start/finish time for each specific thermal zone.Another aspect of accuracy improvement is an integratedapproach when all steps of thermostructural analysis are com-pleted within turbomachinery design platform. This integratedapproach consists of the following major steps:
(1) direct calculation of steam parameters in turbine flow pathat each time-step during start-up cycle with 1D aerothermo-dynamic solver along with rotor gland seal scheme lea-kages balance. This approach allows capturing with highaccuracy steam parameters variation in the turbine flowpath and seal zones and determining “dry” and “saturation”steam properties, the effect of “Windage” at low flow con-ditions. Flow parameters and steam properties are used forthermal BC (HTC and temperatures) calculation at prelimi-nary assigned thermal zones.
(2) transient thermal analysis for casing and rotor componentsbased on thermal BC, which are automatically transferredfrom aerosolver module to FEA model. An improved inter-active algorithm is applied at this step to the thermal analy-sis to distinguish “noncondensation” and condensationconditions and to account for the condensation effect.
(3) thermostructural analysis for start-up cycle.(4) differential expansions analysis.(5) stresses and lifetime evaluation.
The proposed algorithm was applied to a 30 MW steam turbineduring turbine redesign to predict components stresses and clear-ances behavior at transient operations and also used to developoptimized start-up cycle. The measured data on casing tempera-tures and rotor–stator differential expansion were used to validatethe calculation methodology.
This article represents a continuation of work on this turbineanalysis, with the first part published in Ref. [11], where the ther-mostructural analysis methodology was applied to a rotor only. Inthis part, the whole steam turbine unit is considered which is man-datory to predict rotor–casing differential expansions.
2 Background
The project involved the conversion of three steam turbinesfrom simple steam oil-fired to natural gas-fired combined cycle.The project was led by Sulzer Turbo Services Houston, Inc. (LaPorte, TX), which was responsible for steam turbine redesign and
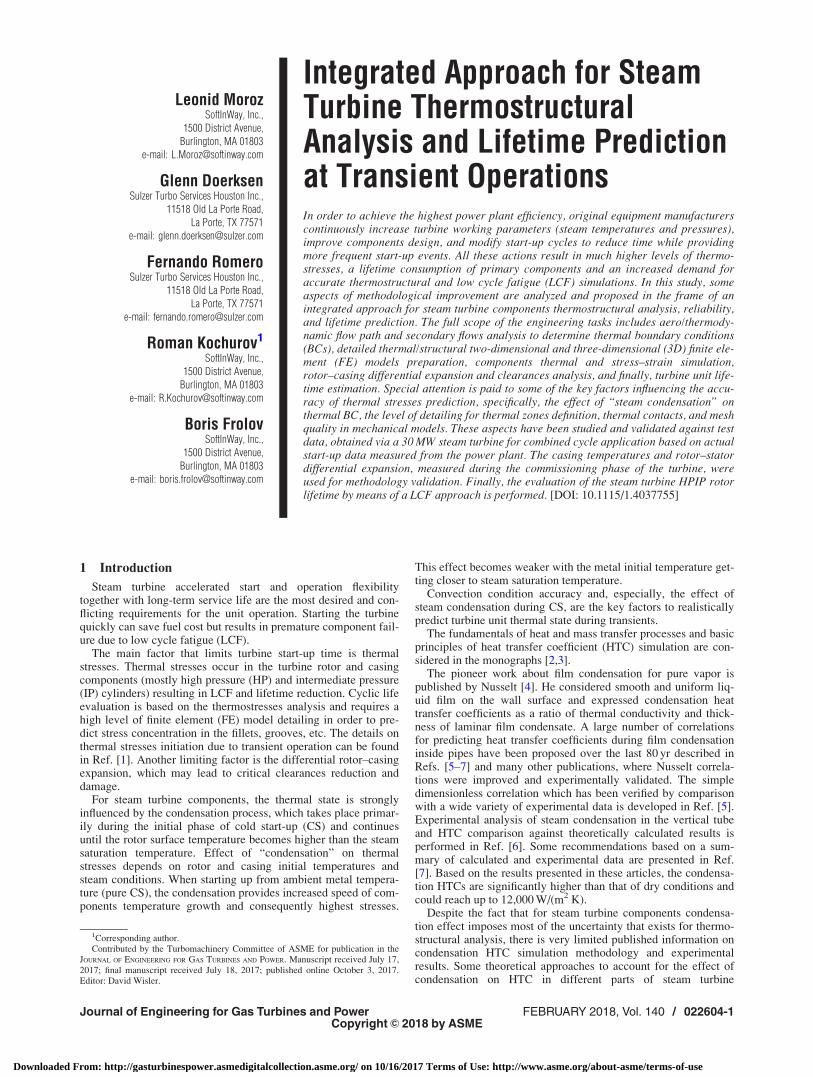
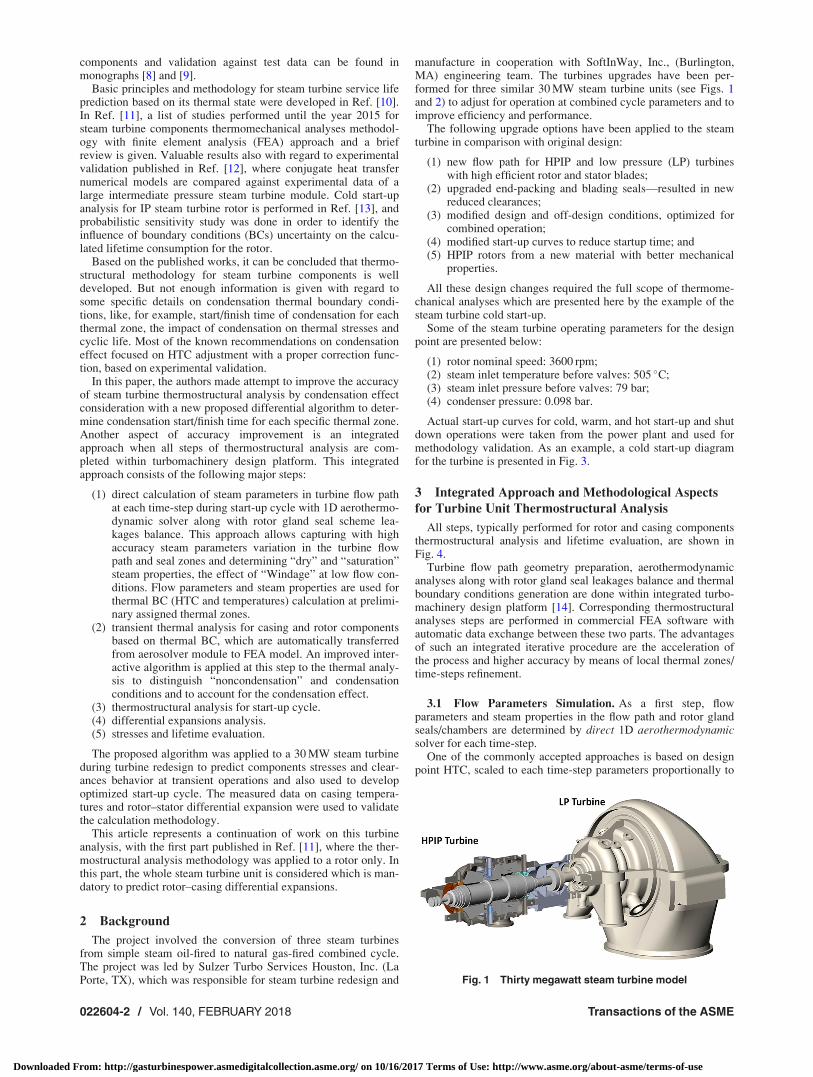
manufacture in cooperation with SoftInWay, Inc., (Burlington,MA) engineering team. The turbines upgrades have been per-formed for three similar 30 MW steam turbine units (see Figs. 1and 2) to adjust for operation at combined cycle parameters and toimprove efficiency and performance.
The following upgrade options have been applied to the steamturbine in comparison with original design:
(1) new flow path for HPIP and low pressure (LP) turbineswith high efficient rotor and stator blades;
(2) upgraded end-packing and blading seals—resulted in newreduced clearances;
(3) modified design and off-design conditions, optimized forcombined operation;
(4) modified start-up curves to reduce startup time; and(5) HPIP rotors from a new material with better mechanical
properties.
All these design changes required the full scope of thermome-chanical analyses which are presented here by the example of thesteam turbine cold start-up.
Some of the steam turbine operating parameters for the designpoint are presented below:
(1) rotor nominal speed: 3600 rpm;(2) steam inlet temperature before valves: 505 �C;(3) steam inlet pressure before valves: 79 bar;(4) condenser pressure: 0.098 bar.
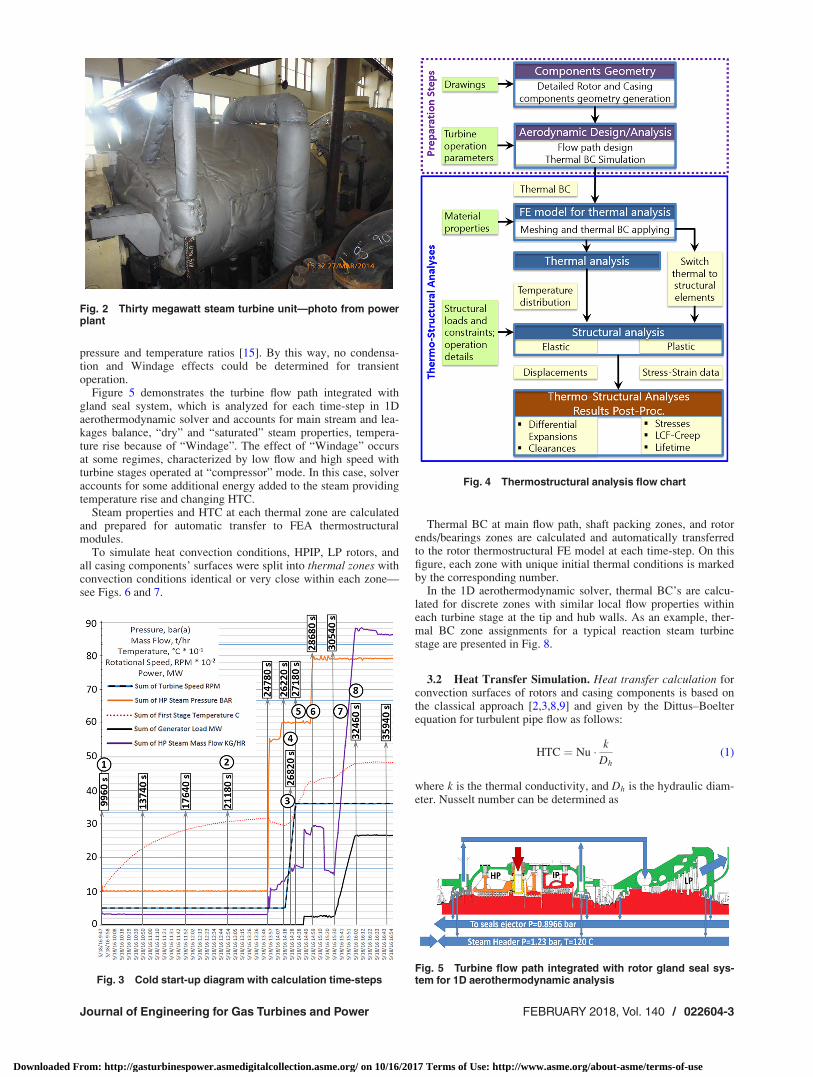
Actual start-up curves for cold, warm, and hot start-up and shutdown operations were taken from the power plant and used formethodology validation. As an example, a cold start-up diagramfor the turbine is presented in Fig. 3.
3 Integrated Approach and Methodological Aspects
for Turbine Unit Thermostructural Analysis
All steps, typically performed for rotor and casing componentsthermostructural analysis and lifetime evaluation, are shown inFig. 4.
Turbine flow path geometry preparation, aerothermodynamicanalyses along with rotor gland seal leakages balance and thermalboundary conditions generation are done within integrated turbo-machinery design platform [14]. Corresponding thermostructuralanalyses steps are performed in commercial FEA software withautomatic data exchange between these two parts. The advantagesof such an integrated iterative procedure are the acceleration ofthe process and higher accuracy by means of local thermal zones/time-steps refinement.
3.1 Flow Parameters Simulation. As a first step, flowparameters and steam properties in the flow path and rotor glandseals/chambers are determined by direct 1D aerothermodynamicsolver for each time-step.
One of the commonly accepted approaches is based on designpoint HTC, scaled to each time-step parameters proportionally to
Fig. 1 Thirty megawatt steam turbine model
022604-2 / Vol. 140, FEBRUARY 2018 Transactions of the ASME
Downloaded From: http://gasturbinespower.asmedigitalcollection.asme.org/ on 10/16/2017 Terms of Use: http://www.asme.org/about-asme/terms-of-use
pressure and temperature ratios [15]. By this way, no condensa-tion and Windage effects could be determined for transientoperation.
Figure 5 demonstrates the turbine flow path integrated withgland seal system, which is analyzed for each time-step in 1Daerothermodynamic solver and accounts for main stream and lea-kages balance, “dry” and “saturated” steam properties, tempera-ture rise because of “Windage”. The effect of “Windage” occursat some regimes, characterized by low flow and high speed withturbine stages operated at “compressor” mode. In this case, solveraccounts for some additional energy added to the steam providingtemperature rise and changing HTC.
Steam properties and HTC at each thermal zone are calculatedand prepared for automatic transfer to FEA thermostructuralmodules.
To simulate heat convection conditions, HPIP, LP rotors, andall casing components’ surfaces were split into thermal zones withconvection conditions identical or very close within each zone—see Figs. 6 and 7.
Thermal BC at main flow path, shaft packing zones, and rotorends/bearings zones are calculated and automatically transferredto the rotor thermostructural FE model at each time-step. On thisfigure, each zone with unique initial thermal conditions is markedby the corresponding number.
In the 1D aerothermodynamic solver, thermal BC’s are calcu-lated for discrete zones with similar local flow properties withineach turbine stage at the tip and hub walls. As an example, ther-mal BC zone assignments for a typical reaction steam turbinestage are presented in Fig. 8.
3.2 Heat Transfer Simulation. Heat transfer calculation forconvection surfaces of rotors and casing components is based onthe classical approach [2,3,8,9] and given by the Dittus–Boelterequation for turbulent pipe flow as follows:
HTC ¼ Nu � k
Dh(1)
where k is the thermal conductivity, and Dh is the hydraulic diam-eter. Nusselt number can be determined as
Fig. 2 Thirty megawatt steam turbine unit—photo from powerplant
Fig. 3 Cold start-up diagram with calculation time-steps
Fig. 4 Thermostructural analysis flow chart
Fig. 5 Turbine flow path integrated with rotor gland seal sys-tem for 1D aerothermodynamic analysis
Journal of Engineering for Gas Turbines and Power FEBRUARY 2018, Vol. 140 / 022604-3
Downloaded From: http://gasturbinespower.asmedigitalcollection.asme.org/ on 10/16/2017 Terms of Use: http://www.asme.org/about-asme/terms-of-use
Nu ¼ K � Re0:8 � Pr0:333 (2)
where K is the coefficient, determined by convective heatexchange conditions. Reynolds number is calculated using follow-ing formulas:
where Vtot is the velocity of steam relative to rotor surface, XK isthe coefficient, which considers influence of velocity profile in thegap between rotating and nonrotating surfaces, x is the rotationalspeed, r is the cylindrical surface radius, G is the steam mass flowrate, q is the steam density, rext is the external surface radius, rin isthe internal surface radius, l is the steam viscosity, and V is thespecific volume.
Convection conditions, which are calculated for stage zonespresented in Fig. 8, were averaged for tip and hub walls accordingto discretization in Figs. 6 and 7. This high level of zone discreti-zation provides sufficiently accurate results.
3.3 Algorithm for Thermal BC Setup. To account for theeffect of condensation, two types of thermal conditions are
considered—noncondensation and condensation. Noncondensa-tion conditions are determined by “dry” steam properties and theabove-mentioned Eqs. (1)–(4) for HTCs. For condensation BCs, adifferent approach for HTCs simulation is used [7,8], and steamsaturation temperature is considered. The interactive algorithm inFig. 9 was applied as a part of the steam turbine componentsstructural analysis to predict condensation phenomenon.
The approach in Fig. 9 is based on rotor metal temperaturemonitoring during the transient process and allows us to distin-guish the condensation phenomenon with a high level of accuracywith setting condensation versus noncondensation thermal bound-ary conditions for each local zone at each time-step.
The initial temperature conditions for turbine componentsdepends on previous turbine operation history—it could be cold,warm, or hot [16] and is used to start the calculation process. Theinitial thermal state could be a strong contributor to the thermo-stress development and requires an accurate definition. In mostcases, the initial thermal distribution in turbine components is notuniform, especially if warm or hot start-ups are considered. To re-create the initial temperature distribution, the thermostructuralanalysis of turbine cooling from the previous steady-state condi-tions is required. Another way is based on measured data byinstalled thermocouples and probes from power plant—initialmetal temperature is determined based on casing temperaturesand expansion and rotor–stator differential expansions.
Another critical aspect of the proposed process is to comparemetal temperature at each local thermal zone against steam
Fig. 6 HPIP turbine heat convection zones discretization and flow direction
022604-4 / Vol. 140, FEBRUARY 2018 Transactions of the ASME
Downloaded From: http://gasturbinespower.asmedigitalcollection.asme.org/ on 10/16/2017 Terms of Use: http://www.asme.org/about-asme/terms-of-use
saturation temperature. If local saturation temperature for anyzone is higher than that of local rotor metal temperature, weassume that a condensation process occurs. In this case, condensa-tion HTC and steam saturation temperature are applied to thiszone.
3.4 FE Mechanical Model. Three-dimensional (3D) FEmodels based on tetrahedral ten-node and hexahedral 20-nodethermal and structural elements have been developed for the cas-ing components. Due to structure symmetry, only half parts ofHPIP and LP cylinders were modeled and symmetry conditionswere applied—see Fig. 10.
For the turbine HPIP and LP rotors axisymmetric two-dimen-sional models based on eight-node quadrilateral plane elements(with axisymmetric option) have been developed for transientthermal and structural FE analyses—see Fig. 11, where meshdetails for HPIP rotor are presented.
Mesh refinements were done in the regions of potential stressconcentration—rotor disk and casing filets, dovetail grooves, etc.HPIP rotor regions with anticipated maximal thermal gradientsand stresses (critical zones with regards to LCF crack initiation)are indicated by numbers 1–7 in Fig. 11 and will be used for thefurther detailed study presented in this article.
In the mechanical models, special focus was paid to adequatethermal contacts modeling between blades and rotor and between
Fig. 7 LP turbine heat convection zones discretization and flow direction
Fig. 8 Flow path stage heat convection zones schematization
Journal of Engineering for Gas Turbines and Power FEBRUARY 2018, Vol. 140 / 022604-5
Downloaded From: http://gasturbinespower.asmedigitalcollection.asme.org/ on 10/16/2017 Terms of Use: http://www.asme.org/about-asme/terms-of-use
inner and outer casings—see Fig. 12. Convection conditions wereapplied to blades’ platforms as shown in Fig. 12, and thermalresistance at blade root to rotor contacts significantly reduce heatflux to the rotor. Two variants of rotor thermal analysis werecompleted—with and without thermal contacts, which demon-strated the noticeable difference in rotor–stator differential expan-sion behavior. Validated against measured expansion data, FEmodels with thermal contacts demonstrated much better agree-ment and were used for the final analysis.
An automatic process for convection conditions export fromaero/thermodynamic analysis module and applying onto FE meshwas developed and used to accelerate analysis process and elimi-nate possible errors at this step.
3.5 Thermal Analysis. Thermal analysis for the steam tur-bine components is performed based on the algorithm in Fig. 9and convection conditions, calculated following the proceduredescribed above. For transient thermal analysis, cold, warm, andhot start-up and shut down operations were considered. The onlycold start-up results presented in this article, which is based on theactual start-up diagram presented in Fig. 3.
For the current start-up cycle, the initial casing and rotor metaltemperatures were re-created by stead-state and shut down simula-tion with following natural cooling analysis to satisfy both ini-tially measured data:
For casings—measurements of initial casing temperatures andexpansions.For rotor—initial rotor–casing differential expansionmeasurements.
3.6 Structural Analysis and Lifetime Assessment. Struc-tural analysis is performed for two main purposes:
(1) to evaluate rotor to casing differential expansion; and(2) to calculate thermostress–strain state and lifetime for criti-
cal turbine components.
Structural boundary conditions and rotor centrifugal loads wereconsidered in the analysis. The transient temperature distribution,calculated earlier, is applied to the structural FEA model as thethermal load at appropriate time-steps.
At the first step, the structural analysis is done in a linear (elas-tic) formulation based on the calculated turbine thermal state
Fig. 9 Algorithm for thermal condensation/noncondensationBC setup for transient analysis
Fig. 10 Three-dimensional FE mechanical models: (a) and (b) HPIP; (c) LP cylinders
Fig. 11 FE model for HPIP turbine rotor
022604-6 / Vol. 140, FEBRUARY 2018 Transactions of the ASME
Downloaded From: http://gasturbinespower.asmedigitalcollection.asme.org/ on 10/16/2017 Terms of Use: http://www.asme.org/about-asme/terms-of-use
during a transient start-up process. The elastic analysis gives suffi-cient accuracy for differential expansion problem and helps todetermine the level of stresses and critical time periods. Thisinformation from the elastic pass is used to tune-up the algorithmfor further nonlinear plastic analysis [11] which results are usedfor thermostresses and LCF lifetime analysis.
The effect of plasticity was modeled for HPIP rotor followingsuch input data and assumptions:
(1) Actual rotor material stress–strain curves at room and ele-vated temperature conditions are used.
(2) The rotor material is cyclically hardened. A multilinearkinematic hardening plasticity model is applied.
(3) The nonlinear analysis model includes the Bauschingereffect and geometrical nonlinearity.
(4) Two full cycles of rotor transient plastic stress analyseswere performed in series: start-up—running—shut down—to reach stabilized stress–strain hysteresis loops for eachregion of interest.
One of the rotor life limiting factors is thermomechanicalfatigue due to varying stresses during transient operation. Anothercontributor to limiting rotor lifetime in the high-temperatureapplications is a creep. The current article is focused on the effectof LCF estimation only and creep effect is not considered in thepresent study.
Low cycle fatigue analysis is performed based on calculatedthermomechanical stress–strain state prediction in a nonlinearplastic statement and experimental strain-life (E–N) curves forcomponents’ material. The theoretical aspects and details for LCFanalysis can be found in Ref. [1], and the procedure was describedin Ref. [11].
4 Thermal and Differential Expansions Simulation
Results and Validation Against Test Data
Calculated casings parts and rotors temperature distributionsduring CS and steady-state operation are presented in Fig. 13 forHPIP and LP cylinders. It can be observed that the rise of the tur-bine metal temperature takes place at all times, starting from theinitial moment up to steady-state operation. At the initial phase ofthe turbine, heating steam goes to the gland seals from the steamheader with a temperature of 120 �C. The initial metal temperatureis lower than that of the heating steam and during some period oftime condensation process takes place in the gland seal regionswhich are heated by steam saturation temperature, which is lowerthan the dry steam temperature. That is why at this start-up periodthe temperature of turbine components grows very slowly.
Validation of the thermal analysis algorithm was done througha comparison with HPIP casing measured data during the turbine
Fig. 13 Turbine components temperatures at CS and steady-state operation
Journal of Engineering for Gas Turbines and Power FEBRUARY 2018, Vol. 140 / 022604-7
Downloaded From: http://gasturbinespower.asmedigitalcollection.asme.org/ on 10/16/2017 Terms of Use: http://www.asme.org/about-asme/terms-of-use
commissioning phase. Thermocouples were installed on the cas-ings as it shown in Fig. 14. The comparison of measured tempera-tures and calculated data for HPIP casing (thermocouple HP topfrom Fig. 14) is presented in Fig. 15, where the solid line repre-sents measured data and dashed line corresponds to calculatedresults for HP casing. The comparison shows good agreementbetween calculated and measured data for all thermocouplesinstalled on HP and IP casing components (calculation resultserror is less than 5%).
To investigate the effect of condensation on turbine thermalstate and expansion, the alternative simulation was performedwithout interactive algorithm (from Fig. 9) involved. During thewhole start-up cycle, no condensation process was assumed, andconvection conditions corresponding to noncondensation HTCand dry steam temperatures were applied. The results of this simu-lation are presented as a dotted line in Fig. 15. Comparison withexperimental results shows HPIP casing overheating at the initialphase of start-up, and the difference between measured data andthe simulation results reaches up to 20%.
The validation for the casing components thermostructural stateis done also against casings thermal expansions. Turbine unitexpansion scheme is presented in Fig. 14. Rotor to casing
differential expansions were measured at locations “A” for HPIPcylinder and “B” for LP cylinder; HPIPþLP absolute casingsexpansions were measured at location “C”—see Fig. 14. Compari-son of calculated and measured data for the turbine unit at loca-tions C, B, and A is presented in Figs. 16–18.
Calculated absolute and differential expansions according topresented methodology and algorithm (in Fig. 9) are very close toexperimentally measured data (less than 1% error). Simulationresults without condensation accounting are presented in Fig. 16by a dotted line. It can be observed that some error take place atthe initial phase of start-up.
Another aspect, which was studied, is the effect of blades torotor thermal contact simulation. The effect of blade roots-to-rotorthermal contact modeling is illustrated in Fig. 18, where compari-son of simulation results with measured data is presented. Thedashed line of Fig. 18 corresponds to blade roots-to-rotor thermalcontact model (see Fig. 12), and dotted line corresponds to a sim-plified model with no thermal contacts. At the initial phase ofheating, results well agree with measured data. But at the time ofturbine loading, when steam flow rate increase, the simplifiedmodel demonstrates rotor overheating.
Fig. 14 Turbine unit expansion scheme
Fig. 15 HP turbine outer casing temperatures Fig. 16 Turbine unit casings expansion (probe C)
022604-8 / Vol. 140, FEBRUARY 2018 Transactions of the ASME
Downloaded From: http://gasturbinespower.asmedigitalcollection.asme.org/ on 10/16/2017 Terms of Use: http://www.asme.org/about-asme/terms-of-use
5 Thermostructural Analysis Results and Discussion
5.1 Thermostresses Analysis Results. The thermal gradientscause thermal stresses which can be observed during transient andsteady-state operation and contribute a significant portion ofstresses into the entire stress–strain state.
Equivalent stress (plastic study) versus time for the HPIP rotorcritical regions #1–#7 (from Fig. 11) are shown in Fig. 19, and thecorresponding temperatures are presented in Fig. 20.
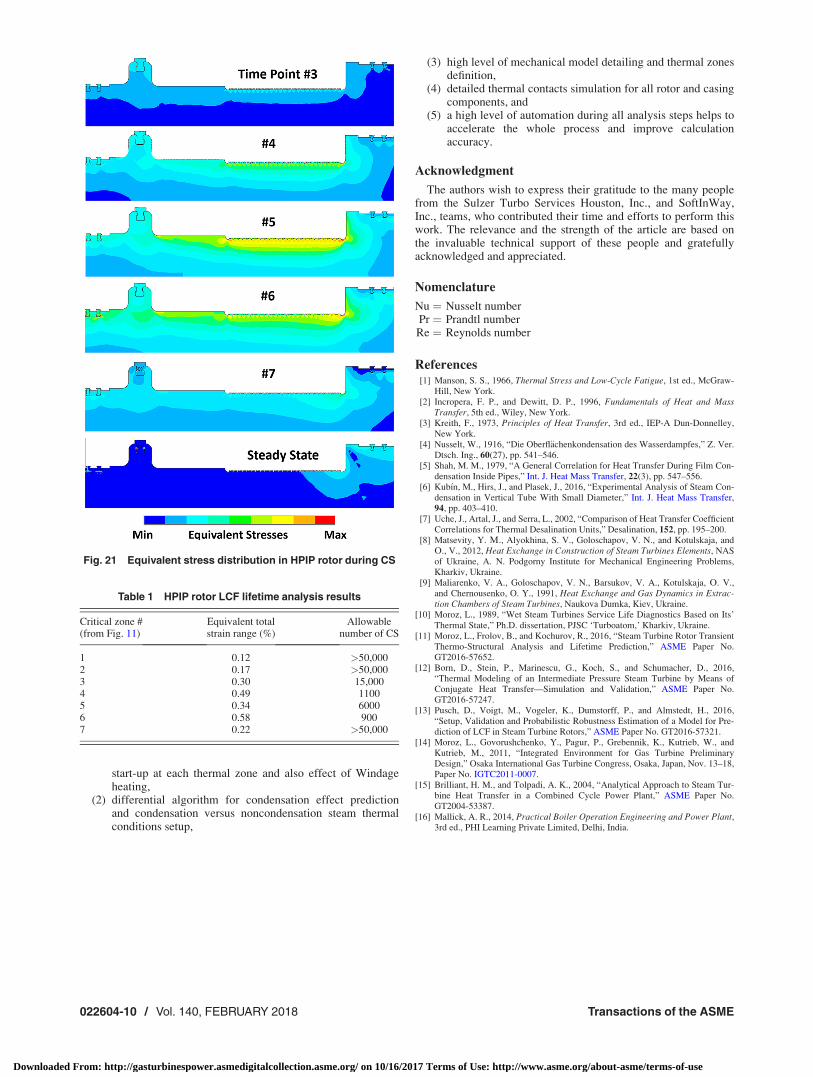
Equivalent stresses (plastic study) distribution during cold start-up and steady-state operation is presented in Fig. 21.
For the considered case, initial casing and rotor metal tempera-tures close to the steam saturation temperature, which resulted inslow heating at the early phase of start-up. That is why for the cur-rent case at the early phase despite condensation process, we didnot observe high thermal gradients and stresses, as it was found inother startup cycle simulation, presented in Ref. [11], where tur-bine components had an ambient initial temperature.
The highest level of thermal gradients and stresses for the cur-rent case is observed at the moment of acceleration (time point#5) and ramp-up (time point #6) phases with noncondensationsteam conditions (see Figs. 3 and 21).
The peak stresses appear on the disk filets in the region of thesteam inlet (points #1 and #2 from Fig. 11), on HP–IP interstageseal (points #3, #4, and #5), and first stage HP blade grooves (cor-responding points #6 and #7). Maximum stresses correspond tothe points #4 and #6.
5.2 LCF Lifetime Estimation. To estimate unit lifetime, aneffective strain range [1], is calculated for the turbine componentscritical zones. Detailed results for HPIP rotor, as the componentwhich determines unit LCF life, are presented in this paper. TheHPIP rotor experimental strain-life curves and detailed materialproperties which were used for LCF assessment can be found inRef. [11].
Table 1 shows calculated equivalent total strain range for coldstart-up—shut down cycles for each rotor critical point (see Fig.11) and the corresponding allowable number of cold start-ups.The simulation was performed according to methodology pre-sented in Ref. [11] and taking into the account LCF safety factors.
The analysis shows that maximal total strain range for CS—shut down cycle corresponds to the points #4, #5 (HP–IP inter-stage seal groves and fillet), and #6 (rotor first stage bladegroove). Thus, from a thermomechanical fatigue point of view,for the HPIP rotor and the turbine unit, the number of cold startsis limited to 900 cycles.
6 Conclusions
An integrated approach for thermostructural analysis at tran-sient operations has been validated against a 30 MW turbine unitfield experimental data. The influence of different analysis aspectswas studied, and the results showed that the following approachrefinements are recommended to improve accuracy:
(1) improved accuracy of convection condition simulation byapplying direct 1D aerothermodynamic solver, whichallows capturing wet versus dry steam properties during
Fig. 18 HPIP rotor to casing differential expansion (probe A)
Fig. 19 Equivalent stresses during CS at critical regions
Fig. 17 HPIP and LP rotors to casings differential expansion(probe B)
Fig. 20 Temperatures during CS at critical regions
Journal of Engineering for Gas Turbines and Power FEBRUARY 2018, Vol. 140 / 022604-9
Downloaded From: http://gasturbinespower.asmedigitalcollection.asme.org/ on 10/16/2017 Terms of Use: http://www.asme.org/about-asme/terms-of-use
start-up at each thermal zone and also effect of Windageheating,
(2) differential algorithm for condensation effect predictionand condensation versus noncondensation steam thermalconditions setup,
(3) high level of mechanical model detailing and thermal zonesdefinition,
(4) detailed thermal contacts simulation for all rotor and casingcomponents, and
(5) a high level of automation during all analysis steps helps toaccelerate the whole process and improve calculationaccuracy.
Acknowledgment
The authors wish to express their gratitude to the many peoplefrom the Sulzer Turbo Services Houston, Inc., and SoftInWay,Inc., teams, who contributed their time and efforts to perform thiswork. The relevance and the strength of the article are based onthe invaluable technical support of these people and gratefullyacknowledged and appreciated.
Nomenclature
Nu ¼ Nusselt numberPr ¼ Prandtl numberRe ¼ Reynolds number
References[1] Manson, S. S., 1966, Thermal Stress and Low-Cycle Fatigue, 1st ed., McGraw-
Hill, New York.[2] Incropera, F. P., and Dewitt, D. P., 1996, Fundamentals of Heat and Mass
Transfer, 5th ed., Wiley, New York.[3] Kreith, F., 1973, Principles of Heat Transfer, 3rd ed., IEP-A Dun-Donnelley,
New York.[4] Nusselt, W., 1916, “Die Oberfl€achenkondensation des Wasserdampfes,” Z. Ver.
Dtsch. Ing., 60(27), pp. 541–546.[5] Shah, M. M., 1979, “A General Correlation for Heat Transfer During Film Con-
densation Inside Pipes,” Int. J. Heat Mass Transfer, 22(3), pp. 547–556.[6] Kub�ın, M., Hirs, J., and Plasek, J., 2016, “Experimental Analysis of Steam Con-
densation in Vertical Tube With Small Diameter,” Int. J. Heat Mass Transfer,94, pp. 403–410.
[7] Uche, J., Artal, J., and Serra, L., 2002, “Comparison of Heat Transfer CoefficientCorrelations for Thermal Desalination Units,” Desalination, 152, pp. 195–200.
[8] Matsevity, Y. �., Alyokhina, S. V., Goloschapov, V. N., and Kotulskaja, and�., V., 2012, Heat Exchange in Construction of Steam Turbines Elements, NASof Ukraine, A. N. Podgorny Institute for Mechanical Engineering Problems,Kharkiv, Ukraine.
[9] Maliarenko, V. A., Goloschapov, V. N., Barsukov, V. A., Kotulskaja, �. V.,and Chernousenko, O. Y., 1991, Heat Exchange and Gas Dynamics in Extrac-tion Chambers of Steam Turbines, Naukova Dumka, Kiev, Ukraine.
[10] Moroz, L., 1989, “Wet Steam Turbines Service Life Diagnostics Based on Its’Thermal State,” Ph.D. dissertation, PJSC ‘Turboatom,’ Kharkiv, Ukraine.
[11] Moroz, L., Frolov, B., and Kochurov, R., 2016, “Steam Turbine Rotor TransientThermo-Structural Analysis and Lifetime Prediction,” ASME Paper No.GT2016-57652.
[12] Born, D., Stein, P., Marinescu, G., Koch, S., and Schumacher, D., 2016,“Thermal Modeling of an Intermediate Pressure Steam Turbine by Means ofConjugate Heat Transfer—Simulation and Validation,” ASME Paper No.GT2016-57247.
[13] Pusch, D., Voigt, M., Vogeler, K., Dumstorff, P., and Almstedt, H., 2016,“Setup, Validation and Probabilistic Robustness Estimation of a Model for Pre-diction of LCF in Steam Turbine Rotors,” ASME Paper No. GT2016-57321.
[14] Moroz, L., Govorushchenko, Y., Pagur, P., Grebennik, K., Kutrieb, W., andKutrieb, M., 2011, “Integrated Environment for Gas Turbine PreliminaryDesign,” Osaka International Gas Turbine Congress, Osaka, Japan, Nov. 13–18,Paper No. IGTC2011-0007.
[15] Brilliant, H. M., and Tolpadi, A. K., 2004, “Analytical Approach to Steam Tur-bine Heat Transfer in a Combined Cycle Power Plant,” ASME Paper No.GT2004-53387.
[16] Mallick, A. R., 2014, Practical Boiler Operation Engineering and Power Plant,3rd ed., PHI Learning Private Limited, Delhi, India.
Fig. 21 Equivalent stress distribution in HPIP rotor during CS