Page 1
Integrated Biogeochemical / Electrochemical
Method for Remediation of Contaminated
Groundwater
Jim Mueller – Provectus, USA
[email protected]
Elie Elgressy, Gil Elgressy - E. Elgressy, Israel
[email protected]
Raphi Mandelbaum - LDD Technologies, Israel
[email protected]
Battelle’s 5Th International Symposium on
Bioremediation & Sustainable Technologies
Baltimore, Maryland April 14-18, 2019
Page 2
Copyright Provectus
Problem Statement
– Overview of Available ISCO Technologies
– Why Do We Need Another?
What is Provect-”EBR®”?
– What is Provect-EBR?
– How does it Work / Mode of Action?
– Remote System Control and Real-Time Monitoring
– Applications to Date
Case Studies
– CHCs: Confidential Site (Tel Aviv, Israel)
– MTBE: Operating Gas Station, Sonol Kiryon Site
– MTBE/BTEX: Operating Gas Station, Neve Tdizek Site
Summary and Conclusions / R&D Needs
Presentation Outline
Page 3
Copyright Provectus
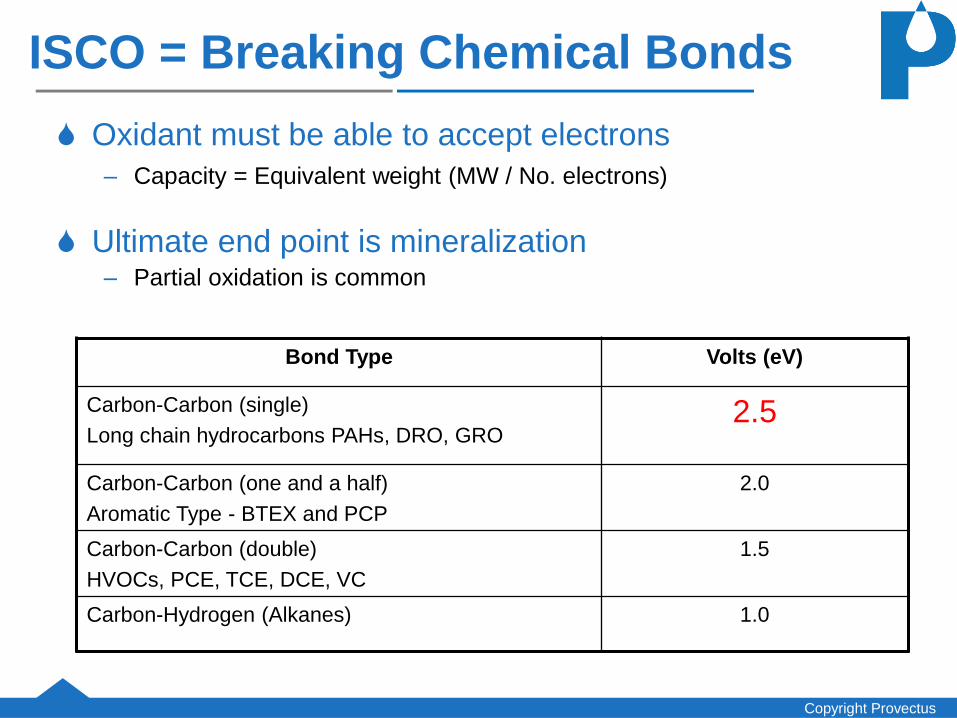
ISCO = Breaking Chemical Bonds
Oxidant must be able to accept electrons
– Capacity = Equivalent weight (MW / No. electrons)
Ultimate end point is mineralization– Partial oxidation is common
Bond Type Volts (eV)
Carbon-Carbon (single)
Long chain hydrocarbons PAHs, DRO, GRO 2.5
Carbon-Carbon (one and a half)
Aromatic Type - BTEX and PCP
2.0
Carbon-Carbon (double)
HVOCs, PCE, TCE, DCE, VC
1.5
Carbon-Hydrogen (Alkanes) 1.0
Page 4
Copyright Provectus
Summary of ISCO Technologies
Oxidation Potentials Volts
Fluorine (F2) 2.87
Hydroxyl radical (OH●) 2.80
Persulfate radical (SO4●) 2.60
Ferrate (Fe+6) 2.20
Ozone (O3) 2.08
Persulfate (S2O8-2) 2.01
Hydrogen peroxide (H2O2) 1.78
Permanganate (MnO4-) 1.68
Chlorine (Cl2) 1.49
https://sites.google.com/site/ecpreparation/ferrate-vi
Fenton’s
• Treats wide range of contaminants
• Short subsurface lifetime
• Difficult to apply in reactive soils
Persulfate
• Treats wide range of contaminants
• Sulfate radical forms slower than the hydroxyl
radical, allowing a larger radius of influence
Ozone
• Treats wide range of contaminants
• Short subsurface lifetime
• Limited use in saturated zone
Permanganate –
•Treats limited range of contaminants
• Partial oxidation of TPHs, etc
• Long subsurface lifetime
• Potential effects on hydrogeology
Provect-OX
• Generates Ferrate (Fe IV, V, VI possible)
• Treats wide range of contaminants
• Extended in situ lifetime w/ continual production
• Avoids Rebound
Reactive Oxidant Species (ROS)
Higher oxidation potential = stronger the oxidizer
str
on
ge
r o
xid
ize
r
Page 5
Copyright Provectus
Why We Need A New ISCO Technology
Longevity: Conventional ISCO amendments and means of generating ROS
are limited by distribution, kinetics, and short environmental half-lives (10E-9 to
10E-6 seconds) = need to be continuously generated / applied.
ISCO PRBs: PRB applications using existing ISCO (candles, KPS, etc) are
limited
Sustained, In Situ Production of ROS could yield effective PRBs
especially for COIs not conducive to ISCR/ZVI such as 1,4-dioxane,
MTBE/TBA, perchlorate, (PFAS?) plumes.
Page 6
Copyright Provectus
Provect-”EBR®” ISCO PRB
In Situ ISCO Generator to continuously produce Fenton’s type ROS yields an
effective PRB technology for:
Challenging lithologies (deep aquifers, clayey soils, fractured rock)
Situations where sorption/sequestration is not considered an effective response
Alternatives to hydraulic containment (long term O&M&M)
> 100 ppm 50 ppm 10 ppm 1 ppm 0.5 ppm 0.1 ppm < 0.05 ppm
source plume
EZVI ISCR
Contaminant Concentration
down gradient
ISCO
OR
ISCR
EBR® ISCO
Page 7
Copyright Provectus
What is Provect-”EBR®”
Electro Bioremediation (EBR)
well(s) contain an air sparge plus 3
electrodes:
H2O2 production
Fe2+ release
O2 production
Computerized control panel for
remote system / adjustment and
real-time performance monitoring
US Patent No. 9,975,156 B2
Page 8
Copyright Provectus
How Does EBR Work?
Production of O2: electrolytic reduction of water on a catalytic electrode
yields molecular oxygen, O2
Production of H2O2: two-electron reduction of oxygen on a cathode
surface generates H2O2
Release of Iron: H2O2 interacts with ferrous iron (Fe2+) released from a
third cell to yield hydroperoxyl (HO2∙)/superoxide (O2∙) and hydroxyl
radicals (OH∙), and likely ferrates
The EBR Well Generates Reactive Oxidant Species (ROS) in a manner
similar to other Electro-Fenton’s (EF) type systems (Nazari et al., 2019;
Rosales, et.al, 2012; Sires et al., 2014; Yuan et al., 2013):
Page 9
Copyright Provectus
How Does EBR Differ From EF?Fe2+/3+ Nanoclusters: At neutral pH EBR uniquely generates “low” Fermi Level
(highly oxidized) FeII/III oxyhydroxide nanoclusters (2 nM) as the sacrificial Fe
source corrodes within the well (Ai et al., 2013; Elgressy 2019).
Subsurface distribution of Fe nanoclusters throughout the aquifer is driven by:
• Induced redox fronts
• Electro-redox
current densities
• Electroosmosis
• Electrophoresis
• Dynamic coupling
between EBR wells
• Equilibration of
differences in
Fermi level energies
self-generated
self-propagated
Page 10
Copyright Provectus
How Does EBR Differ From EF?
Fermi Level is a thermodynamic “value” to define the electrochemical potential of
an electron in a redox couple in solution
At +850mV (“low” Fermi Level
electrochemical potential)
electrons are essentially freely
transferred from Fe3+ to Fe2+
Fe2+/3+ Nanoclusters: A critical and unique feature of the EBR is use of
geophysical mechanisms to enhance subsurface distribution of low Fermi level Fe
nanoclusters and propagate catalysis in situ to continuously generate reactive
oxidants throughout its effective ROI.
Electrochemical Potential of an e- is the difference in potential between the
oxidized and reduced species (Peljo et al., 2017; Scanlon et al., 2015)
Page 11
Copyright Provectus
In Situ Generation of ROS
As Fe (hydro)oxides within the aquifer ROI equilibrate their Fermi level
electrochemical potentials they continuously catalyze in situ generation of new
ROS from dissolved molecular O2 via two kinds of molecular oxygen activation
pathways (Ai et al., 2013):
On the Fe core via rapid
two-electron-reduction
molecular oxygen
activation (may eventually
be blocked by the
formation of iron oxide
coatings), then
Surface bound ferrous
ions catalyze the single-
electron-reduction
molecular oxygen
activation pathway
Page 12
Copyright Provectus
Summary of EBR Reactions
Generation of H2O2
Release of Fe2+
H2O2 interacts Fe2+ to yield ROS HO2∙/O2∙ and OH∙ (ferrate?)
Release of O2 and low Fermi Level Fe2+/Fe3+ nanoclusters
Self-propagation throughout ROI (less confined by lithology)
Continuous in situ production of ROS catalyzed by O2 activation
from equilibration of Fermi levels of Fe
Transition from ISCO to
bioremediation (using oxygen
and iron as electron acceptors)
and RNA using abiotic
transformations.
Process controlled remotely with
real-time monitoring
Page 13
Copyright Provectus
Where has it been Used?
In 2017 , Israel had 27 gas stations undergoing active remediation
EBR technology was employed at 9 (33%) + 2 chlorinated solvent sites
Today, 7 sites are in clean-closure monitoring after 1 year of operation
EBR is ISO-certified and approved by the Israeli Water Authority
No PRB Applications. No USA applications.
Page 14
Copyright Provectus
Case Study - Solvent Site
DTW 19.5 m bgs
Sandy aquifer impacts
PCE max. 257 ug/L
TCE max. 25,146 ug/L
DCE max. 47 ug/L
ca. 8m
26
32
19
Page 15
Copyright Provectus
CVOC Removal (60 days; ppb)
CVOC(ug/L)
Time(Days)
Well 6(10 m up)
Well 6aEBR Well
Well 6b(5 m down)
Well 7(20 m down)
PCE 0 8.7 257 <2 <2
30 2.4 <2 <2 <2
60 <2 5 <2 <2
TCE 0 752 25,146 74 24
30 201 <2 6 14
60 37 15 4 <2
DCE 0 14 47 <1 <1
30 2.6 <1 <1 <1
60 1.6 8 <1 <1
Single EBR Well + Control Panel and remote monitoring < $45K installed
ROI observed 20 m downgradient within 30 to 60 days.
>99% CVOC removal within 30 days
Page 16
Copyright Provectus
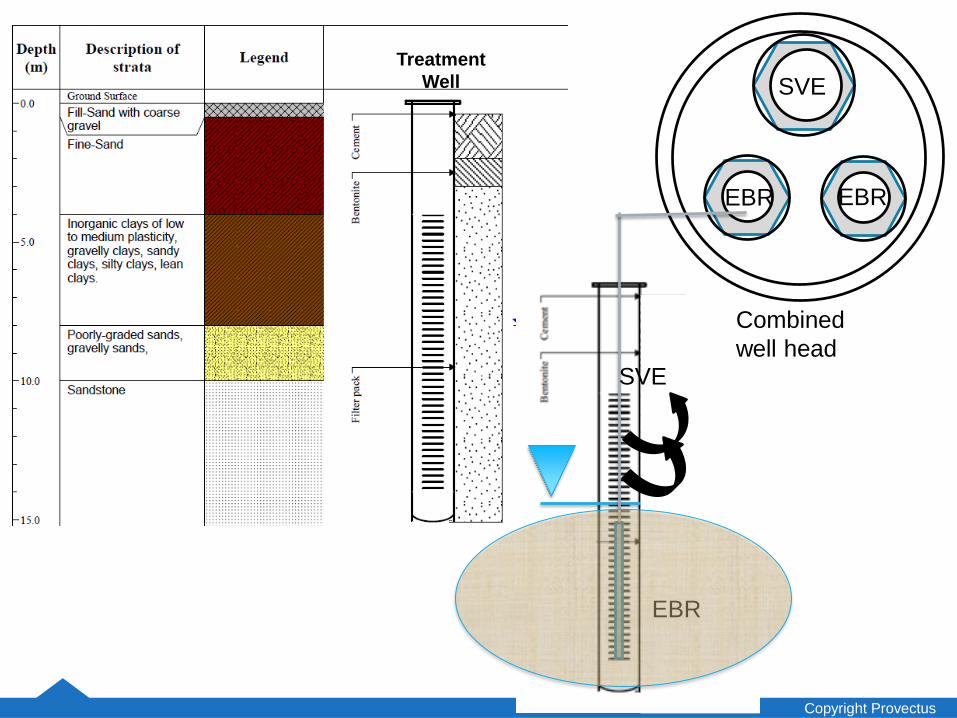
Case Study – Neve Tzedik Site
Operating Gasoline Station
Groundwater at 7 to 8 m bgs
sandy aquifer with si cl lenses
MTBE >50 mg/L; TPH >100 mg/L
242 m2 impacted area
18m
5 EBR/SVE Systems (2017)
Monitoring wells
Page 17
Copyright Provectus
SVE
EBR
SVE
EBREBR
Combined
well head
Treatment
Well
Page 18
Copyright Provectus
MTBE Concentration (mg/L) in Water
0.0
20.0
40.0
60.0
80.0
100.0
120.0
140.0
0.0
10.0
20.0
30.0
40.0
50.0
60.0
We
ll 6
-M
TBE
(mg
/L)
We
llls
5,7
,8,9
-M
RB
E (m
g/L)
Date
Well-5
Well-7
Well-8
Well-6
Well-9
EBR
&SV
E o
per
atio
n
MW-6 ca. 130 ppm to < 5 ppb within 12 months
Page 19
Copyright Provectus
BTEX Concentrations (mg/L) in Water
MW-5 ca. 25 ppm to < 5 ppb within 12 months
Page 20
Copyright Provectus
Dissolved Oxygen (DO)
0.0
2.0
4.0
6.0
8.0
10.0
12.0
DO
(m
g/L)
1 m
BW
L
Date
Well-5
Well-6
Well-7
Well-8
Well-9
EBR
&SV
E o
per
atio
n
Page 21
Copyright Provectus
GW field parameters (ORP)
-600.0
-400.0
-200.0
0.0
200.0
400.0
600.0
800.0
1000.0
OR
P (
1 m
BW
L)
Date
Well-5
Well-6
Well-7
Well-8
Well-9
EBR
&SV
E o
per
atio
n
Page 22
Copyright Provectus
Soil / Groundwater BTEX (18 mo)
Area A
0.0100.0200.0
1.5
4.5
6.0
7.0
TPH (mg/L)
Dep
th
Area A
Area A- AfterTreatment
0.0200.0400.0
1.0-1.5
3.0
4.5-5.0
6.0
7.0
TPH (mg/L)
Dep
th
Area B
Area B- Aftertreatment
0.0200.0400.0
1.0-1.5
2.1-3.0
4.5-5.0
6.0
7-8.4
TPH (mg/L)
Dep
th
Area C
Area C- Aftertreatment
From > 200 ppm to < 2 ppm
Page 23
Copyright Provectus
Soil / Groundwater MTBE (18 mo)
Area
A
020,00040,000
1.5
4.5
MTBE (µg/L)
Dep
th
Area A
Area A- Aftertreatment
050,000100,000
1.0-1.5
3.0
4.5-5.0
6.0
MTBE (µg/L)
De
pth
Area B
Area B-afterTreatment
05,00010,000
1.0-1.5
2.1-3.0
4.5-5.0
6.0
7-8.4
MTBE (µg/L)
Dep
th
Area C
Area C- Aftertreatment
5 EBR Wells, Control Panel, O&M < $150K
From >50 ppm to < 0.05 ppm
Page 24
Copyright Provectus
Operating Gasoline Station
Groundwater at 3 m bgs
sandy aquifer
MTBE >17 mg/L
ca. 300 m2 impacted area
Case Study – Sonol Kiryon Site
Page 25
Copyright Provectus
Case Study – Sonol Kiryon Site
5 EBR (May 2018)
5 Monitoring Wells
4 New Monitoring Wells
LNAPL Present
Page 26
Copyright Provectus
Groundwater MTBE (5 months)
5 months EBR operation (as of December, 2018)
Page 27
Copyright Provectus
Groundwater COIs ug/L (7 months)
Toluene, Ethylbenzene <5 ppb
6 EBR Wells, Control Panel, O&M < $180K
Well Date MTBE Benzene Xylenes TBA CFUs/ml
MW-7 5/2018 11,000 0.21 60 -- --
12/2018 50 <5 <5 7,100 24,000
MW-8 5/2018 5,000 <5 <5 -- --
12/2018 2,800 <5 40 114,000 7,700
MW-9 5/2018 7,000 <5 <5 -- --
12/2018 120 <5 <5 5,600 100,000
Page 28
Copyright Provectus
Learn More About EBR MOA
Page 29
Copyright Provectus
Provectus Environmental Products Complimentary Site Evaluation
Complimentary review of quarterly field performance data with every project
Laboratory Treatability Studies
Turn-Key, Pay-for-Performance Contracting Options
Project Specific Guarantees and Warranties
USA (Florida, Illinois, New Jersey, Ohio, Pennsylvania, Wisconsin)
Australia, Brazil, Canada, China, Colombia, Germany, Israel, Italy, Spain and Taiwan
Office Location
Manufacturing
Laboratory
Page 30
Copyright Provectus
Validate ROI and Effective Propagation Time, Vertically and Horizontally
(ESTCP submittal Mueller, Shi, Ginn, and Tratnyek 2019)
ORP / Measurements (indirect)
COI Reductions (indirect)
Fe2+/Fe3+ measurements: Particle size (BEM) and mineralogy (XRD
patterns, TEM micrographs, XPS spectra and high-resolution scan);
possible using variations of Bradley and Tratnyek (2019).
Self-Potential Method (direct): passive geophysical analysis based on
the natural occurrence of electrical fields resulting from the existence of
source currents in the conductive subsurface (Fachin et al., 2012)
Electrical Resistivity Tomography (direct): measures variations in
electrical conductivity associated with changes in pore water ionic
strength or water phase saturation.
Lab-fabricated oxygen microprobes/sensors (direct): validate the
distribution of ROS.
Simple and Predictive Models: facilitate PRB design and implementation
Future R&D / Continued Studies