9. NATIONAL RESPONSE TO NUTRITION PROBLEMS In 1950 India faced two major nutritional problems. One was the threat of famine and the resultant acute starvation due to low agricultural production and the lack of an appropriate food distribution system. The other was chronic energy deficiency due to: ¾ low dietary intake because of poverty and low purchasing power; ¾ high prevalence of infection because of poor access to safe-drinking water, sanitation and health care; ¾ Poor utilization of available facilities due to low literacy and lack of awareness. The country adopted multi-sectoral, multi-pronged strategy to combat these problems and to improve the nutritional status of the population. Article 47 of the Constitution of India states that, “the State shall regard raising the level of nutrition and standard of living of its people and improvement in public health among its primary duties”. Successive Five-Year Plans laid down the policies and strategies for achieving these goals. Progress achieved in seven five-year plan periods was reviewed in 1991-92. It was obvious that threat of famine has disappeared. There was a significant decline in severe forms of undernutrition. However mild and moderate undernutrition and micronutrient deficiencies were widely prevalent. Text Box 9.1: Initiatives to improve nutritional status of the population between 1950-1990 include: ¾ Increasing food production- building buffer stocks ¾ Improving food distribution- building up the Public Distribution System (PDS) ¾ Improving household food security through • Improving purchasing power • Food for work programme • Direct or indirect food subsidy ¾ Food supplementation to address special needs of the vulnerable groups-Integrated Child Development Services (ICDS), Mid-Day Meals ¾ Nutrition education especially through Food and Nutrition Board (FNB) and ICDS ¾ Efforts of the health sector to tackle • Adverse health consequences of undernutrition • Adverse effects of infection and unwanted fertility on the nutritional status • Micronutrient deficiencies and their health consequence Source: Reference 9 5 India prepared and adopted the National Nutrition Policy in 1993. The Policy advocated a comprehensive inter-sectoral strategy between 14 sectors (which directly or indirectly affect dietary intake and nutritional status of the population) for combating multi-faceted problem of undernutrition and improving nutritional status for all sections of the society. The Policy sought to strike a balance between the short- term direct nutrition interventions and long-term institutional/structural changes to create an enabling environment and necessary conditions for improving nutritional and health status. The Policy also set goals to be achieved by each sector by 2000. A National Plan of Action was drawn up and approved in 1995. In order to achieve inter-sectoral coordination at the highest level, National Nutrition Council was formed under the chairmanship of the Prime 329
Transcript
9. NATIONAL RESPONSE TO NUTRITION PROBLEMS In 1950 India faced two major nutritional problems. One was the threat of famine and the resultant acute starvation due to low agricultural production and the lack of an appropriate food distribution system. The other was chronic energy deficiency due to: low dietary intake because of poverty and low purchasing power; high prevalence of infection because of poor access to safe-drinking water,
sanitation and health care; Poor utilization of available facilities due to low literacy and lack of awareness.
The country adopted multi-sectoral, multi-pronged strategy to combat these problems and to improve the nutritional status of the population. Article 47 of the Constitution of India states that, “the State shall regard raising the level of nutrition and standard of living of its people and improvement in public health among its primary duties”. Successive Five-Year Plans laid down the policies and strategies for achieving these goals. Progress achieved in seven five-year plan periods was reviewed in 1991-92. It was obvious that threat of famine has disappeared. There was a significant decline in severe forms of undernutrition. However mild and moderate undernutrition and micronutrient deficiencies were widely prevalent.
Text Box 9.1: Initiatives to improve nutritionalstatus of the population between 1950-1990include: Increasing food production- building buffer stocks Improving food distribution- building up the Public
Distribution System (PDS) Improving household food security through
• Improving purchasing power • Food for work programme • Direct or indirect food subsidy
Food supplementation to address special needs ofthe vulnerable groups-Integrated ChildDevelopment Services (ICDS), Mid-Day Meals
Nutrition education especially through Food andNutrition Board (FNB) and ICDS
Efforts of the health sector to tackle • Adverse health consequences of
undernutrition • Adverse effects of infection and unwanted
fertility on the nutritional status • Micronutrient deficiencies and their health
consequence Source: Reference 9 5
India prepared and adopted the National Nutrition Policy in 1993. The Policy advocated a comprehensive inter-sectoral strategy between 14 sectors (which directly or indirectly affect dietary intake and nutritional status of the population) for combating multi-faceted problem of undernutrition and improving nutritional status for all sections of the society. The Policy sought to strike a balance between the short-term direct nutrition interventions and long-term institutional/structural changes to create an enabling environment and necessary conditions for improving nutritional and health status. The Policy also set goals to be achieved by each sector by 2000. A National Plan of Action was drawn up and approved in 1995. In order to achieve inter-sectoral coordination at the highest level, National Nutrition Council was formed under the chairmanship of the Prime
329
Minister with Planning Commission as the secretariat for the Council. The Council was to act as the national forum for policy and strategy formulation, review of performance and mid course corrections. A similar set up was envisaged at the state level. Inter-departmental coordination committee under the Department of Women and Child Development was to coordinate and review the implementation of the nutrition programmes. Review of the situation in 2000-01 prior to the formulation of the Tenth Five Year Plan showed that while under-nutrition and micronutrient deficiencies continued to be major public health problems, over nutrition and obesity are also emerging as a major problem in many states. Taking cognizance of this Tenth Plan envisaged a paradigm shift from: household food security and freedom from hunger to nutrition security for the family
and the individual; untargeted food supplementation to screening of all the persons from vulnerable
groups, identification of those with various grades of under-nutrition and appropriate management; lack of focused interventions on the prevention of over-nutrition to the promotion of
appropriate lifestyles and dietary intakes for the prevention and management of over-nutrition and obesity.
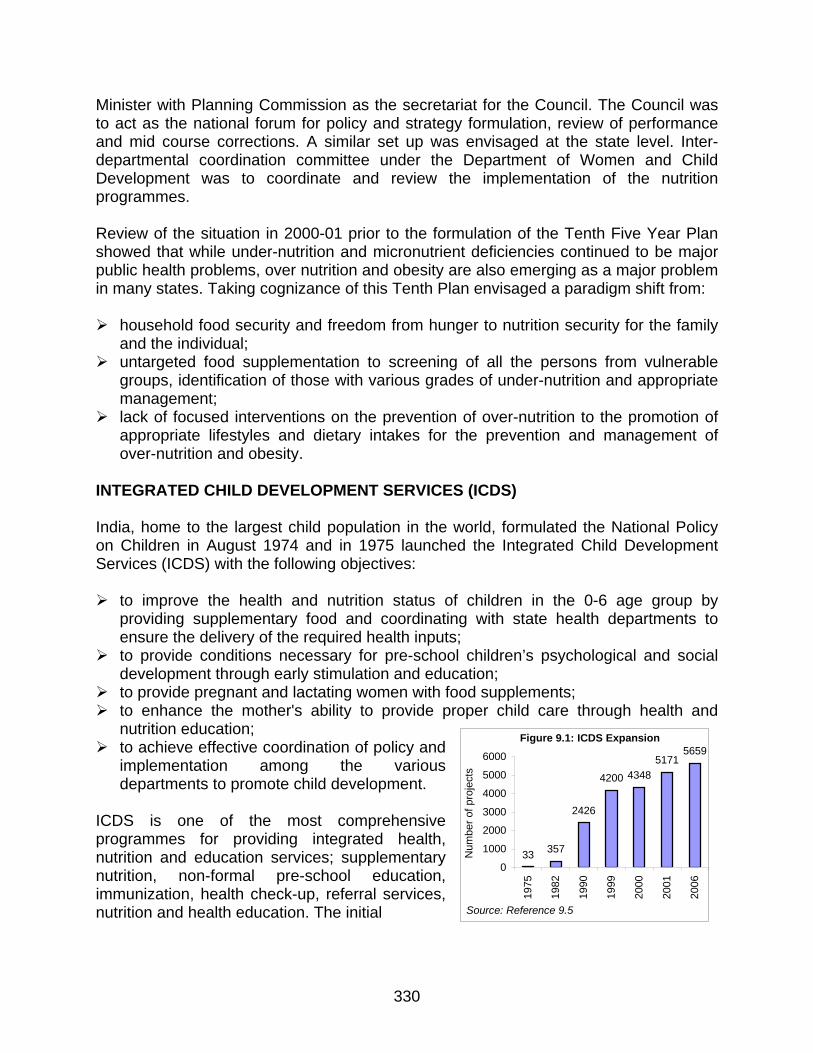
INTEGRATED CHILD DEVELOPMENT SERVICES (ICDS) India, home to the largest child population in the world, formulated the National Policy on Children in August 1974 and in 1975 launched the Integrated Child Development Services (ICDS) with the following objectives: to improve the health and nutrition status of children in the 0-6 age group by
providing supplementary food and coordinating with state health departments to ensure the delivery of the required health inputs; to provide conditions necessary for pre-school children’s psychological and social
development through early stimulation and education; to provide pregnant and lactating women with food supplements;
Figure 9.1: ICDS Expansion
33 357
2426
4200 43485171
5659
0
1000
2000
3000
4000
5000
6000
1975
1982
1990
1999
2000
2001
2006
330
Num
ber o
f pro
ject
s
to enhance the mother's ability to provide proper child care through health and nutrition education; to achieve effective coordination of policy and
implementation among the various departments to promote child development.
Source: Reference 9.5
ICDS is one of the most comprehensive programmes for providing integrated health, nutrition and education services; supplementary nutrition, non-formal pre-school education, immunization, health check-up, referral services, nutrition and health education. The initial
Table 9.1: Services provided and the target groups of the ICDS programme Services Target Group Services Provided By
Supplementary Nutrition Children < 6 yrsPregnant and lactating mothers AWW & AWH
Immunization* Children < 6 yrsPregnant and lactating mothers ANM / MO
Health Check-ups* Children < 6 yrsPregnant and lactating mothers ANM / MO / AWW
Referral Children < 6 yrs
Pregnant and lactating mothers AWW / ANM / MO
Pre-School Education Children 3-6 years AWWNutrition & Health Education Women (15-45 years) AWW / ANM / MOAWW: Anganwadi worker; AWH: Anganwadi Helper; ANM: Auxiliary Nurse Midwife, MO: Medical Officer
Geographic focus of was on drought-prone areas and blocks with a significant proportion of scheduled caste and scheduled tribe population. In 1975, 33 blocks were covered under ICDS and over the last two decades the ICDS coverage has progressively increased. 5659 projects have became operational as on 31.3.2006 (Figure 9.1) Services (Table 9.1) are provided through community-based workers at the ‘Anganwadi’ (AW). One anganwadi centre has been catering to 1000 population in a rural / urban project and 700 population in tribal areas. ICDS Expansion ICDS has expanded to cover nearly all the population in the country (Figure 9.2). During the last 15 years, there has been steep increase in number of AWC’s, which have become operational during the period 2002-06; over 2.1 lakhs anganwadis have been operationalised. There has been progressive increase in the persons receiving supplements provided (Figure 9.3). Currently, services under the scheme are being provided to about 562.18 lakh persons, (467.18 lakh children 0-6 years and 95 lakh pregnant and lactating mothers through a network of about 7.48 lakh Anganwadi Centers (Source: WG report). In ICDS programme, Centre was bearing the cost of maintaining the infrastructure, while the states provided for the food component. With increasing coverage, there has been increase in number of persons getting food supplements. The central expenditure on the scheme has increased from Rs.1.54 crore in 1975-76 to Rs. 1,000 crore in 2000-2001 (Figure 9.4). With the increase in coverage,
Figure 9.2: No. of operational AWC's
2.50
3.50
5.40
7.50
0
1
2
3
4
5
6
7
8
31/3/92 31/3/97 31/3/02 31/3/06
No.
(in
lacs
)
Source: Reference 9.5
Figure 9.3: Persons receiving food supplements
00.5
11.5
22.5
33.5
1995
-96
1996
-97
1997
-98
1998
-99
1999
-20
00
2000
-20
01
2001
-20
02
Num
bers
(in
mill
ions
)
Children Below 6 years Mothers
Source: Reference 9.6
331
Figure 9.4: ICDS Expenditure (Centre)
1.54
5.93 73
.75 25
4.64
568.
38
587.
64
608.
85
796.
61
881.
46 1000
.00
0
200
400
600
800
1000
120019
75-7
6
1980
-81
1985
-86
1990
-91
1995
-96
1996
-97
1997
-98
1998
-99
1999
-200
0
2000
-01
Rs.
in c
rore
Source: Reference 9.6
Figure 9.5: Year wise outlays for nutrition
0
400
800
1200
1600
1996
-97
1997
-98
1998
-99
1999
-20
00
2000
-01
2001
-02
Rs.
in c
rore
State Outlay BMS/ PMGYSource: Reference 9.7
there was an increasing need for funds for the food supplements as well. The centre
provided funds for take home foods for 6-36 months during the 9th plan period under the Pradhan Mantri Gram Yojna (PMGY). Though the central expenditure has increased over the years, there has been no corresponding increase in the states’ own plan expenditure on food supplements during the Ninth Plan period (Figure 9.5). Nutrition component of ICDS Nutrition component of ICDS aims to provide the following services nutrition education to mothers for improving dietary intake and dietary diversity nutrition education regarding appropriate infant and young child feeding growth monitoring and detection of growth faltering act as depot holder / assist in providing massive doses of vitamin A, ORS and IFA
tablets. food supplementation to pre-school children between the age of six months to six
years, pregnant and lactating mothers and selected adolescent girls AWW is expected to survey all families in the community and identify all pregnant, lactating and preschool children, monitor growth of children and provide food supplements to the three groups as indicated in Table 9.2 for 300 days in a year. The type of food supplements provided varied widely, from food grains, take home foods, ready-to-eat food to foods cooked in the anganwadi. Over years the Anganwadi has got identified mainly as a centre providing available food supplements to those who come to the Anganwadi. The other activities such as nutrition education, preschool education and growth monitoring have not received due attention and coverage.
Table 9.2: Average daily nutritional suppleBeneficiary Calories Proteins Children < 3 years 300 8-10 Children 3-6 years 300 8-10 Preg & Lact (P&L) 500 20-25
332
The emphasis was initially on providing on-the-spot feeding in the anganwadi because it was believed that ∗ this would ensure that the targeted mothers and child would get food supplements,
which would not be shared between other members of the family; and ∗ their coming to anganwadi centres for receiving food supplements would provide an
opportunity for providing nutrition education to women on cooking and feeding young children.
However, the on-the-spot cooked food feeding programme has several disadvantages as well. They are: ∗ children especially those in the age group of 6-36 months cannot consume the entire
amount of food provided because of a smaller stomach capacity; ∗ even if older children do eat the food provided in the anganwadis, this acts mainly as
a substitute, and not an addition, to home food; ∗ the most needy segments viz., children in the critical 6-36 month age group and
women, may not be able to come to the anganwadi’s and receive the food daily; ∗ cooking food, feeding the children and cleaning the vessels and the anganwadi take
up most of the time of the anganwadi workers and helpers, leaving them little time for other important activities such as growth monitoring, nutrition education, or pre-school education;
∗ in any mass cooking and feeding programme, the monotony of the food provided and relatively poor quality of the preparations is a problem;
∗ cooking in poor hygienic conditions and keeping left-over food may result in bacterial contamination of food;
∗ undernourished children, even those in the 3-6 year age group, if given double rations, cannot consume all the food at one sitting in the anganwadi, and if cooked food is kept at home for feeding later, it may get contaminated and spoilt.
Current status The National Family Health Survey 3 obtained information from all the households surveyed on the type of services availed by them from ICDS. NFHS provides for the first time nationwide data on utilization of services with reference to characteristics of the surveyed households and state specific data on services provided by ICDS systems.
0102030405060708090
<12 12-23 24-35 36-47 48-59 60-71
Not receiving supplementary food Any services Almost daily receving supplementary food
Figure 9.6: Percentage of children age 0-71 months recieving services from an AWC
Source Reference 9.8
333
Figure 9.7: Percentage of children 0-59 months in areas covered by AWC by frequency of weighing
0
20
40
60
80
100
120
<12 12-23 24-35 36-47 48-59
%
Not at all Atleast once a month Atleast once in three monthsSource Reference 9.8
Inspite of guidelines specifying that monthly weighing of children should be done in the crucial 0-24 months age group, the percentage of 0-12 and 12-23 months old children who were weighed every month was negligible. Among the 2-6 years old children, less than 10% have been weighed once in three months. Though weighing for growth monitoring and detection of growth faltering has been conceptualized as one of the key components of ICDS programme, it has not been operationalised (Figure 9.6). It is well recognized that the first 24 months are the opportunity window for preventing undernutrition in children. Data from NFHS 3 shows that during the first 2 years, less that a third received any services and the proportion receiving food and supplements were negligible. In the other age groups only one-fifth had received supplementary food (Figure 9.7). There are huge interstate differences in services provided to lactating women, pregnant women and preschool children in the Anganwadi (Figures 9.8, 9.9 and 9.10). Coverage under services to pregnant women is low not only in poorly performing states like Bihar
Figure 9.8: Interstate differences in mother receiving services from an AWC during lactation
0
10
20
30
40
50
60
70
Bih
ar
Nag
alan
d
J &
K
Del
hi
Aru
nach
al P
r.
Pun
jab
Trip
ura
Man
ipur
Har
yana
Utta
r Pr.
Ker
ala
Guj
arat
Raj
asth
an
Ass
am
Uttr
anch
al
Indi
a
And
hra
Pr.
Mah
aras
htra
Kar
nata
ka
Wes
t Ben
gal
Sik
kim
Mad
hya
Pr.
Him
acha
l Pr.
Meg
haly
a
Jhar
khan
d
Oris
sa
Tam
ilNad
u
Goa
Miz
orum
Chh
atis
garh
%
Supplementary food Health check-ups NHESource: Reference 9.8
334
and UP but also in some better performing states like Delhi and Punjab. Amongst the three services, coverage under supplementary feeding is the highest in all states. Coverage ranges from 2% in Bihar to 60-70% reported by Mizoram and Chattisgarh. In some states like Chattisgargh and Orissa, antenatal coverage is higher while in states like Goa, Mizoram, Meghalaya and Himachal Pradesh, coverage under nutrition and health education is higher.
Figure 9.9: Interstate differences in services received during pregnancy
0 10 20 30 40 50 60 7
Bihar
Delhi
J & K
Punjab
Uttar Pr.
Assam
Rajasthan
Gujarat
Andhra Pr.
Sikkim
Karnataka
Himachal Pr.
Meghalya
Goa
Mizoram
0
Supplementary food Health check-ups NHE
Source: Reference 9.8
335
It is obvious that in states which have high coverage rates; coverage is high for all the 3 components suggesting that functional status of Anganwadi is perhaps the most important aspect of coverage in different services. Similar interstate differences are seen in lactating women and preschool children. Figure 9.10: Percentage of children 0-71 months receiving any services from an AWC
0 10 20 30 40 50 60 7
Bihar
Punjab
J & K
Uttar Pr.
Haryana
Manipur
Kerala
India
Karnataka
Nagaland
Jharkhand
TamilNadu
Meghalya
Madhya Pr.
Chhatisgarh
Percentage0
Source: Reference 9.8
It is noteworthy that percentage of children receiving any service in Delhi and Punjab (with high per capita income, good connectivity) is just higher than coverage in Bihar and lower than Uttar Pradesh and Rajasthan. On the other hand, Orissa, Chattisgarh, Mizoram, Madhya Pradesh and Maharashtra report high coverage levels. Inspite of high coverage levels, child undernutrition rates in Orissa, Chattisgarh, Madhya Pradesh and Maharashtra are high.
336
Evaluation of nutrition component of ICDS The nutrition component of ICDS programme has been repeatedly evaluated. The Nutrition Foundation of India (NFI), Delhi was the first organization to carry out an evaluation of ICDS and recommend steps for improving the services delivered by the ICDS. Subsequently, National Institute of Public Cooperation and Child Development (NIPCCD), Delhi carried out an evaluation in 1992 and reported that the prevalence of underweight was lower among children in areas with the ICDS program in place than elsewhere, for both children under three and children aged 3 to 6. National Council of Applied Economic Research (NCAER), Delhi had focused their evaluation on the quality of infrastructure and inputs. In addition, there have been several small-scale evaluations. The World Bank carried out the baseline and end line survey of the WB funded ICDS programme in five states. They found that ICDS is well-conceived and well-placed to address the major causes of child undernutrition in India; however in the programme, more focus has been given to increasing coverage than to improving the quality of service delivery and to distributing food rather than changing family-based feeding and caring behavior. As a result, impact in terms of reduction in undernutrition has been limited. The key mismatches between the program’s intentions and its actual implementation identified by the World Bank were: The dominant focus on food supplementation is to the detriment of other tasks
envisaged in the program, which are for improving child nutritional outcomes. For example, not enough attention is given to improving child-care behaviors, and on educating parents how to improve nutrition using the family food budget;
Service delivery is not focused on the youngest children (under three), who
could potentially benefit most from ICDS interventions. ICDS is only partially succeeding in preferentially targeting girls and lower castes who are at higher risk of under-nutrition;
Although program growth was greater in underserved than well-served areas during
the 1990s, the poorest states and those with the highest levels of under-nutrition still have the lowest levels of program funding and coverage by ICDS activities.
Examples of successful interventions (Bellary district in Karnataka) and innovations/variations in ICDS from several states (the INHP II in nine states, the Dular scheme in Bihar and the TINP in Tamil Nadu) suggest that the potential for better implementation and for impact does exist. But the program faces substantial operational challenges inadequate worker skills, shortage of equipment, poor supervision and weak M&E in most states and consequent poor impact on undernutrition rates.
337
Recent studies estimate the association between having an anganwadi center in a village and the likelihood that a child is underweight, and found little or no association between the presence of an ICDS center and child nutritional status. Using multivariate analysis of the 1992/93 NFHS data, the World Bank (2004) estimated that, for boys, having a local ICDS center is associated with a 5% reduction in the likelihood of being underweight, but that there is no significant association for girls. Data from both the 1992/93 and 1998/99 NFHS when analysed using propensity score matching techniques, did not reveal any significant effect when children in ICDS villages were compared with children with similar demographic, household and village characteristics in non-ICDS villages. The percentage of administrative blocks covered by ICDS has reached almost 90%. However, the percentage of children who actually take up the services provided by the program is lower and varies considerably across states. By December 2002 only one quarter of children aged between 6 months and 6 yrs benefited from the SNP component of ICDS, on average, with this figure ranging from little more than 10% to over 90% across the states (Figure 9.11). Coverage is high in the northeastern states.
Source: Reference 9.9
Figure 9.11: Inter state variation in the percentage of children enrolled in the SNP component, 2002
338
Source: Reference 9.9
Figure 9.12: Relationship between per capita net state domestic product (NSDP) and ICDS coverage
States with lower per capita Net State Domestic Product (NSDP) have a smaller percentage of villages covered by the ICDS program than those with higher NSDP (Figure 9.12). Many states in which the prevalence of underweight is high, the proportion of villages with AWC’s is low. Five states with the highest underweight prevalence, namely Rajasthan, Uttar Pradesh, Bihar, Orissa and Madhya Pradesh, all rank in the bottom ten in terms of ICDS coverage (Figure 9.13).
Source: Reference 9.9
Figure 9.13: Relationship between the proportion of villages covered by ICDS and underweight prevalence by state, 1998/99
339
Source: Reference 9.9
Figure 9.14: Inverse relationship between the percentage of underweight children and the percentage of children who are ICDS beneficiaries, by state
States with a greater percentage of underweight children tend to have a smaller percentage of children enrolled in the ICDS program. Worst is Bihar where, despite an underweight prevalence of 55%, only 1.5% of children benefit from the ICDS program. At the other end of the spectrum, Manipur, Mizoram, Nagaland and Sikkim with low prevalence of underweight children (between 20% and 30%), yet are among the five states with the highest percentage of ICDS beneficiaries (Figure 9.14). Public expenditure by state and national governments is very low in states in which prevalence of underweight is very high. Four of the states that rank in the top five for underweight prevalence (namely Bihar, Uttar Pradesh, Rajasthan and Madhya Pradesh) are also the four states that receive the least for ICDS, on a per child basis (Figure 9.15).
Source: Reference 9.9
Figure 9.15: Relationship between state underweight prevalence and GOI and state public expenditure allocations, 1998/99
340
Source: Reference 9.9
Figure 9.16: Percentage of children (of those living in villages with AWC’s) who attend the AWC at least once a month, by age
Review of the baseline and endline survey in ICDS III in six states carried out by World Bank revealed several interesting findings. Infants and children under three are least likely to attend the anganwadi center. The attendance steeply rose after two yrs of age in Kerala (Figure 9.16). In all states the attendance rates of scheduled caste and scheduled tribe children are in line with or slightly better than that of other castes (Figure 9.17).
Source: Reference 9.9
Figure 9.17: Percentage of children (of those living in villages with AWC’s) who attend the AWC at least once a month, by caste
341
World Bank study also showed that the poorer segments of the population did not access Anganwadis more often that their better off counter parts. Among children living in villages with anganwadi centers, little variation is found in participation rates across wealth quintiles (Figure 9.18). However, the attendance at AWC’s varies widely both across and within states as there is heterogeneity across states in the attendance rates of children living in urban, rural and tribal areas (Figure 9.19).
Source: Reference 9.9
Figure 9.18: Percentage children (of those living in villages with AWC’s) who attend the AWC at least once a month, by asset quintile)
Source: Reference 9.9
Figure 9.19: Percentage children (of those living in villages with AWC’s) who attend the AWC at least once a month, by location
342
Source: Reference 9.9
Figure 9.20: Percentage of AWWs with growth monitoring equipment in place
Percentage of AWC’s with growth monitoring equipment in place is shown in Figure 9.20. AWCs in Kerala and Madhya Pradesh were better equipped than those in the other three states.
Table 9.3: Regularity of food supply to AWC’s and the availability of the take-home food programme Kerala Maharashtra Uttar
Pradesh Madhya Pradesh Chattisgarh
% AWC’s with no recent irregularities in food supply 60% 41% 68% 27% 17%
% AWC’s with a take home food programme 15% 28% 42% 95% 75%
Source: Reference 9.9
Source: Reference 9.9
Table 9.4: Anganwadi centre infrastructure, by location
343
Source: Reference 9.9
Table 9.5: Comparison of immediate health outcomes and behaviors across children living in villages with and without an AWC
In a multivariate model of cross-sectional data collected in Kerala, Rajasthan and Uttar Pradesh between 2000 and 2002, Bredenkamp and Akin (2004) found that children who live in villages with anganwadi centers are not significantly less likely to be underweight or ill than other children. When using data on actual attendance at anganwadi centers in six states, it is found that only in Kerala is this significantly associated with better nutritional status. There is also not much evidence that ICDS has been successful in attaining its goal of improving the coverage of specific child health interventions such as de-worming and Vitamin A supplementation, and encouraging mothers to adopt appropriate child care and feeding behaviors (including practices related to breastfeeding, weaning and diet) that have the potential to improve child growth and health outcomes. Data from Kerala, Maharashtra, Rajasthan and Uttar Pradesh show no clear evidence that these behaviors were more common in ICDS areas, with the exception of Maharashtra (Bredenkamp and Akin, 2004) (Table 9.4, 9.5). Although communication for behavior change through the AWW is a crucial weapon against poor health and malnutrition, it appears that any information that the AWW is conveying to mothers is not being communicated effectively enough to impact positively on mothers’ behavior. Recommendations from WB baseline and end line survey Activities need to be refocused on the most important determinants of malnutrition.
Programmatically, this means emphasizing disease control and prevention activities, education to improve domestic child-care and feeding practices, and micronutrient supplementation. Greater convergence with the health sector, and in particular the Reproductive and Child Health (RCH) program, would help tremendously in this regard;
344
Activities need to be better targeted towards the most vulnerable age groups (children under three and pregnant women), while funds and new projects need to be redirected towards the states and districts with the highest prevalence of malnutrition; Supplementary feeding activities need to be better targeted towards those who need
it most; Communities need to be involved in the implementation and monitoring of ICDS can
be used to bring in additional resources into the anganwadi centers, improve quality of service delivery and increase accountability in the system;
Monitoring and evaluation activities need strengthening through the collection of timely, relevant, accessible, high-quality information, and this information needs to be used to improve program functioning by shifting the focus from inputs to results, taking informed decisions and creating accountability for performance.
ICDS in the Eleventh plan Even though ICDS is the oldest and the largest of the food supplementation programmes in the world for improving nutritional status of vulnerable groups, still the impact of this programme in terms of improvement in nutritional status of the vulnerable groups has been suboptimal. During the Eleventh Plan every effort will be made to enhance quality and impact of ICDS programme through
improving infrastructure of anganwadi center so that the essential minimum equipment and supplies needed for good quality services are available; improving the knowledge and skills of the AWW through effective training creating nutrition awareness through IEC at all levels (community, women’s
group, village-level workers, PRIs, programme managers and policy makers at the state and central levels); and improving community ownership of the programme establishing effective supervision of the ICDS functioning ensuring inter-sectoral coordination and strengthening nutrition action by the
health sector improving monitoring so that problems in implementation of the programme are
identified and appropriate mid course correction Improvement in maternal nutrition / nutrition in early infancy Problem Currently less than 20 % of the women avail the ICDS food supplements provided in the Anganwadi; many may not be undernourished; very few take the food supplements regularly. The data from the Pilot project on food grain supplementation to pregnant and lactating women has shown that this strategy can be implemented effectively even in the poorly performing districts in all states and through this majority of the undernourished
345
pregnant women can be provided with food grains. As they have to collect the food grains from the ration shop only once in the month the coverage is better and the intervention is cost effective. Recommendations of the working group Identify and weigh all pregnant women – provide 6 kg of food grains free of cost to those with weight less 45 kg for the remaining period of pregnancy; ensure that they get appropriate antenatal care Identify and weigh all lactating women - provide 6 kg of food grains free of cost to those with weight less 40 kg for the first six months of lactation; ensure that their infants are exclusively breast fed for the first six months Reduce IMR / improve nutritional status in infancy Problem Majority of births in populous states occur at home and absence of mechanism for recognition of at risk neonate contributes to high neonatal mortality. The Tenth Plan goals for early initiation of breast feeding, exclusive breast feeding and timely initiation of complementary feeding have not been achieved Recommendations of the working group Provide a 10 kg tubular Salter balance to the AWW; ensure that she weighs all
neonates born at home as early as possible after birth, identifies those weighing less than 2.2.kg and refers them to the nearest hospital with pediatrician BCC for exclusive breast feeding; Ensure timely immunization by ANM by ensuring that all infants do come to AW on
the immunization day BCC for appropriate complementary feeding, ensuring timely initiation, appropriate
quality, quantity and frequency of feeding Weigh all infants using the tubular Salter balance accurately at least once in three
months; identify those with varying grades of under-nutrition and provide needed nutrition care BCC regarding appropriate feeding during illness and convalescence
Preschool children Problem The rate of reduction in under-nutrition in children is too slow; the goals for the Tenth Plan in terms of reduction in under-nutrition in children have not been achieved. Recommendations of working group for universalization and improving quality of ICDS Ensure that all preschool children in the village/ urban block are identified in the
survey and are registered with the AW.
346
prevent under-nutrition by providing nutrition education through interpersonal communication (by ANM/AWW) to all families with preschool children to • promote appropriate intra-family distribution of food; • dietary diversification to meet the nutritional needs of the child Demonstrate how to cook low cost balanced tasty meals from locally available
cereal, pulse and vegetables and feed the young children – demonstration can be done in the anganwadi on immunization, health and nutrition days Operationalise universal screening of all preschool children for under-nutrition,
monitoring growth in individual child’s card (cards should be made available) and identifying children with different grades of undernutrition. Operationalise nutrition interventions for the management of under-nutrition:
• For children with mild undernutrition - teach the mothers on care of these children with home available food
• Identify children with moderate and severe under nutrition and give appropriate nutrition and health care; take home food supplements may have to be given for the initial period and the children carefully monitored
• Identify severely undernourished children who fail to improve under home management, those with infections and other complications and refer them to hospitals for care
Decentralized district based planning
Problem There are massive differences not only between states but also between districts in the same state. Some states and some districts in all states have achieved substantial improvement in health and nutrition indices while large populous states/ districts lag behind.
Undernourished Children NFHS (1998-99) Average Best Worst
Recommendations of the working group The district should be taken as a unit for planning, implementation and monitoring of the ICDS programme. District data on nutrition and health status of children from DLHS will have to be used for district based planning as well as assessing the impact of interventions through ICDS. Specific efforts should be made to provide adequate inputs based on the actual situation in the district and not have arbitrary uniform numbers for providing supplementary feeding in the anganwadi. There is a need to address budgetary allocation for ICDS to improve quality of services. It is important to specify district wise the investments needed to operationalise interventions, provide the needed outlays, monitor nutrition outputs and outcomes
347
Intersectoral collaboration Infections aggravate undernutrition. Interventions to reduce infections such as improved access to safe drinking water and sanitation and improved access to health care for early and effective treatment of infections should receive priority attention because they will result in improvement of nutritional status of the population. There is a need to ensure sytematic collaboration between the ICDS and NRHM/RCH such as the Health/Nutrition days which are operational in several states. It is essential to ensure active involvement of the PRI and the community in monitoring the activities and improving the functioning of the AWC. Monitoring of ICDS programme The ICDS reporting formats for should be reviewed, simplified, reduced, and made similar to RCH formats. Simplified and rapid reporting, supported by computerisation would be helpful. Some of the states like Orissa and West Bengal have utilised user friendly soft ware to graphically depict monthly progress so that these indices could be easily monitored . The fact that there is close monitoring will bring about accountability; also problems areas where implementation is faltering can be readily identified and corrective measures taken. Some of the key activities which need to be monitored closely and the AWW, supervisor, DM to improve accountability for poor performance at at village, block and district level respectively are : registration of pregnant women, births and deaths nutrition education, impact of counselling on infant feeding coverage under universal weighing to detect growth faltering, number of
malnourished children and the care that they are receiving . immunization rate, ORT use and nutrition care during illness
348
References 9.1 Department of Women and Child Development. 1993. National Nutrition Policy Government of
India. New Delhi 9.2 Department of Women and Child Development. 1995. National Plan of Action. Government of
India, New Delhi 9.3 Planning Commission. 2002. Tenth Five-Year Plan.
http://www.planningcommission.gov.in/plans/planrel/fiveyr/welcome.html accessed on 2.10.2007. 9.4 Planning Commission Towards a faster and more inclusive growth: Approach paper to Eleventh
Five Year Plan www.planningcommission.gov.in/plans/planrel/app11_16jan.pdf accessed on 2.10.2007
9.5 Department of Women and Child Development. Annual Report 2007 www.wcd.nic.in last accessed on 2.10.2007
9.6 Department of Women and Child Development. Annual Report 2003 www.wcd.nic.inlast accessed on 2.10.2007
9.7 Planning Commission. Annual Plan 2003 www.planningcommission.gov.in/plans last accessed on 2.10.2007
9.8 National Family Health Survey –3 www.nfhsindia.org/nfhs3_national_report.html last accessed on 2.10.2007
9.9 Michele Gragnolati, Caryn Bredenkamp, Meera Shekar, Monica Das Gupta and Yi-Kyong Lee: India’s undernourished children: A call for reform and action; World Bank Washington 2006
9.10 Ministry of Women and Child Development: Report of the Sub group on ICDS and nutrition www.wcd.nic.in accessed on 2.10.2007