Page 1
INTEGRATED COST BUDGETING AND COSTESTIMATION MODEL FOR BUILDING PROJECTS
Sarmad Al-Mashta
A Thesis
In the department of
Building, Civil & Environment Engineering
Presented in Partial Fulfilment of the Requirements
For the Degree of Masters in Applied Science at
Concordia University
Montreal, Quebec, Canada
July 2010
© Sarmad Al-Mashta, 201 0
Page 2
1*1 Library and ArchivesCanada
Published HeritageBranch
395 Wellington StreetOttawaONK1A0N4Canada
Bibliothèque etArchives Canada
Direction duPatrimoine de l'édition
395, rue WellingtonOttawa ON K1A 0N4Canada
Your file Votre référenceISBN: 978-0-494-70983-2Our file Notre référenceISBN: 978-0-494-70983-2
NOTICE:
The author has granted a non-exclusive license allowing Library andArchives Canada to reproduce,publish, archive, preserve, conserve,communicate to the public bytelecommunication or on the Internet,loan, distribute and sell thesesworldwide, for commercial or non-commercial purposes, in microform,paper, electronic and/or any otherformats.
AVIS:
L'auteur a accordé une licence non exclusivepermettant à la Bibliothèque et ArchivesCanada de reproduire, publier, archiver,sauvegarder, conserver, transmettre au publicpar télécommunication ou par l'Internet, prêter,distribuer et vendre des thèses partout dans lemonde, à des fins commerciales ou autres, sursupport microforme, papier, électronique et/ouautres formats.
The author retains copyrightownership and moral rights in thisthesis. Neither the thesis norsubstantial extracts from it may beprinted or otherwise reproducedwithout the author's permission.
L'auteur conserve la propriété du droit d'auteuret des droits moraux qui protège cette thèse. Nila thèse ni des extraits substantiels de celle-cine doivent être imprimés ou autrementreproduits sans son autorisation.
In compliance with the CanadianPrivacy Act some supporting formsmay have been removed from thisthesis.
Conformément à la loi canadienne sur laprotection de la vie privée, quelquesformulaires secondaires ont été enlevés decette thèse.
While these forms may be includedin the document page count, theirremoval does not represent any lossof content from the thesis.
Bien que ces formulaires aient inclus dansla pagination, il n'y aura aucun contenumanquant.
1*1
Canada
Page 3
ABSTRACT
Integrateci Cost Budgeting and Cost Estimation Model for
Building Projects
Sarmad Al-Mashta
Concordia University, 2010
Cost estimation is an essential skill in the construction industry. For each stage in
the project life cycle, conceptual design till decommissioning, there are particular
techniques to perform cost estimation. Starting from the preliminary design stage,
cost estimates progressively become more detailed and more challenging as a
task that requires more man-hours. Consequently, it is not feasible to be
performed repetitively. Considering this, detailed cost estimates are only
performed at specific points during the design and at the bidding; leaving gaps
were project cost can grow out of control.
This research proposes a methodology to develop an integrated cost budgeting
and cost estimation model for building projects. The proposed model is
implemented by integrating an automated quantity take-off system, with a
relational database to generate cost estimate reports. The dynamic environment
of the proposed model, streamlines the preparation of cost estimates in order to
reflect, virtually instantly, the impact of changes in project scope on the cost.
Accordingly, decision makers will be able to; venture various scenarios to meet
the client budget without compromising the project quality, save tremendous
III
Page 4
amount of resource-hours allocated to prepare cost estimates and cut down
design process cost. The benefits of such a model can extend well beyond the
doors of engineering offices to tremendously reduce the time required by
contractors for preparing bidding estimates.
IV
Page 5
ACKNOWLEDGEMENT
I am heartily thankful to my supervisor Prof. S. Alkass whose encouragement,
guidance and support throughout the entire period of this research.
To my father, Abdulla, who has been a source of inspiration to me throughout my
life. To my Mother, Perijan, whom from I received and learned unconditional love.
To Azal, my son, for continuously blessing me with his smiles and love that
converts toughest times into a hope.
I am indebted to my best friends in life and in profession Akeel Shikara and Sam i
Kazemi for the endless stimulating debates and dreams about "Architecture", and
for the wonderful friends they are. In addition I would like to thank my colleague
in the Construction Automation Lab Tushith Islam for the enlightening
discussions.
I am especially grateful to Patricia Crespien for all the care she bestowed on me
that provided me with 'writing space' throughout 2009. Lastly, I offer my regards
and blessings to all of those who supported me in any respect during the
completion of the project.
To my late grandfather, Abdulwahab, I dedicate this
V
Page 6
TABLE OF CONTENTS
1. Chapter 1 1
Introduction 1
1.1. General 1
1.2. Research Objectives 21.3. Methodology 3
1.3.1. Literature review 3
1.3.2. Software review 3
1.3.3. Model development 31.3.4. Validation of the Model 3
1.4. Thesis organization 4
2. Chapter 2 5
Cost Estimation, Background 5
2.1. Introduction 5
2.2. Cost Estimate Definitions 7
2.3. Uses of Cost Estimate 9
2.4. Cost Estimates Types and Methods 92.5. Classes of Cost Estimates 14
2.6. Estimating Process 152.7. Different types of Costs 182.8. Direct Cost 19
2.9. Historical data 21
2.9.1. Cost Index 22
2.10. Work Breakdown Structure 23
2.10.1. Work Breakdown Structure Formats 24
2.10.2. OmniClass 29
2.11. Summary 31
Vl
Page 7
3. Chapter 3 34
Computers in Cost Estimation 34
3.1. Introduction 34
3.2. Computers in Building Design 343.2.1. Computer-Aided Design (CAD) 353.2.2. Building Information Modeling (BIM) 373.2.3. BIM vs. CAD 38
3.3. Computer in Cost Estimations 413.3.1. Computers Aided Quantity Take-Off 423.3.2. Computers and Cost Estimation Reports 47
3.4. Potentials of Electronic Document 49
3.5. Summary 50
4. Chapter 4 51
Methodology 51
4.1. Introduction 51
4.2. Requirements 524.3. Analysis and Design 52
4.3.1. Estimating Process 534.3.2. Elemental Cost Estimate 54
4.3.3. Mapping Elemental WBS to Trade WBS 564.3.4. Relational Database management System (RDBMS) 594.3.5. AutoDesk Revit 61
4.4. Design Stage 684.4.1. Cost Data Processing 684.4.2. Quantity Take-off Process 694.4.3. Cost Calculation Process 70
4.4.4. Cost Estimate Reporting Process 71
4.5. Summary 71
VII
Page 8
5. Chapter 5 73
Proposed Model Implementation Development and Architecture 73
5.1. Introduction 73
5.1.1. Generic Architecture 73
5.1.2. Proposed Model Configuration 755.1.3. Proposed Model Architecture 765.1.4. Proposed Model Architecture Components 76
5.2. Database implementation 795.2.1. Generic Database 795.2.2. EWBS Database 80
5.2.3. TWBS Database 81
5.2.4. Assemblies Cost Databases 82
5.2.5. GAC Implementation 85
5.3. Proposed Model Core Functions Implementation 875.3.1. Cost Calculation Mechanism 88
5.4. Proposed Model Data Flow 925.5. Proposed Model Benefits 93
5.5.1 . Benefits of Using Elemental Work Breakdown Structure (EWBS)95
5.6. Summary 96
6. Chapter 6 97
Proposed Model Validation and Performance 97
6.1. Introduction 97
6.2. System Initialization 976.2.1. Populating Generic Database 976.2.2. EWBS and TWBS databases 98
6.2.3. Establishing the ODBC 100
6.3. Preparing Cost Database(s) 1026.4. Exporting CAG to Revit 106
Vili
Page 9
6.5. Inside Revit 107
6.6. Generating the Cost Estimate Reports 1096.6.1. Generating Datasheets Reports 1096.6.2. Generating Graph Reports 114
6.7. Performance Benchmarking 1196.7.1. Testing System Specifications 119
6.8. Summary 119
7. Chapter 7 121
Conclusion and Future Expansion 121
7.1. Conclusion 121
7.2. Research contribution 122
7.3. Research Limitation 123
7.3.1. Limitations of Unit-Cost Method 123
7.3.2. Other limitations 123
7.4. Future Research and Expansion. 1237.4.1. Implementing IFC 1237.4.2. Implementing Cost Adjustments 1237.4.3. Integrating the 5thD 124
8. References 125
9. Appendix A 129
MasterFormat 2004 Division Numbers and Titles 129
10. Appendix B 131
UniFormat Levels 131
11. AppendixC 134
Mapping UniFormat to MasterFormat 2004 134
IX
Page 10
12. Appendix D 137
Case Study Project Drawings 137
13. Appendix E 141
Case Study Project 141
Cost Estimation Reports 141
X
Page 11
LIST OF FIGURES
Figure 2.1: Factors / Constrains of Project Quality 6
Figure 2.2: Change of Cost and Time 7
Figure 2.3: The 11 Step Cost Estimate Process 16
Figure 2.4: Steps in Estimate Process 16
Figure 2.5: Cost Estimate Process 18
Figure 4.3: Three Construction Methods for an L-shape tilt Panel 20
Figure 2.6: Overview of a Project Management System 22
Figure 2.7: UniFormat Structure 25
Figure 2.8: MasterFormat 2004 Structure 26
Figure 2.9: Hierarchy of the Formats 27
Figure 2.10: Program and Design Specifications 27
Figure 2.11: OmniClass Structure 31
Figure 3.1: 2D CAD Drawing in AutoCAD 2009 36
Figure 3.2: Architectural BIM Model in Revit 38
Figure 3.3: Coordinating different disciplinary models 40
Figure 3.4: Sequencing Schedule for Onsite Assembly of Loblolly House 40
Figure 3.5: Izone-MTO objects 43
Figure 3.6: Izon-MTO Zonning 44
Figure 3.7: Conceptual diagram of BIM quantity take-off 45
Figure 3.8: Architecture of Proposed Model 46
Figure 3.9: Output Table of Beams 47
Figure 3.10: Simple spreadsheet of bid summary 48Xl
Page 12
Figure 4.1: Model Development Cycle 51
Figure 4.2: Cost Estimating Process 53
Figure 4.4: Work Package (Elemental) Concept 55
Figure 4.5: RDBMS 60
Figure 4.6: Cross Tables Query Results 61
Figure 4.7: Project Browser; Revit Project Families 64
Figure 4.8: Revit Tables Structure 67
Figure 4.9: Doors Family (Types and instances) Tables Relationships 67
Figure 4.10: Cost Data Processing 69
Figure 4.11: Quantity Take-Off Process 70
Figure 4.12: Cost Calculation Process 70
Figure 4.13: Cost Estimate Reporting Process 71
Figure 5.1: Proposed Model on Conceptual Level 74
Figure 5.2: Proposed Model Configuration 75
Figure 5.3: Proposed Model Architecture 78
Figure 5.4: Units Table Snapshot 79
Figure 5.5: EWBS UniFormat Database Structure 80
Figure 5.6: EWBS Database GUI 81
Figure 5.7: TWBS Database Structure 81
Figure 5.8 : TWBS Database GUI 82
Figure 5.9: Assemblies Cost Database Structure 84
Figure 5.10: Assemblies Cost Database Management GUI Sub-forms 84
Figure 5.11: Snapshot of GAC 85
Figure 5.12: Selecting Assemblies from GAC inside Revit 86
XII
Page 13
Figure 5.13: Proposed Model Topology 87
Figure 5.14: Object Type Cost Calculation Query 89
Figure 5.15: Wall Cost calculation Query Snapshot 90
Figure 5.16: TWBS Cost Calculation Query Snapshot 90
Figure 5.17: Report Design View 91
Figure 5.18: Data flow for EWBS Cost Estimate 92
Figure 5.19: Dataflow for TWBS Cost Estimate 93
Figure 6.1: Units table Snapshot populated with unit conversion factors 98
Figure 6.2: UniFormat (EWBS) Management GUI 99
Figure 6.3: Populating UniFormat (EWBS) Tables using datasheet 99
Figure 6.4: MasterFormat Management Form 100
Figure6.5: Selecting ODBC Driver 101
Figure 6.6: ODBC setup 102
Figure 6.7: Selecting EWBS in Cost Database 104
Figure 6.8: Data entry for major classification (level 4) 104
Figure 6.9: Data Entry for Individual Line Number (level 5) 105
Figure 6.10: Data Entry for Assembly Components 105
Figure 6.11: Exporting CAG to Revit 106
Figure 6.12: Linking Revit Element to Cost Data 107
Figure 6.13: Linking Revit Element to Cost Data 108
Figure 6.14: Selecting Report in MS Access 109
Figure 6.15: Snapshot of EWBS Cost Report by Level 5 110
Figure 6.16: Snapshot of EWBS Detailed Cost Report 111
Figure 6.17: Snapshot of Objects without Cost Data Report 112
XIII
Page 14
Figure6.18: Snapshot of VE Report 112
Figure 6.19: TWBS Detailed Cost Report by Item 113
Figure 6.20: Snapshot of TWBS Cost Report - Level IV 114
Figure 6.21: Choosing Chart Type and Fields 115
Figure 6.22: Cost Estimate EWBS Level I 116
Figure 6.23: Cost Estimate EWBS Level Il 117
Figure 6.24: Cost Estimate TWBS Level I Chart 118
Figure 6.25: Combined EWBS and TWBS Chart 118
XIV
Page 15
LIST OF TABLES
Table 2.1: AACE Generic Cost Estimate Classification Matrix 15
Table 4.1: Matrix of the construction methods and the corresponding PCQ 21
Table 2.2: Relationship of UniFormat to Master Format 28
Table 4.1: Mapping Composite Assembly to MasterFormat 2004 57
Table 4.2: Results of Mapping a Composite Assembly to MasterFormat 2004 .. 57
Table 4.3: Mapping Simple Assembly to MasterFormat 2004 (Example 1) 58
Table 4.4: Mapping Simple Assembly to MasterFormat 2004 (Example 2) 58
Table 4.5: Results of Mapping Two Simple Assemblies to MasterFormat 2004. 59
Table 4.6: Employee Contact Table 59
Table 4.7: Department and Equipment Table 60
XV
Page 16
NOMENCLATURE
BlM Building Information Modeling
B.O.M. Bill of Materials
B. O. Q. Bill of Quantities
DB Database
EWBS Elemental Work Breakdown Structure
GAC Global Assemblies Catalogue
ODBC Open Database Connectivity
PCQ Process Construction Quantities
PPQ Procurement Process Quantities
RDBMS Relational Database Management System
SCML Systems' Components Master List
TWBS Trade Work Breakdown Structure
XVI
Page 17
CHAPTER 1
Introduction
1.1. General
Each construction project requires many cost estimates and re-estimates, based
on the stage of project (Peurifoy and Oberlender 2002). Depending on the project
complexity and the project phase, cost estimate preparation can become a very
tedious and time consuming process. It is, in itself, one of the project expenses.
Cost estimate aims to validate the work to be executed; this can happen on a
detail, phase or project level. The actual cost will remain always unknown
awaiting the completion of that work. From this very nature of uncertainty comes
the importance of reliable cost estimate, and the reason beyond contingency and
risk allocations.
No matter how complex is the required cost estimate, it always follows a simple
process; generate input data, process this data by applying appropriate
method(s) (computation formulas) to obtain an output.
In a traditional context, the elements that dictate the accuracy of the estimate
under preparation are; expertise of the project team, the used tools and methods,
the amount of allocated time, and the particularity of the available information
(Jrade 2000). The expertise and the experience of the estimator(s) are of highest
significance as they play a major role in appropriate generation and selection of
input data based on the available information, in the selection and1
Page 18
implementation of suitable method(s) to process that input, as well as to manage
the allocated time to generate the output.
Due to the complexity and the large amount of data generated by the process of
cost estimate, usually, the work is broken down into packages or components,
then the required resources are assigned for each component, then cost is
estimated for each resource. Finally, the total cost is calculated by aggregating
the packages or components cost.
1 .2. Research Objectives
The main objective of this research is to develop a methodology to automate the
cost estimate process for building projects. It should be independent from
quantity take-off mechanism and complying with Class 2 (Level 4) and/or Class 1
(Level 5) of AACE International Cost Estimation Classifications - 17R-97. (AACEIntarnotinnol "1QQ7\It ILV^l I IUltl^l IUt I \J\JI J
Also the research holds the following sub-objectives:
• Evaluate current trends in quantity take-off process to explore the
possibilities of integration and automation.
• Develop database model to store various cost sources to serve as global
catalogue for cost estimate preparation.
• Develop a method for mapping between different formats of cost estimate
work breakdown structures as required by the project phase or the project
team needs. This will enable the proposed model to reduce tremendously
the amount needed to generate a detailed quantity take-off.
2
Page 19
• Integrate the different parts into one computer model that can
accommodate the various sources and formats of quantity take-off and
costing databases to streamline the cost estimate process.
1.3. Methodology
To meet the forth mentioned objectives of the present research the following
procedures are executed:
1.3.1. Literature review
In-depth literature review is conducted in the areas of; cost estimation, building
projects design and documentation software and database design.
1.3.2. Software review
A review of genres of available automated quantity take-off packages, presented
by Izon-MTO developed by Archidata (based on 2D AutoCAD drawings) and
Revit developed by AuoDesk (Based on BIM - Building Information Modelling)
1.3.3. Model development
The iterative and incremental model is followed for the development of proposed
model. The proposed model is implemented by using Revit and Microsoft Access.
1.3.4. Validation of the Model
Once the system is developed it will be presented to experts, practitioners, cost
estimators and architects to obtain their feedback, comments and evaluation.
3
Page 20
1 .4. Thesis organization
This chapter (chapterl) gave a prelude for the research subject as well itidentified the outlines of this research.
Chapter 2 presents a literature review of present day methods, approaches and
solutions for cost estimate.
Chapter 3 addresses the role of computer and IT in construction domain
focusing on the cost estimate applications.
Chapter 4 explains the proposed model, which is developed based on the
findings from previous chapters. Covering it is various components and the
dataflow.
Chapter 5 describes the steps taken to implementing the proposed model into a
working solution. As well as, databases structures and relations and the required
inputs and the expected outputs.
Chapter 6 focuses on system performance by using it to generate automated
cost estimate for a case study project.
Chapter 7 summarizes and concludes the thesis of this research. It mentions
also prepositions for future expansions and extensions.
4
Page 21
CHAPTER 2
Cost Estimation, Background
2.1. Introduction
Cost estimate is a central process for any construction project, or simply it "is the
nuts and bolts of the construction industry" (Adrian 1993). Yet, it is not an exact
science (Peurifoy and Oberlender 2002), it is an "art more than science" (Adrian
1993). Nevertheless, the cost estimate level of accuracy, aside from meaning the
very existence of the project itself, it can mean as well the existence of the client,
the architect(s)/engineer(s) as well as the contractor(s) in the business. The
accuracy in itself depends on the method used, availability of cost data and level
of project definition (Jrade 2000). Therefore, throughout the years engineers had
developed many methods to improve the accuracy of the calculated cost
estimate.
From management perspective, Project Management Institute (PMI) defines
quality as "the degree to which a set of inherent characteristics fulfill
requirements" and it is subject to three constrains; time, scope and cost (Figure
2.1). Quality differs from grade, which is a "category assigned to products or
services having the same functional use but different technical characteristics"
(Project Management Institute 2008). CSI (Construction Specification Institution)
and CSC (Construction Specification Canada), and in accordance with PMI
defines three factors that affect the project quality and delivery method (CSI and
5
Page 22
CSC 2005). These are cost, time and extent (CSI/CSC). Consequently, project
control processes target these factors to deliver the project as per defined quality.
These factors are interrelated together, that any changes in any of them will incur
changes in the other two. For instance, changes in cost (or budget) will require
redefining the time (project schedule) and / or project scope to maintain the same
quality.
CostExtent (CSI)Scope (PMI)
Figure 2.1: Factors / Constrains of Project Quality
Un tne Guter nanu, îne Cui iou uunu anaycinciu µ? uocao ?? ?? ?a? auiei i¿.cu uy ti ic
decrease of decision makers' ability to influence the total cost of the project as a
function of time (CSI and CSC 2005) and (Project Management Institute 2008).
In other words, the earlier decisions have a higher impact on determining the
project cost in comparison with latter ones (Figure 2.2). the figure demonstrate
that the curve starts with an easy slope between the Conception and Delivery
Method, then slopes in a steep manner between the Schematic Design and
Facility Management, where it starts to ease again toward the end of the project
life cycle. Consequently, reliable cost estimates in those stages; Schematic
Design, Design Development, Construction Documents and Bidding are of high
6
Page 23
importance to support and inform the decision makers, as those stages constitute
more than 50% of their capacity to impact the project cost.
High
Low
Conception'"··..· Delivery Method
\ · Schematic Dëskjn
\ · Design DevelopmentConstruction Documeiüs
Bidding/Negotiating \
- Influence of stake holders (PMI)— Cost of Change (PMI)¦- Ability Influence Cost (CSI/CSC)
Facility Management
nssioning
Demolition & Disposal
Time
Figure 2.2: Change of Cost and Time(Adapted from CSI and CSC 2005, and Project Management Institute)
In the coming parts, this chapter will present the types, methods and common
practices of cost estimation procedures used in the building construction industry,
as well as a brief review of different work breakdown structures; OmniClass,
UniFormat and MasterFormat 2004 and their implementations.
2.2. Cost Estimate Definitions
According to Merriam Webster dictionary; "Estimate: to judge tentatively or
approximately the value, worth, or significance of, to determine roughly the size,
extent, or nature of, to produce a statement of the approximate cost of."
7
Page 24
Cost estimate can be viewed as the task of determining the quantities of work to
be performed, with the productivity and cost of the resources required to perform
that work (Adrian 1993). The Association for the Advancement of Cost
Engineering (AACE) defines cost estimate as; "a predictive process used to
quantify cost, and cost the resources required by the scope of an investment
option, activity, or project" (AACE International 1990) or it is; "an elevation of all
the costs of the elements of a project or effort as defined by an agreed-upon
scope" (Aaron, et al. 1997). As well it is; "the process of looking into the future
and trying to predict costs and resource requirements" (Halpin 1985). While PMI
defines two terms: Cost Estimating is; "developing an approximation of the costs
of the resources needed to complete project activities" and Cost Budgeting is;
"aggregating the estimated costs of individual activities or work packages to
establish a cost baseline". Another definition is; "an A/E's opinion of the probable
cost of construction based on the cost of similar constructed projects; published
cost data; input from construction participants; economic conditions prevailing at
the proposed time of construction; and contingency for inestimable factors" (CSI
and CSC 2005).
As a result, we find cost estimate definitions, although they differ from experts to
expert and from researcher to another, they agree on the outline in describing the
process of cost estimate as: A forecast of the most probable expected use or
expenditure of the required resources to realize, complete or execute a; defined
task, an activity, an element or a project during certain time range.
8
Page 25
2.3. Uses of Cost Estimate
The use of cost estimate depends on the stage of the project, the audience that
will evaluate it and its perspective. Generally speaking, for the owner(s); it means
the feasibility of the project or cash flow schedule, for the architect and
engineers; it is meeting the project budget assigned by the client and/or
performing value engineering to augment the project quality or grade, as for the
contractor; it represents the "flight plan" to be followed and to aid him in achieving
profit (Halpin 1985).
2.4. Cost Estimates Types and Methods
Cost estimate references refer to estimate types and methods as separate
topics. However, from this research point of view, it is more suitable to address
them together as often an estimate type will be defined by the used method.
Project stages dictate the amount and nature of available information to prepare
a cost estimate. This stipulation infers the available options at each stage in
regards to which method(s) can be used to accomplish the estimate. Conversely,
the selected method will characterize the estimate type. On the other hand, it
should be noted that all the various estimate's methods and types share the
same single objective; that is to increase the estimate accuracy.
Based on the stage of the project two broad categories can be defined (Adrian
1993):
• Pre-Construction Design estimates; are estimates performed often by the
architects and engineers for the feasibility studies and project cost
9
Page 26
budgeting. Pre-construction design estimate can use one of the following
methods which as well defines its type:
o Unit-Cost Estimate; is a function of the base element considered. A
common unit-cost estimate is the function estimate using square-
foot (or square-meter) unit. The estimate is obtained by multiplying
the historical data of cost per quantifying unit by the number of units
quantified in the new project. Then to apply adjustment factors and
modifiers (RSMeans 2008); e.g. location, inflation, project size
modifier... etc.
o Parameter Estimating; instead of using one parameter (unit-cost
per function) multiple parameters are considered to estimate the
project cost. Historical data allocate lump-sum costs to trades or
components systems, which each of them is linked to one
nciramotor
o Factor Estimating; is used where there is a predominant cost
component. A typical case is process plants where the purchased
equipment constitutes the dominant factor that influence the project
cost.
o Range Estimating; this type of estimate implements the probability
theory to establish a range for the estimated cost, by doing as such,
the uncertain nature of estimate is being taken into consideration.
As well, other information can be made available through this
10
Page 27
method, e.g. critical work packages can be identified to help in the
project control and management.
• Construction estimates; are the estimates performed by the contractor for
bidding and project execution purposes. Basically it is an estimate
prepared using detailed quantity take-off then apply one or the
combination of two methods (Hatpin 1985):
o Unit Pricing; is the result of multiplying the quantity of work to be
performed by historical data records then applying a qualitative
correction factor(s). This method is sufficiently accurate for common
items.
o Resources Enumeration; when there is no historical data available,
the cost is calculated by breaking the work item into subsets and
enumerating the required resources for each item in the subsets.
The sum of each required resource will constitute the cost of thai
work item.
In a traditional context the cost estimate is performed at four major milestones
(updates can still occur during each stage at required intervals) of the project
(Halpin 1985):
• Conceptual Estimate; is an estimate that happens before the initiation of
the design, where very little is known about the project. Thus it relies on a
comprehensive unit; like square foot, or number of seats... etc. and multiply
it by the average obtained from historical data to get a gross estimate of
the project.
11
Page 28
• Preliminary Estimate; as the design process starts more information will
be available. After the termination of the first of two design stages
(preliminary design) another estimate is performed. A common time for
this estimate is at 40% completion of the total design.
• Engineer's Estimate; as the second and final stage of design starts after
preliminary design approval, more and more definitive information will be
available, specification will be determined as well during this stage. At its
completion another estimate will be performed to:
o Insure that the design is within the project budget.
o Establish a reference cost to evaluate the contractors' bids.
• Bid Estimate; using the project final design documentation the contractor
will prepare his estimate, which require a greater level of efforts and much
more man-hour to prepare.
The same milestones are pinned-out by (Peurifoy and Oberlender 2002),
although they approve a different naming:
• Initial estimate; is the estimate prepared after the sponsor's study and
before starting the preliminary engineering.
• Re-estimate; is the estimate prepared after preliminary engineering and
before detailed engineering.
• Re-estimate; is the estimate prepared after detailed engineering and
before procurement.
• Bid-estimate; is the estimate prepared after procurement and before the
start of construction.
12
Page 29
As for the National Institute of Standards and Technology, the cost estimate falls
into two broad categories that depend on the cost breakdown structure instead of
the project phase (Charette and Marshall 1999). However, each category is more
suitable at different project stages:
• Construction product (Trade) estimate; that usually reference the CSI
MasterFormat product classification that was initially developed for
specifications. This breakdown structure is useful for specification
development as well as assigning work packages for subcontractors.
• Elemental estimate; to facilitate design cost analysis and monitoring of
costs from programming phase through the completion of construction
documents. Which uses one or a combination of the following methods:
o Elemental unit rate; is an application of unit-cost method, were the
function is a variant that equals the building elements.
o Assembly Costs; is the add up of multiple assemblies cost to sum
the total cost of an element, then it is divided by the element
quantifying unit to derive a unit rate that can be incorporated in
historical data.
o Component Costs; is similar to assemblies cost except that it
handles the component cost as a lump-sum number for that
component. This approach is most suitable for equipment (e.g. air
handling units)
13
Page 30
2.5. Classes of Cost Estimates
The naming conventions, as mentioned above, is the source of a lot of confusion
(Aaron, et al. 1997), as it describes only a single characteristic of an estimate,
while there is at least four characteristics that need to be addressed to identify an
estimate correctly:
• End use of the estimate; changes from screening to control
• Accuracy range; changes from broad to narrow
• Estimate content and the used information to prepare it; changes from
summary to detailed
• Calculation method; changes from stochastic to deterministic.
These characteristics represent the core of AACE Recommended Practice 17R-
97 (AACE International 1997) to build generic cost estimate classification matrix
("T3KIo 2.1V
In brief, the classification depends on primary characteristic and secondary ones.
The primary characteristic; Level of Project Definition is the percentage of the
completed project definition defined by the set of deliverables for every stage,
which functions, as well, as a driver of the secondary characteristics. It also
dictates the available inputs to the estimating process. Regarding the secondary
characteristics; End Usage is the reason behind performing the estimate; it
defines as well how the estimate is analysed and evaluated. As for the two broad
categories of methodology, a stochastic method feed the estimating algorithm
with value(s), which are not the output of direct quantifying process. In
14
Page 31
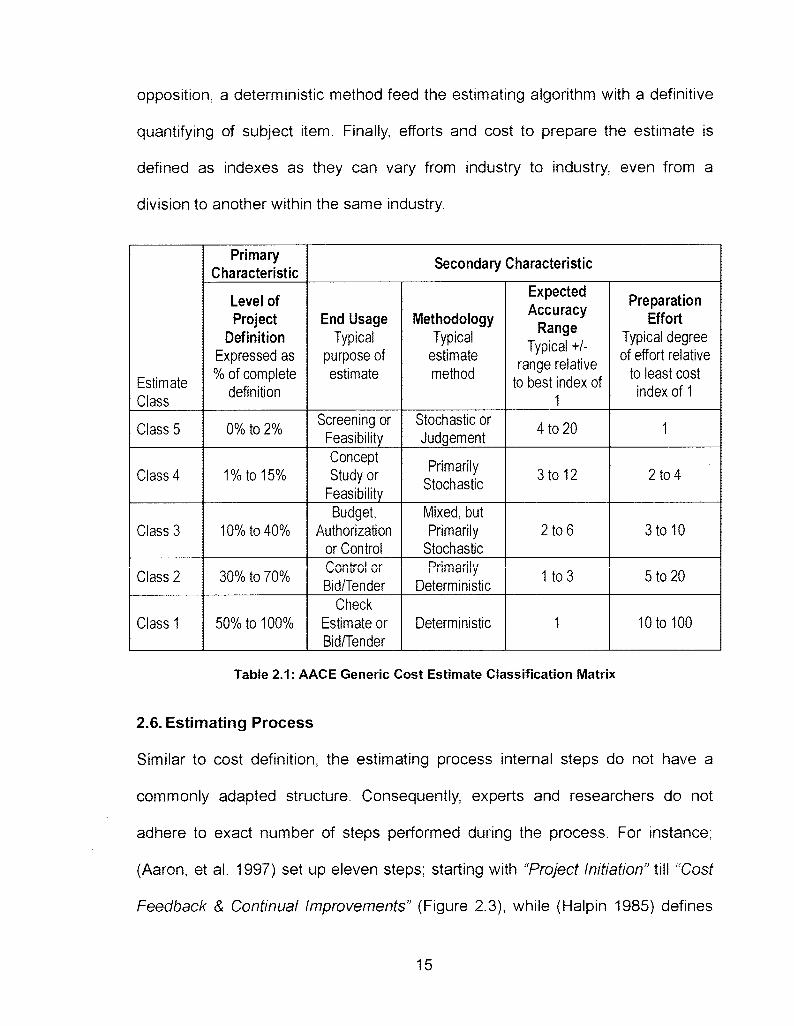
Opposition, a deterministic method feed the estimating algorithm with a definitive
quantifying of subject item. Finally, efforts and cost to prepare the estimate is
defined as indexes as they can vary from industry to industry, even from a
division to another within the same industry.
EstimateClass
PrimaryCharacteristic
Level ofProject
DefinitionExpressed as% of complete
definition
Secondary Characteristic
End UsageTypical
purpose ofestimate
MethodologyTypical
estimatemethod
ExpectedAccuracy
RangeTypical +/-
range relativeto best index of
1
PreparationEffort
Typical degreeof effort relative
to least costindex of 1
Class 5 0% to 2% Screening orFeasibility
Stochastic orJudgement
4 to 20 1
Class 4 1 % to 1 5%ConceptStudy or
FeasibilityPrimarily
Stochastic 3 to 12 2 to 4
Class 3 10% to 40%Budget,
Authorizationor Control
Mixed, butPrimarily
Stochastic2 to 6 3 to 10
Class 2 30% to 70% V-/VJ1 IU Ui Ul
Bid/Tenderf i ? pa? \\y
Deterministic Ito 3 5 to 20
Class 1 50% to 100%Check
Estimate orBid/Tender
Deterministic 10 to 100
Table 2.1: AACE Generic Cost Estimate Classification Matrix
2.6. Estimating Process
Similar to cost definition, the estimating process internal steps do not have a
commonly adapted structure. Consequently, experts and researchers do not
adhere to exact number of steps performed during the process. For instance;
(Aaron, et al. 1997) set up eleven steps; starting with "Project Initiation" till "Cost
Feedback & Continual Improvements" (Figure 2.3), while (Halpin 1985) defines
15
Page 32
the estimating process with eight steps; starting with "Study plans and specs"
ending it with "Revise estimate as required" (Figure 2.4).
1 . ProjectInitiation
2. ScopeDefinition
4. Quantity Take-offand item Description
3. Pre-EstimatingPlanning
Documentation& Checking
7. Summery &Cover Sheets
6. DirectCost Totals
5. DataSources &
9. MgmtReview
10. EstimateIssue & Filing
11. Cost FeedbacksContinual Improvements
End
Start/End Activity Non-Technical step Technical step
Figure 2.3: The 11 Step Cost Estimate Process
g Revise estimate as required
7 Apply judgement factors
g Check extensions
5 Extend and total costs
? Look up & record prices
3 Take-off each account or package
P Break project into packages or estimating accounts
Study plans & specs
Figure 2.4: Steps in Estimate Process
16
Page 33
However, no matter how many steps are defined by various experts and
researchers, the preparation of cost estimate, in any phase of the project, can be
simplified to four steps which belong to two stages (Figure 2.5):
• Data Preparation (Input Stage); this stage is a time consuming process
and consists of two separate sub-processes that depends heavily on the
expertise and knowledge of the estimation team
o WBS; is breaking the project to subsets of items or packages. A
suitable format should be selected depending on the end-use of the
cost estimate.
o Quantity take-off (including materials quantity, labour and
equipment); there are various techniques that are applied during
this sub-process if performed manually, mainly depending on the
item that is being quantified.
o Cost data collection; using the two methods mentioned earlier; unit-
cost based on historical data or resource enumeration. Historical
data can be collected from previously executed projects or obtained
from third parties like manufacturers, subcontractors or database
providers (e.g. RS Means in North America)
• Data Manipulation (output stage);
o Computing; easy parts of cost estimate preparation (although it is
prone to mistakes when done manually). In general it depends on
simple mathematics
17
Page 34
o Classification (cost reports generation); is a time consuming
process, as each item has to be classified and sorted in meaningful
breakdown structure. In others words, it is the way the estimate is
presented. The format of the estimate presentation changes
according to the project phase and to it is audience as well as it is
purpose.
Data Preparation(input Stage)
Data Manipulation(Input Stage)
WBS
End
QuantityTake-Off
Classification &Reporting
Cost DataCollection
Computing
Figure 2.5: Cost Estimate Process
2.7. Different types of Costs
A project cost is not limited to the accumulative sum of costs of the used or spent
resources in placing the elements of construction. Every project has many other
costs that are associated with it directly or indirectly.
• Direct Cost; related to placing construction element and are traceable to a
given project. It includes costs of material, labour and equipment.
• Indirect Costs (Overheads); are various costs other than direct costs, the
included costs vary from project owner(s) point of view to the contractor
point of view:
18
Page 35
o Job Overheads; these are costs that are traceable to a project but
cannot be associated with any specific segment of that project
(Adrian 1993). Job overheads may vary from a project to another,
although many of them are common to every project. From
contractor point of view; it includes, enumerating a few; temporarily
site installations, material storage, interest in case of construction
loan... etc. From project owner(s) point of view, it includes various
fees, to enumerate a few; permit fees, taxes, interest in case of
construction loan, marketing expenses, design team fees and
contractor (subcontractor) profit
o Administrative expenses; these are the costs that support the
production process but is not directly associated with a specific
one. For instance, general marketing expenses, expenses to
maintain the home office... etc.
2.8. Direct Cost
Direct cost of a building projects is affected by main two parameters; bulding
design and materials used (Mohamed and Celik 2002). These two parameters in
adition to the contractor experties in construction methods will determine the
construction process and it is execution. Those parameters must be considered
during the generation of a detailed cost estimate. Shen and Issa divide detailed
cost estimate quantities into two types; product /procurement quantities (PPQ)
that are quantities of the physical design components and estimating process
quantities (PCQ) that are specific to the construction process, while PPQ can be
19
Page 36
considered fixed as long as the design do not change, PCQ varies according to
construction process/construction method to implemented (Shen and Issa,
Quantitative Evaluation of the BIM-Assisted Construction Detailed Cost
Estimates 2010). To further explain how the PCQ can varies for a given design,
an example of an L-shape Cast-in-Place TiIt-UP Concrete Panel with Brick
Veneer is demonstrated below (Figure 2.6 and Table 2.2).
Cast-in-place Tilt-upConcrete Panel
Panel'!" Tum
Area 2
Areal
Form board cannot hold the snap bricks in placeduring the pouring on this vertical surface
Cast-in-Place tilt-up Panel -,-7^)—7·' i /' ' ' ?¦/'/ Casting Bed
SSnap BrickVeneer System
Snap Brick System is laid underneath when panel is poured
(b)
Arno Q
(a)Reveal Panel Joint
V
Area 4StraightPanel Joint
G^
Area 9
Area 10
Area 6 (c) Area 5 Area 8 (d) Area7
Figure 2.6: Three Construction Methods for an L-shape tilt Panel
Source (Shen and Issa 2010)
Depending on the contractor knowledge and expertise this panel will constructed
according to one of the three methods. The selected method will generate
various PCQ for the same design. It should be noted that the PPQ of the brick
20
Page 37
veneer will be equal to summation of Areas of side A and Side B which will be the
same quantity that is independent from the selected construction method.
______Required PCQ Quantities for Calculating Labour Hours of Placing the TiIt-Up Panel
Labour HoursCalculation method
Method 1 (Fig. 2a)Method 2 (Fig. 2a)Method 3 (Fig. 2a)
Apply productionrate for laying brickon the casting bed
Area 2Area 3, 4, and 5Area 8 and 9
Apply production ratefor placing comer
brick on the castingbed
n/aArea 5Area 7
Apply productionrate for placingbrick after the
panel was tilted
Arealn/an/a
Exclude
n/aArea 6Area 10
Table 2.2: Matrix of the construction methods and the corresponding PCQSource (Shen and issa 2010)
2.9. Historical data
Historical data play very important role in cost estimate. It is used in all cost
estimate methods mentioned previously except for resource enumeration.
Historical data has two sources; 3rd parties (e.g. data providers) or frompreviously executed projects. In the latter case, it is an output from applying cost
control functions. More specifically it is one of the outputs of the cost accounting
process (Figure 2.7).
In brief, cost control is the process of monitoring the actual cost of a work item
and compare it with the estimated cost considering the percentage of completion
for the subject item, then if required apply corrective measures. This process
requires logging material quantities as well as equipment and labour hours
associated with the corresponding work item (Adrian 1993).
21
Page 38
Ongoing Project
CashBudgeting Payroll
MaterialScheduling
ProjectPlanning &scheduling
Estimating
Planning
CostControl
Control Accountingreports
ActivityPlanning
Cost DataFiles
Past ProjectNew Project
Figure 2.7: Overview of a Project Management System (Adrian 1993)
2.9.1. Cost Index
Historical data can be out-dated by definition due to multiple factors (e.g.
inflation, changes in labour rates, materials cost... etc.). Therefore, it requires
applying correction factors in order to adjust the cost input making the current
estimate achieve the required level of accuracy.
A cost index provides a comparison of cost changes from year to year for a fixed
quantity of work or service. It can be calculated by applying the following
equation (Adrian 1993):
r=r lui.C r(/r)
Where Cc = present cost in dollars
22
Page 39
C1. = original reference cost in dollars
Ic = Index Value at present time
lr — Index Value at time reference cost was obtained
It should be noted that a variety of indexes available for construction including
those published by Engineering News Record as well as Boeck and Marshal and
Steven Indexes for building projects.
2.10. Work Breakdown Structure
The PMI sees the work break structure (WBS) as a "deliverable-oriented
hierarchy of decomposition of the work to be executed by the project team to
accomplish the project objectives and create the required deliverables, with each
descending level of the WBS representing an increasingly detailed definition of
the project work". The results of the applying WBS is smaller more manageable
components (Project Management Institute 2008). As far as cost estimation is
concerned these smaller components will establish the cost items or the input for
the estimating process.
Typically a detailed cost estimate can range from few hundred lines to multi-
thousands, depending on the project size and complexity. In order to make sense
of this enormous amount of data, it must be classified, grouped and summed into
a format that is comprehensible by the audience. This grouping follows the same
WBS.
23
Page 40
2.10.1. Work Breakdown Structure Formats
CSI / CSC describe three formats for specs documents; MasterFormat,
UniFormat and OmniClass™ (OCCS). UniFormat break the building into
functional elements known as systems and assemblies. Consequently,
UniFormat is employed majorly; in early design of a project, for preliminary
project descriptions, for performance specifying, and, frequently, for cost
estimating. Contrariwise, MasterFormat breaks the same information into groups
of work results based on products and construction practices. As a result,
MasterFormat is used at later design and construction stages of a project, and
throughout the facility lifecycle. On the other hand, OCCS is a multiple tables
system that aims to organize information used by the architectural, engineering,
and construction industry. It is a basis for deriving relational applications,
targeting supporting and empowering the transfer and use of information in the
construction marketplace, in order to serve all participants involved in sustaining
the built environment throughout the entire life cycle of a facility (CSI and CSC
2005).
2.10.1.1. Elemental Work Breakdown Structure (EWBS)
According to American Society for Testing and Materials (ASTM) UniFormat is a
classification framework based on building element (physical parts - called
"systems" and "assemblies") which provides a consistent reference for the
description, economics analysis and management during the different phases of
a project life cycle (Charette and Marshall 1999). UniFormat consists of three
levels (Figure 2.8). However, there are some initiatives to create level 4 (CSI
24
Page 41
uses MasterFormat numbering, and ASTM uses same letters as level 1).but no
standard has been established yet.
- B Shell
« B10 ¦ Bxxj> superstructure Shell catagegoury
» B1010 ¦ B1020 ¦ BxxxxJ> Floor construction Roof construction Shell assemblies
Figure 2.8: UniFormat Structure
2.10.1 .2. Trade Work Breakdown Structure (TWBS)
According to Construction Specifications Institute - CSI and Construction
Specifications Canada - CSC, MasterFormat is a master list which organizes
construction requirements, products and activities into "Section". These sections
are arranged in "Levels" depending on their breadth of coverage. MasterFormat
2004 constitutes of 50 divisions made up of three levels and occasionally level 4
(Figure 2.9). The main purpose of MasterFormat is to organize the project
manual, reference keynotes, specifications and detailed cost estimates.
25
>
Page 42
>cd ¦ 03 Concrete
a>> 03 03 lightweight concrete
roof insulation03 xx cone,related
?CD
CD>CD
03 52 13 composite cone,roof insulation
03 52 13.13 lightweightcellular insulating cone.
03 52 16 lightweightinsulating concrete
03 5213.13 lightweightaggregate insulating cone.
03 xx xx cone,related
03 xx xx. xxcone, realted
Figure 2.9: MasterFormat 2004 Structure
Although MasterFormat is very widely adapted in construction industry in North
America, it is inconvenient for early design stages and/or to compare multiple
design alternatives due to insufficient project definition level and the fact that
preparing a cost estimate based on listing products and materials per item is time
consuming and costly (Charette and Marshall 1999).
2.10.1.3. Relationship between the Formats
According to CSI and CSC, Even though UniFormat and MasterFormat were
designed separately, they evolved to complement each other and not to replace
each other (Figure 2.10), they are connected in a hierarchical relationship (CSI
and CSC 2005).
26
Page 43
UniFormat System for organising specifications information inthe early stages of the project
ProjectManual
Construction documentation using MasterFormat's50 divisions to organise information
Section The construction specifications part of a projectmanual in which SectionFormat is used to organizeeach section into three parts
Page Individual page of specificationsection in which PageFormat is usedto give each consistent appearance
Figure 2.10: Hierarchy of the Formats
PROGRAMSPECIFICATIONS
DESIGNSPECIFICATIONS
TECHNICALPROGRAM
• Performance Specifications(UNIFORMAT™ II)
• Technical Requirements(UNIFORMAT™ II)
SCHEMATIC DESIGN• Preliminary Project Description (PPD)
(UNIFORMAT™ II)
DESIGN DEVELOPMENT• Outline Specifications
(MasterFormat™ 95)
CONSTRUCTION DOCUMENTS• Construction Specifications
(MasterFormat™ 95)
Figure 2.11: Program and Design Specifications
27
Page 44
This complementary nature is reflected clearly in common practice during various
phases of the project, where Uniformat is used in early stages of the project and
the WBS is switched to MasterFormat during Design Development (Charette and
Marshall 1999) and used through the Construction Documents and the project
execution (Figure 2.11).
DesignUniFormatLevel 2 Level 3
o
Oo
FEcd
'5crF1
"2CD
CD _O W
CM£2-
OT3
CD
S"5>
OOCO
_£2_
ti-eroCOTO
¡Ê * ^— CD-s E8 ?
£2.
coooQco.Ca-
coCD
COC=
? <3f =3 bQ- CT =3
CO UJ t-LCD t— CM
Ef
coC3>CZ>~f>c:oO
co?fQ.
COco "3- tn
o_?UJCD
01 Foundation
02 Substructure
03 Superstructure
04 Ext. Closure
05 Roofing06 Int. Const.
07 Conveying Systems08 Mechanical
09 Electrical
10 Gen. Cond. OH&P11 Equipment
1 2 Sitework
011 Standard Foundations012 Spec Foundation Cond.021 Slab On Grade022 Basement Excavations023 Basement Walls031 Floor Construction032 Roof Construction033 Stair Construction041 Exterior Walls042 Ext. Doors & Windows
061 Partitions062 Interior Finishes063 Specialities
081 Plumping082 H. V.A.C083 Fire Protection084 Spec. Mech. Systems091 Services & Distribution092 Lighting & Power093 Spec. Elee. Systems
111 Fixed & Movable Equip.112 Furnishing113 Special Construction121 Site Preperation122 Site Improvement123 Site Utilities124 Off-Site Work
Table 2.3: Relationship of UniFormat to Master Format(The American Institute of Architects - AIA 1984)
28
Page 45
However, the transit process between the formats is not documented nor
covered in the literature neither a systematic method of performing this transition
has been established. On the other hand, a generic mapping grid has been
established by the American Institute of Architects (AIA) that maps the Uniformat
Levels to Construction UCI, which was superseded by MasterFormat 1995
(Table 2.3). This table has been updated and extended by Lewis R. McClain to
cover MasterFormat 2004 (McClain 2007) and is included as appendix C.
2.10.2. OmniClass
OmniClass (OCCS) is a new standard that aims to provide comprehensive
classification for the entire built environment (OmniClass - Introduction and
User's Guide 2006). It consists of fifteen interrelated tables as of edition 1 , 28-03-
2006 release, these tables map to the suggested tables in Section 4 of ISO
12006-2. Each table can be used independently to classify a particular type of
information, or entries on it can be combined with entries on other tables to
classify more complex subjects. The information in each table is organized and
based on a specific aspect or view of the total information that exists in the built
environment.
OmniClass is a much broader classification system then MasterFormat 2004 and
UniFormat. It attempts to classify the whole built environment. However it has
two tables based on these classification systems;
29
Page 46
• MasterFormat 2004 serving to inform Table 22 (Work Results) of the
OmniClass Construction Classification System - OCCS (OmniClass -
Introduction and User's Guide 2006).
• UniFormat is undergoing revisions by CSI and CSC, when the new
version will become available it will serve as the source for Table 21
(Elements) of the OmniClass Construction Classification System (OCCS),
similar to the current relationship between MasterFormat and Table 22
(OmniClass - Introduction and User's Guide 2006).
The tables that concern the research the most is Table 21 and Table 22. As of
edition 1, 28-03-2006 release, the status of Table 21 is Conditional Draft. The
OCCS Development Committee is waiting for the new release of UniFormat to
finalise its release. On the other hand, table 22 status is released. These two
tables are based on, and serve UniFormat and MasterFormat respectively.
The structure of OmniClass tables is similar to UniFormat and MasterFormat, as
it is a hierarchical tree structure with five levels as illustrated in (Figure 2.12).
To maximize compatibility of OmniClass with existing classification systems, as
well as to ease the migration process, the OCCS Development Committee
adopted a guiding principle to "Utilize existing systems and compatible initiatives
to avoid duplication of effort." these include; Uniclass, MasterFormat™ ,
UniFormat™, EPIC (Electronic Product Information Cooperation), Portions of a
few tables published by ASTM International, Selected resources provided by the
30
Page 47
U.S. General Services Administration (GSA), U.S. Army Corps of Engineers, the
International Code Council (ICC).
> ¦ Table: 21 Elements (Type of classification)
>CD
21-4100 00 00Structure
21- xxxxxxxx
?>?
21-41 1100 00Substructure
21-413100 00Superstructure & Enclosure
21-41 xxxxxx
CD>
21-41 11 1100Foundation
21-41 11 15 00Basement
?>?
21-41 11 11 11Shallow Foundation
21-41 11 11 11Deep Foundation
21-41 11 15 11Subgrade walls
Figure 2.12: OmniClass Structure
2.11. Summary
This chapter covered a literature review of cost estimate in construction, in terms
of definitions, classes, categories, types and methods, and it is role in project
management, its uses as well as its breakdown structures. The key findings of
this chapter are:
Although some experts define two sets of estimates, approximate and
detailed (Peurifoy and Oberlender 2002, Jrade 2000) the estimate
31
Page 48
accuracy is never known until the end of execution of the project, that
springs from the nature and definition of the estimation process as there is
always unknown factors in every project. Hence, even in detailed
estimates there is the contingency allowance, which aims at addressing
the project uncertainties and risks.
• Traditionally and in today practice, cost estimates happen at milestones of
the project, leaving gaps in between those milestones where the cost is
not under full monitoring due to the effort/cost required to prepare them in
addition to the used methodologies. Therefore, in some cases the
estimated cost can jump out of the project budget, while it was in good
standing in the previous stage.
• Trade or work result breakdown structure MasterFormat is the most
commonly used in North America (Wirahadikusumah 2007) is widely used
among architects and engineers as it heips them to control the
specification of the project. However, with more emphasis is placed on
controlling the project cost during the design phases this breakdown
structure falls short on achieving its objective (Charette and Marshall
1999).
• Elemental based breakdown structure (e.g. UniFormat) can be an
extremely useful during design phases, as it offers architects and
engineers a set of analytical views that starts from the programming phase
through the completion of construction documentation. On the other hand,
starting from the bidding phase till the completion of construction a trade
32
Page 49
(product) breakdown structure is ¡ndispensible and elemental breakdown
structure is of little use apart from providing historical data for next
projects.
• UniFormat consist of three levels, which become insufficient when more
detailed specifications are needed to be assigned to project elements. Yet,there is no established standard that addresses this issue.
• OmniClass (OCCS) is an ambitious standard the aims to provides
comprehensive classification for the entire built environment
33
Page 50
CHAPTER 3
Computers in Cost Estimation
3.1. Introduction
Construction industry represent in no way an exception to the fast growth of
computer utilization. Hardware and Software packages have been developed to
target specific tasks or multiple tasks as standalone solutions or in an integrated
environment. Design, Drafting, planning and scheduling, management and cost
estimation is few examples where the computers has become a standard tool
that is used by architects, draft persons, structural engineers, planners,
managers, cost estimators... etc. computers has introduced modern technology to
the construction industry (Jrade 2000). However, the industry and people
response rate to the advancements of computer technologies remains much
slower, making construction a slowly changing industry (Haward 1998).
3.2. Computers in Building Design
Articles about computer-aided design can be traced all the way back to the
sixties. More than twenty years before the spread of the personal computers. An
article titled "Computer-Aided Design and Automated Drawings" appeared in
Architectural Record October 1965 issue (Haward 1998).
Since then computers had transformed the construction industry and the parties
involved in it. Drafting boards were replaced by personal computer stations, hand
filled tables were replaced with spreadsheets application, manually drawn Gantt
34
Page 51
Charts had transformed into electronic and interactive ones, huge archives of
piles of documents and accounting invoices were wiped by databases and
electronic documents that fits on one disk... and so on, so forth. The common
dominator of all these applications is the ease of retrieving historical data as well
as reusing it to generate new documents, but most importantly is the ease of
modification, saving a tremendous amount of man-hours in every project. The
increased productivity allowed architects, engineers, project managers and other
parties involved in the process to venture more design alternatives, optimize their
tasks outputs. Conversely the industry response was tighter deadlines, more
documentation of projects was required and higher performances from the
buildings were expected leaving the pressure sustained if not increased.
3.2.1. Computer-Aided Design (CAD)
CAD software ware developed relatively early to help with engineering tasks,
starting with early computers. Though CAD stands for Computer Aided Design,
the vast majority of CAD implementations are limited to alleviate the pressure of
repetitive tasks like drafting, calculation... etc. rather than actual design, due the
rapidly changing IT counterweighted by a much slower pace of the change in the
construction industry mentality. In other words the construction industry has
adapted new tools rather than new approaches (Haward 1998).
CAD as term can be interpreted in two ways; generic, for instance using a
spreadsheet application to perform engineering calculation is an implementation
of CAD. However, in construction industry realm, the term commonly refers more
specifically to drafting software that is used to produce drawings.
35
Page 52
CAD drawings in its essence is a collection of 2D shapes, and generic 3D solids
and/or meshes, when 3D is supported, stored along with different properties, like
color, height, width as well as many others. Moreover, those elements are stored
without any relational interdependences; thus in its totality, they are merely a
visual representation of project plans, sections, elevations... etc., without any
actual significance outside the human mind (Figure 3.1).
^ IWiWIMBMiMMMMMMl I I I I Il Il I III tai«kji
Figure 3.1: 2D CAD Drawing in AutoCAD 2009
As far as CAD market is concerned, it is dominated by AutoCAD from AutoDesk
and Microstation by Bently at this research time. Those packages appeared more
than twenty years ago. They have been under development since then. More
features, faster performance with more automation of minor repetitive tasks are
injected in every new version benefiting from the growing computing power of the
underlying hardware.
36
Page 53
3.2.2. Building Information Modeling (BIM)
Once the construction industry started to absorb the potentials of the electronic
medium along with the communication revolution that took place side by side
with advancements of programming technologies and hardware, a new breed of
software started to appear to address the growing needs of architects and
engineers to close the gaps that were not filled by typical CAD software. This
type of software is object oriented and tailored to the needs of the engineering
discipline that it serves. For instance in the domain of construction, instead of
having collection of shapes and generic geometry, a database of objects is
developed containing real world objects; walls, doors, pipes, ducts, columns,
circuits... etc. depending on the software field of speciality. In building
construction, these software packages are commonly known as Building
Information Modelling (BIM).
The underlying concept of BIM is, instead of having a collection of unlinked
shapes presented over unlinked series of drawing, The user will built a virtual
model of the building with interdependent real-life like objects. Then all the
drawings will be generated automatically as "views" of this model by cutting the
model vertically, horizontally or both at any desired points (Figure 3.2).
One of the first commercial software widely used by architects is ArchiCAD by
Garphisoft. Later on, some developers, CAD companies and researchers started
to develop BIM solutions as vertical expansion of existing CAD packages with
open architecture and 3D support (Mainly AutoCAD and Microstation). AutoCAD
Architecture, AutoCAD Electrical and AutoCAD Mechanical (developed by
37
Page 54
AutoDesk with AutoCAD being the underlying engine) are just a few to mention.
However, in recent years a very powerful BIM package appeared under the
commercial name "Revit" that was originally developed by a German company
which was acquired by AutoDesk. With the huge market share of AutoDesk, the
unique features of Revit, and 3rd parties plug-ins that extend Revit functionality ithas become one of the industry standards for BIM solution.
Figure 3.2: Architectural BIM Model in Revit
3.2.3. BIM vs. CAD
Building Information Modelling (BIM) differs from CAD programs majorly in two
points:
BIM software is object oriented. That means its objects based on real
world building elements like walls, windows, doors.... etc. on the other
38
Page 55
hand CAD software is shape based, so its objects are lines, arcs,
circles... etc.
• BIM software maintains relationships between objects, for example a floor
slab is connected to supporting wall. Thus if the wall moved the slab will
extend itself to maintain its relationship to the wall.
Since BIM is object oriented, it provide a more robust framework to perform
engineering task that are extremely complex from a traditional CAD software
point of view. For example, collision detection; to check if there are spatial
intersections between ducts and other objects. Or, advise the user if there is a
wall intersection with a window. As well it allows for unprecedented level of
coordination between different disciplines during the various design phases,
allowing architects and engineers to produce a much more precise
documentation of the project with much less errors (Figure 3.3).
Beyond that BIM software nature lays the foundation for integrated design
processes and project management processes. In the following example (Figure
3.4) BIM was used to illustrate the construction sequencing for a residential unit.
Each step these sequences are able to produce the corresponding construction
documentation, all from the same model, with minimal user interference.
On top of the mentioned above, the object oriented nature of BIM software holds
within it the capacity to export quantity take-off accurately (depending on the
model robustness) and without any extra efforts or input from the user.
39
Page 56
G1.
G?
Figure 3.3: Coordinating different disciplinary models.(Source: AEC Bytes, www.aecbytes.com, © M.A. Mortenson Company)
HL ^ ¦¦¦'¦· ¿r%***
y-* y^ yFigure 3.4: Sequencing Schedule for Onsite Assembly of Loblolly House.(Source: AEC Bytes, www.aecbytes.com, © KieranTimberlake Associates)
40
Page 57
3.3. Computer in Cost Estimations
Similar to the exploitations of computers in design and drafting, traces of
exploiting them in cost estimating tasks appeared in the sixties with an article
titled "Computerized Cost Estimating" published in Architectural Record March
1967 issue (Haward 1998). Since then, the advancements made in computer
hardware and software have greatly helped architects, engineers and cost
estimators in measuring, counting and organising the data required to built the
cost estimate reports, as well as perform the lengthy repetitive mathematical
operations to build such reports. Among the possible uses of computer in
estimating according to (Peurifoy and Oberlender 2002) are:
• Maintaining master checklists
• Maintaining an inventory of subcontractors, vendors, and suppliers
• Maintaining bidding records of competitive bidders
• Performing material quantity take-offs
• Storing and retrieving historical cost data
• Storing and retrieving labour and equipment productivity
• Establishing codes for labour and equipment resources
• Extending prices and summarizing costs at various levels
• Distributing overhead and costs
• Analyzing risk and assessing contingency for mark-up
• Preparing and delivering the bid or proposal in electronic form
• Sharing of cost data and information within office or company
41
Page 58
The development of digitizers helped greatly in decreasing the amount of the
time required to obtain the measurements and the required dimension. The
availability of cost databases and the development of electronic drawings, which
has become a standard in the industry, offer a wealth of information that can be
used to help estimate the construction cost (Tong 2005).
On the other hand the recent development in computer software represented by
BIM promote a big impact on the methods used and the quality / accuracy of the
performance of cost estimators (Shen and Issa, Quantitative Evaluation of the
BIM-Assisted Construction Detailed Cost Estimates 2010)
Nevertheless computers cannot replace estimators (Eastman, et al. 2008), as
they asses and evaluate project specific conditions that impact cost, like a
special slab conditions or scheduling and productivity issues... etc..
3.3.1. Computers Aided Quantity Take-Off
Use of computers in quantity take-off was pioneered by Monk & Dunstone in
U.K., a paper by David Smart was presented in the QS general meeting of the
Royal Institution of Charted Surveyors (RICS) in 1961 (Haward 1998). Since then
the IT industry has come a long way with many commercial packages that offers
advances and sophisticated tools to help in the task of quantity take-off. The
computer aided quantity take off has the advantages to reduce the amount of
mistakes, reduce the time if the task was performed manually, consequently,
reducing the cost of the project overheads (Tong 2005).
42
Page 59
3.3.1.1. 2D Based Quantity take-off
2D quantity take-off relies on creating computerized measuring tools to trace
printed plans (using a digitizer) or electronic 2D drawings. Then the user has to
input the 3rd dimension as well as other information like material and variousproperties. This extra input depends on the user judgement as well as his
understanding of the project. Many commercial software solutions are available
for this end. For research purposes a 2D quantity take-off software package
called Izon-MTO developed by ArchiData has been examined.
tzon-MTO
Izone-MTO is a 2D based quantity take-off system that relies on creating four
types of generic AutoCAD objects depending on the nature of the item being
quantified (ArchiData n.d.). These are; Point, Linear, Surface and Volume.
Point Linear
IzoneMTO
Surface Volume
CD O
? S
CDo
mCDo
QJ =3"
O 03QJ —
>O
SfOETQJ
co
Q)
CDO
QJ
OQJ
CDO
OQJ
3 ^
S" : 3Q)
CDO
Q)
OQ)
mCDO
OQ)
>O
CDO
CO^"OET—?Q)
CDOZTQ)=3o'Q)
mCDO
OQ)
Figure 3.5: Izone-MTO objects (source: ArchiData)
Since these are generic objects, in themselves, they don't carry any significance.
Hence the system relies on the user input to associate them with meaningful
items. The ambiguity of these objects can be seen very clearly in (Figure 3.5) as
43
Page 60
the same objects serve all disciplines, and they gain their meaning only from the
associated UniFormat code.
These objects are assigned special attributes in order to identify them and link
them to a database engine. Further the system requires from the user to allocate
these objects within "Zones", which can be nested, in order to be able to
construct the data structure (Figure 3.6).
CAD Drawings Database
7 Object I Group | Item | ErrorObject I Group | Item | Error
Object Object | Group | Item | Error
Data
Group I Item | Field | FieldGroup I Item | Field j FieldGroup j Item | Field j FieldDefinition
Figure 3.6: Izon-MTO Zonning (ArchiData n.d.)
As a conclusion, Izone-MTO provides a set of very advanced tools for 2D based
quantity take-off. However, it remains as a semi-automated system that requires
tremendous user input (for the 3rd dimension as well as many other parameters)that has to be repeated for every single item. Therefore quantity take-off process
stays as time consuming task.
3.3.1.2. 3D Modeling Based Quantity take-off
A 3D based quantity take-off differs conceptually from the 2D based systems
(Figure 3.7). In the 3D systems the building elements are already defined as real-44
Page 61
life objects. The modeling process takes place based on the 2D drawings or by
starting from scratch during the design phase.
Estimators can benefit from such a system to respond rapidly to changes in
critical phases of the project, a challenge they face on daily bases (Eastman, et
al. 2008). As these systems have all elements quantified with high accuracy.
Therefore, the user input during the quantity take-off process is minimal or none
depending on the system features, structure and capacity.
An excellent example of this type of systems is a research titled "A 3D Modeling
for Detailed Quantity Take-Off for Building Projects" (Tong 2005) has been
examined as a case study for this research
2D
paper drawingsfrom design/engineering
H-r*Manual takeoff
and manualcheck for
Traditional paper-based estimating
3D/BIM-basedestimating procès^
3D/BIMmodels
from
Extract quantitieswithin BIM tool
Manually extractquantities with
specialized take-off / estimatine:
Estimating SoftwareManually associatetake-off info, with
assembly items
Associate digitizedtake-off info, with
componentassemblies
Associate with
assembly items
Manual link, changes must beupdated by estimator
?;«1*t? lint- ?^pp?? nnii^ûH
automatically
Costdatabas
e
Auto-extract andassociate with
assembly items
?Calculation of
additional
quantities item
?Estimât
e
Supplier/
subcontr
Figure 3.7: Conceptual diagram of BIM quantity take-off and estimating process.
Source (Eastman, et al. 2008)
45
Page 62
B. Tong system architecture is quiet simple; conceptually, it relies on linking a
database of building elements to AutoCAD where these elements acquire their
physical properties. Then AutoCAD will feed the database with the elements
dimensions, which will be used to generate the quantity-take off (Figure 3.8). The
output of this system is a set of tables detailing the quantities (Figure 3.9).
However the results have to be processed further and associated with cost data
in order to create cost estimates.
Project Drawings
Project Database
Floor TableBeam TableConcreteWall TableNonConcreteWall TableSlab TableDoor TableWindow Table
?.?.?? ? ???/ /inMUlU^MU ¿UUt OU
Modelling
Data Export
Figure 3.8: Architecture of Proposed Model (Tong 2005)
46
Page 63
Wl ( « i «4 ?*·*»
4 **<ÏM.».«W) ¦ Kfc^^miftJ 1 lurg^im t j mjMi»<l<m?tJlor»n»<*fc |f«J<«\?}] .^ *) ; » Wv <*·t?»»·?· »-»-* I n "TfOWe-AtJJVt j fWfw-Îjl
6 t'6
Figure 3.9: Output Table of Beams (Tong 2005)
3.3,2. Computers and Cost Estimation Reports
Today, the computer is the most often used tool by estimators, as it helps them to
avoid the drudgery of the repetitive tasks and helps them to focus on alternative
construction methods or assess productivity. Consequently, providing better
estimates and freeing time to perform optimization.
There are two main types of computer aided estimating software (Tong 2005)
that will be reviewed here below:
3.3.2.1. Spreadsheets based software
In the case of spreadsheets, the computer duplicates the manually filled tables
and forms but it adds the functionality of automatically performing the calculation
(Figure 3.10).
47
Page 64
1
23
4 Item5 Install foundations
6 Build Structure
Summary of Costs for Bids
Labour
$2,000.00?$4,000.00=
Material
$0.00$7,000.00
D
Equipement$3,000.00$2.000.00
Total
$5,000.00$13,000.00
7 Finish work
8 Clean up and move off$3,000.00>$1,000.00!
$4,000.00$1,000.00
$1,000.00$2,000.00
$8,000.00$4,000.00
9 Direct Cost totals
10 Overhead
11 Contingency12 Profit13 Total bid
$10,000.00; $12,000.00 $8,000.00
I-
$30,000.00S2.400.00
$500.00$3,290.00$6,190.00
Figure 3.10: Simple spreadsheet of bid summary (Peurifoy and Oberlender 2002)
Since the computer outweighs human performance with a calculator significantly,
spreadsheet has become a standard solution in cost estimate preparation.
Implementing spreadsheets helps omitting the arithmetical errors, which one of
the five most common errors (Halpin 1985), however it remains as an interim
step between paper and pencil, and a computer estimating solution as well as an
extremely limited solution of multi-user environment (Peurifoy and Oberlender
2002).
3.3.2.2. Off-the-shelf solutions
The off-shelf solutions usually provides more functionality than spreadsheets,
including but not limited to; forecasts, cost tracking, accounting and financial
reports, reduction of data entry burden as well as often providing the support for
multi-user environment. Hence, they help to reduce transposition mistakes in
copying or transferring figures.
48
Page 65
As the nature of construction projects differs, we find that specialized estimating
software tend to cover the following topics (Peurifoy and Oberlender 2002):
• Residential construction
• Building construction
• Infrastructure (heavy/highway) construction
• Specific trades, such as electrical and mechanical
• Take-off systems, sometimes with estimating modules
However, few attempts have been made to integrate cost estimation solutions
with quantity take-off software, and no framework has been established for such
integration.
3.4. Potentials of Electronic Document
In the past decade the software companies started to shift towards integration
and interoperability as the market needs has grown up beyond the primary
transition toward electronic documents (Hammad 2008).
To address the issue of interoperability as a mean to integrate the various
applications into a smooth and efficient workflow many standards have been
founded. One of the promising and growing in steady steps is Industry
Foundation Classes (IFC). The IFC model is a neutral and open specification. It
is an object oriented file format with a data model developed by the International
Alliance for Interoperability (IAI) that allows different software to communicate
between them as well as to carry properties and relations beyond the geometrical
representations of traditional CAD document. Consequently we find that IFC has49
Page 66
been widely adopted by BIM developers. The IFC model architecture is based on
four layers architecture, and it is developed in way to accommodate the various
domains and applications of the construction industry.
3.5. Summary
The advents of IT in the last two decades have laid the path for many
transformations in the practice of the construction industry. Starting with
simulating the manual process, to develop new ways of thinking that emerged in
consequence to the growing power and increasing popularity of personal
computers. Software for construction application targeted all the various tasks
and requirements of the practice, however, the industry itself adapts much slower
than the rapidly changing pace of information technology. The key benefits of
using computers are (Rivard 2000):
• Increase in the quality of documents
• Speed up the process to obtain desired results.
• Decrease in the number of mistakes in documentation
• Ease of modifications, exploring alternatives or applying value engineering
• Alleviate the burden of manual work allowing the practice to address more
important issues.
• Allowing a much higher level of coordination between different disciplines.
This chapter and chapter two established the ground on which this research will
base the methodology and the proposed model as presented in chapter 4 and 5.
50
Page 67
CHAPTER 4
Methodology
4.1. Introduction
Previous chapters covered cost estimate as presented in the literature, as well,
the current state and trends of using computers in cost estimating. This chapter
will present the process followed to develop the proposed model for "Integrated
Cost Budgeting and Cost Estimation Model for Building Projects" as well as the
implemented method in order to achieve the research fore set objectives.
The model development cycle implemented the iterative and incremental model
(Figure 4.1). The present chapter will cover; planning, requirements, analysis and
design. Afterwards, Chapter 5 will cover implementation, followed by chapter 6
that will present a case study as a testing and validation. Finally, chapter 7 will
present the evaluation.
Requirements Analyse & Design
- Implementation
1
Deployment
3
4 Testing
Figure 4.1: Model Development Cycle
Initial Planning
Planning
Evaluation
51
Page 68
4.2. Requirements
In order to be practical and establish a base for future expansions, the proposed
model must be designed to meet the actual needs of cost estimate process. In
Addition, it has to respond to the following requirements:
• Efficiency; the system should be able to process large projects in a timely
manner.
• User friendly; the user has to be presented with a logical and easy to use
interface as well as an easy to understand cost estimate reports.
• Flexible; the system should be able to accommodate inputs from various
data sources as well as it should rely on hard-coded solutions only when
the technology provides no other choice; to allow modifications and
revision of the system.
• Modular; to allow for future expansions and interoperability with other
systems.
4.3. Analysis and Design
The analysis phase is represented by restudying the estimating process from
input / output perspective, as well as conducting detailed study of the mapping
process of Elemental Work Breakdown Structure (EWBS) to Trade based Work
Breakdown Structure (TWBS) and finalized by a quick review of Relational
Database (RDB) as well as its Management System (RDBMS) along with
AutoDesk Revit Data structure.
52
Page 69
On the other hand, the design phase put in place the various blocks required to
construct the targeted cost estimating model.
4.3.1. Estimating Process
Chapter 2 had covered cost estimating process in a detailed manner. However,
In order to streamline the estimating process, it must be analyzed and studied in
terms of inputs, outputs and controls.
To perform a cost estimate two inputs are required; project design that will define
the scope of work to be performed and cost data for the unit of work to be
performed. To properly define the scope of work an appropriate WBS must be
selected and applied to the project design, the smaller components that result
from applying the WBS control and guide the quantity take-off process. The
generated bill of quantities (B. O. Q) will function as a control to the cost data
lookup process, to determine the applicable inputs (Figure 4.2).
WBS
L
ProjectDesign
CostData
Input
QuantityTake-Off
Cost DataLook-up
Calculate
~1Group &Classify
Process
CostEstimate
Output
Figure 4.2: Cost Estimating Process
53
Page 70
The next step is to perform the calculations using the B. O. Q with the selected
cost data. And finally group and classify the results of the calculation process to
obtain the output that is the cost estimate. The grouping and classification
process is controlled by the selected WBS as well.
4.3.2. Elemental Cost Estimate
Elemental unit rate cost estimation depends on a simple concept; components
that are commonly encountered in the construction are viewed as estimating
group (Halpin 1985). This approach helps saving time due to the grouping nature
of assemblies; instead of quantifying each component, the surveyors account the
iterations of the assembly (that consist of PPQ and PCQ) as well can be used at
early stages of the project were many pieces of the project information is still
unavailable.
CSI / CSC focus on that elemental cost estimate is very useful during design
phases for value engineering endeavours as it provide an excellent analytical
views of cost data and budget distribution allowing AEC to fine tune the project
(CSI and CSC 2005)
54
Page 71
Construction systemsJob overhead
01.010
Site Drainage02.040
Masonry04.010
Dry Wall09.050
Concrete footing03.010
Unit price catalogue
153.00
331.20
421.00
Labourproductivityand payrates
Materialunit prices
Constructionsystemnumber,dimensions,andspecificationsselection
Dimensions FormulasResources
Construction estimating system forthe IBM systems
QuantitySurvey
Estimate /editcorrection Changes
Miscellaneous items
StartEstimator
Figure 4.3: Work Package (Elemental) Concept (Halpin 1985)
Careful examination of the elemental cost estimate reveals many advantages
that promote its adaptation. These include, but not limited to; Elements or
assemblies have imbedded within their data; PCQ (i.e. wall sanding), temporary
installation (i.e. concrete form works) and minor items in the PPQ (i.e. wood
beam connectors). This information can be extracted from the assembly and
used to generate other VVBS based estimate.
55
Page 72
4.3.3. Mapping Elemental WBS to Trade WBS
Chapter 2 examined briefly EWBS and TWBS represented by UniFormat and
MasterFormat 2004 respectively. As well, it covered the relationship that governs
them, along with their purposes and uses.
To further explore that relationship and the mapping process, two examples will
be presented to understand thoroughly the mapping process and to appreciate
the advantages of using EWBS system over TWBS system to build an Integrated
Cost Budgeting and Cost Estimation Model for Building Projects.
First example studies a composite assembly of external wall, adapted from RS
Means Assemblies Cost Data Book 2008, made of brick veneer with wood studs
backing (Table 4.1) to demonstrate how the assembly components are mapped
to the various corresponding divisions in MasterFormat 2004. The results of the
mapping process show how a single assembly will have its components get
separated over multiple divisions of MasterFormat (Table 4.2).
Alternatively the second example, examines two different simple assemblies,
containing materials and work activity in the same MasterFormat 2004 division,
to demonstrate how their components add up under the same MasterFormat
Division. The first is a flooring assembly (one way beam and slab structure) and
the second is basement reinforced concrete wall (Table 4.3 and Table 4.4). The
analysis of the mapping results (Table 4.5) exhibits that it is not possible to
reverse the mapping process to convert TWBS to EWBS without extending the
TWBS data with information about the originating EWBS.
56
Page 73
UniFormat MasterSystem Components Cost Per S. F. Format
__________________________________Qty Unit Mat. Inst. Tot. 2004System B2010 129 1100Standard Brick Veneer, 2"x4" Stud Backup @ 16" O.C., Running BondWash smooth brick 1.000 S.F. 0.04 0.85 0.89 04 0120.52Wall ties, corrugated, 7/8"x7", 22 0.003 Ea. 0.02 0.14 0.16 04 0519.16gaugeStandard brick wall, 4" thick, running 1.000 S.F. 5.95 9.90 15.85 04 2113.13bondFlashing, copper, paper-backed 0.010 S.F. 0.10 0.31 0.41 04 2319.16Shelf angle 1.000 Lb. 0.93 0.87 1.80 0512 23Wood stud partition, backup, 2" ? 4" @ 1 .000 S.F. 0.41 0.95 1 .36 06 11 1616" O.C.Sheathing, plywood, CDX, 1/2" 1.000 S.F. 0.57 0.68 1.25 0616 53Fiberglass insulation, batts, 3-1/2" thick 1.000 S.F. 0.61 0.35 0.96 07 2113.16paper backingJoint backer rod 0.100 L.F. 0.10 0.10 07 9123Sealant 0.100 LF. 0.02 0.26 0.28 07 9213
____________________________Total 4.64 13.62 18.26Table 4.1: Mapping Composite Assembly to MasterFormat 2004
(adapted from RS Meams Assemblies Cost Data Book 2008)
MasterFormat 2004Cost Per S.F.
04 MasonryQty Unit Mat. Inst. Total
04 0120.52 Unit Masonry Cleaning 1,000 S.F. 0.04 0.85 0.8904 0519.16 Masonry Anchors 0.003 Ea. 0.02 0.14 0.1604 2113.13 Brick Veneer Masonry 1.000 S.F. 5.95 9.90 15.8504 2319.16 Masonry Embedded Flashing 0.010 S.F. 0.10 0.31 0.41
05 Metals0512 23 Structural Steel for Buildings 1.000 Lb. 0.93 0.87 1.80
06 Wood, Plastics & Composites061116 Mechanically Graded Lumber 1.000 S.F. 0.41 0.95 1.360616 53 Moisture-Resistant Sheathing 1.000 S.F. 0.57 0.68 1.25
Board
07 Thermal & Moisture Protection07 9123 Backer Rods 1.000 S.F. 0.61 0.35 0.9607 9213 Bastamene Joint Sealants 0.100 L.F. 0.10 0.1007 2113.16 Fibrous Board Insulation 0.100 L.F. 0.02 0.26 0.28
Table 4.2: Results of Mapping a Composite Assembly to MasterFormat 2004
57
Page 74
UniFormat MasterSystem Components Cost Per S. F. FormatQty Unit Mat. Inst. Total 2004
System B2010 101 2100Cone, wall, reinforced, 8' high, 6" thick, plain finish, 3000 psiForms In Place, wall, job built plyform 2.000 SFCA 2.20 11.0 13.20 031113to 8', 4 usesReinforcing in place, walls, #3 to #7 0.752 Lb. 0.40 0.29 0.69 03 2216Concrete Ready mix, regular Weight 0.018 CY. 1.98 1.98 03 31133000 psiPlace and vibrate concrete, wall 6" 0.018 CY. 0.73 0.73thick, pumpFinish wall, break ties, patch void 2.000 S.F. 0.06 1.60 1.66Total 4.64 13.62 18.26
Table 4.3: Mapping Simple Assembly to MasterFormat 2004 (Example 1)(adapted from RS Meams Assemblies Cost Data Book 2008)
UniFormat MasterSystem Components Cost Per S.F. FormatQty Unit Mat. Inst. Total
2004
System B1010 219 3000BM. & Slab One way 15'x15' Bay, 40 PSF S.Load, 12" Min. Col.Forms In Place, Flat Plate to 15' 0.858 S.F. 1.34 4.25 5.59 031113High, 4 usesForm in place, exterior spandrel, 12" 0.142 SFCA 0.18 1.27 1.45 031113wide, 4 usesForm in place, interior beam. 12" 0.306 SFCA 0.46 2.25 2.71 031113wide, 4 usesReinforcing in place, elevated slabs 1.600 Lb. 0.85 0.62 1.47 03 2216#4 to #7Concrete Ready mix, regular Weight 0.410 CF. 1.67 1.67 03 31133000 psiPlace and vibrate concrete, elevated 0.410 CF. 0.56 0.56slab less than 6", pumpCure with sprayed membrane curing 0.010 C.S.F 0.05 0.08 0.13 03 39 23.13compound
Total 4.64 13.62 18.26
Table 4.4: Mapping Simple Assembly to MasterFormat 2004 (Example 2)
58
Page 75
MasterFormat 2004Cost Per S.F.
Qty Unit Mat. Inst. Total03 Concrete031113 Structural Cast-in-Place Concrete 2.858 SFCA 2.20 11.0 13.20
Forming0315XX Concrete Accessories 0.142 SFCA 0.18 1.27 1.4503 2216 Epoxy-Coated Reinforcing Steel 2.352 Lb. 0.40 0.29 0.6903 3113 Heavyweight Structural Concrete 0.428 CY. 1.98 1.9803 39 23.13 Chemical Compound Membrane 0.010 C.S.F 0.05 0.08 0.13
Cone. Curing
Table 4.5: Results of Mapping Two Simple Assemblies to MasterFormat 2004
4.3.4. Relational Database management System (RDBMS)
4.3.4.1. RDBMS Definition
RDBMS is a database management system (DBMS) that is based on the
relational model as introduced by E. F. Codd. As brief definition; RDBMS is a
DBMS in which data is stored in the form of tables which are interconnected with
relationships. The main advantage of RDBMS is the efficiency of the database.
To understand how it is different from a normal database a simple example is
presented here. Let's assume we have two records of employees in a company,
the first lists the equipment assigned to the employ's cubical and the other keeps
the contact information, in a normal DBMS those tables look like this:
ID Emplyee Name Home Tel. Cell Address City010 John Doe 514-333-6161 514-666-3131 4- 3230 Boul. Saint Laurant Montreal015 Nikkita John 514-999-1616 514-666-6969 10-69 Rue Saint Michel Montreal
Table 4.6: Employee Contact Table
59
Page 76
Emplyee Name Department Ext. Number Computer ID PrinterJohn Doe CR 30 Desktop IBM-1010 HP Laser 1070NikkitaJohn Sales 69 Laptop Dell-6969 Canon 6969
Table 4.7: Department and Equipment Table
This simple example demonstrate clearly is redundancy in data that will impact
DB engines performance, as weil if we need to update a record, e.g. the a
correction in city name that may mean modifying thousands of records. The
situation will get even worse if it was needed to join the tables to generate a list
of employees' addresses with the equipment assigned to them.
On the other hand in RDBMS this data will be stored in four tables with
relationships integrating them to eliminate data redundancy (Figure 4.4).
SSffiEEBHBitm&mo!O
oc»EmpioEmploye« NameHome Tei
Address?OO Dotv m
Cit'
?*p??t.«*?
SDWo
ErrtpSDOepdrtnttnrEKt Nwmbgr
Camputer ¡0Printer
Figure 4.4: RDBMS
The process of breaking down the data into multiple tables with relationships is
called "Normalization" (Elmasri and Navathe 2000).
60
Page 77
4.3.4.2. Queries and SQL (Structured Query Language)
In RDBMS we can use queries to generate data records across multiple tables.
One of the most common query languages is SQL (Structured Query Language).
In brief SQL is a database computer language designed for the retrieval and
management of data in RDBMS. The cross tables query that will list employees
with their contact information and the equipment assigned to them would look
like:
SELECT Employee.*, [Contact Info]. [Home Tel],[Contact Info] .Address, Cities. City,
Equipment . Department , Equipment . [Ext Number],Equipment . [Computer ID], Equipment . PrinterFROM (Cities INNER JOIN (Employee INNER JOIN [Contact
Info] ON Employee. ID = [Contact Info] . [Emp ID]) ONCities. ID = [Contact Info]. [City ID]) INNER JOINEquipment ON Employee. ID = Equipment . [Emp ID];
The result from running this query is illustrated in Figure 4.5.
tD Employee N< Home Tei Address City Departrm Ext Numbfl John Doe (514) 333-6161 4 - 3230 Soul. Sain! Laurant Montteal CR 30Z Nikkita John (514)999-1616 10-69 Rue Saint Michel Montrea; Sales 69
Figure 4.5: Cross Tables Query Results
4.3.5. AutoDesk Revit
4.3.5.1. Introduction
Chapter two has introduced BIM applications and compared it to CAD. As well, it
demonstrated the advantages in of using BIM over using CAD for cost estimate
purposes. This paragraph will list available BIM packages and present a quick
analysis of their differences.
61
Computer ID PrinterDesktop ¡BM-1010 HP Laser 1070Laptop Deli-6969 Canon 6969
Page 78
Revit along with ArchiCad are the only widely used software solutions that are
built from scratch to be a BIM solution. On the other hand, AutoCAD Architecture,
Mechanical and Electrical Desktops as well as Bentley Architecture, Structural,
Building Mechanical Systems and Bentley Building Electrical Systems are built
on top of CAD software (AutoCAD and Bentley MicroStation), which imposes
serious limitations and performance issues. Between Revit and ArchiCad the
following should be considered:
• Revit has the ability to generate new parametric components without the
need to learn any programming language (visual programming). On the
other hand, ArchiCad requires learning Geometric Description Language
(GDL) in order to develop fully parametric components.
• ArchiCad do not have companion products to support structural,
mechanical and electrical designs. Revit is available for; Architecture,
Structure and MEP
• Nonetheless, ArchiCad has the advantage of running on Windows™ or
Mac OS, while Revit runs only on Windows™
4.3.5.2. Revit: Software Architecture
In order to be able to read quantity take-off from Revit, its architecture must be
analysed and understood. Revit organizes its object in hierarchical format that
consist of four levels:
62
Page 79
• Categories (root parent): is the first level and it serves organizational
purposes. Categories are not limited and the user can create as many as
needed.
• Families (child of Categories and parent of types): is the second level,
where a family can belong to one category only. Families identify the
function of Revit object Types and the available parameters for that object
type. Revit supports two types of families:
o System Family: Revit uses these for its internal functions and
objects that holds generic information, for example is the project
information, in which Revit stores the project address, name,
number... etc.
o Project Families: Revit uses these families to define building
components, like walls, doors ...etc., project annotations object as
well as generic objects that can be used to model any object that
does not fit in the forth mentioned families. (Figure 4.6) shows
some the families supported by Revit Architecture. These families
are stored within the project file. However they can be stored as
template to build a library that can be used in multiple projects.
• Types (child of Families and parent of Instances): is the third level, they
are the core of Revit objects and they serve to define different variations of
the same family, as in the case of two identical windows but one is having
its glass divided into four squares. Types hold, as well, another set of
parameters of their own.
63
Page 80
¿Sì*Annotate Modify Massing & SiIe Collaborate
vicde. Circulaire;- Do1Un". fcucU'e *< Rccrr-S. Â.'sa '-./»"cíx Piane
52 4pt -
m??
* M
Read1,)'
Prcject brc/.serSections (Building Section)Renderings
LegendsSchedules/QuantitiesSheets (all)Families.
Annotation SymbolsCeilingsCertain Pare!!
Empty System Panel— System Panel
Glared
Curtain SystemsCurtain ;Vs;i (Uuilior*Detail KernsDoors
¦+¦ Double-Flush¦+¦ Double-Glass 1'.- O-.'erhead-Polllnr
* Single-Flush* Slldira-Zpare:Floors
+ Floor
¦ +' Slab EdgeParkingPattern
Profiles
RailingsRampsRoofs
·+ Basic Roof
·+: Fascia¦f-! Gutter
+ Ro of SoSt
'+ Sloped SiaangSite
Stairs·'+¦ StairStructural Beam SystemsStructura I Fo und ati o nsWallsWindows
GroupsPe*. Links
m
1/-G = i'-o" E3 S> Q 'Cq ,m .F-G' \S> 9
Figure 4.6: Project Browser; Revit Project Families
64
Page 81
• Instances (Child of Types): is the actual Revit objects placed in geometric
and spatial relations with other objects inside the model, an instance can
have its own parameters as well.
It is of extreme importance to note that modifications at a parent level will
propagate to all children of that parent by inheritance.
The internal structure of Revit file is a propriety file format which has an
extension of "rvt". However the contents of the file can be accessed in two
ways:
• Application Programming Interface (API); is a programming interface that
exposes Revit objects to Integrated Development Environment (IDE).
Currently it supports Visual Basic, Visual C++ and C#.
• Exporting; Revit supports exporting its contents to multiple file formats.
This allows Revit to be integrated in different workflow configurations.
o CAD Formats; supports DWG (AutoCAD native format), DXF
(Drawing exchange Format), DGN (Microstation native format) and
SAT (ACIS SAT).
o Open Database Connection (ODBC); is a driver more than a file
format, as the format will be determined by the database
application that represent the other end of the connection. This is of
a great importance to the research as it will be used to export the
components of Revit project.
65
Page 82
o IFC; as discussed in chapter 3, it is a standards for interoperability
between software solutions. IFC is the only format that maintain all
BIM relations and objects' definition.
o gbXML; is a file format that is common to electrical and energy
analysis software.
4.3.5.3. Revit Database Structure
Exporting Revit project to a database using ODBC, will generate an RDB. The
format of the database depends on the driver used to configure the ODBC. The
generated RDB consists of more than 160 tables that hold the records of Revit
model objects. It should be noted that the ODBC does not export the full contents
of the Revit file (e.g. views are not exported), if full access is required then the
API will be the proper interface. At the first glance the database structure may
seems extremely complex, but a simple analysis will reveal the relationships that
govern and organize these tables (Figure 4.7).
They can be categorized in two groups:
• Generic Tables; each is designed to serve different purpose. For example
the Assembly Codes table holds the EWBS available to the user. Another
example is Project Information table, which holds project name, number
and address as well as client name... etc.
• Objects Tables; each object definition consists of two tables, one holds the
family and type parameters and the other table records the instances
66
Page 83
parameters and their geometrical and spatial information as well as their
attributes. The Doors family is illustrated as an example (Figure 4.8).
"?
Design OptionsSets Design Options
ConstructionsTypes Constructions Levels
PhasesI
Walls Floors
WallsTypes
FloorsTypes
I LevelsI Types
-J
Object ?
Ob ect ?
Assembly Codes
Figure 4.7: Revit Tables Structure
AsssffibsCodeswmelyiodeissmbhOeicnpnon
idKeynoteModelManufacture?r> ? e Comme nisIJfti
Description¿ssembiyCodsMmttyNameType Nam*Type MarkRoughWiäthRough HeightThicknessWidth
Heigh:OperationCoiistruaionTypeFrreRa^ingcost
•i IdT>-pe!dPliasoCreaiedPhaíeDenioNíhsdDcîignOptionCommentsHuStI(I
Typ piciOeiicjnOpttünName
îtsvation
e»Qi<OotK>nSetsHeariHpigrit
!!!HeightFrameMateríal
F rameTypeFinishMark
PrimflryOpnonkíName
DesignOpîionName
T)1P FIOPhaseCreûtedPliaseDemolishBDPíignOptíon
SequenceFJumbeiName
Figure 4.8: Doors Family (Types and instances) Tables Relationships
67
Page 84
A brief description of the function of those tables is provided herein below:
• Design Options and Design Options Sets; two tables to define the multiple
design options. For the objectives of this research a one design option
project will be assumed for the proposed model implementation.
• Levels and Level Types; is a set of data where each datum defines a level
in the project, it can be associated with a plan view or just a level setting
reference point. For the research objectives these tables do not render
any implications.
• Objects and Object Types; the vast majority of Revit tables are in these
types; they define and stores all parameters for the Revit object family,
type and instances.
• Assembly Codes; Stores all the codes for the EWBS that can be
associated with objects types. This table and the objects and objects types
tables are of the utmost interest for the research objectives
4.4. Design Stage
In this stage, all the findings from previous steps along with some techniques that
will be discussed in the following paragraphs will be brought together to develop
the proposed model architecture to respond to research objectives and system
requirements and specification.
4.4.1. Cost Data Processing
In order to make the model flexible in terms of connecting to heterogeneous cost
data, a neutralization layer that process cost data and standardize it is required.
68
Page 85
The output of this layer will be mapped to EWBS (UniFormat) then aggregated
together in Global Assembly Catalogue (GAC) that lists all available assemblies.
Additionally, Assemblies' components are standardized and mapped to TWBS
(MasterFormat) then Aggregated to form the Systems Components Master List
(SCML). Different cost data represent the input for the Cost Data Process, EWBS
represents the control and both GAC and SCML are the outputs (Figure 4.9).
EWBS
CostData
CostData
TWBS
Standardize - -(assemblies)
Standardize <(assemblies)
Standardize(Svs. Components)
Standardize(Sys. Components)
MapGAC
SCMLMap
Input Process
Figure 4.9: Cost Data Processing
Output
4.4.2. Quantity Take-off Process
The next step is to perform the quantity take-off. This achieved by using the
geometrical data from Revit and cost data from GAC as inputs. The user
functions as control to the linking process between the geometries and their
corresponding assemblies. Then the data will be exported. The output of the
quantity take-off process (Figure 4.10) will be and Elemental Bill of Quantities
(B.O.Q.)
69
Page 86
User(CAD/BIM GUI
Geometrical
GLink(assembly code) Data Export
(ODBC)GAC
Input Process
Figure 4.10: Quantity Take-Off Process
ElementalB.O.Q.
Output
4.4.3. Cost Calculation Process
The next step will be the cost calculation, where the outputs of the previous steps
are connected through the cost data lookup to perform the proper calculation.
The two paths for the cost calculation process are demonstrated below along
with the two outputs; elemental cost and trade cost (Figure 4.1 1).
GAC
Elemental £B.O.Q.
SCML'
Cost DataLookup_J
mapping(EWBS to TWBS) ?
Cost data lookup
Input Process
Figure 4.11: Cost Calculation Process
Elementalcost
Tradecost
Output
70
Page 87
4.4.4. Cost Estimate Reporting Process
The final step is collecting the previous outputs and feed them into the cost
estimate process where the user function as a control to select the type of
required report. The inputs are grouped and classified to generate the outputs,
which are of at least two types elemental cost reports and trade based cost
reports.
User(RDBMSGUI
Elemental Cost
Trades Cost
Group & Classify ?
Elemental cost reports
Trades cost reports
Input Process l OutputFigure 4.12: Cost Estimate Reporting Process
4.5. Summary
This chapter covered the methodology followed to develop the model, its
components process and configuration, as well as analysed Revit software
architecture to lay the foundation for implementation stage, which will the focus of
the next chapter. The key findings of this chapter are:
• Using the EWBS approach, rather than TWBS approach, can overcome
technological limitations as well as reduce the required resources for the
cost estimate process. More, it allows the proposed model to be
71
Page 88
implemented since early design stages to serve as a vital tool in cost
budgeting and value engineering.
• Revit exposes its objects through multiple interfaces, the selected
interface to read Revit objects geometrical information is through Open
Database Connectivity (ODBC).
• Using two tiers architecture will increase the system performance as well
as provide central database for cost estimating purposes.
• Distributed database approach will provide the proposed model the
flexibility for accommodating multiple cost databases as well as the
potential of up-scaling the implemented model to increase the
performance.
72
Page 89
CHAPTER 5
Proposed Model Implementation Development and Architecture
5.1. Introduction
In the previous chapter the foundation for developing the proposed model were
established. This chapter will demonstrate the process of model implementation,
covering all components like tables, forms, queries and reports.
5.1.1. Generic Architecture
On a conceptual level, there are two options to approach the proposed model
architecture:
• Single tier architecture: where all the new data extension is included within
the original file. The main advantage of this approach is portability,
however it has many disadvantages as well, including the solution will be
designated for one software solution as well the file size may grow
extremely big which will imposes a performance stress on the computers.
Considering the actual file size for a project designed using Revit, and the
fact the portability in not a factor in the current research; this option is
considered not valid.
• ? tiers architecture: where the information are split over multiple files or
locations. The advantages of this approach are numerous and will be
listed and discussed along this chapter. The proposed model is extremely
73
Page 90
simplistic and depends on two-tier architecture that integrates in an
interactive manner (Figure 5.1).
f)
?
;W \/G?? ;N-
Y?.
CADBIM a
With quantitytDatabase Solution
take-offN
module*
J ¦f
Figure 5.1: Proposed Model on Conceptual Level
The two parts are linked through an identifier. Once again, there are two
options:
• Store linking identifier in the database, for example object id. From
the CAD/BIM.
• Store linking identifier in the CAD/BIM file. This represents the
solution adapted in this research. The main reason behind this is
the advantages of the GUI (Graphical User Interface) of the
CAD/BIM software, as well as the seamless integration that can be
achieved. The chosen linking identifier will be the EWBS (Assembly
Breakdown Structure).
74
Page 91
5.1.2. Proposed Model Configuration
By examining the proposed model more closely we can define the required
configuration to establish generic data flow and the different processes that must
be executed in order to achieve the fore set objectives. It is a four steps
configuration (Figure 5.2):
CAD/BIM• With quantity take-off module
Cost Estimates
ProposedModel CoreFunctions
B.O.Q(DB) Cost (DB)
Figure 5.2: Proposed Model Configuration
1. CAD/BIM generates the quantity take-off by exporting them into a
database
2. The proposed model core functions will:
o Read quantity take-off database.
o Fetch related cost information a separate database.
3. Group and classify the harvested information.
4. Generate the cost estimate report.
75
Page 92
5.1.3. Proposed Model Architecture
To allow for maximum flexibility and efficiency in the proposed model, the
distributed databases model architecture is adopted (Figure 5.3). The
distributions of database components render many advantages including:
• Improves the system performance in certain aspects; especially
maintenance, as well reducing security and rights management
complexity, which is an essential part to prevent mistakenly modifying
database records.
• Allow cost sources databases to be remotely allocated (e.g. linking with a
manufacturer database or linking to web service provider) in order to
increase the system resourcefulness.
• Provides the possibility to distribute the databases over multiple servers
for large scale operations, to maintain high performance.
5.1.4. Proposed Model Architecture Components
The proposed model architecture components' functions explained hereinafter:
• EWBS and TWBS are elemental work breakdown structure and trade
based work breakdown structure; these are pivotal databases as they
provide the breakdown structure for the system. For the research
purposes, UniFormat and MasterFormat 2004 were adopted, as they are
the most commonly used in North America. OmniClass tables 21 and 22
can be used as well.
76
Page 93
• Cost databases, these can be an ln-house developed database, cost data
provider (e.g. RS Means) or a manufacturer database. They should be
classified according to using EWBS breakdown structure recognized by
the system. They are backend databases for the user.
• Global Assemblies Catalogue (GAC) is database query stacking cost from
different resources and exposing them to the user through Revit GUI. This
is an in-system database and it is a frontend database for the user.
• System Core Functions (Set-1) is a set of database functions and
programming code responsible of matching the quantity take-off with the
corresponding cost data that were selected by the user from CAG. They
generate EWBS cost estimate reports as well as assemblies' components
to be used in generating the TWBS cost estimate report.
• System Core Functions (Set-2) is another set of database functions that
perform the EWBS to TWBS mapping process. They generate TWBS cost
estimate reports.
• Systems Components Master List (SCML) is a database query where
assemblies individual components are stacked together to enable System
Core Functions (Set-2) to perform the EWBS to TWBS mapping process
• Generic; is a collection of tables that provides different information:
o Units Table; provides metric and imperial units and their
corresponding conversion factors.
o Revit Categories; is Revit internal categories. It controls when to
show certain assemblies in filtered view.
77
Page 94
EWBS components
G- - _.
EWBS(Other)
=5l
CAD/BIM• With quantity take-off module
M
EWBS(UniFormat)
z>
Cost(3rdParty)
Costln-house)
Generic^
TWBS components
TWBS(MasterFormat)
TWBS(Other)
<3í'*á?'^ S* S jji-JÍ·!
t "^ îa i'iifr-
GAC
ISystem Core
Functions(Set-1)
AssembliesComponents
System CoreFunctions
(Set-2)
SCML
Exported Model
Cost Estimates(Assemblies)
JIX
Cost Estimates(Trades)
Figure 5.3: Proposed Model Architecture
78
Page 95
5.2. Database implementation
The proposed model consists of a minimum of six separate databases; EWBS,
TWB, at least one source of cost data, the exported B. O. Q., generic DB and the
DB that Performs the cost estimation process.
5.2.1. Generic Database
This database consists of two tables that feed the model with its data:
• Units table; stores conversion factors between metric and imperial system.
It consist of four fields; ID, Base, Unit_Type and Conversion_Factor
(Figure 5.4). It should be noted that Revit exports its model in metric
system even if the project was built using imperial system.
• Revit Categories; is a table used for linking assemblies to corresponding
Revit objects. This link is optional and used to filter the exposed
assemblies when a certain Revit object is selected. It consists of three
fields; ID, Revit_Catogory and Description.
Base Unit_Type Conversion_Factor Add New Field1 LF, Length 3.280839895013122 S.F. Area 10.7639150511824
3 CY. Volume 1.30795037636272
4 Ton Mass 0.001
5 Ea. Unit 1
6 Lb. Mass 2.20462442018378
7 SFCA Area 0
8 m. Length 19 cm. Length 10
10 ni2 Area 1
11 m3 Volume 1
12 Kg. Mass 113 B.F. Length 3.28083989501312
(New) 0
Figure 5.4: Units Table Snapshot
79
Page 96
5.2.2. EWBS Database
Due to the wide spread of UniFormat in North America, it is adopted as an
example of EWBS. Hence the database is designed to accommodate it is
structure. The database consists of three tables each governing one of the three
levels of UniFormat (Figure 5.5).
The fields defined in these tables are identical; ID, Division, Title and Parent that
do not exist in UFLevelJ as it is the root table.
Those tables are managed through a Graphical User Interface (GUI) that
consists of three forms (Figure 5.6); a parent form that is a container and governs
level 1 and another two sub-forms that govern level 2 and 3. Selecting a certain
record in Level I form will update Level Il sub-form to reflect only the child
records. The same applies is to selecting a record in Level Il will update the
records in Level III sub-form subsequently. This update is achieved through a
small Visual Basic (VB) subroutine.
.I)SCTOi:1ÏSI3331IID
? ? IJSR731IIIDivisionParentTiUe IDkDivision Parent
DivisionTitle
Figure 5.5: EWBS UniFormat Database Structure
80
Page 97
UniFormat ManagementEWBS Level I
•I < . t .-!I G'· ·.·.! {¦<¦·¦¦¦ A .r
jjjjjj- JJJJ-JJjJj-JJ-.
eWBSLeve/«EWBS Level III
(-LULllLLLLLLLLLLlLLLULLLk' ' ULLLLLLLLLLLLLLLLLLLLlkLk1
Figure 5.6: EWBS Database GUI
5.2.3. TWBS Database
TWBS database implementation is very similar to EWBS database, for the
research purposes MasterFormat 2004 is adopted and it requires six tables
(Figure 5.7). A GUI similar to that of EWBS database is provided as well as a
report to print the whole TWBS for reference and check-up purposes.
MF SuBGroups
G\3*??*
v-^¡t¡m
¦tptiönHdrent
nNim ÍC
ParentD'71'??p?: n-
De cripti ? ?
parent
Figure 5.7: TWBS Database Structure
81
Page 98
flpKlMigcJ.JJUtXJ-I-I-I^UUUULIi
3 i-t-tJ.t"
?*1
ni .ine mentW tfiKîifigRGtjaw
? QÎI
* Oí IM^»r
1 M^KUDUCfORV !feîFORMATiuM
Ji
Ki-K-KT~"AÈ£^Q£ofl (h
??7;;????7·?«????
Figure 5.8 : TWBS Database GUI
5.2.4. Assemblies Cost Databases
The cost databases are backend databases as they serve to feed the Global
Assemblies Catalogue (GAC), which functions as frontend. As discussed in
earlier cost databases can be located remotely or distributed over multiple
backend servers for large scale operations. A typical structure for the assemblies
cost database consists of Breakdown Structure Tables (linked tables from
external database). Usually, these are from three to five tables depending on the
adopted breakdown structure, as well as the table of Units the generic database.
The EWBS cost database itself contains four tables (Figure 5.9):
• Major Classification table; this table records assemblies types (e.g. Brick
Veneer External Wall). It serves as level four for UniFormat. It also defines
the method used to quantify the assembly. In the example of the in-house
cost database; "OmniClass table 21 - Elements" numbers are used and in
82
Page 99
the case of the RS Means assemblies cost database example the used
numbering is RS Means coding system.
• Individual Line Number table; is where the various instances of the
assemblies are stored along the cost for materials and installation for that
instance. Also it has a Boolean field that specify if that assembly is broken
into its components in order for the system to determine the possibility of
generating TWBS cost estimate. Also it incorporates five fields to specify
the different specs of each assembly instances (e.g. in case of wood
floors, bay size, beam depth... etc.). if more fields are required this table
can be expanded easily.
• Fields Headers; this table stores the specs fields headers as they change
depending on the assembly they are describing.
• System components; is a table for storing the components of each
assembly instance when available along with the material and installation
cost, quantity and unit of measurement. As well as a TWBS number to link
the different corresponding components to their corresponding TWBS
section.
It should be noted that the total cost (material + installation) is not stored in
the database to increase the efficiency of database and maintain its integrity.
Nevertheless, it will be calculated as needed during the run-time.
These tables are exposed to the user through a GUI screen which consists of
eight different forms (In the case of UniFormat) that integrate flawlessly in one
coherent screen (Figure 5.10)
83
Page 100
em Components
Figure 5.9: Assemblies Cost Database Structure
Pricing Database Management (In House Assemblies Cost Data)Uniformai Level 1
¦· m
L2M,ii«r Classification fl.rvpl 4 iiiised on C)::
UniFormat Level 2
'«»»"»»»¦
Major Classification
UniFormat Level 3
Individual Line Number Ii-- .k.kbLLlLÎÎÎLÎ>
•as«s? »
-5
System Components
µ J-J1JJJ1J -
1 1? "11 I
Fields Header
?.?MS »'Ji.jiJi»·t„':,l^·¦t*¦.^¦^¦^**' >··
Figure 5.10: Assemblies Cost Database Management GUI Sub-forms
The GUI consists of one parent form that serves as a container and seven
different sub-forms which correspond to each table. Child forms are placed
together in logical layout to facilitate the maintenance and updating operation
84
Page 101
5.2.5. GAC Implementation
Technically speaking, GAC is Union query to gather all the cost information from
different databases and aggregate them in one comprehensive table, listing all
available assemblies with their cost and specification data, as well as other
information concerning that record (Figure 5.11). The query itself is included
herein below:
SELECT Cost^Inhouse . * FROM Cost_InhouseUNION ALL
SELECT Cost RSMF.ans.* FROM Cost _RSMEans
ORDER RY Fill 1_ID;
As new cost databases are connected to the system they are added to this
query. To exposes its contents the user through the GAC.
Figure 5.11: Snapshot of GAC
5.2.5.1. Exporting GAC to Revit
Revit objects types have a built in support to associate them with an assembly
code. It uses a propriety text file (loaded upon program start) that stores all the
85
Page 102
assembly codes. To be able to connect Revit objects with cost databases, those
assembly codes must be identical to the corresponding ones in the databases.
Hence the second function of the GAC is to export all its cost records to Revit,
where its records will be exposed to the user through Revit GUI in the Object
Type Properties dialogue box (Figure 5.12).
I* ,MMHP «
,Ftí 'S
{$>. ^? t'f'f-^>Ti rU^r t ^
Xfrt
f--4 V*iffISM dfG *fJ"ÏV \m íh?
• 1 1S» J
¦: "¦3
V
Figure 5.12: Selecting Assemblies from GAC inside Revit
In order to export GAC records to Revit, a group of eight queries were built to
convert the records in GAC to Revit compatible format. The export function must
be called each time the cost records are updated or new cost database is
integrated in the system. The export function was embedded in Access to
perform this task with few clicks.
86
Page 103
5.3. Proposed Model Core Functions Implementation
To ensure a flexible system that can communicate with multiple output formats
from different packages, as well as accommodate different and multiple
breakdown structures the core functions were built with multi-layer structure. The
proposed model set up five layers (Figure 5.13)
reports; EWBS, TWBS Output Layer
calculate and feed data to reports
generating GAC, SCML.,
process input data, AWBS1 TWBS, BIM.
EWBS TWBS Cost Data Cost Data
CoreFunctions
CoreFunctions
Standardizing
Input (App.Specific )
Figure 5.13: Proposed Model Topology
1 . Application Specific Tables: these tables depend entirely on the adopted
solution for quantity take-off, the adopted breakdown structures a cost
databases.
2. Standardizing queries: is a set of queries that are built to read the different
tables mentioned hereinabove and expose their records in a standardized
way to Core Functions layer.
3. Generating GAC and SCML; is a set of queries that built these
components.
87
Page 104
4. Core Function Layer: is a set of queries that performs the arithmetic
calculations as well as applying the required breakdown structure to the
results
5. Output layer: is a presentation layer that reads the results from the core
functions layer and apply visual styling to build presentable reports.
5.3.1. Cost Calculation Mechanism
For each Revit object type a query is built to calculate the cost of each of its
instances. However, the quantifying unit depends on the cost database units. For
example walls can be quantified using different units depending on the wall type.
5.3.1.1. Quantifying Units
Although any building project has a wide variety of items their quantifying units
fall within four categories:
• Linear; e.g. walls, skirting, piping ...etc.
• Surface; e.g. walls, doors, windows, floors, roofs, painting.... etc.
• Volume; e.g. walls, floors, roofs ...etc.
• By unit; e.g. doors, windows, diffusers, furniture, elevators ...etc.
The system is designed to auto-select the appropriate quantifying unit to match
the selected unit cost.
5.3.1.2. Cost Calculation Queries
The cost calculation queries are the spine of the proposed model, for each Revit
object type there is one query that calculates the cost of its instances (Figure
88
Page 105
5.14 and Figure 5.15). Each of those queries performs the following steps to
fetch the cost for each instance of the assembly that is present in the Revit
model:
• Fetch the assembly code associated with the Revit object instance from
Revit table
• Fetch the quantifying unit associated with assembly cost data from the
CAG
• Based on the unit type it will select the suitable geometrical information to
quantify Revit object
• Perform unit conversion as required (if it is the same unit the conversion
factor 1 is used) to match the quantity unit with cost data unit
• Calculate the cost for the material
• Calculate the cost for the installation
DiW: to ?
careni
D:viti onParen!
Division
FuUJDLeveljyjDiD_iv_and_VMajor.Classificaiioii-IDMajor.C ¡asíífkaüo n.Pare ¡ClassTttteUnrtRemarks
ReviKateyur/Indmd_Line^umber,IDlndívkI_üne>Jurnb?r.P3r£Setoid.SfjiiTíePrkejVear ^
Id
TypeidPhaií'CreíirPhäseDemc
KeynoteMode!Manufatti« -?
1Base
Un(!_TypeConversion Factor
Figure 5.14: Object Type Cost Calculation Query
89
Page 106
¦nil ?;B2010.129.
B2010.129.82010.125.
82010.129.
82010.129.iwir>.i;:y.
B2010.129.
B2010.V29.
B20Ì0.129.
B2010.129.B2010.129.
1100
neoHOO
UGO? Wf)
1100.1 Ii1U
1100
1100
HCO
1.100
11001100
levelJVj:B2010.129
B2010.129B20Í0.Í.29
B2010.129
?201.?.129
82010.129B20KI.5 W
B2010.129
82010.129
B2010.129
R20Î0.129
B2010.129B2010.129
:o IV ani
129.1100129.1100
129.1100
129.1100
129.1100
129.1100129.1100
123.1100129.1100
129.1100
129,1100129.1100
129.1100
23
23
23
23
23
2323
23
23
23
2323
23
¡l ÍJass23 129
23 129
23 129
23 12923 12.9
23 12323 129
23 129
23 129
23 12923 129
23 129
23 129
Brick VeneerBrick VeneerEìrir.k VeneerBrick Veneer3r Ir k Ve?;ee:Brick VeneerBrick VeneerBrick VeneerBiick Veneei3îick Ve leerBrick VeneerBrick VeneerBrick Veneer
Title
/Wood/Wood/Wood/Wood/ Wood/Wood/ Wood/Wood/ Wood/Wood/Wood/Wood/Wood
Stud BackupStud BackupStud BackupStud BackupStud BackupStud BackupStud BackupStud BackupSI utl BackupStud BackupStud BackupStud BackupStud Backup
Remarks2 Exterior brick2 Exterior brick2 Exterior brick2 Exterior brick2 Exterior brick2 Exterior brick7 Exterior brick2 Exterior brick2 Exterior brick2 Exterior brick2 Exterior brick2 Exterior brick2 Exterior brick
Ffe-.ritCal-2000011
-2000011-2000011
-2000011-2000015
-2000011-2000011
-2000011
-2000011
-2000011-2000011
-2000011
-2000011
23
23
23
23
23
2323
23
23
23
23
23
23
Figure 5.15: Wall Cost calculation Query Snapshot
5.3.1.3. Aggregating Objects Cost
Finally all object costs are aggregated using a union query. This query will serve
as the foundation for EWBS cost reports as well as TWBS reports by using the
EWBS to TWBS mapping technique discussed earlier.
5.3.1.4. TWBS Cost Calculation
The EWBS cost aggregation query will serve as the foundation for the TWBS
cost calculation query (Figure 5.16). As the latter will link each object (assembly)
with its components from SCML and calculate the cost of material and/or
installation for each component.
.3030
30
30
30
30
30
30
30
30
30
30
3030
Jnhou Ccst_A8S_AiHS RSMeans
113 RSMeans118 RSMeans118 RSMeans
118 RSMeans
11« RSMeans
HS RSMeans
118 RSMeans
118 RSMeans
118 RSMeans
118 RSMeans
118 RSMeans
118 RSMeans118 RSMeans118 RSMeans118 RSMeans
Cost_ABS_AI As3emoly_Cc Une_Nunibe20082008
2008
2008
200820082008
2008
2008
2008200820Ü8
2008
2008
20082008
0 2000
0 2000
0 2000
0 20000 20000 20000 2000
0 2000
0 2000
0 20000 2000
0 2000
0 2000
0 2000
0 2000
0 2000
Cost_ABS_Ai Cos!$126.00S126.00$126.00$126.00$126.00$126.00$126.00$126.00$126.00$126.00$126.00$126.00$126.00$126.00$126.00$126.00
_AB5_AI$209.00$209.00$2.09.00$209.00$209.00$209.00$209.00$209.00$209.00$209.00$209.00$209.00$209.00$209.00$209.00$209.00
HoilowHollowHollow
HollowHoilowHollowHoilowHollowHollowHollowHollowHollowHollowHollowHollowHollow
core/flushcore/flushcore/flushcore/flushcore/flushcore/flushcore/flushco'e/fliisiscore/fliislicore/flushcore/flushcore/flushcore/flushcore/flushcore/flushcore/flush
Figure 5.16: TWBS Cost Calculation Query Snapshot
90
Page 107
5.3.1.5. Building Cost Estimate Reports
The final step in the implementation process of the proposed model is building
cost estimate reports that will present the calculated data in useful format. This is
achieved by using MS Access 2007 features. The report creation process is
straight forward and requires three steps:
• Select the data source query or table
• Place the fields
• Group the fields to generate the required hierarchy
• Add the totals fields
Figure 5.17 illustrates the report design view
W?
* ,: 1K ' It. ' ·'.· 4?· -Jj1
?95 C«t Bi«Kt Ln«IV
t.
H»ldï
cO»tT\SRenom
ABS LIL
I
* ¿61- L3
Module
wSSSESmlÊÊKÊIIÊÊÊIÊÊÊKÊÎIÈÊÊtÊBÊÊÊKÊIÊÊItÊ^ÊÊKÊÊÊÊieÊÊÊÊÊÊÊÊIÎÊÊÊÊ^Ê^KÊIB^^^^KÊKKIKÊtÊÊi
Figure 5.17: Report Design View
91
Page 108
5.4. Proposed Model Data Flow
To summarize the proposed model architecture and recap the function of each of
its component two dataflow diagrams are presented; EWBS cost estimate
dataflow (Figure 5.18) and TWBS cost estimate dataflow (Figure 5.19).
Revit > ODBC Objects Types
Objects Instances
EWBS L .eve! I
Level ?
RS Means Cost
Classification
Line Number
External DB
In-House
3ltí Party Cost
Classification
Lino Number
Classification
Line Number
RS Means Assemblies In-House Assemblies Cost 3,d Party Assemblies Cost
GAC (Global Assemblies Catalogue)
Walls Cost
Windows Cost
EWBS Cost - All Objects
Object ? Cost
Graph 1: EWBSLevel I CostEstimate
Graph n:EWBS CostEstimate
Report 1 :EWBS DetailedCost Estimate
Report 2:EWBS CostEstimate Level
Report n:EWBS CostEstimate
Figure 5.18: Data flow for EWBS Cost Estimate
92
Page 109
TWBS Level I
Level ?
RS Means Cost
Classification
Line Number
External DB
Systems Components
EWBS Cost - AllObjects
In-House
3rd Party Cost classificationLine Number
Classification
Line Number
Systems Components Systems Components
SCML (Systems Components Master List)
EWBS Cost -All Objects
Graph 1: TWBSLevel I CostEstimate
Graph n:TWBS CostEstimate
Report 1 :TWBS DetailedCost Estimate
Report 2:TWBS CostEstimate Level
Report n:EWBS CostEstimate
Figure 5.19: Dataflow for TWBS Cost Estimate
5.5. Proposed Model Benefits
The two-tier architecture coupled with the EWBS approach to quantity take-off,
give the proposed a model many advantages over single tier architecture and/or
other models that depends on TWBS. Those advantages are listed herein below:
• The proposed model can work with any breakdown structure that is
assembly based. However, for the research purposes UniFormat will be
93
Page 110
used as EWBS and MasterFormat as TWBS due to their wide usage in
North America (Wirahadikusumah 2007).
• Independence of CAD/BIM package:
o The proposed model can integrate with any software solution that is
able to export quantities in assemblies.
o Version independence; as both the CAD/BIM module and the
database module can be upgraded without imposing any upgrades
on the other module. However if the exportation structure changes,
it will require performing modification in the importation module
inside the database module.
o Centrality of costing databases allows updating multiple projects
costs simultaneously.
o Allow integration with various sources of cost databases.
• Flexibility; material specification and construction related decisions can be
fed to the system at any stage. Therefore more detailed information can
be added the moment they become available.
• User friendly; allowing different members of the project team to work in a
familiar software environment, as specifying more detailed information can
be done in either part, therefore cost estimators and project managers are
not required to learn how to operate the CAD/BIM software; especially that
current BIM solution requires intensive training.
• Central Cost Database; Design firms and construction companies deals
with multiple project at the same time, nonetheless a system that
94
Page 111
manages multiple projects is not fully developed yet (Kim and Liu 2007).
The centrality of cost database means the capacity of propagating
changes in cost data to multiple projects simultaneously.
5.5.1. Benefits of Using Elemental Work Breakdown Structure (EWBS)
Designing the proposed model based on EWBS plays a major role in providing
the following benefits:
• Quantity take-off accuracy does not require robust and meticulous 3D
model. Rather, it depends on the robustness and fastidiousness of the
assemblies' database, which in its turn will render two advantages:
o Dramatically reduce 3D modeling time.
o Provides a solution to the limitations of the current technology,
since it is impossible to include everything in the building 3D model
(e.g. pieces of wood in siding finish, bolts, screws, nails... etc.)
• Although CAD/BIM can be used to automatically generate Bill of Materials
based on the selected TWBS, there are serious limitation to this function
due to the lack of configurable construction knowledge (Shen, Issa and Gu
2007) which affect the PCQ costing. On the other hand Assemblies have
built-in data for PCQ that can be modified in accordance with the
construction process/ construction method.
• EWBS can be mapped to TWBS generating PPQ and PCQ while the
reverse is impossible due the lack of association between the PPQ and
PCQ in TWBS (refer to 2.10.1.3 and 4.3.2 for details on mapping
UniFormat to MasterFormat 2004 as well as appendix C).
95
Page 112
5.6. Summary
This chapter presented the development of the proposed model in detail,
covering the implementation of every component by making use of RDBMS,
SQL, and ODBC. The design is accomplished in manner that the whole backend
complex processes are completely hidden from the user behind an extremely
simple GUI. All the steps of the implementation stage have been documented
with description in addition to supporting figures and tables.
The proposed model architecture proved its flexibility in accommodating different
cost databases along with multiple and different breakdown structures, which will
give the user the freedom to respond to different requirements of various
projects.
Validating the proposed model will be covered in next chapter which is dedicated
to examine the results of the implementation processes and measure the
performance.
96
Page 113
CHAPTER 6
Proposed Model Validation and Performance
6.1. Introduction
Chapter six will describe the testing and validation process of the developed
model. Performance is bench marked and validated through a case study, where
a residential building in Montreal of four floors and a basement is created using a
BIM solution (Revit), using typical construction materials and methods for the
project location, as well using RS Means Cost data for validation purposes.
6.2. System Initialization
Before starting to use the system, we need to prepare three databases; Generic,
UniFormat (EVVBS) and MasterFormat (TWBS). These steps are needed to be
followed only once for new setup of the system or can be avoided by installing
the system with pre-populated databases. Yet, these databases can be access
for modification to extend, modify or reduce the available options during anytime.
6.2.1. Populating Generic Database
This is a database of two table that provides the system with unit conversion
factors, (Figure 6.1) and Revit Categories.
Since Revit always export quantities using the metric system (although the
software is capable to work with imperial system for the user interface) entries for
the metric system as well provided.
97
Page 114
Units \ ¡ Retf¡t_C3Í3gories10 Sase - Unit_Type » Convers<on_Facto - Add New Field
1 LF.2 S.f .
3 CY.
4 Ten5 Ea.
6 Lb.7 SFCA
S in.3 cm.
10 ¡11 2
11 m3
12 ig.13 ß.?.
LengthArea
Volume"»•lass
Unit
Mass
Area
LengthLengthArea
VoS u m eMass
Length
3.28083989501312
10.7639150511824
1.30795037636272O. COi
1
2.2046244201837SO
1
10
1
11
3.280839S9501312
Figure 6.1 : Units table Snapshot populated with unit conversion factors
Revit categories are Revit internal numbers and they do not follow an established
standard. This numbers helps filtering cost data inside Revit when the GAC is
exported back to Revit to expose the costing database for the user.
6.2.2. EWBS and TWBS databases
Breakdown structures databases must be populated as well, while EWBS
database is mandatory, TWBS database is optional and will be needed only if
TWBS reports needed.
6.2.2.1. Populating the UniFormat Database (EWBS)
As the proposed model depends on EWBS, UniFormat has been adapted for
testing purposes (it is common EWBS in North America). Tow data entry methods
are available:
• Using the provided management form; first we start populating Level 1,
then the related sub-items in Level 2 finally the related sub-items in Level
3 (Figure 6.2) to feed the corresponding tables.
98
Page 115
Using datasheet view of the tables; it is provided by default in MS Access
(Figure 6.3) and it gives the advantage of pasting multiple entries at once.
UniFormat Management
LhLLLLLLhI
Level 1 1nput Fields
,LULL^tttttttttttttttttttttZ-^L^·
Lmml 2 Input Fíelas
Level 1 recartinavigation buttons
Level 3 Input Fields
Figure 6.2: UniFormat (EWBS) Management GUI
Substructure
4 10
16 10.17 ?.C13 30
?, 23 ·
TtTl eStandard Foundation
Slab on Grade
Add New fsefa ;
13 1020 2G
3 B4 C5 ?6 £7 F
Basement ExcavationBasement WaUs
SheJ?interiors.Serva ces
Equipment an ti FurnishingSpedai Construction ard Demoloiion
AöoNeAfFief'd .
IO - DîvÎs'om -
^ 10 5peciaä Construction20 23 Selective Dsmoìotion
(New;8 G Ouiädlng site work9 Z Gérerai
Tita e
Add Kew Field
- Add Npw FífH :
Figure 6.3: Populating UniFormat (EWBS) Tables using datasheet
99
Page 116
6.2.2.2. Populating the MasterFormat Database (TWBS)
For the TWBS cost estimate reports, MasterFormat has been adopted for the
case study. Similar to EWBS database population methods; a management form
is provided (Figure 6.4) or MS Access built-in datasheet view can be used.
MasterFormat Management
.SiCiFICAlK^S Gi-OUP
*\iniiîy Ccr îtryrîi j'iKCiCtd '* « ¿o?S
îîÎCid '* « ? ?? 12 . » Mt
I !! ï:î cast-ïm pimx coc^; ~~rr
5Î \<' ^celiane in 5 C3£t-in-"!ctce Co^rrete
??-jrö « 1 13: i
RíC-ir-l M · ?·??3
Figure 6.4: MasterFormat Management Form
At this point we have completed the initialization phase and the system is ready
to start building the cost database(s).
6.2.3. Establishing the ODBC
Last step in system initialization is to establish database connection between
Revit and the other components of the system. Revit will use this connection to
export quantities of the elements that are present the project at any time.
After loading Revit, a new project must be created; by selecting "Project..." from
"File/ New" menu.
100
Page 117
Next step will be selecting "ODBC database..." from "File/Export" menu. This will
launch the ODBC wizard, starting with the File Data Source selection dialogue. In
the case of creating a new DSN the button "New" should be clicked to invoke the
the ODBC driver selection dialogue to build the DSN. For the testing environment
the "Microsoft Access (*mdb, *.accdb)" driver is the right choice (Figure 6.5).
After choosing a file name and location for the DSN, the "ODBC Microsoft Access
Setup" Dialogue is invoked. At this point we have the choice to connect to
existing database file or create new one (Figure 6.6).
After finalizing the MS Access file creation, Revit should be exited. At this stage
the system initialization is completed.
y»t »»¦»
Figure 6.5: Selecting ODBC Driver
101
Page 118
I
r;.i ¦ ·
¦ I
!¦¦i i..-.i " ' " i¦ „ _ p
Figure 6.6: ODBC setup
6.3. Preparing Cost Database(s)
The following text will demonstrate how to populate database(s) with sample cost
data from "RS Means Assemblies cost data 2008" (RSMeans 2008) has been
used in support of case study. Consequently Level 4 and 5 numbering from RS
Means is implemented.
Cost data for the following items are entered as a proof of concept:
• Foundations
• External walls (brick veneered and concrete cast in place)
• Internal partitions
• Doors and windows
• Roofs, floors and slab on grade
102
Page 119
As well in order to demonstrate the system ability to use multiple cost databases,
a secondary database for in-house cost data is set up where OmniClass
numbering has been used for Level 4 and sequential numbers for Level 5.
Manual data entry process is illustrated herein below (Figure 6.7 - Figure 6.10).
• First step; selecting the applicable EWBS (3 levels of UniFormat). To add
a new record the user will start by selecting EWBS level 1 , this will refresh
and update the available items in level 2 to list only the child records of the
corresponding item in Level 1. In a similar manner, selecting an item from
level 2 will refresh and update the available items in level 3.
• Second step; is to fill in major classification number and title (e.g. external
wall, brick veneer with wood stud backup), a measuring unit (cost base
unit), Revit category if required as well as any remarks that apply to this
class.
• Third Step; is to supply the individual instances of the major class (e.g. the
brick veneer can be running bond, Flemish bond. ..etc.) along with other
specs that identify and differentiate each entry. The system allows up to
five specs parameters (Figure 6.9). The cost in this section is the unit-cost
(Material and installation) used to calculate the element cost.
• The fourth and final step is optional; and can be used in case it is required
to generate TWBS cost estimate. If this is the case, then the component
check box must be checked and the different field to be filled with the
appropriate data (Figure 6.10). These fields are the ones that allows the
system to perform mapping from EWBS to TWBS
103
Page 120
Although cost database(s) has been populated manually, it can be imported or
connected to as external source(s), which allows the system to integrate cost
data from subcontractors and manufacturers directly.
BBIbsBI>œ&mmmmm$WMMmMMIn * (KfTUAj */*>_¦ S*AfO:
¦ ¦ rf4ti«%Îf«¥Îfir*lir*rfc Hr^nJ *»*e«*V*f* ©erWW»f*»**fc*Wrt ¿"W . ¦ ¦ · .
Figure 6.7: Selecting EWBS in Cost Database
Pricing Database Management (In-House Assemblies Cost Data)
Maior Classification (Level 4 - Based on OmniClasses TaWe 21!
!=> L ;=> L· L. :
r/-.!rs:.-,'
Figure 6.8: Data entry for major classification (level 4)
Page 121
Pricing Database Management (In-House Assemblies Cost Data)
Major Classification (Level 4 - Based on OmniClasses Table 21)
„m.i,i,n,!-i&iiii
Figure 6.9: Data Entry for Individual Line Number (level 5)
Pricing Database Management (In- House Assemblies Cost Data)
Major Classification (Level 4 - Based on OmniClasses Table 21)
'«JlliSiiJII<!il^JlllllfiiiilrllJJJIJI{IÎL«JÎÎ
Figure 6.10: Data Entry for Assembly Components
Though datasheet view is available for the previous screens, it is nc
recommended due to the complexity of relations between the different tables
Errors will affect database integrity and might cause system malfunction.
105
Page 122
6.4. Exporting CAG to Revit
As the system has accumulated some costs information from different sources,
these will be aggregated into one table (query) of all the EWBS unit cost, and
then exported to Revit.
The exporting process has been saved within the Main Module Access file. It can
be accessed from "External Data" menu then clicking "Saved Export". The user
should select "Revit CAG" and click run. It should be noted that the export
function must be run again whenever one of the cost databases modified or new
one connected to the system (Figure 6.11). If the exported information already
exists, a warning dialogue will let the user choose if he is willing to overwrite.
At this point the system is initialized and cost databases are all setup and
exported to Revit. The system is ready to be utilized by the user.
¡?89.G?
M~).'
Figure 6.11: Exporting CAG to Revit
106
Page 123
6.5. Inside Revit
As elements start to be added to the model inside Revit, it is possible to start
calculating their cost right away to keep monitoring the project cost. There are
two possibilities for linking Revit elements with cost data:
• Per Project; elements are linked to cost data for the current project only
• Globally; that is the link is saved in the element family file; hence
whenever it is placed in new project the link will be already embedded.
Establishing the link between Revit element and the cost data is achieved in a
simple way:
• Select any instance of the element then click the type properties button
(Figure 6.12).
i!,_G
LfW„ *ïiw.PB^»{*^i (MP1«)
t h1
r-v *F"Nfxatti
V^s
tiHMRyOM*
^EÉEaaHsSaïî ^
/
«a¦^.
1S.
^SSiE l·
Figure 6.12: Linking Revit Element to Cost Data
107
Page 124
• Select the corresponding assembly code, two choices are available; type
in the assembly code or click the "..." button, which appears after clicking
inside "Assembly Code" Field to invoke the "Choose Assembly Code"
dialogue then browse the tree to select the corresponding cost data
(Figure 6.13). It should be noted that due to Revit Interface Limitations, the
user must hover over the item in the Assembly tree to get more
information about its specs in a Tool Tip format (Figure 5.12)
• Close all dialogue boxes by clicking ok. That is all what is needed to link
all the elements of the same type.
Those steps should be repeated for all the different elements that are in the
model.
Tt*i«mvJi^™i.i
4
Comtrérni
BSBBS IfIWPP"
3. Assembly CoeôDistoglie
'¦% Assembly Cede ffeW
Figure 6.13: Linking Revit Element to Cost Data
108
Page 125
After completing the linking process, the model is ready for cost estimate
calculation. It will be exported through ODBC by choosing "ODBC Database..."
from the "File/Export" menu, then choosing the saved DSN file that was
generated in 6.2.3
6.6. Generating the Cost Estimate Reports
The last step in generating the cost estimate for the project is presenting the
calculated data in useful format. The proposed model implementation with MS
Access 2007 features allow the user to choose between two presentation
methods, which will be covered herein after.
6.6.1. Generating Datasheets Reports
To generate the required report, the process does not exceed merely selecting
the required one from the left pane in MS Access (Figure 6.14). The system
includes nine reports and they are listed hereinafter, full samples of these reports
are provided in appendixes.
mnwj&Tmtzz
eeeîî:
H'-port11 !
JUt
M^
i TBS Cíit Reperì by AIS ¦ l«tf IV
T Gé
_J ^
? 13
Figure 6.14: Selecting Report in MS Access
109
Page 126
6.6.1.1. EWBS Cost Report - Level V
This report will list all the assemblies in the project grouped by Individual Line
Number (Level V) and summarized upward until Level I. This report is useful to
study selected assemblies and their summary quantities and cost data (Figure
6.15).
B Shell (111 detail records)
10 Super Structure (12 detail records)
10 Floor Construction (10 detail records)Revit Famrty Name: FloorRevit Type Nam«:
j 264J 2050I RSMeans
|2008Summary for Line: 2050 (10 detail records)
Materiati: 5288.866,85Installation: $220.002.27
Tata!; $508.869.12Material:
Installation:Total;
Material;
Installation:Total:
5184,973.43$66,169.12
$251.14255
$176,298.71$62.974,82
$239,27353
Wood Beam Bi Joist
$11.45
Quantity15.397.27 S.F
Material Installation Total Price
$176,298.71 $62,974*2 $239,27353
urnmary for 264 Weed Beam & Joist (10 detail records)
20 Roof Construction (2 detail records)Revit Family Name Basic RoofRevit Type Name
1 108¡1200I RSMeans
j 2008Summary for Line 1200 (2 detail records)
15,397.27 S.F. $62,974.82Material:
Installation:Total:
Steel Joists, Beams & Deck on Columns S Walls$2.77
$1.02
$3.79 _^___Quantity Material Installation3,13157 S.F.
$8,674.72$3.19430
$11,86902
$8,674.72 $3,19430
iunmary for 108 Steel Joists, Beams & Deck on Columns & Walls (2 detail records)
Total Price
$11,869X>2
Figure 6.15: Snapshot of EWBS Cost Report by Level S
6.6.1.2. EWBS Detailed Cost Report
This report will list every single object in Revit with its materials cost, installation
cost and the total cost along with any comments associated with it that might be
110
Page 127
of help to the cost estimator in order to apply cost adjustments. The data is
summarized from Level V and upward until Level I (Figure 6.16).
The object Id is Revit internal Id for that object. This can be used by the user to
find the object inside Revit for verification or to apply any required modifications.
BShel
10 Super Structure
10 Floor ConstructionRevit Parody: Floor
Materia*: $502,488.03
installation: $411,005.09
Material: $341,272.72installation: $149,495.33
Material: $332,153.37Installation: $138,428.17
$913,493.11???6 fetor*}
$490,768.05ÍS5 ree¡??}
$470,581.54(S4«c¡wds3
KSMeans
übiectlU Comments
257174
270247
270466270433
$12.68
Wood Beam St Joist
Quntity8,559.78SF.8,559.78SF.8.559.78S.F.
61.08S.F.
60.47 SF.61.08S.F.
Material
$76,610.00$76,610.00$76,610.00
$546.64$541.20$546.64
Installation
$31,927.97$31,927.97$31,927.97
$227.82$225.55$227.82
Total Price
$108,537.96$108,537.96$108,537.96
$774.46$766.74$774.46
Figure 6.16: Snapshot of EWBS Detailed Cost Report
6.6.1.3. Objects without Cost Data
This report lists all the assemblies that are present in Revit model but are not
linked to cost data. It lists with the item its geometrical measurements and
identification data (Figure 6.17).
The data presented in this report helps the user to track the objects that arepresent in the project and do not have cost data associated with them. Also the
cost estimator can apply cost to those object using non-automated methods to
adjust the project total cost or add the missing cost data to the database.
111
Page 128
FamilyName z'co"
AssembíyCode Biölö.265
DescriptionKeynote
id
TypeName
TypcMsrk
Type Comments
987
Generic - 12" - Filled
Length 150.19
Area 299.95
Volume 91.43
Count:
Figure 6.17: Snapshot of Objects without Cost Data Report
6.6.1.4. Value Engineering Report
This report is an extremely simplified illustration of how the proposed model can
be expanded into value engineering. It presents to the user the possible
minimum and maximum along with the specified cost of each Line Number to
provide an idea about the possible minimum and maximum estimated cost for the
project. This information can be used by the project management and the client
to alter the specifications to match the allocated budget (Figure 6.18).
VE Analysis $633,313.94
$1,238,634.23
$640,624.52
$684,103.27|$1,324,727.80
$869,054.98
ABS Level 4 ID: A1010.110
Number of prices in class: 4
Title: Strip FootingNumber of Items: 64
Materai
Installation
Tota!
Mínimum
$4.614.85
$7.331,00
$12.145.85
Specified
$14,089.66
ABS Level 4 ID: A1030.120
Number of prices in class: 2
Title: Plain & Reinforced
Number of items: 15
Materai
Installation
Tota
Minimum
$18,326.43
$21,914.14
$40,240.56
Specified
$25,11393
544,894.90
ABS Level 4 ID: A2020.110 Title: Walls, Cast in Place
Maximum
$9,511.66
$12,288.74
$21,300.39
Maximum
$19,780.90
$25,113.99
$44,894.90
Figure 6.18: Snapshot of VE Report
112
Page 129
6.6.1.5. TWBS Detailed Cost Report
This report uses TWBS to list products and activities and with which Revit objects
they are associated (Figure 6.19). It is useful to analyse the distribution of
products and activities over various objects in the project. Also it can be used in
conjunction with scheduling information to generate cash flow or payments
schedules, as well as for bidding purposes.
04 00 00, Masonary $105,54421 $193.458.93 $299,013.1304 01 00, Maintenance of Masonry SôSC.96 $14,682.31 $15,373.87
0--; 01 20. X'l3"rìtei3^ce of 'L1Tt Masc^,.'
îou -¿¿: RSMeans -î^Yîs- 20Og $690.96 $14,632.91 $15,373.87
04 01 70.52 Unit Masonry CieaningWash smooth brtck
233319 351.86 SI4.07 $299.08 $313.16
245552 114.31 34.57 $97.17 $101.74
233673 87.97 S3.52 $74.77 $78.29
245561 3236 Sl. 29 $27.51 $28.80
2357S0 32.36 51.29 $27-51 $28.80
245572 336.09 S13.44 $285.53 $299.12
262567 247.28 59.89 $210.18 $220.08
2627.31 247.28 $9.89 $210.18 $220.08
233569 114.31 S4.57 $97.17 $101.74
Figure 6.19: TWBS Detailed Cost Report by Item
6.6.1.6. TWBS Detailed Cost Report - Level IV
This report is similar to the previous report but it summarizes the cost data by the
TWBS highest level. It can be used for bidding or bidding benchmarking. It
represents a typical MasterFormat cost estimate report used in the construction
industry in North America (Figure 6.20).
113
Page 130
04 05 00 Common Work Results for Masonry
: agl'ili, cc-J3er, os-ieroscke~
04 21 00 Ciay Unit Masonry
Stancarci arckvva' , 4 ' th'ck. ruwvng cene
05 00 00 Metals
05 12 00 Structural Steel Framing
Figure 6.20: Snapshot of TWBS Cost Report - Level IV
6.6.1.7. TWBS Detailed Cost Report by EWBS and TWBS Detailed Cost
Report by EWBS - Level IV
These two reports are similar to previous TWBS reports except that they
distribute the products and activities by assemblies. If used in conjunction with
actual cost to track assemblies' costs to build historical data for future projects.
6.6.2. Generating Graph Reports
Graphs are very useful to analyse the project cost estimate for value engineering.
They can provide the design teams quick understanding of cost distribution
whether by EWBS or TWBS.
MS Access 2007 can generate graphs (Pivot Chart View) from any table or query.
The process is described hereinafter.
'$102,78037 $171.012.71 S273.7S3.08
Slb.QG4.83 S15.023.39 S31.093.22
114
Page 131
First step is to open the desired query or table, and then select PivotChart
View from the View button on the top left of MS Access 2007 window. The
user will be presented with an empty chart (Figure 6.21 ).
Second Step is to select the desired chart type, for the following examples
a 3D accumulative columns chart is selected (Figure 6.21 ).
Third step is to select data fields and category fields from the Chart fields
list. The selection process is achieved by dragging the desired field and
dropping it over the designated area (Figure 6.21). After dropping a field
over the data area, MS Access will automatically create total of that field. A
filter field can be used to filter the result or focus on certain information by
dropping it in the Filter Fields area.
¿?
Fornii
Reports
43S Pricing All lttrii
tTO
SZUCOCu<
MW ¦¦I-! -1.3-
I ??
Figure 6.21: Choosing Chart Type and Fields
115
Page 132
6.6.2.1. Cost Estimate EWBS Level I, Il and III
The first chart that to be generated is the EWBS level I chart. It will present the
cost estimate distributed over the EWBS main division; in the case of UniFormat
they are nine, where seven of them are associated with the building assemblies.
It is based on the Cost_EWBS_AII_Objects query and accomplished by dropping
the EWBS_LI field in the Category Fields drop area, Material and Installation
fields in the Data Fields drop area as well as Title in the Filter Fields area (Figure
6.22).
Tfîie ¦*-AH
Sum of Price Material Sum of Price!retaliation
!Totals]O Sum of PrifTeJnstaila? Slut of PnEe-Ma fer ? Ei
? Suhtìnrcture
Figure 6.22: Cost Estimate EWBS Level I
If desired this chart can be detailed more by adding EWBS_LII to the Category
Fields area, this will split each item in EWBS level I into its sub items (Figure
6.23). Now the chart displays 10-foundations and 20-basement construction
under ?-substructure, 10-super structure and 20-enclosure under B-shell in
116
Page 133
addition to 10-interior construction under C-interiors. The same can be done with
EWBS level III to display the sub-items of EWBS level 2.
These charts provide valuable information during the design stage. They can be
used by the design team, the client and decision makers to fine tune the project
specifications to make the project cost estimate match the project budget.
Title »AH
Sum of Price_Matenal Sum of Price_lnstailation
20 3assrr:çConsoli c (?
20 Exterior1 Enduosure
ijjiirïçf Sfíwcíu
3 .»líeCcnsírtJct'D
ABS U ~ ABS Ul "
[Totals}n^ii^af Pr¡ce_'n<;!aUti:0&i!maíPr¡ts_Mste-¡a!
Figure 6.23: Cost Estimate EWBS Level Il
6.6.2.2. Cost Estimate TWBS Level I and Il
Similar to the EWBS charts, TWBS charts can be generated based on the
Cost_TWBS query. It will visualize the cost estimate distribution by the TWBS
main divisions (Figure 6.24) or subdivision, if TWBS leveljl is added to the
Category Fields drop area.
117
Page 134
Sum of Material Suim of !Installation
$5CO,eC'3.CC
r-c.rt-"o.co-j-
VJaaá,'last'cs. srd S Tnsrns, ard
P:3f:ecficnprotection
07CCCO
Specie!Oîwismn
TlSSJ ·" MF_LeveU.D«scríp*ion '
Figure 6.24: Cost Estimate TWBS Level I Chart
6.6.2.3. Cost Estimate by Combined EWBS and TWBS
[Totals}D >um oí installation iDSunoiMaler-al !
Swim of !Material Sam ©f J in staNation
SSCG.CGO.liGtsasß.iicn co -^V^ "'ÎlCû.CCÛ.COtï-""'"siso.cüo.coir"'"SIC0rG00.0üU-^"
S50.COC.00 -^f-"
ABS-U " ABSJ.il " -TBSJ -
[Totais] ;
D Sum of Matt-rial
Figure 6.25: Combined EWBS and TWBS Chart
An interesting approach for deeper understanding of cost distribution can be
achieved by combining the EWBS and TWBS in the charts. For example adding
EWBS LI to the previous chart will show how are the different materials and
118
Page 135
trades are distributed over the projects assemblies (Figure 6.27) or visa-versa
(Figure 6.25).
6.7. Performance Benchmarking
The case study project was conducted with a Laptop PC with the specifications
mentioned hereinafter. Although the system is quite modest from the hardware
point of view the implemented model performed peculiarly fast; none of the
reports mentioned before took more than 30 seconds to be generated. Although
the project and the cost queries are designed to cost only architectural elements
as well as that the cost database contains only handful set of records, in a full
scale implementation the system is expected to be able to generate the reports
and charts in a matter of minutes.
6.7.1. Testing System Specifications
• Operating System: Windows Vista professional 32bit
• Database engine & environment: MS Access 2007, SQL queries, OBDC
connection with MS Access 2007 driver.
• Construction Design platform: AutoDesk Revit 2009 (BIM type)
• Hardware: CPU; Intel Centrino 1.6GHz, RAM; 4GB DDR2, GPU; Intel
945GM Express (Open GL 1 .4, Max 256MB), Vista hardware rating 3.1
6.8. Summary
This chapter presented a walk through the developed system that generates cost
estimate reports and charts based on EWBS or TWBS in an automated manner.
The system proved to be; user friendly, efficient and flexible. It has the capacity of
119
Page 136
generating professional reports and charts that can be used for cost budgeting or
cost estimation during design and bidding stages as well as value engineering. It
also gives the user the freedom of following the project cost estimate build up in
matter of few clicks to generating cost estimate reports for value engineering
proposes. The system in itself will help in reducing the project overheads by
reducing the amount of time allocated for the 3D modeling and the cost
estimation processes.
The simplicity of the user interface implies that the learning curve should be very
steep and requires no more than couple of hours of training.
On the other hand, maintaining the cost database(s) is a time demanding
process, which itself can be the subject of future research, unless it is imported
from cost data providers or manufacturers.
Finally the versatile reports and charts that can be furnished by the system at a
blazing speed make it a vital tool in the construction industry.
120
Page 137
CHAPTER 7
Conclusion and Future Expansion
7.1. Conclusion
Preparing cost estimate for building projects is a significant task that traditionallyrequires a lot of resources and it is part of the project cost overheads. The
absence of real-time cost monitoring tools combined with the complexity andinefficiency of the available cost estimation automation systems necessitated thedevelopment of an efficient model that alleviates the burden of this task. The
main benefits of this model are its flexibility, simplicity and swift calculation to
generate the required reports while maintaining a sufficient amount of details.
The proposed model uses the elemental cost approach, and then develops asystematic method for mapping EWBS to TWBS that renders the systembeneficial during design phases and at bidding.
The system is flexible to accommodate any EWBS, TWBS or even multipleEWBSs and TWBSs. The cost databases can be home brewed, obtained from
cost data providers like RS Means or even manufacturers. The system as wellcan handle quantity take-off and cost data in any quantifying system (e.g.imperial or metric) simultaneously without imposing any limitation as theconversion process is performed transparently.
121
Page 138
7.2. Research contribution
• Till the date of this research the trends are focusing on generating detailed
cost estimates by depending heavily on detailed 3D models of the project.
While in theory this seems logical, practically it imposes serious
implications and limitations, as building those extremely detailed models is
challenging for; the available technologies, the tremendous man-hours
required to build them as well as the wealth of information required that
usually won't be available until the last minute of project design phase. In
best cases that will virtually render such a system more of a burden than a
solution that can be applied into real environment. In worst cases the
system will be completely useless as the cost of automating the estimation
process will be much higher than performing it in the traditional methods.
In fact the later assertion was the major factor behind the failure of many
available commercial packages. This research establishes a frame work
that addresses these issues and offers a method to overcome using the
available technologies.
• As well, the research proposes a method of generating detailed quantity
take-off by mapping the assemblies' quantities, which in itself can be used
to save tedious man-hour labour to bring the project design cost and
contractor biding price down by reducing the overheads.
• The established framework offers a continuous cost monitoring to make
sure that project will not exceed the allocated budget.
122
Page 139
7.3. Research Limitation
7.3.1. Limitations of Unit-Cost Method
The proposed model depends on Unit-Cost method to derive the project cost
estimate; however this method has its limitations. The dollar-per-unit figure
masks the actual man-hours and the achieved productivity. Consequently, this
figure must be treated with care since each project is has his own uniqueness
that applies as well to the crew composition, costs and production achieved
(Halpin 1985).
7.3.2. Other limitations
In addition to the forth-mentioned limitations, the proposed model as well does
not perform any optimization nor consider the project schedule.
7.4. Future Research and Expansion
7.4.1. Implementing IFC
Adding an IFC parser to the proposed model, will enable generating cost reports
from various CAD/BIM packages. This parser should be located between the
System Core Functions (set 1) and the exported model.
As well adding support to export cost data in IFC format will enable the system to
attach cost data to 3D model for integration with other systems.
7.4.2. Implementing Cost Adjustments
EWBS cost data obtained from data providers are usually national averages that
need to be adjusted to the project location. As well, consideration for inflation and
123
Page 140
interest rates should be added to increase the accuracy of the generated cost
estimate.
7.4.3. Integrating the 5thDAdapting the alternative proposed model will provide the ground to integrate the
5thD in order to generate automated scheduling for the project, which in its turn
will provide the ground for optimization.
It is worth mentioning as well that assemblies contain the labour data that will
provides the possibility of expanding the proposed model to perform automated
scheduling to serve as an outlook for the architects, engineers, owners and
decision makers
This will allow building much more comprehensive system based on integration
between 3D modeling cost and scheduling.
124
Page 141
REFERENCES
AACE International. Cost Engineering Terminology. AACE InternationalRecommended Practice No. 10S-90, AACE International, 1990.
AACE International. Cost Estimate Classification System. AACE InternationalRecommended Practice No. 17R-97, AACE International, 1997.
Aaron, A. Larry, et al. "Part 1." In The Engineer's Cost handbook, edited byRichard E. Westney. New York: Marcel Decker, Inc., 1997.
Adrian, James J. Construction Estimating: An Accounting and ProductivityApproach. Second Edition. Champaign, Illinois: Stipes PublishingCompany, 1993.
ArchiData. "Monenco Project Management System." Izone-MTO ImplementationProcedures. Montreal: ArchiData, n.d.
Bryan, Spencer. "Assembly Pricing in Construction Cost Estimating." CostEngineering journal 33, no. 8 (August 1991): 17-21.
Charette, Robert P., and Harold E. Marshall. UniFormat Il ElementalClassification for Building Specifications, Cost Estimating and CostAnalysis. National Institute of Standards and Technology, 1999.
CSI and CSC. "MasterFormat 2004." In The Project Resource Manual - CSIManual of Practice. McGraw-Hill, 2005.
—. The Project Resource Manual - CSI Manual of Practice. Fifth Edition.McGraw-Hill, 2005.
CSI and CSC. "UniFormat." In The Project Resources Manual - CSI Manual ofPractice. McGraw-Hill, 2005.
Desert, Larry R. Skills and knowledge of cost engineering 5th edition. 2004.
125
Page 142
Eastman, Chuck, Paul Teicholz, Rafael Sacks, and Kathleen Liston. BIMHandbook. New Jersey: Wiley & Sons, inc., 2008.
Elmasri, Ramez, and Shamkant B. Navathe. The Fundamentals of DatabaseSystems. Third Edition. Addison-Wesley, 2000.
Halpin, D. W. Financial & Cost Concepts for Construction management. JohnWiley & Sons, 1985.
Hammad, Amin. "Lecture Notes." Information Technology Applications inConstruction. 2008.
Haward, Rob. Computing in Construction - Pioneers and the Future. Butterworth-Heinemann, 1998.
Jrade, A. A Conceptual Cost Estimating Computer System for Building Projects.Montreal: Department of Building, Civil and Environmental Engineering,Concordia University, 2000.
Kim, Chul S., and Liang Y. Liu. "Cost Information Model for Managing MultipleProjects." JOURNAL OF CONSTRUCTION ENGINEERING ANDMANAGEMENT 133, no. 12 (December 2007): 966-974.
McClain, Lewis R. Design-Build Interoperability and Conceptual Design andDevelopment of a Design-Build Management Control System. Atlanta,Georgia: College of Architecture, Georgia Institute of Technology, 2007.
Milinusic, Mike. "Cost Reporting by Multiple Breakdown StructuresSimultaneously." In AACE Transactions of 1999. AACE, 1999.
Mohamed, Abdulrezak , and Taher CeNk. "Kowledge based-system foralternative design, cost estimating and schedueling." Kowledge-BasedSystem, no. 15 (2002): 177-188.
126
Page 143
O'Brien, William J., Raja RA. Issa, Joachim Hammer, Mark S. Schmalz, JosephGeunes, and Sherman X. Bai. "Accomplishing Enterprise Information
Integration Across Heterogeneous Sources." Edited by Abdul SamadKazi. ITcon 7 (August 2002): 101-124.
OmniClass - Introduction and User's Guide. 1.0. 2006.
Peurifoy, Robert L, and Garold D. Oberlender. Estimating Construction Cost.Fifth Edition. McGraw-Hill, 2002.
Popescu, Calin M., Kan Phaobunjoung, and Nuntapong Ovararin. EstimatingBuilding Cost. New York, Basel: Marcel Dekker, Inc., 2003.
Project Management Institute. A Guide to the Project Management Body ofKnowledge. 4th edition. Project Management Institute, 2008.
—. Practice Standard for Work Breakdown Structures. 2nd Edition. Project
Management Institute, 2006.
Rivard, Hugues. "A SURVEY ON THE IMPACT OF INFORMATIONTECHNOLOGY ON THE CANADIAN ARCHITECTURE, ENGINEERING
AND CONSTRUCTION INDUSTRY." Edited by Bo-Christer Björk. ITcon 5(2000): 37-56.
RSMeans. RSMeans Assemblies Cost Data 2008 Book. 33rd Edition. RSMeans,2008.
Shen, Zhigang, and Raja R.A. Issa. "Quantitative Evaluation of the BIM-AssistedConstruction Detailed Cost Estimates." Edited by Robert Amor. Journal ofInformation Technology in Construction 15 (March 2010): 234-257.
Shen, Zhigang, Raja R. A. Issa, and Linxia Gu. Semantic 3D CAD and ItsApplications in Construction Industry - An Outlook of Construction DataVisualization. Vol. 4781/2007, in Advances in Visual Information Systems,461-467.2007.
127
Page 144
Sun, Ming, and Rob Howard. Understanding IT in Concstruction. London: SponPress, 2004.
Teorey, Toby J. Database Modeling & Design. Second Edition. San Francisco,California: Morgan Kaufmann Publisher, Inc., 1994.
The American Institute of Architects - AIA. Architect's Handbook of Professional
Practice. Washington DC: The American Institute of Architects - AIA,1984.
Tong, B. A 3D Modeling for detailed Quantity Take-off for Building Projects.Montreal: Department of Building, Civil and Environmental Engineering,Concordia University, 2005.
Wirahadikusumah, Reini D. "The Need for Standard Production Information ofIndonesian Construction Industry." EACEF - The 1st InternationalConference of European Asian Civil Engineering Forum. 2007.
128
Page 145
APPENDIXA
MasterFormat 2004 Division Numbers and Titles
129
Page 146
PROCUREMENTAND contractingREQUIREMENTSGROUP
Division OO Procurement and ContractingRequirements
SPECIFICATIONS GROUP
GENERAL REQUIREMENTS SUBGROUP
Division 01 General Requirements
FACILITY CONSTRUCTION SUBGROUP
Division 02 Existing ConditionsDivision 03 ConcreteDivision 04 MasonryDivision 05 MetalsDivision 06 Wood, Plastics, and CompositesDivision 07 Thermal and Moisture ProtectionDivision 08 OpeningsDivision 09 FinishesDivision 10 SpecialtiesDivision 11 EquipmentDivision 12 FurnishingsDivision 13 Special ConstructionDivision 14 Conveying EquipmentDivision 15 ReservedDivision 16 ReservedDivision 17 ReservedDivision 18 ReservedDivision 19 Reserved
FACILITY SERVICES SUBGROUP
Division 20 ReservedDivision 21 Fire SuppressionDivision 22 PlumbingDivision 23 Heating, Ventilating, and Air
Conditioning
Division 24 ReservedDivision 25 Integrated AutomationDivision 26 ElectricalDivision 27 CommunicationsDivision 28 Electronic Safety and SecurityDivision 29 Reserved
SlTEAND INFRASTRUCTURE SUBGROUP
Division 30 ReservedDivision 31 EarthworkDivision 32 Exterior ImprovementsDivision 33 UtilitiesDivision 34 TransportationDivision 35 Waterway and Marine
ConstructionDivision 36 ReservedDivision 37 ReservedDivision 38 ReservedDivision 39 Reserved
PROCESS EQUIPMENT SUBGROUP
Division 40 Process IntegrationDivision 41 Material Processing and Handling
EquipmentDivision 42 Process Heating, Cooling, and
Drying EquipmentDivision 43 Process Gas and Liquid
Handling, Purification, andStorage Equipment
Division 44 Pollution Control EquipmentDivision 45 Industry-Specific Manufacturing
EquipmentDivision 46 ReservedDivision 47 ReservedDivision 48 Electrical Power GenerationDivision 49 Reserved
130
Page 147
APPENDIX B
UniFormat Levels
131
Page 148
ASUBSTRUCTUREA10 Foundations
A20 Basement Construction
A1010 Standard FoundationsA1020 Special FoundationsA1030 Slab on Grade
A2010 Basement ExcavationA2020 Basement Walls
B SHELLB10 Superstructure
B20 Exterior Enclosure
B30 Roofing
B1010 Floor ConstructionB1020 Roof Construction
B2010 Exterior WallsB2020 Exterior WndowsB2030 Exterior Doors
B3010 Roof CoveringsB3020 Roof Openings
C INTERIORSC10 Interior Construction
C20 Stairs
C30 Interior Finishes
C1010 PartitionsC 1020 Interior DoorsC1030 Fittings
C2010 Stair ConstructionC2020 Stair Finishes
C301 OWaII FinishesC3020 Floor FinishesC3030 Ceiling Finishes
D SERVICESD10 Conveying
D20 Plumbing
D30 HVAC
D1010 Elevators & LiftsD1020 Escalators & Moving WalksD1090 Other Conveying Systems
D2010 Plumbing FixturesD2020 Domestic Water DistributionD2030 Sanitary WasteD2040 Rain Water DrainageD2090 Other Plumbing SystemsD3010 Energy SupplyD3020 Heat Generating SystemsD3030 Cooling Generating SystemsD3040 Distribution SystemsD3050 Terminal & Package Units
132
Page 149
D40 Fire Protection
D50 Electrical
D3060 Controls & InstrumentationD3070 Systems Testing & BalancingD3090 Other HVAC Systems & Equipment
D4010 SprinklersD4020 StandpipesD4030 Fire Protection SpecialtiesD4090 Other Fire Protection Systems
D5010 Electrical Service & DistributionD5020 Lighting and Branch WiringD5030 Communications & SecurityD5090 Other Electrical Systems
E EQUIPMENTS FURNISHINGSE10 Equipment
E20 Furnishings
?10?0 Commercial EquipmentE1020 Institutional EquipmentE1 030 Vehicular EquipmentE1090 Other Equipment
E2010 Fixed FurnishingsE2020 Movable Furnishings
F SPECIAL CONSTRUCTION & DEMOLITIONF10 Special Construction
F20 Selective BuildingDemolition
F 1010 Special StructuresF 1020 Integrated ConstructionF1030 Special Construction SystemsF1040 Special FacilitiesF1050 Special Controls and Instrumentation
F2010 Building Elements DemolitionF2020 Hazardous Components Abatement
133
Page 150
APPENDIXC
Mapping UnîFormat to MasterFormat 2004(McClain 2007)
Page 151
saqi p?sìuaujaAO.icuji jouaìxg
>|JOMLpje3pue Aasjps aiuojpaoA}U FlDSS
suonRDiunuiuionP3U133 3
uoneaiojnv pa}t?Jbaj.u[uoMipuo^jty DU? DuiieiuusA DuijeOH
ouiqiuniduoissajcdns aj|j
jtoiudinbq dui/saucoUOipnilSUO^ IPfDSCl
sbuiusiujru
ìuaujdinhgsamepads
53US UlJ
spujuadQajpïsioifti pue (eiujagiuoipaaojd
S9ÏIS00UJ0D pue "sausen -???/?*siejdw
Aj uose?
çuoiiiptioT bunsixg
tea JP3I3 9ïleDiueipaw si
5LU3Ï5AS bU(A3AU03 f ?uojpnjìsuoD tepsds ti
s6u|us!u.inj zi}uaujdjnb3 pssMtepsds OT
59IfS UM 601
SMopuiM pue SJOOQ soiluepsiojd D-inïSjOw pue euuaui /a
3!ÍS8¡d / POOM 9«s e^W SOI
AJUOÇPW fr
333JDUOJ £XJOMeiS Z
5 e
« äs ts s m
O O ?
O O «1^4 ÍN ?tu eu ?
5 ifi o o o|< > O O
? :n <j\
5 2! TO: 3!> s
e e
o o·-> fMO O
O O
5ÌE
c .hyi of 'o o ¦
o O :
1,1 c m?>? t! *e ? > y
[lo ? w a ,
; m ? -? t c:; u o .2 s oo o o o o o— ¡N m ^j- in iû r-·O O O O O O ~? ? m ? m ?
? QQOOQO
E c3
<u
LO OO O
O O
Q Q
O O O O- (N r. P? s s o* ^ t tOQQO
135
Page 152
______________saminn ce
pue Alojes DüJOjpatg si]SUOllG^iUnUJUJO^ ¿7\
|B31JP3)3 9quouPUJOjnv DSjpjßsiur ¦
ßuttioaipLiojiiv pue 6uiiei¡lusA Bucean uzSuiqujnjd ZZ
uoìsssjddns djij \?jusLudtnbg 6uiaïïau03 t-ì
uo(i3nj^suo^ iepsds et?S&U[MS!UJnj ZMjusLudinbg pS31J|ei33dS oí
56uiuadpajn^siow pue ieujiau,j_ ¿q
saiisoriLuco pue 'S-iiìSR|d 'pCQM 90sunaw "so
Ajuosew t^OÜJOÍ3U0D £0
suo^ipucQ Sunsixg ¿d
|B3iUPlpi»H MSLuaisAç buiA3Auo3 fi
uoipnji^uoo jppads G?sGuigs'Ujn^ ?luaujdinbg ?S3uiep3ds oil
swopuiM pue sjooq gol3jnis|cw pue (Bujjolìx ¿oí
abseid / ????? OCi
^j u osew t?0jaj.cujuu_) £Qj
«JOMaiis 20i
P f $ SI
ili-? _) U «- O C '? fN G", ?? O C ?
LI IT I> Q Q ?
Ee So ra¿I J3
a. ¡y3 £
UlfeC S1 G GO £ 4) *;U - > Oa ? ? s? ?? ro a?OCOO
IiJ IU UJ ill
O O-J (M1O O
; ?; (? — *j- ?3 o ra o? Oj U u. Ui 2 ß ñ «t Qj m & fL ti a. a. o.I £ 1? (/1 ??i O O O O? N p if Kl? C O O O
L L Ü. ??
O Ot-* G?O O
l/l OO CU. Q
- ÄU Q ?F QJ
??? iñ ;O O '— G? ?O O O O
5 5]s s o e> ?? ? ?r>j im I-JJ U ?
O ?
>¦ g i] c 'O. (D 5 "Kt« Ì S ¡S 2 É È :
C (U
O O O O O O '? ?µ m ^- m iû ?? s ? ? ? ? ?m m m m ro m ?IJ ? O Î3 Î3 (J '
JZ E :w en 5 ?- 3 U
O O O O.-t IN M &O O O OTT T C TTO Q O Ò
O Os? s?
D in
136
Page 153
APPENDIX D
Case Study Project Drawings
137
Page 155
"U
??G -firli
: .t?:i; "' *
^
ìli. .
il·
ï ¦ .>
• il
i"
li
it :¡
i. /
- I !
? I
;, ri
??:
1I !l¿li ::irv"ir
I
? ~ if !? u•Çïi··
?".
! ¡ ¦;»!
I I I« »
Ground Floor Plan
139
Typical Floor Plan
Page 156
Il ¡IM
m
111Front Elevation Back Elevation
140
Page 157
APPENDIX E
Case Study Project
Cost Estimation Reports
141
Page 158
EWBS Cost Estimate - Level IIIMaterial $640,028.96
Installation $673,579.62Total $1,313,608.59
A Substructure(144 records)
10 Foundation(79 records)
10 Standard FoundationRevit Family: Basic Wall
30 Slab on GradeRevit Family: Floor
20 Basement Construction(65 records)
20 Basement WallsRevit Family: Basic Wall
B Shell(216 records)
10 Super Structure(55 records)
10 Floor ConstructionRevit Family: Floor
20 Roof ConstructionRevit Family: Basic Roof
20 Exterior Encluosure(161 records)
10 Exterior WallsRevit Family: Basic Wall
20 Exterior WindowsRevit Family: Fixed with Trim Type: 36" ? 72"
Materials:
Installation:
MaterialInstallation
Materia
Installatior
Material:
Installation:
Material:
Installation:
Material:Installation:
Materials:
Installation:
Material:Installation:
Material:
Installation:
Material:
Installation:
Material:Installation:
Material:
Installation:
Material:
Installation:
$41,149.45$64,191.39
$25,745.10$33,159.45
$5,964.20$8,045.46
$19,780.90$25,113.99
$15,404.34$31,031.94
$15,404.34$31,031.94
$516,936.79$433,851.02
$341,272.72$149,495.33
$332,153.37$138,428.17
$9,119.35$11,067.17
$175,664.07$284,355.69
$164,732.66$274,182.80
$10,931.41$10,172.89
Total: $105,340.83
Total: $58,904.55
Total: $14,009.66(64 records)
Total: $44,894.90(15 records)
Total·. $46,436.28
Total: $46,436.28{65 records)
Total: $950,787.81
Total: $490,768.05
Total: $470,581.54(54 records)
Total: $20,186.51{1 record)
Total: $460,019.76
Total: $438,915.46(112 records)
Total: $21,104.30(49 records)
July 2010142
Report Page 1 of 2
Page 159
C Interiors(599 records)
10 Interior Constructions(599 records)
10 PartitionsRevit Family; Basic Wall
20 Interior DoorsRevit Family: Single-Flush
Materials:
Installation:
MaterialInstallation
Material
Installation
Material:
Installation:
Total:
Total:
$81,942.73$175,537.22
$81,942.73$175,537.22
$53,607.73 Tota|.$133,562.22
$28,335.00 Tota|:$41,975.00
$257,479.95
$257,479.95
$187,169.95(432 records)
$70,310.00(167 records)
Grand Total $640,028.96 $673,579.62 $1,313,608.59
July 2010143
Report Page 2 of 2
Page 160
EWBS Cost Estimate - Level V Material $640,028.96Installation $673,579.62
Total $1,313,608.59
A Substructure
10 Foundation
10 Standard Foundation
110
2300
RSMeans
2008
Strip Footing
$9.60
$12.95
$22. 5.S
Summary for: Line 2300(64 detail records)
Quantity621.27 LF.
Summary for 110 Strip Footing (64 detail records)
30 Slab on Grade
120
2240
RSMeans
2008
Summary for: Line 2240(15 detail records)
Summary for 120 Plain & Reinforced (15 detail records)9,696.52 S.F.
Materials:
fvUiterbi:
$41,149.45 $105,340.83$64,191.39 (144 records)
$25,745.10$33,159.45
$5,964.20$8,045.46
$58,904.55{79 records)
$14,009.66(64 records)
The Stri p Foot.'nn Svstem Ic^idos:excavation; hand trim; aif forms needed forfooting placement; forms for 2" ? 6" keyway(four uses); dowels; and 3,000 p.s.i. Concret.The Footing size required varies for differentsoils. Soil boating capacities die listed fot ?>KSI and 6 KSL Depths of the system rangefrom 9" to 24". Widths range from 16" to 96".Smaller strip footings may not requirereinforcement.Please see the reference section for furtherdesign and cost information
Material Installation Total Price
621.27 LF.
Plain & Reinforced
$2.04
$2.59
$4.63
Quantity9,696.52 S.F.
$5,964.20
$5,964.20Mate
$8,045.46 $14,009.66
$8,045.46 $14,009.66
$19,780.90$25,113.99
$44,894.90(l!i records)
Material
$19,780.90
$19,780.90
Installation
$25,113.99
$25,113.99
Total Price
$44,894.90
$44,894.90
July 2010144
Report Page 1 of 6
Page 161
20 Basement Construction
20 Basement WallsRevit Family: Basic Wall
110
3060
RSMeans
7008
Summary for: Line 3060(65 detail records)
instaüatlon:
Installation:
$15,404.34$31,031.94
$15,404.34$31,031.94
Walls, Cast in Place
$34.50 :
$69.50
$104.00
Quantity446.50 LF.
Summary for 110 Walls, Cast in Place (65 detail records)446.50 L.F.
Material
$15,404.34
$15,404.34
Installation
$31,031.94
$31,031.94
$46,436.28(65 records)
$46,436.28{65 records)
Total Price
$46,436.28
$46,436.28
July 2010145
Report Page 2 of 6
Page 162
B Shell
10 Super Structure
10 Floor ConstructionRcvii Pnrviüy: i-loor
264
2000
RSMeans
2008
Summary for: Line 2000(54 detail records)
Installation:
$516,936.79$433,851.02
$341,272.72$149,495.33
$332,153.37$138,428.17
$950,787.81(216 records)
$490,768.05{55 records)
$470,581.54{54 records)
Wood Beam & Joist
$8.95
$3.73
$12.68
Quantity37,112.11 S.F.
Material
$332,153.37
Installation
$138,428.17
Total Price
$470,581.54Summary for 264 Wood Beam & Joist (54 detail records)
37,112.11 S.F. $332,153.37 $138,428.17 $470,581.54
20 Roof Construction
102
2550
RSMeans
2800
Material: $9,119.35·.·!'.';:··¦ $11,067.17
$20,186.51a tíTiníí)
Wood/Flat or Pitched
Summary for: Line 2550(1 detail record)
$1.03
$1.25
$2.28
Quantity8,853.73 S.F.
The Table below lists prices per S.F. for roofrafters and sheathing by nominal size andspacing. Sheathing is 15/16" CDX for 12" and16" spacing and 3/8" CDX for 24 spacing.
Material Installation Total Price
$9,119.35 $11,067.17 $20,186.51Summary for 102 Wood/Flat or Pitched (1 detail record)
8,853.73 S.F.
20 Exterior Encluosure
10 Exterior WallsRevit l;amily: Basic Wall
$9,119.35 $11,067.17Materia':
Insinuation:
ivi a te ria i:
Installation:
$175,664.07$284,355.69
$164,732.66$274,182.80
$20,186.51
$460,019.76(161 records)
$438,915.46(112 records)
129 Brick Veneer / Wood Stud Backup
July 2010146
Report Page 3 of 6
Page 163
1.1.00 $8.70
RS Means
2008
$14.55
$73.25
Summary for: Line 1100(82 detail records)
Quantity17,274.01 S.F.
Exterior brick veneer / stud backup walls aredefined in the follwing terms: types of brickand studs, stud spacing and bond. AllSystems include a backup-wall, a control jointevery 20', a brick shelf every 12' of height,ties to the backup and the necessarydampproofing, flushing and insulation
Material Installation Total Price
$150,283.90Summary for 129 Brick Veneer/ Wood Stud Backup (82 detail records)
17,274.01 S.F. $150,283.90
148
1400
RSMeans
2008
Summary for: Line 1400(30 detail records)
Panel, Shingle & Lap Siding$3.08
$4.87
$7.95
Quantity Material4,691.16 S.F. $14,448.76
Summary for 148 Panel, Shingle & Lap Siding (30 detail records)4,691.16 S.F.
20 Exterior Windows
$14,448.76
102
3000
RSMeans
2008
Summary for: Line 3000(49 detail records)
Wood Windows
$223.09
$207.61
$430.70
Quantity49.00 Ea.
Summary for 102 Wood Windows (49 detail records)49.00
Material
$10,931.41
$10,931.41
$251,336.86
$251,336.86
Installation
$22,845.93
$22,845.93
$10,931.41$10,172.89
Installation
$10,172.89
$401,620.76
$401,620.76
Total Price
$37,294.70
$37,294.70
$21,104.30(49 records)
Total Price
$21,104.30
$10,172.89 $21,104.30
July 2010147
Report Page 4 of 6
Page 164
C Interiors
10 Interior Constructions
!ii-.f,i;iyll·'·.!!
10 Partitions
124
12.50
RS Means
2008
Summary for: Line 1250(379 detail records)
1600
RSMeans
2008
Summary for: Line 1600(53 detail records)
$81,942.73 $257,479.95$175,537.22 (s<» wcordsj
$81,942.73 $257,479.95$175,537.22 (599 records)
$53,607.73 $187,169.95$133,562.22 (432 records)
Drywall Partitions / Wood Stud Framing
$2.83
$3.98
Quantity29,832.21 S.F.
$2,18
$5.55
$7.73
Quantity8,853.53 S.F.
Material
$34,307.04
Material
$19,300.69Summary for 124 Drywall Partitions / Wood Stud Framing (432 detail records)
38,685.73 S.F. $53,607.73
20 Interior Doors
102
5000
RSMeans
2008
Summary for: Line 5000(2 detail records)
Summary for 102 Speciel Doors (2 detail records)
Speciel Doors
$1,050.00
$775.00
$1,825.00
Quantity2.00 Ea.
Material
$2,100.00
$2,100.00
120
1600
RSMeans
2008
Wood Door/Wood Frame
$159.00
$245.00 ¦·.¦'.
$404.00
Installation
$84,425.15
Installation
$49,137.07
$133,562.22
$28,335.00$41,975.00
Installation
$1,550.00
$1,550.00
Total Price
$.1.18,732.18
Total Price
$68,437.76
$187,169.95
$70,310.00{lb/ records)
Total Price
$3,650.00
$3,650.00
July 2010148
Report Page 5 of 6
Page 165
Summary for: Line 1600(165 detail records)
Quantity165.00 Ea.
Summary for 120 Wood Door/Wood Frame (165 detail records)165.00 Ea.
Grand Total $640,028.96
Material
$26,235.00
$26,235.00
Installation
$40,425.00
Total Price
$66,660.00
$40,425.00
$673,579.62$66,660.00
$1,313,608.59
July 2010149
Report Page 6 of 6
Page 166
EWBS Cost Estimate - Detailed Material $640,028.96Installation $673,579.62
Total $1,313,608.59
A Substructure
10 Foundation
10 Standard Foundation
1.1.0
2300
RSMeans
/008
Strip Footing
$9.60
$12.95
$22. SS
Materials:
Installation'
MrI ton.! I:ïns'Milrition;
$41,149.45$64,191.39
$25,745.10$33,159.45$5,964.20$8,045.46
$105,340.83(144 rpcorck;
$58,904.55(79 records)
$14,009.66
The Strip Footing System Icludes:excavation; hand trim; a!! forms needed forfooting placement; forms for 2" ? 6" keyway(four uses); dowels; and 3,000 p.s.i. Concret.The Footing size required varies for differentsoils. Soil bearing capacities are listed for 3KSt: and 6 KSI-' . Depths of the system ? angefrom 9" to 24". Widths range from 1.6" to 96".Smaller strip footings may not requirereinforcement.Please see the reference section for furtherdesign and cost information
259959
260345259774
259803
259822259856
259879
259711259933
259688
259980260028
261399
260081
260247
260271
259907
11.27
11.662.84
12.402.84
11.692.81
2.872.81
12.384.81
12.81
1.99
12.2711.75
8.2524.63
L.F.
L.F.
L.F.
LF.
L.F.
LF.LF.
LF.
LF.
L.F.
L.F.
L.F.
L.F.
L.F.
L.F.
L.F.
L.F.
$108.20$111.90
$27.25$119.00
$27.25$112.20
$27.00$27.55$27.00
$118.80$46.20
$123.00$19.10
$117.80$112.80
$79.20$236.40
$145.96$150.95
$36.76$160.53
$36.76$151.35
$36.42$37.16$36.42
$160.26$62.32
$165.92$25.77
$158.91$152.16$106.84$318.89
$254.16$262.85
$64.01$279.53
$64.01$263.55
$63.42$64.71$63.42
$279.06$108.52$288.92
$44.87$276.71$264.96$186.04$555.29
July 2010150
Report Page 1 of 28
Page 167
259485 4.81 LF. $46.20 $62.32 $108.52259166 20.82 LF. $199.88 $269.63 $469.51259204 11.75 LF. $112.80 $152.16 $264.96259250 8.29 L.F. $79.62 $107.41 $187.03259292 11.75 LF. $112.80 $152.16 $264.96259328 20.70 LF. $198.70 $268.04 $466.74259407 12.27 LF. $117.80 $158.91 $276.71259752 23.54 LF. $226.00 $304.86 $530.86259461 12.81 LF. $123.00 $165.92 $288.92260219 20.78 LF. $199.50 $269.12 $468.62259523 11.27 LF. $108.20 $145.96 $254.16259543 2.79 L.F. $26.75 $36.08 $62.83259572 12.42 LF. $119.20 $160.80 $280.00259599 2.75 L.F. $26.40 $35.61 $62.01259629 12.50 L.F. $120.00 $161.88 $281.88259653 2.83 L.F. $27.20 $36.69 $63.89259432 2.81 L.F. $27.00 $36.42 $63.42261530 12.81 L.F. $123.00 $165.92 $288.92261142 2.81 L.F. $27.00 $36.42 $63.42261190 23.54 L.F. $226.00 $304.86 $530.86260399 20.78 LF. $199.50 $269.12 $468.62261253 25.46 L.F. $244.40 $329.69 $574.09260052 2.81 L.F. $27.00 $36.42 $63.42261317 11.29 LF. $108.40 $146.23 $254.63261119 12.40 L.F. $119.00 $160.53 $279.53261374 11.81 LF. $113.40 $152.97 $266.37261213 2.79 LF. $26.75 $36.08 $62.83261556 2.80 LF. $26.90 $36.29 $63.19261621 12.27 LF. $117.80 $158.91 $276.71261765 12.69 L.F. $121.80 $164.30 $286.10261785 7.56 L.F. $72.55 $97.87 $170.42261808 12.69 L.F. $121.80 $164.30 $286.10261856 7.56 L.F. $72.55 $97.87 $170.42261340 2.81 LF. $27.00 $36.42 $63.42260902 , 11.69 LF. $112.20 $151.35 $263.55260533 12.18 L.F. $116.90 $157.69 $274.59260560 2.81 L.F. $27.00 $36.42 $63.42260797 12.81 L.F. $123.00 $165.92 $288.92260820 1.54 LF. $14.75 $19.90 $34.65261282 2.79 L.F. $26.75 $36.08 $62.83260874 3.28 LF. $31.45 $42.42 $73.87261075 2.81 LF. $27.00 $36.42 $63.42
July 2010 Report Page 2 of 28151
Page 168
260921 2.81261054 11.69260992 12.40261021 2.81
260851 11.81
Summary for: Line 2300 621.27(64 detail records)
Summary for 110 Strip Footing (64 detail records)621.27 LF.
30 Slab on Grade
120
2240
RS Means
2008
256696
2/199(5
272000
272013
272022272160
272173
273188273199
273210
286934
286957287145
287181
287205
Summary for: Line 2240(15 detail records)
Summary for 120 Plain & Reinforced (15 detail records)
Plain & Reinforced
$2.04 ;
$2.59
$4.63
Quiitity8,829.01
61.08
60.47
61.08
60.4760.4760.47
61.6761.67
63.8862.31
62.3163.8863.88
63.88
9,696.52
L.F.
L.F.
LF.
LF.
LF.
LF.
$27.00$112.20$119.00
$27.00$113.40
$5,964.20
$36.42$151.35$160.53
$36.42$152.97
,8,045.46
$5,964.20 $8,045.46
$19,780.90$25,113.99
S.F.
S.l·.
S.F.
S.F.S.F.
S.F.S.F.
S.F.S.F.
S.F.S.F.S.F.
S.F.
S.F.S.F.
S.F.
$18,011.18$124.60$123.36$124.60$123.36$123.36$123.36$125.81$125.81$130.31$127.11$127.11$130.31$130.31$130.31
$19,780.90
¡sir) ? ¡;s no ?
$22,867.13$158.19$156.6.1$158.19$156.61$156.61$156.61$159.73$159.73$165.45$161.38$161.38$165.45$165.45$165.45
$25,113.99
9,696.52 S.F. $19,780.90
20 Basement Construction
20 Basement WallsRtwi't Family: Basic Wall
110
M,>te¡i,il.
Maifíñiú:
instigation:
$25,113.99
$15,404.34$31,031.94$15,404.34$31,031.94
July 2010
Walls, Cast in Place
152
$63.42$263.55$279.53
$63.42$266.37
$14,009.66
$14,009.66
$44,894.90
$40,878.31$282.79$279.97$282.79$279.97$279.97$279.97$285.55$285.55$295.76$288.49$288.49$295.76$295.76$295.76
$44,894.90
$44,894.90
$46,436.28(65 records)
$46,436.28(65 records)
Report Page 3 of 28
Page 169
3060 $34.50
RSMeans $69.50
2008 $104.00
25375? 12.42 L.F. $428.38 $862.96 $1,291.33253783 2.92 LF. $100.63 $202.71 $303.33253964 3.01 L.F. $103.86 $209.22 $313.08254013 12.38 LF. $426.94 $860.06 $1,287.00254116 2 76 LF. $95 05 $191.49 $7M.rA253671 2.80 L.F. $96.67 $194.74 $291.42284107 8.33 L.F. $287.50 $579.17 $866.67254211 12.40 LF. $427.66 $861.51 $1,289.17254064 2.90 LF. $99.91 $201.26 $301.1727836? 2.90 ! F. $99.91 $20.1.76 $301 172/8526 2.90 LF. $99.91 $201.26 $301.1/253623 7.68 L.F. $264.94 $533.71 $798.65279760 26.60 L.F. $917.56 $1,848.42 $2,765.982/9944 26.46 LF. $912,89 $1,839 01 $2,75190283880 8.33 L.F. $287.50 $579.17 $866.67253569 2.81 L.F. $97.03 $195.47 $292.50253516 5.68 L.F. $195.94 $394.71 $590.65262958 1.00 LF. $34.50 $69.50 $104.00253599 12.81 L.F. $442.03 $890.47 $1,332.507551.65 2.81 L.F. $97.03 $195.47 $292.50255561 2.79 LF. $96.13 $193.66 $289.79255531 25.46 LF. $878.31 $1,769.35 $2,647.67255470 2.79 LF. $96.13 $193.66 $289.79255380 2.81 L.F. $97.03 $195.47 $292.50255355 12.40 LF. $427.66 $861.51 $1,289.17254466 7.68 L.F. $264.94 $533.71 $798.65255287 2.81 L.F. $97.03 $195.47 $292.50254564 12.81 LF. $442.03 $890.47 $1,332.50265216 26.58 LF. $916.84 $1,846.97 $2,763.82255203 12.40 LF. $427.66 $861.51 $1,289.17255663 11.81 LF. $407.53 $820.97 $1,228.50255102 3.28 L.F. $113.02 $227.68 $340.71255074 11.81 L.F. $407.53 $820.97 $1,228.50254999 4.40 LF. $151.91 $306.03 $457.94254673 2.78 LF. $96.03 $193.45 $289.48254971 2.87 LF. $98.91 $199.24 $298.15254947 12.81 L.F. $442.03 $890.47 $1,332.50
July 2010 Report Page 4 of 28153
Page 170
254905 2.81254825 5.68254797 26.60
255228 2.81256044 2.79254754 5.68254334 2.90256653 1.00256608 1.00256564 1.00256525 0.80
256474 0.80256422 1.00256373 1.00255607 2.81256216 1.00254379 24.63256016 2.79
255963 2.79255937 2.79
255894 5.68255805 2.81255778 12.81255732 2.87255698 4.87254241 2.76
256290 1.00262957 2.87
Summary for: Line 3060 446.50(65 detail records)
Summary for 110 Walls, Cast in Place (65 detail records)446.50 L.F.
L.F.
L.F.
L.F.
LF.
LF.
L.F.
L.F.
L.F.
LF.
L.F.
LF.
LF.
LF.
L.F.
L.F.
L.F.
L.F.
L.F.
LF.
L.F.
L.F.
L.F.
LF.
L.F.
LF.
L.F.
L.F.
L.F.
L.F.
$97.03$195.94$917.56
$97.03$96.31
$195.94$99.91$34.50$34.50$34.50$27.64$27.64$34.50$34.50$97.03$34.50
$849.56$96.31$96.31$96.31
$195.94$97.03
$442.03$98.91
$167.91$95.05$34.50$98.91
$15,404.34
$195.47$394.71
$1,848.42$195.47$194.02$394.71$201.26
$69.50$69.50$69.50$55.68$55.68$69.50$69.50
$195.47$69.50
$1,711.44$194.02$194.02$194.02$394.71$195.47$890.47$199.24$338.24$191.49
$69.50$199.24
$31,031.94
$15,404.34 $31,031.94
$292.50$590.65
$2,765.98$292.50$290.33$590.65$301.17$104.00$104.00$104.00
$83.32$83.32
$104.00$104.00$292.50$104.00
$2,561.00$290.33$290.33$290.33$590.65$292.50
$1,332.50$298.15$506.15$286.54$104.00$298.15
$46,436.28
$46,436.28
July 2010154
Report Page 5 of 28
Page 171
B Shell
10 Super Structure
10 Floor ConstructionIte-vii: !-«muy. hoor
264
2000
RSMeans
2008
Object IO Comments:257174
257358257542
270247
270466270483270493
270518270971
270996271012
271232
271274
271293273304
273315
273326275431
275441
275454275463275479275490
275501275512
275523275534275572275583
July 2010
8,559.7861.08
60.4761.0860.4761.6763.65
61.65
62.31
63.88
60.47
60.4761.67
61.67
63.88
61.08
60.47
61.08
60.47
61.67
63.65
61.6562.31
63.8860.47
61.6761.67
155
Materia!:;:
Installation:
li!Sfall:itio:i:Matenai:
inüuiüat'i.'Ki:
$516,936.79$433,851.02
$341,272.72$149,495.33$332,153.37$138,428.17
$950,787.81{216 records)
$490,768.05{55 records}
$470,581.54(54 records)
Wood Beam 8¿ Joist
$8.95
$3.73
$12.68 '
Quntity8,559.78 S.F.8,559.78 S.F.
S.F,S.F.S.F.
S.F.S.F.
S.F.
S.F.
S.F.
S.F.
S.F.
S.F.
S.F.
S.F.
S.F.
S.F.
S.F.
S.F.
S.F.
S.F.
S.F.
S.F.
S.F.
S.F.
S.F.S.F.
S.F.S.F.
Materia!
$76,610.00$76,610.00$76,610.00
$546.64$541.20$546.64$541.20$551.98$569.64$551.75$557.67$571.72$541.20$541.20$551.98$551.98$571.72$546.64$541.20$546.64$541.20$551.98$569.64$551.75$557.67$571.72$541.20$551.98$551.98
Installation Total Price
$31,927.97 $108,537.96$31,927.97 $108,537.90{31,927.97
$227.82$225.55$227.82$225.55$230.04$237.40$229.95$232.41$238.27$225.55$225.55$230.04$230.04$238.27$227.82$225.55$227.82$225.55$230.04$237.40$229.95$232.41$238.27$225.55$230.04$230.04
$108,537.96$774.46$766.74$774.46$766.74$782.02$807.04$781.70$790.08$809.99$766.74$766.74$782.02$782.02$809.99$774.46$766.74$774.46$766.74$782.02$807.04$781.70$790.08$809.99$766.74$782.02$782.02
Report Page 6 of 28
Page 172
275594275987275996276012
276023276105
276116276127
277289277351
277360277378277389
277400
277411277493
280649
280975
2821502821/2
282194
282224
282246
282268
286744
Summary for: Line 2000(54 detail records)
Summary for 264 Wood Beam & Joist (54 detail records)37,112.11 S.F.
20 Roof Construction
102
2550
RSMeans
2800
63.88
61.08
60.47
61.6763.6561.6761.6763.88
60.4761.08
60.4761.6562.3163.88
60.47
60.4/
35.48
35.4835.48
35.48
35.48
S.F.
S.F.
S.F.
S.F.
S.F.
S.F.S.F.
S.F.
S.F.
S.F.
S.F.
S.F.
S.F.S.F.
S.F.
S.h
S.F.
S.F.
S.F.
S.F.
S.F.
35.48 S.F.35.48 S.F.
35.48 S.F.
8,555.73 S.F.37,112.11 S.F.
$571.72$546.64$541.20$551.98$569.64$551.98$551.98$571.72$541.20$546.64$541.20$551.75$557.67$571.72$54] .20
$541.20$317.51$317.51$317.51$317.51$317.51$317.51$317.51$317.51
$76,573.78$332,153.37
$238.27$227.82$225.55$230.04$237.40$230.04$230.04$238.27$225.55$227.82
$225.55$229.95$232.41$238.27$225.55
$225.55$132.33$132.33$132.33$132.33$132.33$132.33$132.33$132.33
$31,912.87$138,428.17
$809.99$774.46$766.74$782.02$807.04$782.02$782.02$809.99$766.74$774,46
$766.74$781.70$790.08$809.99$766.74$/66.74$449.84$449.84$449.84$449.84$449.84$449.84$449.84$449.84
$108,486.65$470,581.54
$332,153.37 $138,428.17 $470,581.54Material:
Installation$9,119.35
$11,067.17$20,186.51
(1 record)
Wood/Flat or Pitched
$1.03
$1.25
$2.28
The Table below lists prices per S.F. for roofrafters and sheathing by nominal size andspacing. Sheathing is 15/16" CDX for 12" and16" spacing and 3/8" CDX for 24 spacing.
262208
Summary for: Line 2550(1 detail record)
,853.73 S.F.5,853.73 S.F.
$9,119.35$9,119.35
$11,067.17$11,067.17
$20,186.51$20,186.51
July 2010156
Report Page 7 of 28
Page 173
Summary for 102 Wood/Flat or Pitched (1 detail record)8,853.73 S.F.
20 Exterior Encluosure
10 Exterior Walls
$9,119.35
M a le ? idi:
Installation.
Mtjtoriísl:
$11,067.17 $20,186.51
$175,664.07 $460,019.76$284,355.69 (ISI records)$164,732.66 $438,915.46$274,182.80 <112 records)
129
1100
RS Means
2008
Brick Veneer/ Wood Stud Backup
$8.70
$14.55
$23.25
Exterior brick veneer / stud backup walls aredefined in the follwing terms: types of brickand studs, stud spacing and bond. AilSystems include a backup-wall, a control jointevery 20', a brick shelf every 12' of height,ties to the backup and the necessarydampproofing, flushing and insulation
245573
24557224556.1
245552
245549
245506
245496245495245479
245469245462
245577245448
245438245437243951
243705243632243528
239966239965
245464
245623
262781
265082
July 2010
85.98
336.09
32.36
114.31
281.47
32.36114.31
672.19
32.36
114.31
88.12
34.8032.36
114.31351.86
1,104.66441.63
144.40144.40114.31351.86
64.73
35.69247.28
1,141.45
157
S.F.
S.F.
S.F.
S.F.
S.F.
S.F.
S.F.
S.F.
S.F.
S.F.
S.F.S.F.S.F.S.F.S.F.S.F.
S.F.S.F.S.F.
S.F.
S.F.
S.F.
S.F.
S.F.
S.F.
$748.03$2,924.02
$281.57$994.53
$2,448.80$281.57$994.53
$5,848.03$281.57$994.53$766.61$302.78$281.57$994.53
$3,061.19$9,610.56$3,842.18$1,256.24$1,256.24
$994.53$3,061.19
$563.14$310.54
$2,151.30$9,930.61
$1,251.01$4,890.17
$470.90$1,663.26$4,095.40
$470.90$1,663.26$9,780.33
$470.90$1,663.26$1,282.09
$506.37$470.90
$1,663.26$5,119.58
$16,072.84$6,425.72$2,100.96$2,100.96$1,663.26$5,119.58
$941.81$519.35
$3,597.87$16,608.08
$1,999.03$7,814.18
$752.48$2,657.79$6,544.20
$752.48$2,657.79
$15,628.37$752.48
$2,657.79$2,048.71
$809.15$752.48
$2,657.79$8,180.77
$25,683.40$10,267.91
$3,357.20$3,357.20$2,657.79$8,180.77$1,504.95
$829.90$5,749.17
$26,538.69
Report Page 8 of 28
Page 174
283572 372.28 S.F. $3,238.85 $5,416.69 $8,655.54285360 85.40 S.F. $742.94 $1,242.51 $1,985.45247303 319.50 S.F. $2,779.62 $4,648.68 $7,428.30247152 137.83 S.F. $1,199.15 $2,005.48 $3,204.63247103 137.83 S.F. $1,199.15 $2,005.48 $3,204.63286496 372.28 S.F. $3,238.85 $5,416.69 $8,655.54246611 32.36 S.F. $281.57 $470.90 $752.48246601 114.31 S.F. $994.53 $1,663.26 $2,657.79262897 247.28 S.F. $2,151.30 $3,597.87 $5,749.17245574 307.40 S.F. $2,674.37 $4,472.66 $7,147.03246303 114.31 S.F. $994.53 $1,663.26 $2,657.79245575 64.73 S.F. $563.14 $941.81 $1,504.95245621 64.73 S.F. $563.14 $941.81 $1,504.95245620 285.98 S.F. $2,488.00 $4,160.96 $6,648.95245619 85.98 S.F. $748.03 $1,251.01 $1,999.03245618 336.09 S.F. $2,924.02 $4,890.17 $7,814.18286589 1,105.35 S.F. $9,616.54 $16,082.84 $25,699.39245607 32.36 S.F. $281.57 $470.90 $752.48245598 114.31 S.F. $994.53 $1,663.26 $2,657.79245595 281.47 S.F. $2,448.80 $4,095.40 $6,544.20286590 1,105.47 S.F. $9,617.63 $16,084.66 $25,702.29286592 80.00 S.F. $696.00 $1,164.00 $1,860.00245581 112.03 S.F. $974.67 $1,630.06 $2,604.73245463 88.12 S.F. $766.61 $1,282.09 $2,048.71246313 32.36 S.F. $281.57 $470.90 $752.48240037 32.36 S.F. $281.57 $470.90 $752.48243097 194.46 S.F. $1,691.77 $2,829.34 $4,521.11243096 85.98 S.F. $748.03 $1,251.01 $1,999.03243095 336.09 S.F. $2,924.02 $4,890.17 $7,814.18240915 64.73 S.F. $563.14 $941.81 $1,504.95243075 114.31 S.F. $994.53 $1,663.26 $2,657.79240548 114.31 S.F. $994.53 $1,663.26 $2,657.79242706 112.03 S.F. $974.67 $1,630.06 $2,604.73240025 332.45 S.F. $2,892.30 $4,837.12 $7,729.42243098 64.73 S.F. $563.14 $941.81 $1,504.95240026 132.78 S.F. $1,155.17 $1,931.92 $3,087.08243084 32.36 S.F. $281.57 $470.90 $752.48241879 34.80 S.F. $302.78 $506.37 $809.15239314 32.36 S.F. $281.57 $470.90 $752.48245468 319.50 S.F. $2,779.62 $4,648.68 $7,428.30240542 281.62 S.F. $2,450.11 $4,097.60 $6,547.72240858 147.18 S.F. $1,280.49 $2,141.50 $3,421.99
July 2010 Report Page 9 of 28158
Page 175
240826 85.98 S. F.240643 336.09 S. F.240559 32.36 S.F.242590 87.97 S.F.239302 839.82 S.F.243072 281.62 S.F.235780 32.36 S.F.
233569 114.31 S.F.238673 87.97 S.F.238886 64.73 S.F.239977 32.36 S.F.233319 351.86 S.F.239303 114.31 S.F.243101 34.80 S.F.
238722 87.97 S.F.
Summary for: Une 1100 17,2/4.01 S.h(82 detail records)
Summary for 129 Brick Veneer / Wood Stud Backup (82 detail records)17,274.01 S.F. $150,283.90
$748.03$2,924.02
$281.57$765.30
$7,306.43$2,450.11
$281.57$994.53$765.30$563.14
$281.57$3,061.19
$994.53$302.78$765.30
$150,283.90
$1,251.01$4,890.17
$470.90$1,279.90
$12,219.38$4,097.60
$470.90$1,663.26$1,279.90
$941.81$470.90
$5,119.58$1,663.26
$506.37$1,279.90
$251,336.86
$1,999.03$7,814.18
$752.48$2,045.19
$19,525.81$6,547.72
$752.48$2,657.79$2,045.19$1.504.95
$752,48$8,180.77$2,657.79
$809.15$2,045.19
$40 1,62076
148
1400
RSMeans
2008
Pane!, Shingle & Lap Siding
$3.08
$4.87
$7.95
$251,336.86 $401,620.76
286195
287254
287253
290150285927245624246624
246329
246323
245615
245583
245582
245578
245569245516245488245458
5.25
5.255.25
29.69
5.25
249.92
282.69254.20
60.7578.75
565.39
267.13250.74
60.75
60.75
60.7560.75
S.F.
S.F.
S.F.
S.F.
S.F.
S.F.S.F.
S.F.
S.F.
S.F.
S.F.
S.F.
S.F.
S.F.
S.F.
S.F.
S.F.
$16.17$16.17$16.17$91.44$16.17
$769.74$870.70$782.94$187.11$242.55
$1,741.40$822.75$772.27$187.11$187.11$187.11$187.11
July 2010159
$25.57$25.57$25.57
$144.58$25.57
$1,217.09$1,376.72$1,237.95
$295.85$383.51
$2,753.45$1,300.90$1,221.09
$295.85$295.85$295.85$295.85
Report
$41.74$41.74$41.74
$236.02$41.74
$1,986.84$2,247.42$2,020.89
$482.96$626.06
$4,494.84$2,123.64$1,993.35
$482.96$482.96$482.96$482.96
Page 10 of 28
Page 176
240569 62.44 S.F.246621 78.75 S.F.
243878 255.89 S.F.240047 62.44 S.F.242429 255.06 S.F.242512 304.02 S.F.237629 62.44 S.F.242834 574.85 S.F.
243092 80.44 S.F.243102 255.06 S.F.
242757 271.66 S.F.239324 62.44 S.F.239987 62.44 S.F.
Summary for: Line 1400(30 detail records)
Summary for 148 Panel, Shingle & Lap Siding (30 detail records)4,691.16 S.F.
4,691.16 S.F.
$192.31$242.55$788.14$192.31$785.58$936.38$192.31
$1,770.53$247.75$785.58
$836.70$192.31$192.31
$14,448.76
$304.07$383.51
$1,246.18$304.07
$1,242.14$1,480.58
$304.07$2,799.51
$391.73$1,242.14$1,322.97
$304.07$304.07
$22,845.93
20 Exterior Windows
102
3000
RSMeans
2008
$14,448.76
M,itr
Wood Windows
$223.09
$207.61
$430.70
$22,845.93
$10,931.41$10,172.89
$496.38$626.06
$2,034.32$496.38
$2,027.72$2,416.97
$496.38$4,570.04
$639.48$2,027.72$2,159.67
$496.38$496.38
$37,294.70
$37,294.70
$21,104.30!¦«rei ont' )
237669
239326239989
240049240571
243093245460245490245518
24557024561624632524662.3
251841251843251845
1.00
1.001.001.001.001.00
1.00
1.001.00
1.001.00
1.001.00
1.00
1.00
1.00
Ea.
Ea.
Ea.
Ea.
Ea.
Ea.
Ea.
Ea.
Ea.
Ea.
Ea.
Ea.
Ea.
Ea.
Ea.
Ea.
$223.09$223.09$223.09$223.09$223.09$223.09$223.09$223.09$223.09$223.09$223.09$223.09$223.09$223.09$223.09$223.09
$207.61$207.61$207.61$207.61$207.61$207.61$207.61$207.61$207.61$207.61$207.61$207.61$207.61$207.61$207.61$207.61
$430.70$430.70$430.70$430.70$430.70$430.70$430.70$430.70$430.70$430.70$430.70$430.70$430.70$430.70$430.70$430.70
July 2010160
Report Page 11 of 28
Page 177
251847
251849251851
251853251855
251857251859251861
251863
251865251870
251872
251874251876251878
251880251882
251884
251886251888251890
251892
251894264962
264964
264966
264968
264970264972
264974
264976
264978264980
Summary for: Line 3000(49 detail records)
Summary for 102 Wood Windows (49 detail records)49.00 Ea.
1.00
1.00
1.00
1.001.00
1.001.001.00
1.00
1.001.00
1.00
1.00
1.00
1.00
1.00
1.00
1.001.00
1.001.00
1.00
1.00
1.00
1.00
1.00
1.00
1.001.00
1.00
1.00
1.001.00
49.00
Ea.
Ea.
Ea.
Ea.
Ea.
Ea.
Ea.
Ea.
Ea.
Ea.
Ea.
Ea.
Ea.
Ea.
Ea.
Ea.
Ea.
Ea.
Ea.
Ea.
Ea.
Ea.
Ea.
Ea.
Ea.
Ea.
Ea.
Ea.
Ea.
Ea.
Ea.
Ea.
Ea.
Ea.
$223.09$223.09$223.09$223.09$223.09$223.09$223.09$223.09$223.09$223.09$223.09$223.09$223.09$223.09$223.09$223.09$223.09$223.09$223.09$223.09$223.09
$223.09$223.09$223.09$223.09$223.09$223.09$223.09$223.09$223.09$223.09$223.09$223.09
$10,931.41
$207.61$207.61$207.61$207.61$207.61$207.61$207.61$207.61$207.61$207.61$207.61$207.61$207.61$207.61$207.61$207.61$207.61$207.61$207.61$207.61$207.61$207.61$207.61$207.61$207.61$207.61$207.61$207.61$207.61$207.61$207.61$207.61$207.61
$10,172.89
$10,931.41 $10,172.89
$430.70$430.70$430.70$430.70$430.70$430.70$430.70$430.70$430.70$430.70$430.70$430.70$430.70$430.70$430.70$430.70$430.70$430.70$430.70$430.70$430.70$430.70$430.70$430.70$430.70$430.70$430.70$430.70$430.70$430.70$430.70$430.70$430.70
$21,104.30
$21,104.30
July 2010161
Report Page 12 of 28
Page 178
C Interiors
10 Interior Constructions
10 Partitions
124
1250
RSMeans
2008
Object V) Comments:
290864
291126290889290862290776
2911132456S7
290717
240463
290775269198
268335
268189267927268437
290806
290892
291720290699
278653
290714
291138291137
268334
290852267074291064290950245548
Materials:
Installation:
î.îiïi.- ii.i:-
mstaildiiun,MdK-na!:
$81,942.73 $257,479.95$175,537.22 (599 records)
$81,942.73 $257,479.95$175,537.22 (599 records)
$53,607.73 $187,169.95$133,562.22 (432 records)
Drywall Partitions / Wood Stud Framing$1.15
$2.83
$3.98
Quntity14.58
758.92751.63
85.46758.92
85.46
758.92195.56
20.4285.46
108.83
90.77
40.62
133.1493.04
188.09195.56
16.0685.4690.00
751.63171.92
79.88
98.71
20.42
150.06751.63
85.4620.42
Material
S.F. $16.77S.F. $872.75S.F. $864.37S.F. $98.28S.F. $872.75S.F. $98.28S.F. $872.75S.F. $224.90S.F. $23.48S.F. $98.28S.F. $125.15S.F. $104.38S.F. $46.71S.F. $153.11S.F. $107.00S.F. $216.30S.F. $224.90S.F. $18.46S.F. $98.28S.F. $103.50S.F. $864.37S.F. $197.71S.F. $91.86S.F. $113.51S.F. $23.48S.F. $172.57S.F. $864.37S.F. $98.28S.F. $23.48
Installation
$41.27$2,147.74$2,127.10
$241.85$2,147.74
$241.85$2,147.74
$553.44$57.78
$241.85$307.98$256.87$114.95$376.80$263.31$532.29$553.44
$45.44$241.85$254.70
$2,127.10$486.53$226.06$279.34
$57.78$424.67
$2,127.10$241.85
$57.78
tai Price
$58.04$3,020.49$2,991.47
$340.12$3,020.49
$340.12$3,020.49
$778.34$81.26
$340.12$433.13$361.25$161.67$529.91$370.31$748.59$778.34
$63.90$340.12$358.20
$2,991.47$684.24$317.92$392.85
$81.26$597.24
$2,991.47$340.12
$81.26
July 2010162
Report Page 13 of 28
Page 179
290765 14.58 S.F. $16.77 $41.27 $58.04243099 85.46 S.F. $98.28 $241.85 $340.12290874 85.46 S.F. $98.28 $241.85 $340.12290981 209.09 S.F. $240.45 $591.72 $832.17231493 188.09 S.F. $216.30 $532.29 $748.59243071 14.58 S.F. $16.77 $41.27 $58.04245432 195.56 S.F. $224.90 $553.44 $778.34244081 751.63 S.F. $864.37 $2,127.10 $2,991.47291039 14.58 S.F. $16.77 $41.27 $58.04290763 85.46 S.F. $98.28 $241.85 $340.12291037 85.46 S.F. $98.28 $241.85 $340.12291027 20.42 S.F. $23.48 $57.78 $81.26290928 20.42 S.F. $23.48 $57.78 $81.26290753 20.42 S.F. $23.48 $57.78 $81.26245622 85.46 S.F. $98.28 $241.85 $340.12290940 14.58 S.F. $16.77 $41.27 $58.04290689 14.58 S.F. $16.77 $41.27 $58.04291103 20.42 S.F. $23.48 $57.78 $81.26290951 758.92 S.F. $872.75 $2,147.74 $3,020.49241554 85.46 S.F. $98.28 $241.85 $340.12290687 85.46 S.F. $98.28 $241.85 $340.12290938 85.46 S.F. $98.28 $241.85 $340.12245576 85.46 S.F. $98.28 $241.85 $340.12290677 20.42 S.F. $23.48 $57.78 $81.26290631 188.09 S.F. $216.30 $532.29 $748.59245594 14.58 S.F. $16.77 $41.27 $58.04290959 29.53 S.F. $33.96 $83.57 $117.53290965 66.90 S.F. $76.94 $189.33 $266.27290969 29.53 S.F. $33.96 $83.57 $117.53245566 29.53 S.F. $33.96 $83.57 $117.53245564 36.46 S.F. $41.93 $103.18 $145.10290968 36.46 S.F. $41.93 $103.18 $145.10290964 76.52 S.F. $87.99 $216.54 $304.54245554 66.90 S.F. $76.94 $189.33 $266.27290962 83.16 S.F. $95.64 $235.35 $330.98290958 36.46 S.F. $41.93 $103.18 $145.10290955 66.90 S.F. $76.94 $189.33 $266.27290954 76.52 S.F. $87.99 $216.54 $304.54290953 81.62 S.F. $93.86 $230.99 $324.85245596 83.16 S.F. $95.64 $235.35 $330.98245597 81.62 S.F. $93.86 $230.99 $324.85290952 83.16 S.F. $95.64 $235.35 $330.98
July 2010 Report Page 14 of 28163
Page 180
245599 76.52 S.F. $87.99 $216.54 $304.54245600 66.90 S.F. $76.94 $189.33 $266.27290963 81.62 S.F. $93.86 $230.99 $324.85290932 66.90 S.F. $76.94 $189.33 $266.27245511 29.53 S.F. $33.96 $83.57 $117.53290990 36.46 S.F. $41.93 $103.18 $145.10290987 66.90 S.F. $76.94 $189.33 $266.27290986 76.52 S.F. $87.99 $216.54 $304.54290985 81.62 S.F. $93.86 $230.99 $324.85245550 83.16 S.F. $95.64 $235.35 $330.98245551 81.62 S.F. $93.86 $230.99 $324.85245483 29.53 S.F. $33.96 $83.57 $117.53245498 76.52 S.F. $87.99 $216.54 $304.54245553 76.52 S.F. $87.99 $216.54 $304.54290991 29.53 S.F. $33.96 $83.57 $117.53290948 29.53 S.F. $33.96 $83.57 $117.53245494 81.62 S.F. $93.86 $230.99 $324.85245493 83.16 S.F. $95.64 $235.35 $330.98245509 36.46 S.F. $41.93 $103.18 $145.10290995 83.16 S.F. $95.64 $235.35 $330.98245481 36.46 S.F. $41.93 $103.18 $145.10290984 83.16 S.F. $95.64 $235.35 $330.98245499 66.90 S.F. $76.94 $189.33 $266.27290898 66.90 S.F. $76.94 $189.33 $266.27290920 66.90 S.F. $76.94 $189.33 $266.27290919 76.52 S.F. $87.99 $216.54 $304.54290918 81.62 S.F. $93.86 $230.99 $324.85290917 83.16 S.F. $95.64 $235.35 $330.98290913 29.53 S.F. $33.96 $83.57 $117.53290912 36.46 S.F. $41.93 $103.18 $145.10290909 66.90 S.F. $76.94 $189.33 $266.27290908 76.52 S.F. $87.99 $216.54 $304.54290907 81.62 S.F. $93.86 $230.99 $324.85290906 83.16 S.F. $95.64 $235.35 $330.98290936 29.53 S.F. $33.96 $83.57 $117.53290901 36.46 S.F. $41.93 $103.18 $145.10290923 36.46 S.F. $41.93 $103.18 $145.10290897 76.52 S.F. $87.99 $216.54 $304.54290896 81.62 S.F. $93.86 $230.99 $324.85290895 83.16 S.F. $95.64 $235.35 $330.98290743 81.62 S.F. $93.86 $230.99 $324.85290888 81.62 S.F. $93.86 $230.99 $324.85
July 2010 Report Page 15 of 28164
Page 181
290886 26.13 S.F. $30.05 $73.95 $104.00290885 9.70 S.F. $11.15 $27.45 $38.60290882 29.53 S.F. $33.96 $83.57 $117.53290881 36.46 S.F. $41.93 $103.18 $145.10290878 66.90 S.F. $76.94 $189.33 $266.27290902 29.53 S.F. $33.96 $83.57 $117.53246305 76.52 S.F. $87.99 $216.54 $304.54245612 29.53 S.F. $33.96 $83.57 $117.53290947 36.46 S.F. $41.93 $103.18 $145.10290944 66.90 S.F. $76.94 $189.33 $266.27290943 76.52 S.F. $87.99 $216.54 $304.54290942 81.62 S.F. $93.86 $230.99 $324.85290941 83.16 S.F. $95.64 $235.35 $330.98290996 81.62 S.F. $93.86 $230.99 $324.85290935 36.46 S.F. $41.93 $103.18 $145.10291001 36.46 S.F. $41.93 $103.18 $145.10246300 83.16 S.F. $95.64 $235.35 $330.98246616 29.53 S.F. $33.96 $83.57 $117.53290931 76.52 S.F. $87.99 $216.54 $304.54246614 36.46 S.F. $41.93 $103.18 $145.10246306 66.90 S.F. $76.94 $189.33 $266.27290930 81.62 S.F. $93.86 $230.99 $324.85246316 36.46 S.F. $41.93 $103.18 $145.10246318 29.53 S.F. $33.96 $83.57 $117.53290929 83.16 S.F. $95.64 $235.35 $330.98246599 83.16 S.F. $95.64 $235.35 $330.98246600 81.62 S.F. $93.86 $230.99 $324.85290924 29.53 S.F. $33.96 $83.57 $117.53246603 76.52 S.F. $87.99 $216.54 $304.54246604 66.90 S.F. $76.94 $189.33 $266.27245610 36.46 S.F. $41.93 $103.18 $145.10246301 81.62 S.F. $93.86 $230.99 $324.85243077 66.90 S.F. $76.94 $189.33 $266.27243156 84.90 S.F. $97.64 $240.27 $337.91291098 36.46 S.F. $41.93 $103.18 $145.10291095 66.90 S.F. $76.94 $189.33 $266.27291094 76.52 S.F. $87.99 $216.54 $304.54291093 81.62 S.F. $93.86 $230.99 $324.85291092 83.16 S.F. $95.64 $235.35 $330.98291088 29.53 S.F. $33.96 $83.57 $117.53291087 36.46 S.F. $41.93 $103.18 $145.10291084 66.90 S.F. $76.94 $189.33 $266.27
July 2010 Report Page 16 of 28165
Page 182
243073 83.16 S.F. $95.64 $235.35 $330.98243074 81.62 S.F. $93.86 $230.99 $324.85291104 83.16 S.F. $95.64 $235.35 $330.98243076 76.52 S.F. $87.99 $216.54 $304.54291105 81.62 S.F. $93.86 $230.99 $324.85291082 81.62 S.F. $93.86 $230.99 $324.85243087 36.46 S.F. $41.93 $103.18 $145.10243089 29.53 S.F. $33.96 $83.57 $117.53291081 83.16 S.F. $95.64 $235.35 $330.98291077 29.53 S.F. $33.96 $83.57 $117.53291076 36.46 S.F. $41.93 $103.18 $145.10291073 66.90 S.F. $76.94 $189.33 $266.27291072 76.52 S.F. $87.99 $216.54 $304.54291071 81.62 S.F. $93.86 $230.99 $324.85291070 83.16 S.F. $95.64 $235.35 $330.98245467 81.62 S.F. $93.86 $230.99 $324.85291083 76.52 S.F. $87.99 $216.54 $304.54291128 81.62 S.F. $93.86 $230.99 $324.85239970 66.90 S.F. $76.94 $189.33 $266.27239980 36.46 S.F. $41.93 $103.18 $145.10239982 29.53 S.F. $33.96 $83.57 $117.53240023 83.16 S.F. $95.64 $235.35 $330.98240024 81.62 S.F. $93.86 $230.99 $324.85291134 29.53 S.F. $33.96 $83.57 $117.53291133 36.46 S.F. $41.93 $103.18 $145.10240029 76.52 S.F. $87.99 $216.54 $304.54240030 66.90 S.F. $76.94 $189.33 $266.27291130 66.90 S.F. $76.94 $189.33 $266.27240040 36.46 S.F. $41.93 $103.18 $145.10291099 29.53 S.F. $33.96 $83.57 $117.53291129 76.52 S.F. $87.99 $216.54 $304.54243157 76.52 S.F. $87.99 $216.54 $304.54291127 83.16 S.F. $95.64 $235.35 $330.98240545 83.16 S.F. $95.64 $235.35 $330.98240546 81.62 S.F. $93.86 $230.99 $324.85291111 29.53 S.F. $33.96 $83.57 $117.53240551 76.52 S.F. $87.99 $216.54 $304.54240552 66.90 S.F. $76.94 $189.33 $266.27291110 36.46 S.F. $41.93 $103.18 $145.10240562 36.46 S.F. $41.93 $103.18 $145.10240564 29.53 S.F. $33.96 $83.57 $117.53291107 66.90 S.F. $76.94 $189.33 $266.27
July 2010 Report Page 17 of 28166
Page 183
291106 76.52 S.F. $87.99 $216.54 $304.54240042 29.53 S.F. $33.96 $83.57 $117.53291008 76.52 S.F. $87.99 $216.54 $304.54243155 83.16 S.F. $95.64 $235.35 $330.98243218 9.70 S.F. $11.15 $27.45 $38.60243220 26.13 S.F. $30.05 $73.95 $104.00243350 81.62 S.F. $93.86 $230.99 $324.85291020 66.90 S.F. $76.94 $189.33 $266.27291019 76.52 S.F. $87.99 $216.54 $304.54291018 81.62 S.F. $93.86 $230.99 $324.85291017 83.16 S.F. $95.64 $235.35 $330.98291013 29.53 S.F. $33.96 $83.57 $117.53291012 36.46 S.F. $41.93 $103.18 $145.10245435 83.16 S.F. $95.64 $235.35 $330.98291023 36.46 S.F. $41.93 $103.18 $145.10291009 66.90 S.F. $76.94 $189.33 $266.27291024 29.53 S.F. $33.96 $83.57 $117.53245440 76.52 S.F. $87.99 $216.54 $304.54245441 66.90 S.F. $76.94 $189.33 $266.27291007 81.62 S.F. $93.86 $230.99 $324.85245451 36.46 S.F. $41.93 $103.18 $145.10245453 29.53 S.F. $33.96 $83.57 $117.53291006 83.16 S.F. $95.64 $235.35 $330.98291002 29.53 S.F. $33.96 $83.57 $117.53245466 83.16 S.F. $95.64 $235.35 $330.98290998 66.90 S.F. $76.94 $189.33 $266.27290997 65.10 S.F. $74.86 $184.23 $259.10245471 76.52 S.F. $87.99 $216.54 $304.54245436 81.62 S.F. $93.86 $230.99 $324.85239300 83.16 S.F. $95.64 $235.35 $330.98243158 66.90 S.F. $76.94 $189.33 $266.27243166 36.46 S.F. $41.93 $103.18 $145.10233182 83.16 S.F. $95.64 $235.35 $330.98233224 81.62 S.F. $93.86 $230.99 $324.85291061 26.13 S.F. $30.05 $73.95 $104.00235112 76.52 S.F. $87.99 $216.54 $304.54235177 66.90 S.F. $76.94 $189.33 $266.27291060 9.70 S.F. $11.15 $27.45 $38.60236390 36.46 S.F. $41.93 $103.18 $145.10237093 29.53 S.F. $33.96 $83.57 $117.53291051 84.90 S.F. $97.64 $240.27 $337.91243168 29.53 S.F. $33.96 $83.57 $117.53
July 2010 Report Page 18 of 28167
Page 184
291034 36.46 S.F. $41.93 $103.18 $145.10245472 66.90 S.F. $76.94 $189.33 $266.27239301 81.62 S.F. $93.86 $230.99 $324.85291031 66.90 S.F. $76.94 $189.33 $266.27291030 76.52 S.F. $87.99 $216.54 $304.54239306 65.10 S.F. $74.86 $184.23 $259.10239307 66.90 S.F. $76.94 $189.33 $266.27291029 81.62 S.F. $93.86 $230.99 $324.85239317 36.46 S.F. $41.93 $103.18 $145.10239319 29.53 S.F. $33.96 $83.57 $117.53291028 83.16 S.F. $95.64 $235.35 $330.98239963 83.16 S.F. $95.64 $235.35 $330.98239964 81.62 S.F. $93.86 $230.99 $324.85291035 29.53 S.F. $33.96 $83.57 $117.53290761 29.53 S.F. $33.96 $83.57 $117.53290727 29.53 S.F. $33.96 $83.57 $117.53290780 66.90 S.F. $76.94 $189.33 $266.27290748 36.46 S.F. $41.93 $103.18 $145.10290779 76.52 S.F. $87.99 $216.54 $304.54290731 83.16 S.F. $95.64 $235.35 $330.98290778 81.62 S.F. $93.86 $230.99 $324.85290777 83.16 S.F. $95.64 $235.35 $330.98290773 29.53 S.F. $33.96 $83.57 $117.53290772 36.46 S.F. $41.93 $103.18 $145.10290769 66.90 S.F. $76.94 $189.33 $266.27290768 76.52 S.F. $87.99 $216.54 $304.54290767 81.62 S.F. $93.86 $230.99 $324.85290766 83.16 S.F. $95.64 $235.35 $330.98290691 81.62 S.F. $93.86 $230.99 $324.85290693 66.90 S.F. $76.94 $189.33 $266.27290744 76.52 S.F. $87.99 $216.54 $304.54290640 36.46 S.F. $41.93 $103.18 $145.10290637 66.90 S.F. $76.94 $189.33 $266.27290636 76.52 S.F. $87.99 $216.54 $304.54290635 81.62 S.F. $93.86 $230.99 $324.85290697 29.53 S.F. $33.96 $83.57 $117.53290692 76.52 S.F. $87.99 $216.54 $304.54290732 81.62 S.F. $93.86 $230.99 $324.85290755 81.62 S.F. $93.86 $230.99 $324.85290756 76.52 S.F. $87.99 $216.54 $304.54290757 66.90 S.F. $76.94 $189.33 $266.27290696 36.46 S.F. $41.93 $103.18 $145.10
July 2010 Report Page 19 of 28168
Page 185
290760 36.46 S.F. $41.93 $103.18 $145.10290787 83.16 S.F. $95.64 $235.35 $330.98290634 83.16 S.F. $95.64 $235.35 $330.98290812 66.90 S.F. $76.94 $189.33 $266.27290783 36.46 S.F. $41.93 $103.18 $145.10290820 83.16 S.F. $95.64 $235.35 $330.98239969 76.52 S.F. $87.99 $216.54 $304.54290721 81.62 S.F. $93.86 $230.99 $324.85290720 83.16 S.F. $95.64 $235.35 $330.98290711 26.13 S.F. $30.05 $73.95 $104.00290815 36.46 S.F. $41.93 $103.18 $145.10290710 9.70 S.F. $11.15 $27.45 $38.60290811 76.52 S.F. $87.99 $216.54 $304.54290810 81.62 S.F. $93.86 $230.99 $324.85290809 83.16 S.F. $95.64 $235.35 $330.98290713 81.62 S.F. $93.86 $230.99 $324.85290745 66.90 S.F. $76.94 $189.33 $266.27290877 76.52 S.F. $87.99 $216.54 $304.54290816 29.53 S.F. $33.96 $83.57 $117.53290680 76.52 S.F. $87.99 $216.54 $304.54290733 76.52 S.F. $87.99 $216.54 $304.54290788 81.62 S.F. $93.86 $230.99 $324.85290789 76.52 S.F. $87.99 $216.54 $304.54290790 66.90 S.F. $76.94 $189.33 $266.27290793 36.46 S.F. $41.93 $103.18 $145.10290722 76.52 S.F. $87.99 $216.54 $304.54290794 29.53 S.F. $33.96 $83.57 $117.53290784 29.53 S.F. $33.96 $83.57 $117.53290701 84.90 S.F. $97.64 $240.27 $337.91290702 76.52 S.F. $87.99 $216.54 $304.54290703 66.90 S.F. $76.94 $189.33 $266.27290706 36.46 S.F. $41.93 $103.18 $145.10290707 29.53 S.F. $33.96 $83.57 $117.53290723 66.90 S.F. $76.94 $189.33 $266.27290700 83.16 S.F. $95.64 $235.35 $330.98290855 76.52 S.F. $87.99 $216.54 $304.54290832 81.62 S.F. $93.86 $230.99 $324.85290833 76.52 S.F. $87.99 $216.54 $304.54290834 66.90 S.F. $76.94 $189.33 $266.27290837 36.46 S.F. $41.93 $103.18 $145.10290838 29.53 S.F. $33.96 $83.57 $117.53290738 29.53 S.F. $33.96 $83.57 $117.53
July 2010 Report Page 20 of 28169
Page 186
290842 83.16 S.F. $95.64 $235.35 $330.98290843 81.62 S.F. $93.86 $230.99 $324.85290844 76.52 S.F. $87.99 $216.54 $304.54290678 83.16 S.F. $95.64 $235.35 $330.98290845 66.90 S.F. $76.94 $189.33 $266.27290848 36.46 S.F. $41.93 $103.18 $145.10290849 29.53 S.F. $33.96 $83.57 $117.53290641 29.53 S.F. $33.96 $83.57 $117.53290865 83.16 S.F. $95.64 $235.35 $330.98290876 84.90 S.F. $97.64 $240.27 $337.91290875 83.16 S.F. $95.64 $235.35 $330.98290872 29.53 S.F. $33.96 $83.57 $117.53290871 36.46 S.F. $41.93 $103.18 $145.10290868 66.90 S.F. $76.94 $189.33 $266.27290853 83.16 S.F. $95.64 $235.35 $330.98290866 81.62 S.F. $93.86 $230.99 $324.85290854 81.62 S.F. $93.86 $230.99 $324.85290742 83.16 S.F. $95.64 $235.35 $330.98290679 81.62 S.F. $93.86 $230.99 $324.85290860 29.53 S.F. $33.96 $83.57 $117.53290859 36.46 S.F. $41.93 $103.18 $145.10290856 66.90 S.F. $76.94 $189.33 $266.27290827 29.53 S.F. $33.96 $83.57 $117.53290867 76.52 S.F. $87.99 $216.54 $304.54290690 83.16 S.F. $95.64 $235.35 $330.98290831 83.16 S.F. $95.64 $235.35 $330.98290734 66.90 S.F. $76.94 $189.33 $266.27290658 76.52 S.F. $87.99 $216.54 $304.54290685 29.53 S.F. $33.96 $83.57 $117.53290657 81.62 S.F. $93.86 $230.99 $324.85290662 36.46 S.F. $41.93 $103.18 $145.10290749 29.53 S.F. $33.96 $83.57 $117.53290663 29.53 S.F. $33.96 $83.57 $117.53290652 29.53 S.F. $33.96 $83.57 $117.53290651 36.46 S.F. $41.93 $103.18 $145.10290648 66.90 S.F. $76.94 $189.33 $266.27290647 65.10 S.F. $74.86 $184.23 $259.10290646 81.62 S.F. $93.86 $230.99 $324.85290645 83.16 S.F. $95.64 $235.35 $330.98290656 83.16 S.F. $95.64 $235.35 $330.98290674 29.53 S.F. $33.96 $83.57 $117.53290726 36.46 S.F. $41.93 $103.18 $145.10
July 2010 Report Page 21 of 28170
Page 187
290826 36.46 S.F. $41.93 $103.18 $145.10290823 66.90 S.F. $76.94 $189.33 $266.27290681 66.90 S.F. $76.94 $189.33 $266.27290822 65.10 S.F. $74.86 $184.23 $259.10290659 66.90 S.F. $76.94 $189.33 $266.27290737 36.46 S.F. $41.93 $103.18 $145.10290754 83.16 S.F. $95.64 $235.35 $330.98290673 36.46 S.F. $41.93 $103.18 $145.10290670 66.90 S.F. $76.94 $189.33 $266.27290669 76.52 S.F. $87.99 $216.54 $304.54290668 81.62 S.F. $93.86 $230.99 $324.8529066/ 83.16 S.F. $95.64 $235.35 $330.98290684 36.46 S.F. $41.93 $103.18 $145.10290821 81.62 S.F. $93.86 $230.99 $324.85
Summary for: line 1250 29,832.21 S.F. $34,307.04 $84,425.15 $118,732.18(j/9 detail records)
1600 $2.18
RSMeans $5.55
2008 $/./3
291846 38.67 S.F. $84.29 $214.60 $298.89290741 199.15 S.F. $434.16 $1,105.30 $1,539.46291147 127.19 S.F. $277.28 $705.93 $983.21240022 195.74 S.F. $426.70 $1,086.33 $1,513.04290719 174.54 S.F. $380.51 $968.72 $1,349.23290730 176.18 S.F. $384.08 $977.83 $1,361.91243067 188.13 S.F. $410.11 $1,044.09 $1,454.21290752 159.96 S.F. $348.72 $887.78 $1,236.50291091 199.15 S.F. $434.16 $1,105.30 $1,539.46290688 184.57 S.F. $402.36 $1,024.37 $1,426.73291102 159.96 S.F. $348.72 $887.78 $1,236.50290807 174.54 S.F. $380.51 $968.72 $1,349.23290718 174.54 S.F. $380.51 $968.72 $1,349.23290819 132.30 S.F. $288.41 $734.26 $1,022.67290927 159.96 S.F. $348.72 $887.78 $1,236.50290916 199.15 S.F. $434.16 $1,105.30 $1,539.46291080 176.18 S.F. $384.08 $977.83 $1,361.91246970 176.18 S.F. $384.08 $977.83 $1,361.91290797 176.18 S.F. $384.08 $977.83 $1,361.91291005 174.54 S.F. $380.51 $968.72 $1,349.23290808 174.54 S.F. $380.51 $968.72 $1,349.23
July 2010171
Report Page 22 of 28
Page 188
290841 188.63 S.F.291881 129.80 S.F.290905 175.96 S.F.245492 199.15 S.F.290994 132.30 S.F.245520 162.60 S.F.
290983 174.54 S.F.290982 174.54 S.F.290972 175.96 S.F.245593 159.96 S.F.290939 159.96 S.F.245465 176.18 S.F.290633 174.54 S.F.290666 188.63 S.F.291069 174.54 S.F.231936 174.54 S.F.231998 174.54 S.F.
291068 174.54 S.F.290655 174.54 S.F.291038 67.08 S.F.290830 174.54 S.F.239299 132.30 S.F.290894 174.54 S.F.290632 174.54 S.F.
239962 174.54 S.F.290764 159.96 S.F.291016 188.63 S.F.245433 174.54 S.F.245434 174.54 S.F.290893 174.54 S.F.290863 184.57 S.F.
290644 132.30 S.F.
Summary for: Line 1600 8,853.53 S.F.(53 detail records)
Summary for 124 Drywall Partitions / Wood Stud Framing (432 detail records)38,685.73 S.F. $53,607.73
$411.21$282.95$383.59$434.16$288.41$354.48$380.51$380.51$383.59$348.72$348.72$384.08$380.51$411.21$380.51$380.51$380.51$380.51$380.51$146.24$380.51$288.41$380.51$380.51$380.51$348.72$411.21$380.51$380.51$380.51$402.36$288.41
$19,300.69
$1,046.88$720.36$976.57
$1,105.30$734.26$902.45$968.72$968.72$976.57$887.78$887.78$977.83$968.72
$1,046.88$968.72$968.72$968.72$968.72$968.72$372.31$968.72$734.26$968.72$968.72$968.72$887.78
$1,046.88$968.72$968.72$968.72
$1,024.37$734.26
$49,137.07
$1,458.08$1,003.32$1,360.16$1,539.46$1,022.67$1,256.93$1,349.23$1,349.23$1,360.16$1,236.50$1,236.50$1,361.91$1,349.23$1,458.08$1,349.23$1,349.23$1,349.23$1,349.23$1,349.23
$518.55$1,349.23$1,022.67$1,349.23$1,349.23$1,349.23$1,236.50$1,458.08$1,349.23$1,349.23$1,349.23$1,426.73$1,022.67
$68,437.76
20 Interior DoorsRevit Family: Overhead-Rolling
' 102
Material:
Installation:
$133,562.22
$28,335.00$41,975.00
$187,169.95
$70,310.00(167 record?)
Speciel Doors
July 2010172
Report Page 23 of 28
Page 189
SOOO
RSMeans
2008
270136
274522
Summary for: Line 5000(2 detail records)
Summary for 102 Speciel Doors (2 detail records)
$1,050.00
$775.00
$1,825.00
Oürvüíy1.00 Ea.
1.00 Ea.
2.00 Ea.
$1,050.00$1,050.00$2,100.00
$775.00$775.00
$1,550.00
2.00 Ea. $2,100.00 $1,550.00
120
1600
RSMeans
2008
290712
290716290724
290735
290746
290758290770290781290791
290813
290824
290835
290846
290857290869
235306
239309
239972
240032
240554
243079
243160
243221
245035245443
Wood Door/Wood Frame
$159.00 ; ;
$245.00
$404.00Oiintitu
1.00
1.001.00
1.001.00
1.001.00
1.00
1.00
1.00
1.00
1.00
1.00
1.001.00
1.00
1.00
1.00
1.00
1.00
1.00
1.00
1.00
1.001.00
Ea.
Ea.
Ea.
Ea.
Ea.
Ea.
Ea.
Ea.
Ea.
Ea.
Ea.
Ea.
Ea.
Ea.
Ea.
Ea.
Ea.
Ea.
Ea.
Ea.
Ea.
Ea.
Ea.
Ea.
Ea.
$159.00$159.00$159.00$159.00$159.00$159.00$159.00$159.00$159.00$159.00$159.00$159.00$159.00$159.00$159.00$159.00$159.00$159.00$159.00$159.00$159.00$159.00$159.00$159.00$159.00
$1,825.00$1,825.00$3,650.00
$3,650.00
July 2010173
$245.00$245.00$245.00$245.00$245.00$245.00$245.00$245.00$245.00$245.00$245.00$245.00$245.00$245.00$245.00$245.00$245.00$245.00$245.00$245.00$245.00$245.00$245.00$245.00$245.00
Report
$404.00$404.00$404.00$404.00$404.00$404.00$404.00$404.00$404.00$404.00$404.00$404.00$404.00$404.00$404.00$404.00$404.00$404.00$404.00$404.00$404.00$404.00$404.00$404.00$404.00
Page 24 of 28
Page 190
245474 1.00 Ea. $159.00 $245.00 $404.00245501 1.00 Ea. $159.00 $245.00 $404.00245556 1.00 Ea. $159.00 $245.00 $404.00245602 1.00 Ea. $159.00 $245.00 $404.00246308 1.00 Ea. $159.00 $245.00 $404.00246606 1.00 Ea. $159.00 $245.00 $404.00290638 1.00 Ea. $159.00 $245.00 $404.00290649 1.00 Ea. $159.00 $245.00 $404.00290660 1.00 Ea. $159.00 $245.00 $404.00290671 1.00 Ea. $159.00 $245.00 $404.00290682 1.00 Ea. $159.00 $245.00 $404.00290694 1.00 Ea. $159.00 $245.00 $404.00290704 1.00 Ea. $159.00 $245.00 $404.00290879 1.00 Ea. $159.00 $245.00 $404.00290887 1.00 Ea. $159.00 $245.00 $404.00290891 1.00 Ea. $159.00 $245.00 $404.00290899 1.00 Ea. $159.00 $245.00 $404.00290910 1.00 Ea. $159.00 $245.00 $404.00290921 1.00 Ea. $159.00 $245.00 $404.00290933 1.00 Ea. $159.00 $245.00 $404.00290945 1.00 Ea. $159.00 $245.00 $404.00290956 1.00 Ea. $159.00 $245.00 $404.00290966 1.00 Ea. $159.00 $245.00 $404.00290988 1.00 Ea. $159.00 $245.00 $404.00290999 1.00 Ea. $159.00 $245.00 $404.00291010 1.00 Ea. $159.00 $245.00 $404.00291021 1.00 Ea. $159.00 $245.00 $404.00291032 1.00 Ea. $159.00 $245.00 $404.00291062 1.00 Ea. $159.00 $245.00 $404.00291066 1.00 Ea. $159.00 $245.00 $404.00291074 1.00 Ea. $159.00 $245.00 $404.00291085 1.00 Ea. $159.00 $245.00 $404.00291096 1.00 Ea. $159.00 $245.00 $404.00291108 1.00 Ea. $159.00 $245.00 $404.00291131 1.00 Ea. $159.00 $245.00 $404.00291141 1.00 Ea. $159.00 $245.00 $404.00290709 1.00 Ea. $159.00 $245.00 $404.00290725 1.00 Ea. $159.00 $245.00 $404.00290729 1.00 Ea. $159.00 $245.00 $404.00290736 1.00 Ea. $159.00 $245.00 $404.00290740 1.00 Ea. $159.00 $245.00 $404.00290747 1.00 Ea. $159.00 $245.00 $404.00
July 2010 Report Page 25 of 28174
Page 191
290751 1.00 Ea. $159.00 $245.00 $404.00290759 1.00 Ea. $159.00 $245.00 $404.00290762 1.00 Ea. $159.00 $245.00 $404.00290771 1.00 Ea. $159.00 $245.00 $404.00290774 1.00 Ea. $159.00 $245.00 $404.00290782 1.00 Ea. $159.00 $245.00 $404.00290786 1.00 Ea. $159.00 $245.00 $404.00290792 1.00 Ea. $159.00 $245.00 $404.00290796 1.00 Ea. $159.00 $245.00 $404.00290814 1.00 Ea. $159.00 $245.00 $404.00290818 1.00 Ea. $159.00 $245.00 $404.00290825 1.00 Ea. $159.00 $245.00 $404.00290829 1.00 Ea. $159.00 $245.00 $404.00290836 1.00 Ea. $159.00 $245.00 $404.00290840 1.00 Ea. $159.00 $245.00 $404.00290847 1.00 Ea. $159.00 $245.00 $404.00290851 1.00 Ea. $159.00 $245.00 $404.00290858 1.00 Ea. $159.00 $245.00 $404.00290861 1.00 Ea. $159.00 $245.00 $404.00235345 1.00 Ea. $159.00 $245.00 $404.00237545 1.00 Ea. $159.00 $245.00 $404.00239311 1.00 Ea. $159.00 $245.00 $404.00239322 1.00 Ea. $159.00 $245.00 $404.00239974 1.00 Ea. $159.00 $245.00 $404.00239985 1.00 Ea. $159.00 $245.00 $404.00240034 1.00 Ea. $159.00 $245.00 $404.00240045 1.00 Ea. $159.00 $245.00 $404.00240556 1.00 Ea. $159.00 $245.00 $404.00240567 1.00 Ea. $159.00 $245.00 $404.00243081 1.00 Ea. $159.00 $245.00 $404.00243090 1.00 Ea. $159.00 $245.00 $404.00243162 1.00 Ea. $159.00 $245.00 $404.00243171 1.00 Ea. $159.00 $245.00 $404.00245445 1.00 Ea. $159.00 $245.00 $404.00245456 1.00 Ea. $159.00 $245.00 $404.00245476 1.00 Ea. $159.00 $245.00 $404.00245486 1.00 Ea. $159.00 $245.00 $404.00245503 1.00 Ea. $159.00 $245.00 $404.00245514 1.00 Ea. $159.00 $245.00 $404.00245558 1.00 Ea. $159.00 $245.00 $404.00245567 1.00 Ea. $159.00 $245.00 $404.00245604 1.00 Ea. $159.00 $245.00 $404.00
July 2010 Report Page 26 of 28175
Page 192
245613 1.00 Ea. $159.00 $245.00 $404.00246310 1.00 Ea. $159.00 $245.00 $404.00246321 1.00 Ea. $159.00 $245.00 $404.00246608 1.00 Ea. $159.00 $245.00 $404.00246619 1.00 Ea. $159.00 $245.00 $404.00290639 1.00 Ea. $159.00 $245.00 $404.00290643 1.00 Ea. $159.00 $245.00 $404.00290650 1.00 Ea. $159.00 $245.00 $404.00290654 1.00 Ea. $159.00 $245.00 $404.00290661 1.00 Ea. $159.00 $245.00 $404.00290665 1.00 Ea. $159.00 $245.00 $404.00290672 1.00 Ea. $159.00 $245.00 $404.00290676 1.00 Ea. $159.00 $245.00 $404.00290683 1.00 Ea. $159.00 $245.00 $404.00290686 1.00 Ea. $159.00 $245.00 $404.00290695 1.00 Ea. $159.00 $245.00 $404.00290698 1.00 Ea. $159.00 $245.00 $404.00290705 1.00 Ea. $159.00 $245.00 $404.00290870 1.00 Ea. $159.00 $245.00 $404.00290873 1.00 Ea. $159.00 $245.00 $404.00290880 1.00 Ea. $159.00 $245.00 $404.00290884 1.00 Ea. $159.00 $245.00 $404.00290900 1.00 Ea. $159.00 $245.00 $404.00290904 1.00 Ea. $159.00 $245.00 $404.00290911 1.00 Ea. $159.00 $245.00 $404.00290915 1.00 Ea. $159.00 $245.00 $404.00290922 1.00 Ea. $159.00 $245.00 $404.00290926 1.00 Ea. $159.00 $245.00 $404.00290934 1.00 Ea. $159.00 $245.00 $404.00290937 1.00 Ea. $159.00 $245.00 $404.00290946 1.00 Ea. $159.00 $245.00 $404.00290949 1.00 Ea. $159.00 $245.00 $404.00290957 1.00 Ea. $159.00 $245.00 $404.00290961 1.00 Ea. $159.00 $245.00 $404.00290967 1.00 Ea. $159.00 $245.00 $404.00290971 1.00 Ea. $159.00 $245.00 $404.00290989 1.00 Ea. $159.00 $245.00 $404.00290993 1.00 Ea. $159.00 $245.00 $404.00291000 1.00 Ea. $159.00 $245.00 $404.00291004 1.00 Ea. $159.00 $245.00 $404.00291011 1.00 Ea. $159.00 $245.00 $404.00291015 1.00 Ea. $159.00 $245.00 $404.00
July 2010 Report Page 27 of 28176
Page 193
291022 1.00291026 1.00
291033 1.00291036 1.00291075 1.00291079 1.00291086 1.00291090 1.00
291097 1.00291101 1.00
291109 1.00291112 1.00291132 1.00291136 1.00
Summary for: Line 1600 165.00(165 detail records)
Summary for 120 Wood Door/Wood Frame (165 detail records)165.00 Ea.
Ea.
Ea.
Ea.
Ea.
Ea.
Ea.
Ea.
Ea.
Ea.
Ea.
Ea.
Ea.
Ea.
Ea.
Ea.
$159.00$159.00$159.00$159.00$159.00$159.00$159.00$159.00$159.00$159.00$159.00$159.00$159.00$159.00
$26,235.00
$245.00$245.00$245.00$245.00$245.00$245.00$245.00$245.00$245.00$245.00$245.00$245.00$245.00$245.00
$40,425.00
$26,235.00 $40,425.00
$404.00$404.00$404.00$404.00$404.00$404.00$404.00$404.00$404.00$404.00$404.00$404.00$404.00$404.00
$66,660.00
$66,660.00
Grand Total $640,028.96 $673,579.62 $1,313,608.59
July 2010177
Report Page 28 of 28
Page 194
TWBS Cost Estimate - Level IVMaterial Installation
$639,657.84 $673,579.63 $1,313,237.47
04 00 00. Masonary04 01 00. Maintenance of Masonry
04 01 20. Maintenance of Unit MasonrySource: RSMeans Price Year: 2008
04 0120.52 Unit Masonry CleaningWash smooth brick
04 05 00. Common Work Results for Masonry04 05 19. Masonry Anchorage and Reinforcing
Sou-ce: RSMeans Price Year: 2008
04 05 19.16 Masonry Anchors
Wall ties, corrugated, 7/8" ? 7", 22 guage04 05 23. Masonry Accessories
Source: RSMeans Price Year: 2008
04 05 23.16 Masonry Embedded Flashing
Flashing, copper, paperbacked
04 21 00. Clay Unit Masonry04 21 13. Brick Masonry
Source: RSMeans Price Year: 2008
04 21 13.13 Brick Veneer Masonry
Standard brick wall, 4" thick, running bond
$105,544.21 $193,468.93 $299,013.13
$690.96 $14,682.91 $15,373.87
$690.96 $14,682.91 $15,373.87
Matenai Installation Total
$690.96 $14,682.91 $15,373.87
$2,072.88 $7,773.31 $9,846.19
$345.48 $2,418.36 $2,763.84
Material installation Total
$345.48 $2,418.36 $2,763.84
$1,727.40Material
$1,727.40
$5,354.94
Installation
$5,354.94
$7,082.34
Total
$7,082.34
$102,780.37 $171,012.71 $273,793.08
$102,780.37 $171,012.71 $273,793.08Material Installation Total
$102,780.37 $171,012.71 $273,793.08
July 2010178
Report Page 1 of 8
Page 195
05 00 00. Metals $16,064.83 $15,028.39 $31,093.22
05 12 00. Structural Steel Framing $16,064.83 $15,028.39 $31,093.2205 12 23. Structural Steel for Buildings
Source: RSMeans Price Year: 2008 $16,064.83 $15,028.39 $31,093.2205 12 23.00 Material Installation Total
Shelf angle $16,064.83 $15,028.39 $31,093.22
July 2010179
Report Page 2 of 8
Page 196
06 00 00. Wood, Plastics, and CompositesComposites
06 10 00. ROUGH CARPENTRY06 10 53. Miscellaneous Rough Carpentry
Source: RSMeans Price Year: 2008
06 10 53.00
Framing rough opening, header w/jacks
06 11 00. Wood Framing06 11 16. Mechanically Graded Lumber
Source: RSMeans Price Year: 2008
06 11 16.00
Beams and girders, structural grade, 8x12"
Framing joists fir 4x12"
Framing joists, 2x6"
Framing, 2x4 wood studs @ 16 O.C, 10'high
Partitions, 2" ? 4" stud 8' high 16" O.C.
Wood stud partion, backup, 2" ? 4" @ 16" O.C.
06 16 00. Sheathing06 16 23. Subflooring
Source: RSMeans Price Year: 2008
06 16 23.00
Subfloor plywood CDX 3/4"06 16 53. Moisture-Resistant Sheathing Board
Source: RSMeans Price Year: 2008
06 16 53.00
Sheathing plywood on wall CDX 1/2"
Sheating, plywood, CDX, 1/2"
06 20 00. FINISH CARPENTRY06 20 13. Exterior Finish Carpentry
Source: RSMeans Price Year: 2008
06 20 13.00
Siding plywood texture 1-11 fir 5/8", natural
06 46 00. Wood Trim
July 2010180
$227,472.64 $182,800.80 $410,273.44
$445.90 $1,179.92 $1,625.82
$445.90 $1,179.92 $1,625.82Material Installation Total
$445.90 $1,179.92 $1,625.82
$159,805.82 $94,496.79 $254,302.62
$159,805.82 $94,496.79 $254,302.62Material Installation Total
$74,966.46 $7,422.42 $82,388.88
$44,534.53 $12,989.24 $57,523.77
$18,927.18 $23,751.75 $42,678.93
$12,231.21 $28,340.60 $40,571.80
$2,064.11 $5,582.48 $7,646.59
$7,082.34 $16,410.31 $23,492.66
$50,003.38 $45,376.59 $95,379.96
$37,483.23 $29,689.69 $67,172.92Material installation Total
$37,483.23 $29,689.69 $67,172.92
$12,520.15 $15,686.90 $28,207.04Material Installation Total
$2,673.96 $3,940.57 $6,614.53
$9,846.19 $11,746.33 $21,592.51
$5,817.03 $6,614.53 $12,431.57
$5,817.03 $6,614.53 $12,431.57Material Installation Total
$5,817.03 $6,614.53 $12,431.57
$1,665.51 $2,132.97 $3,798.48
Report Page 3 of 8
Page 197
06 46 13. Wood Door and Window CasingsSource: RSMeans Price Year: 2008
06 46 13.00
Casing, stock pine ll/16"x 2-1/2"06 46 33. "Wood Stops, Stools, and Sills"
Source: RSMeans Price Year: 2008
06 46 33.00
Stool cap, pine ll/16"x 2-1/2"
06 48 00. Wood Frames06 48 16. Interior Wood Door Frames
Source: RSMeans Price Year: 2008
06 48 16.00
Wood frame, Pine, drywall, 4-7/8" deep, 2'-8"x68" single
$1,089.76 $1,552.32 $2,642.08
Material Installation Total
$1,089.76 $1,552.32 $2,642.08
$575.75 $580.65 $1,156.40
Material Installation Total
$575.75 $580.65 $1,156.40
$9,735.00 $33,000.00 $42,735.00
$9,735.00 $33,000.00 $42,735.00Material Installation Total
$9,735.00 $33,000.00 $42,735.00
July 2010181
Report Page 4 of 8
Page 198
07 00 00. Thermal and Moisture ProtectionProtection
07 11 00. Dampproofing07 11 19. Sheet Dampproofing
Source: RSMeans Price Year: 2008
0"/ 1.1. 19.00
Building paper, asphalt felt sheating paper 15 Ib
Building paper, asphalt felt, 15 Ib.
07 21 00. Thermal Insulation07 21 13. Board Insulation
Source: RSMeans Price Year: 2008
07 71 13.16 Fibrous Board Insulation
Fiberglass insulation batts, paper or foil back, 3-1/2", RIl
Fiberglass insulation, batts, 3-1/2" thick paperbacking
07 91 00. Preformed Joint Seals07 91 23. Backer Rods
Source: RSMeans Price Year: 2008
07 91.23.00
Joint backer road
07 92 00. Joint Sealants07 92 13. Elastomeric Joint Sealants
Source: RSMeans Price Year: 2008
07 92 13.00
Sealant
$14,842.49 $16,761.92 $31,604.42
$1,098.26 $2,855.47 $3,953.73
$1,098.26 $2,855.47 $3,953.73Material Installation Total
$234.56 $609.85 $844.41
$863.70 $2,245.62 $3,109.32
$13,398.75 $7,687.81 $21,086.56
$13,398.75 $7,687.81 $21,086.56
Material Installation Tota!
$2,861.61 $1,641.90 $4,503.51
$10,537.15 $6,045.90 $16,583.05
$0.00 $1,727.40 $1,727.40
$0.00Material
$0.00
$345.48
$345.48
Material
$345.48
$1,727.40installation
$1,727.40
$4,491.24
$4,491.24
Installation
$4,491.24
$1,727.40Total
$1,727.40
$4,836.72
$4,836.72Total
$4,836.72
July 2010182
Report Page 5 of 8
Page 199
08 00 00. Opennings08 14 00. Wood Doors
08 14 16. Flush Wood Doors
Source: RSMeans
08 14 16.00
Price Year: 2008
Wood door, flush, luan face, hollow core, 3-5/8"thick, 2'-8"x6'-8"
08 52 00. Wood Windows08 52 69. Wood Storm Windows
Source: RSMeans Price Year: 2008
08 52 69.00
Resdential wood window, double hung, 2'-8"x4'-6"standard glazed
$25,320.00 $14,285.00 $39,605.00
$16,500.00 $7,425.00 $23,925.00
$16,500.00 $7,425.00 $23,925.00Material Installation Tota!
$16,500.00 $7,425.00 $23,925.00
$8,820.00 $6,860.00 $15,680.00
$8,820.00 $6,860.00 $15,680.00Material Installation Total
$8,820.00 $6,860.00 $15,680.00
July 2010183
Report Page 6 of 8
Page 200
09 00 00. Finishes $19,890.11 $32,498.87 $52,388.98
09 21 00. Plaster and Gypsum Board Assemblies $19,092.61 $28,042 28 $47,134 8909 21 16. Gypsum Board Assemblies
Source: RSMeans Price Year: 2008 $19,092.61 $28,042.28 $47,134.89
09 21 16.33 Gypsum Board Area Separation Wall A Material Installation Tota!Gypsum plasterboard, nailed/screwed to studs, $9,247.98 $14,021.14 $23,269.125/8" regular
Gypsum plasterboard, nailed/screwed to studs, $9,844.63 $14,021.14 $23,865.775/8"F.R. Fire resistant
09 93 00. Staining and Transparent Finishing $797.50 $4,456 60 $5,254 1009 93 13. Exterior Staining and Finishing
Source: RSMeans Price Year: 2008 $797.50 $4,456.60 $5,254.10
09 93 13.13 Exterior Staining íV¡dU;riüi ii¡:vi.dií<j'i¡on ìoioì
Exterior wood satin on other than shingles, 2 coats $797.50 $4,456.60 $5,254.10& sealer
July 2010184
Report Page 7 of 8
Page 201
99 OO 00. Speciel Division99 99 00. Listing all assemblies components that
has not been assigned MF number.However the associated Prices arecalculated in the total.
99 99 10. Pricing Adjustments to Match assemblies prices.Source: RSMeans Price Year: 2008
99 99 10.00
Price Adjustment to match ABS price99 99 20. System componenets with no MF2004 number
Source: RSMeans Price Year: 2008
99 99 20.00
Beam to girder saddles
column caps
Driling, bolt holes
Joist hangars 18 ga.Machine bolts
Taping and finishing joints99 99 30. Assemblies with no System Components (Listed
Source: RSMeans Price Year: 2008
99 99 30.00
Drywall Partitions / Wood Stud FramingPlain & Reinforced
Speciel Doors
Strip Footing
Walls, Cast in Place
Wood/Flat or Pitched
$230,523.56 $218,735.71
$230,523.56 $218,735.71
$449,259.27
$449,259.27
$0.00 $172.74
Material Installation
$0.00 $172.74
$158,854.08 $92,617.34
Material Installation
$110,965.21 $23,009.51
$31,916.41 $2,968.97
$0.00 $11,133.63
$8,535.79 $22,638.39
$4,453.45 $4,824.57
$2,983.22 $28,042.28
as whole assembly)$71,669.48 $125,945.63Material
$19,300.69
$19,780.90
$2,100.00
$5,964.20
$15,404.34
$9,119.35
Installation
$49,137.07
$25,113.99
$1,550.00
$8,045.46
$31,031.94
$11,067.17
$172.74Total
$172.74
$251,471.42Total
$133,974.71
$34,885.38
$11,133.63
$31,174.17
$9,278.03
$31,025.50
$197,615.11
Totaï
$68,437.76
$44,894.89
$3,650.00
$14,009.66
$46,436.28
$20,186.51
Grand Total $639,657.84 $673,579.63 $1,313,237.47
July 2010185
Report Page 8 of 8
Page 202
Objects without Cost Data{10 records)
FamilyNameAssemblyCodeDescriptionKeynote
FamilyNameAssemblyCodeDescriptionKeynote
FamilyNameAssemblyCodeDescriptionKeynote
FamiiyNameAssemblyCodeDescriptionKeynote
FamilyNameAssemblyCodeDescriptionKeynote
FamilyNameAssemblyCodeDescriptionKeynote
Double-Flush
Sliding-2 panelB2020
Single-FlushC1020
Double-Glass 1
Floor
Railing
Id
Type Name
Type MarkType CommentsId
Type Name
Type MarkType Comments
Id
Type NameType MarkType CommentsId
Type Name
Type MarkType Comments
Id
Type NameType MarkType Comments
Id
Type NameType MarkType Comments
269115
72" ? 84"
67
238304
72" ? 84"
58
50865
36" ? 84"
34
50269
72" ? 84"
29
987
Generic - 12" - Filled
35471
Handrail - Pipe
LengthArea
Volume
Count:
LengthArea
Volume
Count:
LengthArea
Volume
Count:
LengthArea
Volume
Count:
LengthArea
Volume
Count:
LengthArea
Volume
Count:
(4 records)0.00
3.90
0.00
1
0.00
245.82
0.00
63
0.00
122.91
0.00
63
0.00
7.80
0.00
2
(1 record)
150.19
299.95
91.43
1
(1 record)
194.37
0.00
0.00
42
July 2010186
Report Page 1 of 2
Page 203
FamilyNameAssemblyCodeDescriptionKeynote
FamilyNameAssemblyCodeDescriptionKeynote
FamilyNameAssemblyCodeDescriptionKeynote
FamilyNameAssemblyCodeDescriptionKeynote
Basic Roof
Basic Wall
Basic Wall
Curtain Wall
Id
Type Name
Type MarkType Comments
Id
Type Name
Type MarkType CommentsId
Type Name
Type MarkType CommentsId
Type Name
Type MarkType Comments
1389
Generic - 12"
272967
36" Footing
26553
jndation - 10" Concrete
391
Curtain Wall
LengthArea
Volume
Count:
LengthArea
Volume
Count:
LengthArea
Volume
Count:
LengthArea
Volume
Count:
(1 record)
0.00
4.18
1.06
2
(3 records)
13.00
3.78
3.45
8
93.93
594.61
151.03
29
8.55
78.80
July 2010187
Report Page 2 of 2
Page 204
VE: Cost Variations
EWBS Level 4 ID: AlOlO. 110
Number of prices in class: 4
Minimum
Material $4,814.85
Installation $7,331.00
Total $12,145.85
Title: Strip FootingNumber of Items: 64
Specified$5,964.20$8,045.46
$14,009.66
Maximum
$9,511.66
$12,288.74
$21,800.40
EWBS Level 4 ID: A1030.120
Number of prices in class: 2
Title: Plain & Reinforced
Number of Items: 15
Material
Installation
Total
Minimum
$18,326.43
$21,914.14
$40,240.56
Specified$19,780.90
$25,113.99
$44,894.90
Maximum
$19,780.90
$25,113.99
$44,894.90
EWBS Level 4 ID: A2020.110
Number of prices in class: 2Title: Walls, Cast in PlaceNumber of Items: 65
Material
Installation
Total
Minimum
$8,751.45
$29,022.68
$37,774.13
Specified$15,404.34
$31.031.94
$46,436.28
Maximum
$15,404.34
$31,031.94
$46,436.28
EWBS Level 4 ID: B1010.264
Number of prices in class: 2
Title: Wood Beam & Joist
Number of Items: 54
Material
Installation
Total
Minimum
$332,153.37
$138,428.17
$470,581.54
Specified$332,153.37
$138,428.17
$470,581.54
Maximum
$424,933.65
$151,788.52
$576,722.17
July 2010188
Report Page 1 of 3
Page 205
EWBS Level 4 ID: B1020.102
Number of prices in class: 3
Title: Wood/Flat or PitchedNumber of Items: 1
Material
Installation
Total
Minimum
$6,640.30
$9,562.03
$16,202.33
Specified$9,119.35
$11,067.17
$20,186.51
Maximum
$10,004.72
$12,926.45
$22,931.17
EWBS Level 4 ID: B2010.129
Number of prices in class: 4
Minimum
Material $150,283.90
Installation $251,336.86
Total $401,620.76
Title: Brick Veneer / Wood Stud BackupNumber of Items: 82
Specified$150,283.90
$251,336.86
$401,620.76
Maximum
$209,015.54
$345,480.22
$554,495.76
EWBS Level 4 ID: B2010.148
Number of prices in class: 2Title: Panel, Shingle & Lap SidingNumber of Items: 30
Material
Installation
Total
Minimum
$14,448.76
$22,095.35
$36,544.11
Specified$14,448.76
$22,845.93
$37,294.70
Maximum
$21,297.85$22,845.93
$44,143.78
EWBS Level 4 ID: B2020.102
Number of prices in class: 2
Minimum
Material $10,931.41
Installation $10,172.89
Total $21,104.30
Title: Wood Windows
Number of Items: 49
Specified$10,931.41
$10,172.89
$21,104.30
Maximum
$19,110.00
$11,172.00
$30,282.00
EWBS Level 4 ID: C 10 10. 124
Number of prices in class: 4Title: Drywall Partitions / Wood Stud FramingNumber of Items: 432
Material
Installation
Total
Minimum
$44,488.59
$109,480.63
$153,969.22
Specified$53,607.73
$133.562.22
$187,169.95
Maximum
$86,656.04
$214,705.82
$301,361.86
July 2010189
Report Page 2 of 3
Page 206
EWBS Level 4 ID: C1020.102
Number of prices in class: 1Title: Speciel DoorsNumber of Items: 2
Material
Installation
Total
Minimum
$2,100.00$1,550.00
$3,650.00
Specified$2.100.00
$1,550.00
$3,650.00
Maximum
$2,100.00
$1,550.00
$3,650.00
EWBS Level 4 ID: C1020.120
Number of prices in class: 4Title: Wood Door/Wood FrameNumber of Items: 165
Material
Installation
Total
Material
Installation
Minimum
$20,790.00
$34,485.00
$55,275.00
$613,729.07
$635,378.74
$1,249,107.80
Specified$26.235.00
$40,425.00
$66,660.00
$640,028.96
$673,579.62$1,313,608.59
Maximum
$34,155.00
$41,580.00
$75,735.00
$851,969.69
$870,483.62
July 2010190
Report Page 3 of 3