DOE/NETL-2002/1160 Integrated Dry NO X /SO 2 Emissions Control System A DOE Assessment October 2001 U.S. Department of Energy National Energy Technology Laboratory P.O. Box 880, 3610 Collins Ferry Road Morgantown, WV 26507-0880 and P.O. Box 10940, 626 Cochrans Mill Road Pittsburgh, PA 15236-0940 website: www.netl.doe.gov
Transcript
DOE/NETL-2002/1160
Integrated Dry NOX/SO2
Emissions Control SystemA DOE Assessment
October 2001
U.S. Department of EnergyNational Energy Technology Laboratory
This report was prepared as an account of work sponsored by anagency of the United States Government. Neither the United StatesGovernment nor any agency thereof, nor any of their employees,makes any warranty, express or implied, or assumes any legal liabilityor responsibility for the accuracy, completeness, or usefulness of anyinformation, apparatus, product, or process disclosed, or representsthat its use would not infringe privately owned rights. Referencetherein to any specific commercial product, process, or service bytrade name, trademark, manufacturer, or otherwise does notnecessarily constitute or imply its endorsement, recommendation, orfavoring by the United States Government or any agency thereof. Theviews and opinions of authors expressed therein do not necessarilystate or reflect those of the United States Government or any agencythereof.
I Introduction.................................................................................................................................11
II Project/Technology Description ................................................................................................12
II.A Project Description ....................................................................................................12II.B Need for the Technology Demonstration...................................................................12II.C Promise of the Technology ........................................................................................12II.D Project Objectives and Statement of Work................................................................13II.E Technology Description .............................................................................................13
II.F.1 Low-NOx Burners and Overfire Air ............................................................18II.F.2 Selective Noncatalytic Reduction ...............................................................20II.F.3 Dry Sorbent Injection and Flue Gas Humidification...................................22
III Technical and Environmental Assessment...............................................................................24
III.A Technical Results .....................................................................................................24
III.A.1 Low-NOx Burners and Overfire Air ..........................................................24III.A.2 Selective Noncatalytic Reduction..............................................................26III.A.3 Dry Sorbent Injection ................................................................................31III.A.4 Integrated System ......................................................................................34
1 Temperature Window for the SNCR Process ....................................................................... 14 2 Simplified Process Flow Diagram of IDECS ....................................................................... 18 3 Plan View of Burner Arrangement after Retrofit.................................................................. 19 4 Schematic of B&W DRB-XCL® Burner.............................................................................. 19 5 Schematic of B&W Dual-Zone NOx Port ............................................................................. 20 6 SNCR Injection Nozzle Locations at Arapahoe Unit 4 ........................................................ 21 7 NOx Emissions as a Function of Boiler Load ....................................................................... 25 8 CO Emissions as a Function of Boiler Load......................................................................... 26 9 Effect of Urea to NOx Ratio on NOx Removal and NH3 Slip ............................................... 27 10 Effect of Ammonia to NOx Ratio on NOx Removal and NH3 Slip with
Urea Converter in Operation ................................................................................................. 28 11 Effect of Urea to NOx Ratio on NOx Removal and NH3 Slip with ARIL
Lances in Use ........................................................................................................................ 30 12 Effect of NSR on SO2 Removal for Injection of Sodium Sesquicarbonate
Before the FFDC................................................................................................................... 32 13 Effect of Approach to Adiabatic Saturation Temperature on SO2
Removal with Calcium Hydroxide Injection ........................................................................ 34
Table Page
1 Properties of Test Coals ........................................................................................................ 24 2 Properties of Sodium-Based Sorbents .................................................................................. 31 3 Properties of Hydrated-lime Sorbent .................................................................................... 33 4 Economic Parameters Used in IDECS Economic Evaluations............................................. 38 5 Capital Costs for Installing the Integrated Dry NOx/SO2 Emissions Control System 100-MWe Unit, 65% Operating Factor (1994 dollars) ......................................................... 40 6 Operating Costs for the Integrated Dry NOx/SO2 Emissions Control System
100-MWe Unit, 65% Operating Factor................................................................................. 41 7 Economics of the Integrated Dry NOx/SO2 Emissions Control System
100-MWe Unit, 65% Operating Factor................................................................................. 42 8 Effect of Operating Parameters on IDECS Economics......................................................... 42
6
Executive Summary
This document is a U.S. Department of Energy (DOE) post-project assessment (PPA) of theIntegrated Dry NOx/SO2 Emissions Control System (IDECS), a project funded under Round IIIof the Clean Coal Technology (CCT) Demonstration Program. The project was sited at the PublicService Company of Colorado (PSCC) Arapahoe Steam Electric Generating Station, in Denver,Colorado. The CCT Demonstration Program was created to establish the commercial feasibilityof promising coal technologies that have developed beyond the proof-of-concept stage. TheIDECS Project was selected to demonstrate the simultaneous reduction of nitrogen oxides (NOx)and sulfur dioxide (SO2) emissions from a coal-fired power plant, by installing a combination ofexisting and emerging technologies, which were expected to work synergistically. The majorproject objective was to achieve up to 70-percent reduction in NOx and SO2 emissions, whileminimizing capital costs and producing only dry solid waste.
In March 1991, PSCC entered into a cooperative agreement with DOE to undertake this project,consisting of installing and testing the following technologies on Arapahoe Unit 4: low-NOx
burners (LNBs), overfire air (OFA), and selective noncatalytic reduction (SNCR) for NOx
control; and dry sorbent injection (DSI), both with and without flue-gas humidification (FGH),for SO2 control. Unit 4 is a 100-MWe, down-fired boiler, designed to burn pulverized coal ornatural gas. It typically operates as a load-following unit with a capacity factor of 50 to 60percent and experiences large and rapid load swings. At the time this project was initiated, therewas no low-cost NOx and SO2 emissions control system demonstrated for use with down-firedboilers.
The project commenced in May 1991. Operations were initiated in August 1992 and completedin December 1996. PSCC provided the host site, and the Electric Power Research Institute(EPRI) was a cofunder. PSCC provided much of the engineering, including engineering andinstallation of the DSI system. Other technology support included Babcock & Wilcox (B&W),supplier of the LNBs, OFA ports, and FGH equipment, and NOELL, Inc., supplier of the SNCRsystem. Also, Stone & Webster assisted PSCC with project engineering, Fossil Energy ResearchCorporation (FERCo) conducted the test program, Western Research Institute (WRI)characterized the waste materials; and Colorado School of Mines provided bench-scale testing.DOE provided 50 percent of the total project funding of $26.2 million.
The burners in Unit 4 were replaced with 12 B&W, Dual-Register Burner—Axially-ControlledLow-NOx (DRB-XCL®), LNBs. The replacement was more complex than retrofitting atangentially-fired or wall-fired boiler, because several boiler components had to be removed topermit the burner installation. Numerical modeling helped determine the optimum size andlocation for the OFA ports (B&W, dual-zone NOx ports), a technology always used inconjunction with LNBs in this project.The SNCR system involves the injection of urea into the furnace where the urea first decomposesinto ammonia, which then reacts with NOx to form mainly N2, a naturally occurring inert gas.Commercial urea, received as a 65 wt% aqueous solution, was diluted to 37.5 percent after
7
delivery to prevent crystallization. The installation of the LNBs changed the temperature profileinside the furnace, making the original SNCR injection sites unsatisfactory during low-loadoperation. At low-load levels, ammonia injection was more effective than urea injection for NOx
removal. Therefore, an ammonia converter was added to convert urea into ammonia just prior toinjection into the furnace. Using the converter avoided the problems associated with the storageand handling of ammonia. Advanced Retractable Injection Lances (ARILs) were installedthrough two unused soot blower ports to permit urea injection at the desired location in thefurnace.
Dry sorbents were injected into the flue gas to control SO2 emissions. Two identical DSI systemswere installed to provide the capacity required at high sorbent-injection rates and backup at lowsorbent rates. These systems can inject calcium-based sorbents into the boiler before theeconomizer, or they can inject sodium- or calcium-based sorbents into the flue-gas duct betweenthe air heater and the fabric-filter dust collector (FFDC).
The purpose of FGH was to enhance the performance of DSI, but except for a few tests, FGHwas only used with calcium-based DSI. The system was used to inject water into the flue gas topermit operation at a temperature approaching the adiabatic saturation temperature; the lower theapproach to adiabatic saturation temperature, the more effective the calcium-based sorbent was.Water-injection lances were interspersed with the DSI lances. Shield air was supplied to helpprevent deposition of solids on the nozzles, and a rapper helped remove any solids that collected.
Although PSCC’s Final Report discusses the five separate technologies involved with IDECS,only three separate emission control systems were tested. The LNBs were always used inconjunction with OFA, and FGH was used only with DSI. Thus, the effects of LNB performancewithout OFA or FGH without DSI were not examined in the course of these tests. The threetechnologies (LNB/OFA, SNCR, and DSI with or without FGH) were first individually testedusing both parametric tests and long-term tests. This was followed by testing the technologies asone integrated system. The tests were conducted burning low-sulfur (0.4 percent) Coloradobituminous coal, with a short test on Wyoming subbituminous (0.35-percent sulfur) coal.
Parametric testing of the LNB/OFA system was performed by setting boiler and burnerparameters to specific values, operating the plant, and recording results. Long-term testing wasperformed by allowing the boiler to operate without interference from test personnel. MaximumOFA rate decreased as load increased, and varied from 32 percent of total secondary air at 50-MWe load to 24 percent at 80-MWe load. NOx reductions varied from 61 percent to 69 percent.The new burners decreased the furnace-exit temperature by approximately 200 °F. This had animpact on the amount of excess air required to maintain steam temperature at reduced loads. Atmaximum OFA, carbon monoxide (CO) levels were lower than with the original burners and didnot exceed a maximum CO level of 50 ppm. There was little difference in fly-ash loss-on-ignition (LOI) between the new burners and the old, except at a load of 50 MWe, where the flyash produced with LNBs exhibited a higher LOI.
During long-term testing, NOx levels were 10 to 20 percent (30 to 60 ppm) higher than during theparametric tests. This may be due to the higher O2 levels (1 to 1.5 percent higher) detected during
8
normal load-following conditions. NOx levels increased by about 40 ppm for each percentincrease in O2 level.
The main variables examined in the SNCR parametric tests were boiler load, injection location,chemical type (urea, converted urea, ammonia), chemical-injection rate, and coal source.Long-term tests showed that NOx reduction with urea was not very effective at low boiler loads,when using the original injection location. This lower than expected performance occurredbecause of reduced flue-gas temperature at the injection location. When aqueous ammonia wasused, NOx removal improved as boiler load decreased. SNCR achieved an additional 30- to 50-percent NOx reduction over that achieved by the LNB/OFA system alone. Ammonia slip(ammonia in the flue gas) was about 10 ppm at the air-heater exit during base-load operation.Urea injection resulted in nitrous oxide (N2O) emissions of 29 to 35 percent of the NOx
reduction, while injection of converted urea resulted in N2O emissions by only 3 to 8 percent ofthe NOx reduction.
An extensive series of tests was performed on the SNCR system under a variety of conditionssimilar to what Unit 4 would experience under normal load-following operations. The resultsshowed that boiler load had the largest effect on system performance. The use of retractablefurnace lances greatly improved the low-load performance of the SNCR system. At loads below70 MWe, NOx reduction increased from 11 percent with wall injectors to 35 to 52 percent withretractable lances. Some ammonia from the SNCR process adsorbed on the fly ash, the amountdepending on the surface chemistry of the fly ash. With a 10-ppm slip at the dust collector inlet,ammonia concentrations in the fly ash were in the range of 100 to 200 ppm by weight.
The DSI system was tested with sodium-sesquicarbonate, sodium-bicarbonate, and hydrated-limesorbents. Both sodium-based sorbents achieved 70-percent SO2 removal (SO2 removal withcalcium-based sorbent was too low to be practical), however, with sodium-based DSI, somenitric oxide (NO) in the flue gas is oxidized to nitrogen dioxide (NO2). This can produce stack-plume coloration, if the NO2 concentration becomes too high. Sodium sesquicarbonate producedonly half as much NO2 as sodium bicarbonate.
Although the chemistry is not well understood, sodium-based DSI resulted in some NOx
reduction. At 70-percent SO2 removal, approximately 10-percent NOx reduction was obtained.Sodium-based DSI, when operated in conjunction with SNCR, resulted in increased ammoniaadsorption on the fly ash (400 to 800 ppm). The increased sodium and ammonia concentrationscould cause problems with fly-ash disposal.
Integrated-system tests consisted of combined testing of LNB/OFA ports, SNCR, and sodium-based DSI. The combined technologies integrate synergistically to control NOx and SO2
emissions more effectively than each technology alone. Integrated operation involved bothparametric and long-term tests.
IDECS was developed to be retrofitted to boilers with pre-New Source Performance Standards(NSPS), that might require moderate (up to 70 percent) reductions in SO2 and NOx emissions. Inparticular, it was developed to meet the site-specific requirements of boilers with some of the
9
more difficult emission-control situations. A market analysis indicated that 65 down-fired boilers(6,400 MWe total) and 29 wet-bottom boilers (3,800 MWe total) have a need for further NOx andSO2 reductions to meet emissions standards. Because of their age and design, these units generatehigh levels of NOx, but their relatively small size and plot area makes them difficult and costly toretrofit with existing SO2 removal technologies. IDECS provides an economic alternative tothose utilities considering fuel switching or retirement for such units; however, the recent trendtoward selection of technologies that provide maximum emission-removal capabilities (ratherthan lower removals at lower cost) may limit the market for IDECS.
An economic analysis was conducted for commercial application of IDECS. Based on theassumptions made, the capital cost for installing IDECS on a 100-MWe unit with a 65-percentoperating factor (similar to Arapahoe Unit 4) is $196/kW for the integrated system. Incrementalfixed operating costs for the integrated system are $0.22 million/yr, and variable operating costsare $1.49 million/yr, for a total operating cost of $1.8 million/yr. The impact of IDECS on powercosts was calculated for the same power plant, with an initial (before IDECS) NOx level of 1.15lb/MBtu and SO2 level of 0.66 lb/MBtu. With NOx removals of 79 percent and SO2 removals of70 percent, levelized costs are $1,358/ton of NOx plus SO2 removed, on a current-dollar basis,and $1,044/ton on a constant-dollar basis. Busbar costs are 9.7 mills/kWh on a current-dollarbasis and 7.4 mills/kWh on a constant-dollar basis. As plant size increases, capital and fixedcosts per MWe decrease, while variable costs remain nearly level on a per-kWh basis. Theoverall effect is a decrease in the $/ton of NOx removed with increase in plant size. Increasing theplant-capacity factor increases the quantity of NOx removed for a given capital investment.
Major conclusions from the completed project are as follows:
• LNB’s plus OFA achieved up to 69-percent NOx reduction without increasing CO levelsor LOI.
• During base-load operation, urea injection achieved an additional 30- to 50-percent NOx
reduction while maintaining an ammonia slip of 10 ppm at the air-heater exit. Thisincreased the total system NOx reduction to greater than 80 percent at full load, exceedingthe project goal of 70 percent.
• Urea injection resulted in N2O emissions of 29 to 35 percent of the NOx reduction. If theurea was passed through the ammonia converter before injection, N2O emissionsamounted to only 3 to 8 percent of the NOx reduction.
• Both sodium-sesquicarbonate and sodium-bicarbonate DSI achieved 70-percent SO2
removal, but hydrated-lime injection achieved much lower SO2 removals. Thus, hydrated-lime injection is unlikely to be implemented on other units.
• Both sodium sesquicarbonate and sodium bicarbonate resulted in the oxidation of NO toNO2, probably by a catalytic reaction. When compared at the same SO2-removal rate,sodium sesquicarbonate created only half as much NO2 as sodium bicarbonate.
10
• The integrated system achieved approximately 80-percent NOx removal, 70-percent SO2
removal, and 80-percent removal of mercury emissions.
• The integration of SNCR with sodium-based DSI decreased NO2 emissions byapproximately 50 percent compared to using sodium-based DSI without SNCR. Thecombination also decreased ammonia emissions to an amount below that achieved withSNCR alone, but the level was difficult to quantify. The decreased ammonia levels at thestack were accompanied by increased ammonia levels in the fly ash, causing some odorand ash-disposal concerns.
• The market for the entire IDECS system is limited, because of increasingly stringentemissions standards and the trend towards installing more expensive processes thatachieve high removal levels.
11
I Introduction
The goal of the U.S. Department of Energy’s (DOE) Clean Coal Technology (CCT) Program isto furnish the energy marketplace with a number of advanced, more efficient, andenvironmentally responsible coal utilization technologies through demonstration projects. Theseprojects seek to establish the commercial feasibility of the most promising advanced coaltechnologies that have developed beyond the proof-of-concept stage.
This document serves as a DOE post-project assessment (PPA) of a project selected in CCTRound III, the Integrated Dry NOx/SO2 Emissions Control System (IDECS), as described in aReport to Congress (U.S. Department of Energy 1991). The desire to reduce emissions ofnitrogen oxides (NO,nitric oxide, and NO2, nitrogen dioxide, collectively referred to as NOx) andsulfur dioxide (SO2) by up to 70 percent at a minimum capital expenditure, while limiting wasteproduction to dry solids that can be handled by conventional ash-removal equipment, promptedPublic Service Company of Colorado (PSCC) to submit the proposal for the IDECS project. InMarch 1991, PSCC entered into a cooperative agreement with DOE to conduct the study. Theproject was sited at PSCC’s Arapahoe Steam Electric Generating Station in Denver, Colorado.The purpose of this CCT project was to demonstrate the reduction of NOx and SO2 emissions byinstalling a combination of existing and emerging technologies, which were expected to worksynergistically to reduce emissions. The technologies were low-NOx burners (LNBS), overfire air(OFA), and selective noncatalytic reduction (SNCR) for NOx reduction; and dry sorbent injection(DSI), both with and without flue-gas humidification (FGH), for SO2 reduction. DOE provided50 percent of the total project funding of $26.2 million.
The Arapahoe Station consists of four units with total nameplate generating capacity of 232MWe. The CCT demonstration project was installed on Unit 4, a 100-MWe, down-fired unit,designed to burn pulverized coal or natural gas. Unit 4, which began operation in 1955, is used asa load-following unit and can, therefore, experience large and rapid load swings. Its usualcapacity factor is 50 to 60 percent.
Construction for the demonstration project was started in May 1991 and completed in August1992. Operations were initiated in August 1992 and completed in December 1996. Theindependent evaluation contained herein is based primarily on information from PSCC’s FinalReport (Hunt and Hanley 1997; Hunt and Hanley 1999), as well as other references (Shiomoto etal. 1992; Smith et al. 1993; Smith et al. 1994a, 1994b; Shiomoto et al. 1994; Muzio et al. 1997;Smith, Shiomoto et al. 1997a; Smith et al. 1997b, 1997c).
12
II Project/Technology Description
II.A Project Description
The project documentation lists five control technologies that make up IDECS: LNBs, OFA,SNCR, DSI, and FGH. However, in this project, OFA is always used in conjunction with LNBs,and FGH is used only in conjunction with DSI. The three tested technologies are (1) LNB/OFAand (2) SNCR for NOx control, and (3) DSI plus FGH (with calcium-based sorbents) for SO2
control. NOx reduction occurs in the furnace, while SO2 control is carried out in the economizeror in the ductwork, downstream of the air preheater, and in the cake that accumulates on thefabric-filter dust collector (FFDC).
PSCC managed the project and provided the host site; the Electric Power Research Institute(EPRI) was a cofunder. PSCC provided much of the engineering, including engineering andinstallation of the DSI system. Babcock & Wilcox (B&W) supplied the LNBs, OFA ports, andFGH equipment; and NOELL, Inc., supplied the SNCR system. Stone & Webster assisted PSCCwith project engineering. Fossil Energy Research Corporation (FERCo) conducted the testprogram, Western Research Institute (WRI) characterized the waste materials, and the ColoradoSchool of Mines provided bench-scale testing.
II.B Need for the Technology Demonstration
At the time this project was initiated, there was no low-cost NOx and SO2 emissions controlsystem demonstrated for down-fired boilers. Thus, it was important to demonstrate that acombination of existing and emerging technologies could achieve satisfactory emissions controlon a down-fired unit burning low-sulfur coal. This program establishes an alternative technologyto the use of wet flue-gas desulfurization (FGD) for SO2 control and selective catalytic reduction(SCR) for NOx control. The extensive data gathered in this project will enable implementation ofthis technology on other units. Because of the nature of the technology and the manner in whichit is implemented, the results should be applicable to other types of boilers besides down-firedunits, particularly tangentially-fired and wall-fired units.
II.C Promise of the Technology
The major promise of LNBs was to achieve 60- to 65-percent NOx reduction from coal-firedboilers, with SNCR providing an additional 30- to 50-percent reduction of the remaining NOx fora total of 70 percent or more total NOx reduction. The promise of DSI was to remove up to 70percent of the sulfur in the flue gas, while producing only a dry waste material that could beconventionally disposed of along with the fly ash. Potential benefits include the reduction of bothNOx and SO2, the synergistic interaction of the various technologies, and the relatively lowcapital investment.
13
II.D Project Objectives and Statement of Work
The primary objective of this project, as stated in the Cooperative Agreement, was todemonstrate an Integrated Dry NOx/SO2 Emissions Control System (IDECS), which could becommercialized during the 1990's and would (1) achieve significant emissions reductions of SO2
and/or NOx from existing facilities to minimize environmental impacts, such as transboundaryand interstate pollution; and/or (2) provide for future energy needs in an environmentallyacceptable manner.
The more detailed technical description states that the IDECS is a combination of subsystemswhich utilize several different emission-control strategies: LNBs, OFA, urea injection, dryreagent injection and FGH. The LNBs, OFA, and urea injection equipment remove NOx. Dryreagent (sodium or calcium) injection removes SO2, and FGH enhances the effectiveness of thecalcium reagent. The goal of this project is to achieve 70-percent reductions of both NOx and SO2
through the integrated operation of the various technologies. Previous testing of urea and dry-sodium systems have shown that these systems may complement each other.
The statement of work (SOW) is broken down into several phases: Pre-award, Design,Procurement, Construction and Startup, and Operations. This PPA is primarily concerned withoperations and will not deal with the other phases in any detail. The Operations Phase coveredoperation and testing of the installed systems, including the LNBs, OFA, urea injection, sodiuminjection, and calcium injection both with and without FGH. These systems were to be subjectedto parametric tests individually, in various combinations, and as an integrated system. Originally,a short test on a high-sulfur coal was to be included, but the SOW was later amended to deletethis requirement, and all operations were on low-sulfur (0.4 wt%) coal.
The SOW contains a provision to research and study the environmental impact of any new wastestreams generated by the project. Various tests on the different wastes were to be performed, andif any problems were found, investigations to find solutions were to occur.
II.E Technology Description
The following sections discuss the technologies installed as part of IDECS.
II.E.1 Low-NOx Burners
The two primary sources of NOx, when burning fossil fuels, are thermal NOx and fuel NOx.Thermal NOx is formed by the reaction of nitrogen in the combustion air with oxygen at the hightemperatures existing in flames. Fuel NOx results from the combustion of the nitrogen in the fuel.Low-NOx burners (LNBs) reduce NOx production by means of staged combustion, that is, theydelay mixing of the fuel with all the air, so that the early stages of combustion take place at a low
14
air/fuel ratio. This not only lowers the temperature, thus reducing thermal NOx, but also reducesoxygen concentration so that less fuel nitrogen is converted to NOx and more is converted to N2.LNBs are frequently supplemented with OFA.
II.E.2 Overfire Air
OFA is air that is introduced into the furnace above the regular combustion zone (or below theregular combustion zone in the case of a down-fired boiler) to complete combustion. LNBsgenerally operate at a reduced air/fuel ratio. OFA is added downstream of the LNBs to reducecarbon-monoxide concentration and loss on ignition (LOI), a measure of unburned carbon in ash.
II.E.3 Selective Noncatalytic Reduction
SNCR involves the injection of a nitrogen-containing chemical, typically urea ((NH2)2CO) orammonia (NH3), into the combustion products at a point where the temperature is between1,600 °F and 2,100 °F. In this temperature range and in the presence of oxygen, the chemicalreacts selectively with NOx to form N2 (the harmless major constituent of the atmosphere) andwater. Performance of SNCR systems depends strongly on furnace geometry, temperatureprofile, mixing, injector locations, and other factors. Furnace geometry is important, becausethere must be sufficient residence time within the correct temperature window. If the temperatureis too low, the injected chemical does not react with NOx, resulting in excessive emissions ofammonia. If the temperature is too high, the chemical reacts directly with oxygen to formadditional NOx. (See Figure 1.) Mixing is important, because if the injected chemical does notmix uniformly, then both incomplete reaction and excessive ammonia emissions, referred to asammonia slip, will result.
Temperaturetoo Low
Temperaturetoo High
NH3Emissions
NOxRemoval
Optimum
Temperature
Figure 1. Temperature Window for the SNCR Process
SNCR systems typically achieve 30- to 50-percent NOx reduction, while operating at acceptablereagent consumption and ammonia slip (typically less than 5 to 10 ppm at the stack). Since thetemperature profile in a furnace changes as the load changes, multiple injection points may berequired for load-following units, so that the reagent can be injected at the correct temperaturezone in the furnace. The chemicals most frequently used are anhydrous ammonia, aqueous
15
ammonia, and solutions of urea; to avoid handling ammonia, urea solutions are frequentlypreferred.
SNCR Process Chemistry: If ammonia is used, it reacts directly with NOx; however, urea mustfirst decompose. The reactions occurring in SNCR are complex and not well understood, and thefollowing equations are only intended to be illustrative; they are not the only reactions takingplace. This project used urea solution provided by Coastal Chem, Inc. As urea is heated, itdecomposes according to the following reaction:
The NH2 then reacts as shown in Equation (3). The overall reaction of urea with NO is:
(NH2)2CO + 2NO + ½O2 ——> 2N2 + CO2 + 2H2O (6)
However, HNCO also reacts by a different path that leads to the production of small amounts ofan undesired side product, nitrous oxide (N2O), a greenhouse gas which has an effect many timesthat of carbon dioxide (CO2), the greenhouse gas present in the highest concentration in theatmosphere:
HNCO + OH ——> NCO + H2O (7)NCO + NO ——> N2O + CO (8)
The use of urea based SNCR slightly increases the production of CO2 due to the carbon in theurea, but this effect is quite small compared to the CO2 generated due to coal combustion.
II.E.4 Dry Sorbent Injection
DSI systems inject dry sorbents (sodium- or calcium-based reagents) into the flue gas to controlSO2 emissions. Calcium-based sorbent may be injected either into the flue gas before theeconomizer or into the duct between the air heater and the particulate control device; sodium-based sorbents are injected at the latter location. The sorbents react with the SO2 in the flue gasto form a solid that is removed by the particulate control device.
16
DSI systems are simple, easily retrofitted to existing units, and have low capital costs. A DSIsystem consists of storage facilities and equipment to convey, pulverize, and inject sorbents intothe flue-gas ductwork. However, the use of DSI increases the amount of fly ash and adds solublecompounds (especially sodium-based DSI), which may prevent the fly ash from being slurried orsold as a concrete additive.
The normalized stoichiometric ratio (NSR) is used to compare the performance of sodium-basedsorbents with calcium-based sorbents. For calcium-based sorbents, the NSR is defined as thenumber of moles of Ca injected per mole of SO2 in the flue gas; whereas, for sodium-basedsorbents, the NSR is one half the number of moles of Na injected per mole of SO2 in the flue gas.The one half factor is necessary with Na because it takes two moles of Na to react with one moleof SO2 but only one mole of Ca. Theoretically, an NSR of one should result in complete SO2
removal. However, due to the reaction kinetics, not all the sorbent reacts, and sorbent utilizationmust also be taken into account. Percent utilization is defined as the ratio of percent SO2 removaldivided by NSR. Typically, utilization is in the range of 40 to 70 percent. Some of the factorsaffecting utilization are sorbent type, temperature, particle size, purity, SO2 concentration,mixing, approach to adiabatic saturation temperature, and type of particulate control device.
Sodium-based DSI: Typically, sodium-based DSI systems inject either sodium bicarbonate(NaHCO3), or sodium sesquicarbonate (Na2CO3•NaHCO3•2H2O). For IDECS, nachcolite,naturally-occurring sodium bicarbonate, and trona, naturally-occurring sodium sesquicarbonate,were used. In the furnace, these reagents decompose into soda ash (Na2CO3), which reacts withSO2 in both the duct and on the surface of the FFDC. Injecting soda ash directly has been foundto be less effective than injecting the sorbents discussed above, possibly because of the lowersurface area of the injected soda ash compared to that produced in situ. Although the reactionstaking place are complex and not fully understood, the following generally represents thereactions occurring in sodium-based DSI:
2NaHCO3 ——> Na2CO3 + H2O + CO2 (9)2Na2CO3•NaHCO3•2H2O ——> 3Na2CO3 + 5H2O + CO2 (10)
Na2CO3 + SO2 + ½O2 ——> Na2SO4 + CO2 (11)
In addition to reacting with SO2, sodium-based sorbents also react with NO. Although thischemistry is not well understood, in the presence of sodium-based sorbents, a small portion ofthe NO is converted to NO2. Part of this NO2 is removed as a solid (probably as NaNO3), thusresulting in reduced emissions of NOx, but that part not removed increases the concentration ofNO2, a brownish-orange gas that can cause a visible stack plume. If this occurs, then the rate ofsorbent addition may have to be decreased to reduce the NO2 concentration.
Calcium-based DSI: The reagent used for calcium-based DSI is slaked or hydrated lime(Ca(OH)2). Hydrated lime has a small enough particle size, so that it does not have to bepulverized before use. The chemistry of SO2 capture by Ca(OH)2 is not well understood, andmany competing reactions are possible. Some of the more important reactions appear to be:
Ca(OH)2 + SO2 ——> CaSO3 + H2O (12)
17
Ca(OH)2 + CO2 ——> CaCO3 + H2O (13)CaCO3 + SO2 ——> CaSO3 + CO2 (14)
The effectiveness of reagent injection into the economizer depends upon achieving gooddistribution at a temperature that promotes reaction with SO2 rather than reaction with CO2 andconversion back to calcium carbonate (CaCO3). Without humidification, hydrated lime performsbest at a temperature of about 1,000 °F.
II.E.5 Flue Gas Humidification
The flue-gas temperature at the outlet of the air heater is about 300 °F, too low for dry hydrated-lime to react effectively with SO2; however, this reaction is promoted by moisture. Therefore,humidifying the flue gas enhances SO2 capture when calcium-based sorbents are used. FGHsystems inject water between the sorbent-injection grid and the particulate control device.Generally, dual-fluid nozzles are employed that use high-pressure air to atomize the injectedwater to ensure that it is completely evaporated before it reaches the particulate control device,to avoid damage to the duct and/or the control device. Therefore, the factor that limits thequantity of water that can be injected is the amount that will evaporate completely and remain inthe vapor phase.
A measure of the moisture content of the flue gas is the approach to saturation temperature (TAS).TAS is given by:
TAS = TFG - Tsat (17)
where, TFG is the flue-gas temperature, and Tsat is the adiabatic saturation temperature. Thesmaller TAS is, the closer the flue gas is to being saturated. As TAS becomes smaller, SO2 captureincreases. However, incomplete mixing of injected water causes temperature gradients andlocalized areas of complete saturation and sets a practical limit on how low TAS can be. For ducthumidification, the practical limit for TAS is about 20 °F. However, for a system with an FFDC,the practical limit for TAS is 40 °F, because of the danger of wetting the bag filters and theresultant performance loss.
II.F Project Implementation
The Final Report (Hunt and Hanley 1999) lists five technologies that were installed for thisproject (see section II.D of this report). However, as actually implemented, there are really onlythree distinct systems, because LNBs and OFA are always used together, and humidification isused only in conjunction with DSI of a calcium-based sorbent. Technology implementation forthis project is shown in Figure 2 and discussed in this section.
18
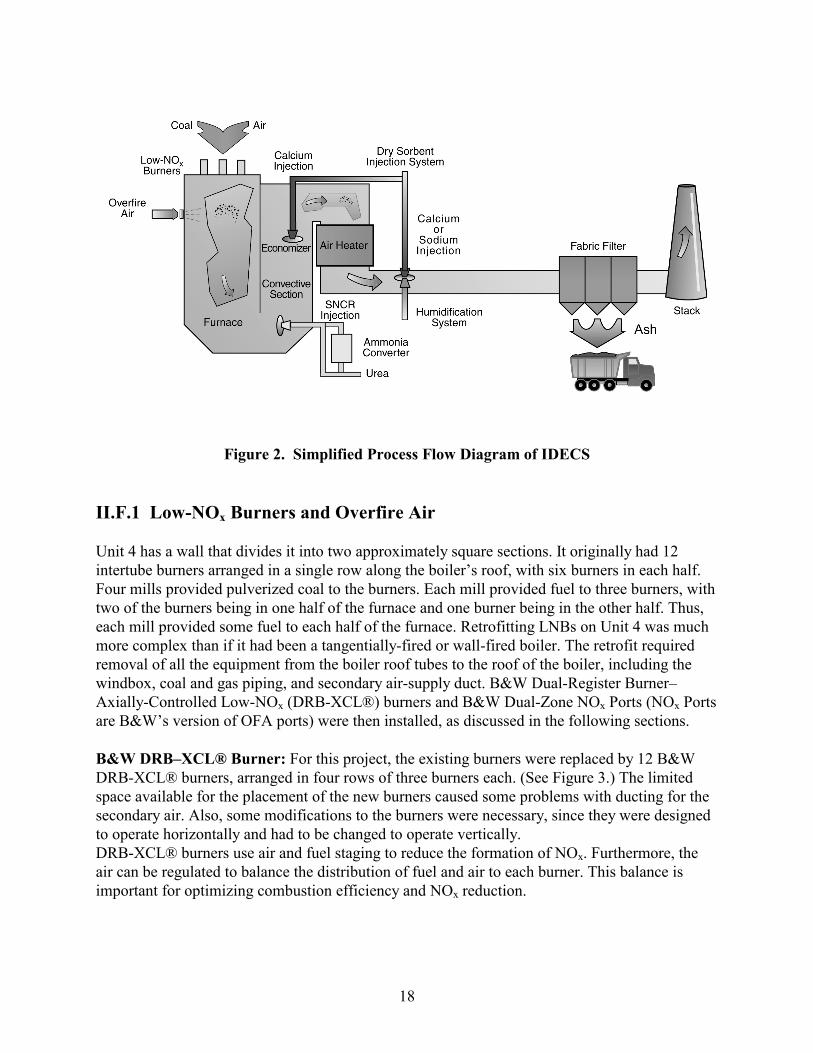
Figure 2. Simplified Process Flow Diagram of IDECS
II.F.1 Low-NOx Burners and Overfire Air
Unit 4 has a wall that divides it into two approximately square sections. It originally had 12intertube burners arranged in a single row along the boiler’s roof, with six burners in each half.Four mills provided pulverized coal to the burners. Each mill provided fuel to three burners, withtwo of the burners being in one half of the furnace and one burner being in the other half. Thus,each mill provided some fuel to each half of the furnace. Retrofitting LNBs on Unit 4 was muchmore complex than if it had been a tangentially-fired or wall-fired boiler. The retrofit requiredremoval of all the equipment from the boiler roof tubes to the roof of the boiler, including thewindbox, coal and gas piping, and secondary air-supply duct. B&W Dual-Register Burner–Axially-Controlled Low-NOx (DRB-XCL®) burners and B&W Dual-Zone NOx Ports (NOx Portsare B&W’s version of OFA ports) were then installed, as discussed in the following sections.
B&W DRB–XCL® Burner: For this project, the existing burners were replaced by 12 B&WDRB-XCL® burners, arranged in four rows of three burners each. (See Figure 3.) The limitedspace available for the placement of the new burners caused some problems with ducting for thesecondary air. Also, some modifications to the burners were necessary, since they were designedto operate horizontally and had to be changed to operate vertically.DRB-XCL® burners use air and fuel staging to reduce the formation of NOx. Furthermore, theair can be regulated to balance the distribution of fuel and air to each burner. This balance isimportant for optimizing combustion efficiency and NOx reduction.
19
Sec
on
dar
y A
ir In
let
Burner 3(A Mill)
Burner 2(A Mill)
Burner 1(B Mill)
Burner 4(C Mill)
Burner 5(C Mill)
Burner 6(D Mill)
Sec
on
dar
y A
ir In
let
Sec
on
dar
y A
ir In
let
Sec
on
dar
y A
ir In
let
Burner 9(B Mill)
Burner 8(B Mill)
Burner 7(A Mill)
Burner 10(D Mill)
Burner 11(D Mill)
Burner 12(C Mill)
Fu
rnac
e D
ivis
ion
Wal
l
SecondaryAir Inlet
SecondaryAir Inlet
Figure 3. Plan View of Burner Arrangement after Retrofit
Figure 4 presents a schematic drawing of the B&W burners. The coal nozzle is centrally locatedin the burner in an arrangement that carefully limits the interaction of air and fuel in the base ofthe flame. The DRB-XCL® burner utilizes two air zones and multistage swirl vanes to regulatethe introduction of secondary air to the fuel. A separate register controls the mix of air and fuelfor each air zone. The conical diffuser and flame-stabilizing ring in the nozzle combine toimprove flame stabilization, stage the burning of the fuel, and reduce NOx emissions. Theadjustable inner vanes stabilize ignition at the nozzle tip, while the adjustable outer vanes controlthe mixing of the remaining secondary air into the flame.
Figure 4. Schematic of B&W DRB-XCL® Burner
B&W Dual-Zone NOx Port: Typical pulverized-coal boilers operate at 15- to 20-percent excessair. Reducing the flow of air to the burners decreases the formation of NOx, and the greater the
20
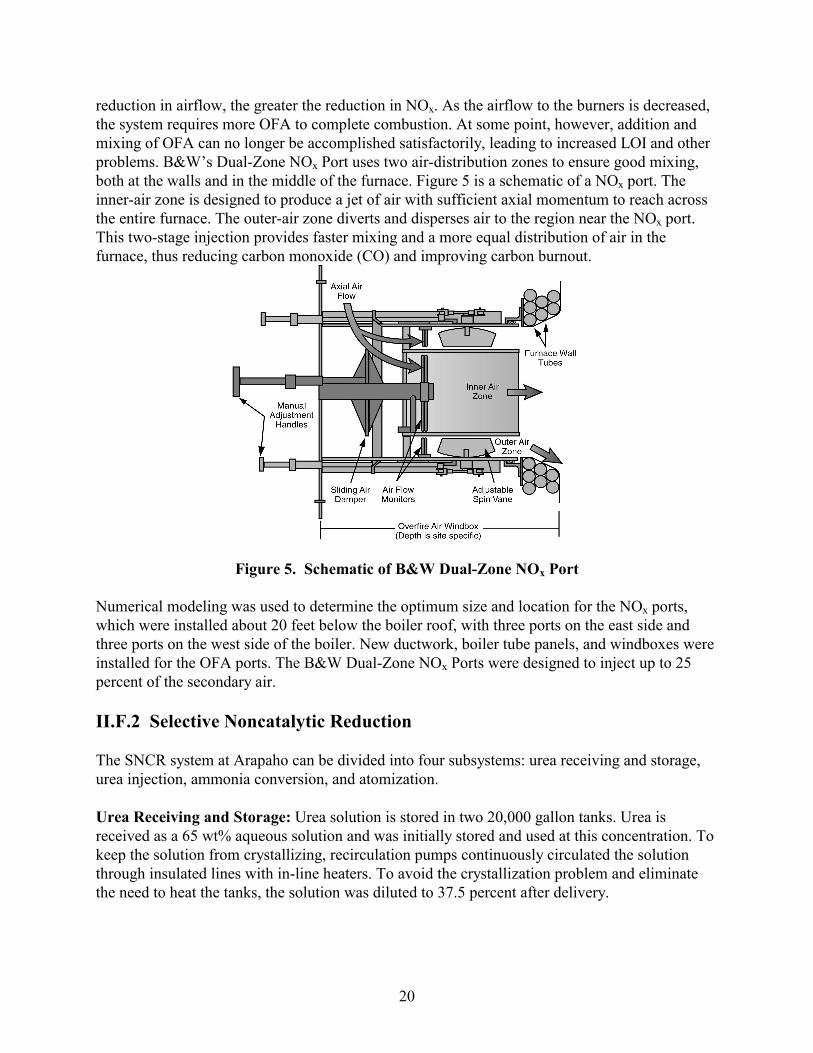
reduction in airflow, the greater the reduction in NOx. As the airflow to the burners is decreased,the system requires more OFA to complete combustion. At some point, however, addition andmixing of OFA can no longer be accomplished satisfactorily, leading to increased LOI and otherproblems. B&W’s Dual-Zone NOx Port uses two air-distribution zones to ensure good mixing,both at the walls and in the middle of the furnace. Figure 5 is a schematic of a NOx port. Theinner-air zone is designed to produce a jet of air with sufficient axial momentum to reach acrossthe entire furnace. The outer-air zone diverts and disperses air to the region near the NOx port.This two-stage injection provides faster mixing and a more equal distribution of air in thefurnace, thus reducing carbon monoxide (CO) and improving carbon burnout.
Figure 5. Schematic of B&W Dual-Zone NOx Port
Numerical modeling was used to determine the optimum size and location for the NOx ports,which were installed about 20 feet below the boiler roof, with three ports on the east side andthree ports on the west side of the boiler. New ductwork, boiler tube panels, and windboxes wereinstalled for the OFA ports. The B&W Dual-Zone NOx Ports were designed to inject up to 25percent of the secondary air.
II.F.2 Selective Noncatalytic Reduction
The SNCR system at Arapaho can be divided into four subsystems: urea receiving and storage,urea injection, ammonia conversion, and atomization.
Urea Receiving and Storage: Urea solution is stored in two 20,000 gallon tanks. Urea isreceived as a 65 wt% aqueous solution and was initially stored and used at this concentration. Tokeep the solution from crystallizing, recirculation pumps continuously circulated the solutionthrough insulated lines with in-line heaters. To avoid the crystallization problem and eliminatethe need to heat the tanks, the solution was diluted to 37.5 percent after delivery.
21
Urea Injection: Initially, urea injection occurred at each of two levels, through 10 injectors. (SeeFigure 6.) However, it was found that installation of the LNBs had changed the temperatureprofile in the furnace so that the temperature at the Level-2 injectors was too low for theseinjectors to be usable with urea. The ammonia converter improved performance at this injectionlocation, but to overcome the problem with urea injection, NOELL’s Advanced RetractableInjection Lances (ARILs) were installed through two unused sootblower ports. Each lance wasabout 20 feet long with a single row of nine injection nozzles on two-foot centers. A wallseparates Unit 4 into east and west halves (Figure 3), each with a width of approximately 20 feet.When a lance was inserted, the first and last nozzles were one foot from the inside and outsidewalls. Each nozzle consisted of a fixed-air orifice and a replaceable liquid orifice. This permittedadjustments to the chemical-injection pattern along the length of the lance to compensate formaldistribution of gas flow, NOx concentration, etc. The lances could also be rotated, providingfurther flexibility for urea injection.
One problem encountered was a tendency, over time, for the lances to become permanently bent,thus making their insertion and extraction difficult. A ceramic coating on the lances failed toovercome this problem. Diamond Power Specialty Company (DPSC) provided an alternativelance design that was simpler, but provided less control to balance urea injection. Although theDPSC lance operated satisfactorily, if lances are to be used for urea injection, especially on largerunits, an improved design would be desirable.
SOUTH NORTH
GAS FLOW
SECONDARY
SUPERHEATER
SCREEN TUBES
LEVEL 2(10 INJECTORS)
LEVEL 1(10 INJECTORS)
BURNERS
ARILLANCES
INJ.
Figure 6. SNCR Injection Nozzle Locations at Arapahoe Unit 4
Ammonia Converter: An ammonia converter, provided by NOELL, was added after tests withthe original burners showed that urea injection was not very effective for NOx removal at low-load levels with reduced furnace temperatures. Ammonia injection at these conditions was moreeffective, since ammonia reacts more rapidly than urea at lower temperatures. However, to avoidproblems with the storage and handling of ammonia, urea injection was preferred. To resolve thisissue, an online conversion system to convert urea to ammonia was installed. This system first
22
heats the urea solution and then passes it over a proprietary catalyst which decomposes the ureato ammonia and carbon dioxide, according to Equation 18:
(NH2)2CO + H2O ——> 2NH3 + CO2 (18)
A bypass valve on the converter gives the operator the option to either inject ammonia into thefurnace or bypass the converter and inject urea.
Atomization: NOELL’s proprietary dual-fluid injection nozzles were used to evenly distributeurea or ammonia in the boiler. A centrifugal compressor supplied up to 9,000 scfm of 4- to 12-psig air to the injection nozzles. This air helped atomize the injected solution, so that it mixedrapidly with the flue gas.
II.F.3 Dry Sorbent Injection and Flue Gas Humidification
The DSI installation was designed to operate at a hydrated-lime NSR of 2.0. Two identical DSIsystems were installed on Unit 4 to provide the capacity required at high sorbent-injection rates,as well as to provide backup at lower sorbent rates. These systems had the capability to injectcalcium-based sorbent into the boiler before the economizer, or sodium- or calcium-basedsorbents into the flue-gas duct between the air heater and the FFDC.
Sorbent was delivered by trucks that were unloaded pneumatically into storage silos. Each of thetwo parallel systems had a 150-ton storage silo, enough capacity for about five days of operation.A screw feeder discharged sorbent to a pneumatic conveying system which carried the sorbent toan Entoleter pulverizer, designed to grind the sorbent to 90 percent, passing through 400 mesh.The pulverizers were bypassed when the sorbent did not need to be ground.
The piping from each pulverizer connects to a splitter located on top of the duct, upstream fromthe FFDC. Each splitter separates the flow into six streams which feed six injectors. The 12injectors (six for each parallel system), which inject sorbent in the direction of flue-gas flow,form a two-by-six grid in the duct, with injectors from the two systems alternating to allow evendistribution of sorbent, even if only one system is operating. Originally, some difficulty wasencountered with plugging of the injection system, but equipment modifications eliminated mostof the problems.
In addition to the duct-injection site, which can be used for either sodium- or calcium-basedsorbent injection, calcium-based sorbent can also be injected into the superheater, referred to inthe project documentation as economizer injection. It would have been desirable to mount theinjectors on the front and back walls, but the construction of the furnace limited the injectors tothe side walls, with four injection lances located on each side wall. Each side was fed by one ofthe two systems, and on each side, splitters separated the main sorbent stream into four parts.
The FGH system consisted of four subsystems: water supply (from a variable-speed pump),compressed air, injection lances, and shield air. Flue-gas temperature was monitored by a grid of12 thermocouples in the flue-gas duct just upstream of the FFDC. To control the flue-gas
23
temperature at the thermocouple grid, the water flowrate was controlled either manually, bysetting a fixed rate, or automatically. The atomizing air system consisted of two compressors,with a combined capacity of up to 3,200 scfm at 140 psig. The water-injection lances were at thesame location as the duct sorbent-injection lances and were interspersed with them. The water-injection array consisted of a grid of 84 nozzles (12 wide by 7 high) made up of 14 injectionlances, each with 6 nozzles. Shield air was supplied to the lances to help prevent solidsdeposition on the nozzles and lances, and a rapper helped remove any collected solids.
24
III Technical and Environmental Assessment
This section discusses the results of the various test programs run on individual technologies anddifferent combinations of technologies, including the integrated system. Two Colorado low-sulfur (0.4 percent) bituminous coals, Cyprus Yampa Valley and Empire Energy, were thepredominant coals burned during these tests. The properties of these coals are given in Table 1.
Table 1. Properties of Test Coals
Proximate Analysis, wt% Cyprus Yampa Empire Energy
Moisture 10.6 13.2
Volatile Matter 34.1 33.8
Fixed Carbon 45.7 45.0
Ash 9.6 8.0
Ultimate Analysis, wt% dry
Carbon 70.3 70.9
Hydrogen 5.0 5.2
Nitrogen 1.8 1.5
Sulfur 0.4 0.4
Oxygen 11.8 12.8
Ash 10.7 9.2
Heating Value, Btu/lb (as rec’d) 11,050 10,600
In addition, there was a short test on a Wyoming subbituminous low-sulfur (0.35 percent) coal.As part of this project, a continuous emissions monitor (CEM) was installed on Unit 4 tomeasure the concentrations of the following gases: NO, CO, SO2, NO2, CO2, H2O, N2O, andNH3. Gas samples were taken at the exit of the air preheater and downstream of the FFDC.Flyash samples were collected at the exit of the air preheater and analyzed by a FERCo LOIanalyzer. Other data collected included furnace exit temperature and particulate size distribution.
III.A Technical Results
III.A.1 Low-NOx Burners and Overfire Air
Low-NOx burner testing was performed in two phases: parametric testing and long-term testing.The parametric testing was performed by setting boiler and burner parameters to specific valuesand recording results. Variables that were set included: boiler load, number of mills in service,excess air levels, and burner and OFA control settings. Long-term testing was performed byallowing the boiler to operate without interference from test personnel.
25
Figure 7 shows the effect of boiler load on NOx emissions during the parametric tests. Because ofthe need to keep the OFA ports cool, it was not possible to operate without any OFA. The linelabeled Min OFA represents 15 percent of the total secondary air. The line labeled Max OFArepresents operation with the OFA dampers fully open. As air flow and fan pressure changed,OFA flow changed, resulting in decreased maximum OFA as load increased. Maximum OFAvaried from 32 percent of total secondary air, at a load of 50 Mwe, to 24 percent at 80 MWe andabove. NOx reductions varied from 61 percent to 69 percent.
100
200
300
400
500
600
800
700
900
05040 60 70 80 90 100 110 120
NO
x (p
pmc)
Load (MWe)
Original Burners
XCL Burners w/Min OFA
XCL Burners w/Max OFA
Figure 7. NOx Emissions as a Function of Boiler Load
At maximum OFA, CO levels were lower than with the original burners. (See Figure 8.) Atboiler loads below 100 MWe, the new burners required a higher excess-air level to maintain anadequate steam temperature and a maximum CO level of 50 ppm. There was little difference infly-ash LOI between the new burners and the old, except at a load of 50 MWe, where the higherLOI may have been due to a change in operation from three mills to two. The operation of moremills appears to result in a more even distribution of coal to the burners and a finer grind, whichwould be expected to produce lower LOI.
The new burners resulted in an approximately 200 °F decrease in furnace exit temperature, whichimpacted the amount of excess air required to maintain steam temperature at reduced loads. Asdiscussed previously, this affected the location of the SNCR temperature window and changedthe point where urea was injected.
26
10
20
30
40
50
60
80
70
90
05040 60 70 80 90 100 110 120
CO
(p
pmc)
Load (MWe)
Original Burners
XCL Burners w/Min OFA
XCL Burners w/Max OFA
100
Figure 8. CO Emissions as a Function of Boiler Load
During long-term testing (November and December 1992), NOx levels were 10 to 20 percent (30to 60 ppm) higher than during the parametric tests. This was probably due to higher O2 levels; O2
levels were 1 to 1.5 percent higher during normal load following, and it was found with the newburners that NOx levels increased about 40 ppm for each 1-percent increase in O2 level.
III.A.2 Selective Noncatalytic Reduction
As with the LNBs, both parametric tests and a long-term test were performed with SNCR.Variables examined in the parametric tests were boiler load, SNCR-injection location, chemicalused (urea, converted urea, and ammonia), SNCR chemical-injection rate, sodium sorbent-injection rate (NSR of 0 to 2.5), and coal source. The long-term test was conducted with theSNCR system operating in automatic-control mode.
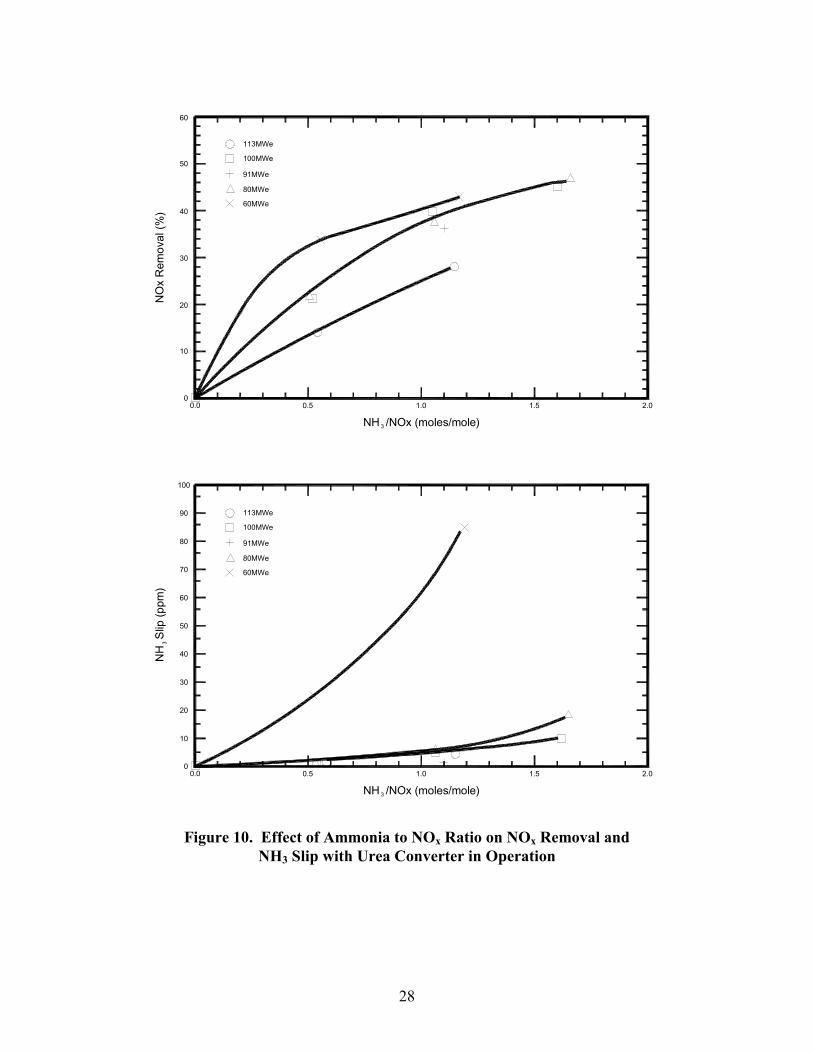
Initial tests were run before the LNBs were installed. These tests indicated that NOx reductionusing urea was not very effective at low boiler loads. However, when aqueous ammonia wasused, NOx-removal efficiency actually improved as boiler load decreased. Ammonia as a reagenthas approximately a 100 °F lower temperature window than urea, at least partly because a dropletof ammonia solution releases NH3 continuously during the evaporation process, whereas adroplet of urea solution does not release any ammonia until it is completely evaporated. Thebetter performance of ammonia at low loads led to the addition of the urea-to-ammonia converterdiscussed in Section II.F.2.
An extensive series of SNCR tests was run to establish the behavior of the system under a widevariety of conditions. (See Figures 9 and 10.)
27
0.50.0 1.0 1.5 2.0
10
0
20
30
40
50
60
70
80
90
100
60
0.00
10
40
30
20
50
0.5 1.0 1.5 2.0
100MWe, 6.0 gpm
80MWe, 2.2 gpm
60MWe, 2.0 gpm
111MWe, 6.0 gpm
NH
3 S
lip (
ppm
)
60MWe, 2.0 gpm
80MWe, 2.2 gpm
111MWe, 6.0 gpm
100MWe, 6.0 gpm
NO
x R
em
ova
l (%
)
Nitrogen in Urea/NOx (moles/mole)
Nitrogen in Urea/NOx (moles/mole)
Figure 9. Effect of Urea to NOx Ratio on NOx Removal and NH3 Slip
28
0.50.0 1.0 1.5 2.0
10
0
20
30
40
50
60
70
80
90
100
60
0.00
10
40
30
20
50
0.5 1.0 1.5 2.0
100MWe
80MWe
60MWe
113MWe
NH
Slip
(p
pm)
NH /NOx (moles/mole)
NO
x R
emo
val (
%)
91MWe
60MWe
80MWe
113MWe
100MWe
91MWe
3
3
NH /NOx (moles/mole)3
Figure 10. Effect of Ammonia to NOx Ratio on NOx Removal andNH3 Slip with Urea Converter in Operation
29
This work was necessary to develop correlations that could be used to automatically control theSNCR facilities when Unit 4 was run under normal load-following operations. A summary ofconclusions from the SNCR tests is given below.
• During base-load operation, urea injection allowed an additional 30- to 50-percent NOx
reduction while maintaining an ammonia slip of 10 ppm at the FFDC inlet. This increasedthe total system NOx reduction to greater than 80 percent at full load, significantlyexceeding the project goal of 70 percent.
• Boiler load was the predominate factor in determining the flue-gas temperature at theinjection location, and it had the largest effect on system performance.
• Variations in the total liquid and mixing airflows had only a small effect on both NOx
reduction and ammonia emissions over the range of flows tested.
• Urea injection resulted in N2O emissions of 29 to 35 percent of the NOx reduction. If theurea was passed through the ammonia converter before injection, N2O emissionsamounted to only 3 to 8 percent of the NOx reduction.
• On an equal ammonia-slip basis, converted urea provided higher NOx removals than urea.However, the increased NOx removal with converted urea required a higher chemical-injection rate and, thus, was less efficient.
• The use of retractable furnace lances greatly improved the low-load performance of theSNCR system at Arapahoe by injecting solution in the proper temperature range. At loadsbelow 70 MWe, NOx reduction increased from 11 percent with the wall injectors to 35 to52 percent with the retractable lances.
• The amount of ammonia that absorbed on the fly ash in the baghouse depended upon thefly-ash chemistry. With operation at 10 ppm ammonia slip at the FFDC inlet, ash-ammonia concentrations were in the range of 100 to 200 ppm, by weight. This level ofammonia did not cause any problems with odor or ash disposal when the SNCR wasoperated with the sodium-based DSI system out of service. However, as discussed inSection III.A.3., some problems were encountered when sodium-based DSI was inoperation.
While the ammonia-conversion system greatly improved performance at low load, NOx reductionwas still less than at full-load operation. To permit urea injection through ports located before theboiler nose, where the flue-gas temperature was sufficient for efficient urea reactions, a pair ofARIL lances (described in section II.F.2-Urea Injection) that could be inserted into the furnacewhile operating at low load, were designed and installed in two unused sootblower air ports.These lances were designed to allow for rotation while inserted so that the urea could be injectedinto different flue-gas temperature ranges from a single boiler penetration. The ARIL lancesprovided greatly increased NOx reduction at low load that allowed SNCR performance to remainrelatively uniform over the normal operating load range of Arapahoe Unit 4. (See Figure 11.)
30
(a) NO Removal
(b) NH3 Emissions
Figure 11. Effect of Urea to NOx Ratio on NOx Removal andNH3 Slip with ARIL Lances in Use
Load (injection angle)
0
10
20
30
40
50
60
0 0.5 1 1.5 2 2.5 3
Nitrogen in Urea/NOx (moles/mole)
NO
Rem
ova
l (%
)
43MW(90)
50MW(45)
60MW(34)
70MW(22)
80MW(22)
Load (injection angle)
0
5
10
15
20
25
0 0.5 1 1.5 2 2.5 3
Nitrogen in Urea/NOx (moles/mole)
NH
3 S
lip (
ppm
) 43MW(90)
50MW(45)
60MW(34)
70MW(22)
80MW(22)
31
III.A.3 Dry Sorbent Injection
The DSI system was operated both with sodium-based sorbents and with calcium-based sorbents.These tests are discussed in the following sections.
Sodium-based Sorbents: While the primary purpose of dry sorbent injection is SO2 removal,with sodium-based sorbents a small reduction in NOx also occurs. The objective of the sodium-based dry sorbent test program was to develop performance data with respect to SO2 removal,NOx removal, and NO2 emissions with sodium-sesquicarbonate and sodium-bicarbonateinjection and to demonstrate the long-term performance of the system. For most tests, the sorbentwas injected just downstream of the air preheater, but a few tests were conducted with injectionat a higher temperature location before the air preheater. The primary variables investigated wereNSR, sorbent type, and boiler load. Humidification was briefly tested during sodium-sesquicarbonate injection, with the primary variable being the approach to adiabatic saturationtemperature. Both short-term parametric tests and long-term tests were performed. Properties ofthe two sodium-based sorbents that were tested are given in Table 2.
Mass Mean DiameterAs Received 27.8 µm 61.5 µmPulverized 17.0 µm 18.8-24.3 µm
With the low sulfur coal fired at the Arapahoe Station, sodium-based DSI had a higher SO2-removal efficiency than calcium-based DSI. A summary of test findings is presented below:
• Both sodium-sesquicarbonate and sodium-bicarbonate DSI achieved steady-state SO2
removals of 70 percent. The time to reach steady-state with sodium-bicarbonate injectioninto 220- to 280-°F flue gas before the FFDC was slow. However, when injected beforethe air heater at 650oF, SO2 removal with sodium-bicarbonate injection reached steady-state much more rapidly with good reagent utilization.
• When injected before the fabric filter, sodium-sesquicarbonate injection worked well overthe tested flue-gas temperature range of 220 to 280 °F. (See Figure 11.) The same steady-state SO2 removal that was achieved with injection before the fabric filter was alsoachieved with injection before the air heater at 650 °F.
32
• At 70-percent SO2 removal, sodium-bicarbonate injection before the air preheaterrequired an NSR of approximately 1.0, while sodium-sesquicarbonate injection before theFFDC required an NSR of approximately 1.9. (See Figure 12.) As the SO2-removal leveldecreases, the NSR ratio between the two reagents decreases rapidly.
0.50.0 1.0 1.5 2.0
10
0
20
30
40
50
60
70
80
90
100
80MWe
100MWe
60MWe
SO
R
em
ova
l (%
)
NSR
110MWe
2.5
2
Sequicarbonate
Bicarbonate
Various
Figure 12. Effect of NSR on SO2 Removal for Injection of SodiumSesquicarbonate Before the FFDC
• SO2-removal efficiency with sodium sesquicarbonate increases substantially as particlesize is reduced. At an NSR of 0.9, a 28-µm mean diameter achieved 28-percent SO2
removal, a 17-µm mean diameter achieved 42-percent SO2 removal, and a 15-µm meandiameter achieved 48-percent SO2 removal. SO2-removal efficiency with sodiumbicarbonate showed less dependence upon particle size. At an NSR of 0.9, a 25-µm meandiameter achieved 58-percent SO2 removal, while an 18-µm mean diameter achieved 60-percent SO2 removal.
• Humidification of the flue gas to a 60 °F approach to saturation temperature increasedSO2 removal by up to 20 percent, when injecting sodium sesquicarbonate at an NSR of2.0. At an NSR of 1.0, humidification had little effect.
33
• Boiler load had little, if any, effect on the required chemical-injection rate for eithersodium sesquicarbonate or sodium bicarbonate.
• Some NOx reduction is associated with both sodium-sesquicarbonate and sodium-bicarbonate DSI. At 70-percent SO2 removal, approximately 10-percent NOx reduction isobtained with either reagent, but the amount of NOx reduction varied for unknownreasons and could not be controlled.
• Both sodium sesquicarbonate and sodium bicarbonate result in the oxidation of NO toNO2, probably due to some form of catalysis. When compared at the same SO2-removalrate, sodium sesquicarbonate produced only half as much NO2 as sodium bicarbonate.
Calcium-based Sorbents: As with the other systems discussed above, both short-termparametric tests and long-term tests were performed with calcium-based sorbent injection. Theproperties of the sorbent used are given in Table 3.
Table 3. Properties of Hydrated-lime Sorbent
Sorbent Hydrated LimeFormula Ca(OH)2
CaO Content 68 wt%Mass Mean Diameter 2.67 µmBET Surface Area 14.8 m2/g
The primary parameters which control SO2 removal with calcium-hydroxide (Ca(OH)2) injectionand FGH are the NSR of the injected sorbent and the approach to adiabatic saturationtemperature. (See Figure 13.) Hydrated lime was injected at two locations: into the boiler, wherethe temperature was 1000 °F, and after the air preheater, where the temperature was 250 °F .Results from these tests are summarized below.
• The highest SO2 removal was obtained with duct injection with humidification to anapproach to saturation temperature of 25 to 30 °F. (See Figure 12.) At an NSR of 2, SO2
removal ranged from 28 to 40 percent.
• The majority of the SO2 removal occurred during the entrained phase before the waterwas evaporated. At most, 5 percent of the overall reduction occurred on the fabric filter.
• Some ash buildup occurred in the duct during humidification, although PSCC indicatesthat this should be manageable.
• Only 5- to 10-percent SO2 removal was obtained with hydrated-lime injection before theeconomizer at a flue-gas temperature of 950 to 1150 °F and an NSR of 2. Poor reagent
34
distribution was probably a major cause of the poor performance. Sampling across atraverse of the flue gas at the boiler outlet showed that, even at points near the wall,where the local NSR was estimated at 6.0, only 30-percent SO2 removal was obtained.
• Humidification during economizer injection of hydrated lime did not significantlyimprove SO2 removal. A significant amount of the injected hydrated lime reacted withCO2 to form calcium carbonate (CaCO3).
• In general, SO2 removal with hydrated lime was substantially less than expected, and thegoal of 50-percent removal was not met.
1.25 - 1.75
0.75 - 1.25
1.75 - 2.25
SO
R
em
ova
l (%
)
Approach to Adiabatic Saturation Temperature ( F)
0
10
20
30
40
50
10 20 30 40 50 60 70 80
2
Ca/S Ratio
Figure 13. Effect of Approach to Adiabatic Saturation Temperature on SO2
Removal with Calcium Hydroxide Injection
III.A.4 Integrated System
The integrated system consisted of LNBs/OFA, SNCR, and sodium-based DSI. It was expectedthat the combined technologies would integrate synergistically to control NOx and SO2 emissions
35
more effectively than if each technology were used alone. Integrated operation involved bothparametric and long-term tests. Following are conclusions from these tests.
• The integrated system achieved 80-percent NOx removal and 70-percent SO2 removal.
• The integration of SNCR with sodium-based DSI decreased by approximately 50 percentof the level of NO2 emissions that occur when sodium-based DSI is used without SNCR.
• The integration of sodium-based DSI and SNCR decreased the level of ammoniaemissions that occur with SNCR alone, although the effect was difficult to quantify. Fromresults of the long-term tests, it is estimated that a 50-percent reduction occurred inammonia slip when operating the sodium injection system at 70-percent SO2 removal.Interpreting results was difficult because, as ammonia emissions were reduced, thecontrol system automatically increased the urea injection rate to provide for higher NOx
reductions at the same ammonia slip. Conversely, the ammonia slip could be reduced by50 percent while maintaining the same NOx removal. These estimates take into accountthe approximately 10-percent NOx removal that the sodium-based injection systemprovided.
• For a given type of ammonia slip, fly-ash ammonia absorption increased with integratedoperation of sodium-based DSI and SNCR, compared to SNCR alone. At 8 ppmammonia slip, fly-ash ammonia ranged from 400 to700 ppm versus 100 to 200 ppm withSNCR alone. One benefit of integrated operation is that, at conditions resulting inreduced ammonia slip, the urea injection rate can be increased to provide higher NOx
reduction without increasing ammonia slip. Reducing the ammonia slip to 4 ppm reducedthe ammonia concentration in the ash to the 100- to 200-ppm range that occurred withSNCR alone.
• With the integrated system, the ammonia odor in the ash truck-loading area increased andbecame a concern. When the fly ash was wetted to control fugitive dust emissions, therapid pH change that occurred due to sodium injection caused a more rapid release of theabsorbed ammonia. This problem was solved by transporting the ash in enclosed tankertrucks, and by not adding water at the site.
III.B Environmental Performance
The IDECS project was designed to comply with all applicable federal and state air, water, andsolid-waste regulations. Operation of this CCT demonstration project did not increase the volumeor composition of plant emissions, except for the following: CO2-emission levels increased veryslightly due to the decomposition of injected urea, and total fly-ash quantities increased slightlydue to DSI. SO2- and NOx-emission levels decreased significantly. No problem areas wereidentified concerning environmental regulations or permit conditions due to operation of theIDECS project.
36
Calcium-based DSI plus humidification did not perform satisfactorily and is not likely to beimplemented on any other units. Therefore, there is no need to discuss the effects of calcium-based DSI on environmental performance.
There are some potentially undesirable side effects when using sodium-based DSI with theintegrated system. With sodium-based DSI, some NO in the flue gas is oxidized to NO2. If theconcentration is high enough, coloration of the stack plume can result. Also, sodium-based DSIresults in additional NH3 adsorption on the ash, which may prevent the ash from being slurried orsold as a concrete additive. With increased fly-ash NH3 levels, the ammonia odor in the ashtruck-loading area increases (when the fly ash is wetted to control fugitive dust), and may alsoresult in a pollution problem when landfilling the ash. Any replication of the IDECS technologymust take these factors into account.
The IDECS project included a comprehensive investigation into many potential air-toxicemissions. Four separate air-toxics tests were completed: (1) low NOx combustion, (2) SNCR,(3) DSI using calcium-based reagent, and (4) DSI using sodium-based reagent. The detailedfindings of the air-toxics tests are documented in the Appendices to the Final Report (Hunt andHanley 1999). Tests show that the use of a FFDC for particulate control was very effective forcontrolling nearly all air toxic emissions. Overall particulate removal was greater than 99.9percent, and the average trace-metal-emission removal was over 96.9 percent. Mercury removalwas higher than expected and very near the detection limit.
37
IV Market Analysis
IV.A Market Size
IDECS consists of the integration of several technologies that were in various stages ofcommercialization at the time this project was initiated. PSCC developed and owns the rights (inthe form of an issued U.S. patent) to the integration and concurrent use of sodium-based drysorbent injection and SNCR. B&W developed and owns the rights to the low-NOx burners(LNBs), the NOx ports, and the duct humidification technologies. SNCR is being marketed byNOELL and other vendors, with certain proprietary aspects to the different versions of thistechnology. DSI is public domain technology, although there may be proprietary aspects to someversions.
IDECS was developed as a retrofit application for pre-NSPS boilers that might require up to 70-percent reductions in SO2 and NOx emissions. In particular, it was developed to meet the site-specific requirements for some of the more difficult boiler emission-control situations. A marketanalysis indicated that the following units have the need for further NOx and SO2 reductions.
Because of their age and design, these units generate high levels of NOx and because of lack ofplot area, they are difficult to retrofit with existing SO2 removal technologies. They also tend tobe relatively small. As a result of these considerations, utilities will be very sensitive to capitalcosts for new equipment for these units. Many utilities are considering fuel switching orretirement; however, IDECS provides an economic alternative that can extend their lives.
The Final Report (Hunt and Hanley. 1999) discusses a “secondary market,” which includesapplications for some, but not all, of the technologies making up the integrated IDECS package.Because partial application would not incorporate the synergies inherent in the combined system,and the primary objective of the project was to demonstrate the benefits of the integrated IDECSsystem, this PPA does not include an evaluation of this “secondary market.”
The recent trend is toward technologies that provide maximum removal capabilities, rather thanselection of technologies that achieve lower removals, but at a more economical cost. This trendmay limit the market for IDECS. Nevertheless, there are still a number of units that wouldbenefit from IDECS, especially units that can use emissions averaging to meet emissions limits.
PSCC intends to continue market exposure of IDECS in those cases where the benefits of thesystem can be maximized. PSCC is studying the potential of installing all or parts of IDECS on anumber of its units, but applicability may be relatively limited, based on recent strictenvironmental requirements. B&W has a large market share in the environmental-control
38
industry and is exposing potential customers to IDECS, when it meets specific requirements forcost and contaminant-removal levels.
IV.B Economics
An economic analysis for commercial application of IDECS on a generic 100-MWe power plantwas performed, based on the values of the economic parameters shown in Table 4. However,when estimating costs for a particular installation, scope adjustments and site-specific factors(such as unit size, number of spares kept on site, design coal properties, space availability, andnecessary furnace penetrations) need to be taken into account. The most likely initial applicationof this technology will be to retrofit existing power stations. IDECS is generally intended forsmaller units; therefore, economics for this project were determined for a 100-MWe unit (insteadof the usual 300-Mwe unit). Because of the relatively small unit size, the cost of removal ofpollutants on a $/ton basis is increased. The economics are based on the assumption that thetechnologies are mature and incorporate experience gained from this demonstration.
Table 4. Economic Parameters Used in IDECS Economic Evaluations
Cost of Debt, % 8.5Dividend Rate for Preferred Stock, % 7.0Dividend Rate for Common Stock, % 7.5Debt/Total Capital, % 50.0Preferred Stock/Total Capital, % 15.0Common Stock/Total Capital, % 35.0Income Tax Rate, % 38.0Investment Tax Credit, % 0.0Property Tax & Insurance, % 3.0Inflation Rate, % 4.0Discount Rate (with Inflation), % 7.925Discount Rate (without Inflation), % 3.744Escalation of Raw Materials above Inflation, % 0.0Construction Period, Years 1Allowance for Funds Used During Construction, % 0.0Remaining Life of Power Plant, Years 15Year for Costs Presented in this Report 1994Royalty Allowance, % of Total Capital 0.5Capital Charge Factor - Current Dollars 0.160
- Constant Dollars .124O&M Levelization Factor - Current Dollars 1.314
- Constant Dollars 1.000Power Plant Capacity Factor, % 65Sales Tax Rate, % 5.0Cost of Freight for Process Equipment, % 2.0General Facilities, % of Total Process Capital 10.0Engineering and Home Office, % of Total Process Capital 10.0
39
IV.B.1 Capital Cost
Capital costs for installing IDECS on a 100 MWe unit with a 65-percent operating factor similarto Arapahoe Unit 4 are given in Table 5. This table shows that the cost of calcium-based DSIplus humidification is much higher than sodium-based DSI, and since sulfur-removal efficiencyis much lower for the calcium-based system, calcium-based DSI does not look attractive.Therefore, the integrated system used in this cost analysis consisted of LNBs with OFA, SNCR,and sodium-bicarbonate based DSI. Capital costs in 1994 dollars for LNBs with OFA are$129/kW, $42/kW for SNCR, and $25/kW for DSI, which gives a total of $196/kW for theintegrated system. These are reasonable costs for a combined NOx/SO2 control system.
IV.B.2 Operating Cost
Operating costs for IDECS (LNBs, SNCR, and sodium-bicarbonate DSI) on a 100 MWe powerplant are shown in Table 6. The costs shown are only the incremental costs resulting frominstallation of IDECS. Fixed operating costs are $0.32 million/yr, and variable operating costs are$1.49 million/yr, for a total operating cost of $1.8 million/yr.
IV.B.3 Economics
The impact of IDECS on power costs is shown in Table 7. The analysis was conducted for a 100MWe power plant operating at a 65-percent capacity factor with an initial (before IDECS) NOx
level of 1.15 lb/MBtu and SO2 level of 0.66 lb/MBtu. NOx removal is 79 percent , and SO2
removal is 70 percent . Costs are levelized both on a current-dollar and constant-dollar basis.Levelized costs are $1,358/ton of NOx plus SO2 removed on a current-dollar basis and $1,044/tonon a constant-dollar basis. Busbar costs are 9.7 mills/kWh on a current-dollar basis and 7.4mills/kWh on a constant-dollar basis.
Additional economic analyses were performed to determine the impact of various parameters oneconomics. The result of these analyses, which were performed on a constant-dollar basis, areshow in Table 8.
As plant size increases, capital and fixed costs per MWe decrease, while variable costs stay aboutthe same on a per MWe basis. The overall effect is a decrease in the $/ton of NOx plus SO2
removed as the plant size increases. As capacity factor increases, the $/ton of pollutant removeddecreases. Since the capital costs are fixed, increasing the capacity factor increases the quantityof NOx removed for a given capital investment. Costs are also sensitive to initial NOx level. At afixed percentage level of reduction, as the initial NOx level decreases, the absolute quantity ofNOx removed also decreases, and the $/ton of NOx removed increases.
40
Table 5. Capital Costs for Installing the Integrated Dry NOx/SO2 Emissions Control System100-MWe Unit, 65% Operating Factor (1994 dollars)
Cost of Construction Downtimee 4.37 43.68 0.55 5.46 0.16 1.56 0.16 1.60 5.08 50.70
Total Capital Requirement 12.86 128.63 4.13 41.27 2.53 25.19 4.33 43.38 19.52 195.09
a 0.4 lb NOx/MBtu, 40% NOx removalb 0.4% sulfur coal, 70% SO2 removal, sodium bicarbonate (for sodium-sesquicarbonate sorbent, there is an insignificant increase in
inventory)c 0.4 % sulfur coal, 15% SO2 removal, hydrated-lime sorbentd Integrated system consists of low-NOx combustion system, SNCR, and sodium-bicarbonate DSI; precontrol NOx of 1.15 lb/MBtu,
79% NOx removal; precontrol SO2 of 0.66 lb /MBtu, 70% SO2 removale Based on a cost of replacement power of $0.05/kWh
41
Table 6. Operating Costs for the Integrated Dry NOx/SO2 Emissions Control System100-MWe Unit, 65% Operating Factor
Table 8. Effect of Operating Parameters on IDECS Economics
Plant Size, MWe $/ton NOx + SO2 Removed
50 1,775
100 1,358
300 998
Capacity Factor, % $/ton NOx + SO2 Removed
10 5,002
30 2,131
65 1,358
43
V Conclusions
The goal of this project was to demonstrate a new combination of technologies that could meetfuture environmental requirements and obtain up to 70-percent reduction of NOx and SO2
emissions. A secondary, but very important goal, was to accomplish this at a lower capital andoperating cost than technologies available at the time this project was initiated. In general, thesemajor goals were achieved. Specific conclusions are the following:
• LNBs plus OFA achieved up to 69-percent NOx reduction without increasing CO levelsor LOI.
• During base-load operation, urea injection achieved an additional 30- to 50-percent NOx
reduction while maintaining an ammonia slip of 10 ppm at the FFDC inlet. This increasedthe total system NOx reduction to greater than 80 percent at full load, exceeding theproject goal of 70 percent.
• Urea injection resulted in increased N2O emissions of 29 to 35 percent of the NOx
reduction. If the urea was passed through the ammonia converter before injection, N2Oemissions amounted to only 3 to 8 percent of the NOx reduction.
• With SNCR in operation, ammonia will absorb on the fly ash in the baghouse, the amountdepending upon fly-ash chemistry. Sodium-based DSI increases the ammonia level in theash and may cause odor or ash-disposal problems.
• Design of the urea injection lances is important for proper SNCR performance, especiallywith large units.
• Both sodium-sesquicarbonate and sodium-bicarbonate DSI achieved 70-percent SO2
removal, but hydrated-lime injection achieved only low SO2 removals. Thus, hydrated-lime injection is unlikely to be implemented on other units.
• Both sodium sesquicarbonate and sodium bicarbonate cause the oxidation of NO to NO2,probably by a catalytic reaction. This results in a slight decrease (less than 10 percent) inoverall NOx emissions, but higher than baseline NO2 stack emissions. Because NO2 ishighly colored, this may lead to a visible stack plume at high sodium-injection rates.When compared at the same SO2-removal rate, sodium sesquicarbonate creates only halfas much NO2 as sodium bicarbonate.
• The integration of SNCR with sodium-based DSI decreased NO2 emissions byapproximately 50 percent, compared with using sodium-based DSI without SNCR. Thecombination also decreased ammonia emissions that occur with SNCR alone, but thelevel was difficult to quantify.
44
This project can be declared a technical success, because the technical goals were generally metand the facility is continuing to use the technology to lower emissions levels. However, thepotential market for the integrated system appears to be somewhat limited, in large part becauseof the more stringent air pollution regulations now in effect compared to those in effect when thisproject was instituted, and the trend towards installing more expensive processes that achievehigh removal levels. Also, the sodium and ammonia contents of the ash may limit ash sales andpresent disposal problems in some cases.
45
Abbreviations
ARILs Advanced Retractable Injection LancesB&W Babcock & WilcoxCaCO3 calcium carbonateCa(OH)2 slaked or hydrated lime, or calcium hydroxideCCT Clean Coal TechnologyCEM continuous emissions monitorCO carbon monoxideCO2 carbon dioxideDOE U.S. Department of EnergyDPSC Diamond Power Specialty CompanyDRB-XCL® Dual-Register Burner–Axially-Controlled Low-NOx
DSI dry sorbent injectionEPRI Electric Power Research InstituteFERCo Fossil Energy Research CorporationFFDC fabric-filter dust collectorFGD flue-gas desulfurizationFGH flue-gas humidificationHNCO cyanic acidIDECS Integrated Dry NOx/SO2 Emissions Control SystemLNB low-NOx burnerLOI loss-on-ignitionNa2CO3 soda ashNa2CO3•NaHCO3•2H2O sodium sesquicarbonateNaHCO3 sodium bicarbonate(NH2)2CO ureaNH3 ammoniaNO nitric oxideNOx nitrogen oxidesNO2 nitrogen dioxideN2O nitrous oxideNSPS New Source Performance StandardsNSR normalized stoichiometric ratioOFA overfire airPPA post-project assessmentPSCC Public Service Company of ColoradoSCR selective catalytic reductionSNCR selective noncatalytic reductionSO2 sulfur dioxideSOW statement of workTAS approach to saturation temperatureWRI Western Research Institute
46
References
Hunt, T. and T.J. Hanley. 1997. Integrated Dry NOx/SO2 Emissions Control System Final Report,Volume 1: Public Design.
Hunt, T. and T.J. Hanley. 1999. Integrated Dry NOx/SO2 Emissions Control System Final Report,Volume 2: Project Performance and Economics.
Muzio, L.J., R.A. Smith, and T. Hunt. 1997. Integrated Dry NOx/SO2 Emissions Control SystemRetractable Lance SNCR Test Report.
Shiomoto ,G.H., R.A. Smith, and T. Hunt. 1992. Integrated Dry NOx/SO2 Emissions ControlSystem: Baseline Test Report
Shiomoto, G.H., R.A. Smith, and T. Hunt. 1994. Integrated Dry NOx/SO2 Emissions ControlSystem: Calcium Test Report.
Smith, R.A., G.H. Shiomoto, L.J. Muzio, and T. Hunt. 1993. Integrated Dry NOx/SO2 EmissionsControl System: Baseline SNCR Test Report.
Smith, R.A., L.J. Muzio, and T. Hunt. 1994a. Integrated Dry NOx/SO2 Emissions ControlSystem: Low-NOx Combustion System Retrofit Test Report.
Smith, R.A., L.J. Muzio, and T. Hunt. 1994b. Integrated Dry NOx/SO2 Emissions ControlSystem: Low-NOx Combustion System Retrofit Test Report.
Smith, R.A., G.H. Shiomoto, L.J. Muzio, and T. Hunt. 1997a. Integrated Dry NOx/SO2
Emissions Control System: Sodium-Based Dry Sorbent Injection Test Report.
Smith, R.A., L.J. Muzio, and T. Hunt. 1997b. Integrated Dry NOx/SO2 Emissions ControlSystem: Integrated System Test Report.
Smith, R.A., L.J. Muzio, and T. Hunt. 1997c. Integrated Dry NOx/SO2 Emissions ControlSystem: Advanced Retractable Injection Lance SNCR Test Report.
U. S. Department of Energy. 1991. Comprehensive Report to Congress—Clean Coal TechnologyDemonstration Project—Integrated NOx/SO2 Emission Control System.
47
Bibliography
Hunt, T. and J. Doyle. 1992. Integrated Dry NOx/SO2 Emissions Control System Update. Paperpresented at First Annual Clean Coal Technology Conference, September 1992, Cleveland, OH.
Hunt, T. and J. Doyle. 1992. Integrated Dry NOx/SO2 Emissions Control System-Update. Paperpresented at International Power Generation Conference, October 1992, Atlanta, GA.
Hunt, T., et al. 1993. Low-NOx Combustion Modifications for Top-Fired Boilers. Paperpresented at EPRI/EPA Joint Symposium on Stationary NOx Control, May 1993, Miami Beach,FL.
Hunt, T., G. Schott, R. Smith, L. Muzio, D. Jones, and J. Steinberger. 1993. Selective Non-Catalytic Operating Experience Using Both Urea and Ammonia. Paper presented at EPRI/EPAJoint Symposium on Stationary NOx Control, May 1993, Miami Beach, FL.
Hunt, T., R. Smith, L. Muzio, D. Jones, E. Mali, and T. Arrigoni. 1993. Preliminary Performanceand Operating Results from the Integrated Dry NOx/SO2 Emissions Control System. Paperpresented at Second Annual Clean Coal Technology Conference, September 1993, Atlanta, GA.
Hunt, T., E. Mali, J. Stallings, R. Smith, L. Muzio, and D. James. 1994. Current Progress withthe Integrated Dry NOx/SO2 Emissions Control System. Paper presented at Third Annual CleanCoal Technology Conference, September 1994,Chicago, IL.
Hunt, T., L. Muzio, and R. Smith. 1995. NOx Reduction on a Coal-Fired Utility Boiler with Low-NOx Burners, Overfire Air, and SNCR. Paper presented at Engineering Foundation Conferenceon Economic and Environmental Aspects of Coal Utilization VI, January 1995,Santa Barbara,CA.
Hunt, T., L. Muzio, R. Smith, D. Jones, E. Mali, and J. Stallings. 1995. Performance of theIntegrated Dry NOx/SO2 Emissions Control System. Paper presented at Fourth Annual CleanCoal Technology Conference, September 1995, Denver, CO.
Hunt, T., L. Muzio, R. Smith, D. Jones, J.L. Hebb, and J. Stallings. 1997. Integrated DryNOx/SO2 Emissions Control System Performance Summary. Paper presented at Fifth AnnualClean Coal Technology Conference, January 1997, Tampa, FL.
Mali, E., et al. 1993. Low-NOx Combustion Modifications for Down-Fired Pulverized CoalBoilers. Paper presented at American Power Conference, April 1993, Chicago, IL.
Smith, R., et al. 1994. Operating Experience with the Integrated Dry NOx/SO2 EmissionsControl System. Paper presented at 207th ACS National Meeting, March 1994, San Diego, CA.
U. S. Department of Energy. 1999. Technologies for the Combined Control of Sulfur Dioxide andNitrogen Oxides Emissions from Coal-Fired Boilers, Clean Coal Technology Topical Report No.13.