1Faculty of Earth Resource, China University of Geosciences, Wuhan, China 2Department of Geology, ENI-ABT, Bamako, Mali 3Department of Hydrology and Water Resources, School of Environmental Studies, China University of Geosciences, Wuhan, China
Abstract Detecting the anomalies’ sources location in the vast territory such as Koure-male area is a grand challenge for geophysicists because there is a need to assess gold deposit. Therefore, this paper aims to recommend a methodological ap-proach on applied magnetic survey and soil geochemistry to identify the loca-tion of anomalies’ sources. To that aim the study is divided into phases. In the first phase, the maps for integrated interpretation have been produced by Geo-soft Oasis and ArcGIS 10.2.1. The corrected and processed magnetic data with eliminated diurnal variation have been used. Phase two consist of integrate geochemical soil map. The results of phase one identified four magnetic anoma-lies zones (MAZ) with their coordinates. Thus, the obtained radiometric map, showed that there is a high intensity of K and Th compared to U, which indi-cates a significant weathering process and there are many saprolithes in study area. The findings of phase two revealed that there is a high concentration of gold content (1500 ppm) with an average concentration of 92 ppm. The inte-grated interpretation map coming from the combined different maps, referring to the geological information verified on the field, led to conclude that, the tar-get B is the best gold anomaly. The delimitation of the space of the target B from the geophysical and geochemical information confirmed the existence of li-mited, restricted and potential anomaly.
DOI: 10.4236/ijg.2017.89065 1134 International Journal of Geosciences
1. Introduction
Identifying the location of anomalies’ sources in a vast territory such as Koure-male area of Mali is a grand challenge for geophysicists because the economic evaluation and concentration of gold have to be defined in this area, which is a famous area for gold panning activity. This informal gold exploitation makes up an important activity and a source of incomes for the inhabitants of the town of Kouremale situated between the Mali-Guinea borders. Gold mining in Mali has a long history [1]. The birimian rocks are major sources of gold in Mali accord-ing to Geological synthesis of the birimian in Mali [2]. The main purpose of this study is to contribute to find a potential area of gold anomaly. However, gold deposit exploited in the syama in southern MALI occur along a north-northeast trending mineralized litho-structural corridor that trends for approximately 40 km [3].
2. Geological Setting and Location of Study Area
The Kouremale area situated in south of Mali, is a part of the geological subdivi-sion of the Yanfolila area (Figure 1) in the southern desert of Sahara (West Africa). A geological map (Figure 1) made at the scale of 1/50000 sums up the geological information especially the characteristics of the birimian [4] which
DOI: 10.4236/ijg.2017.89065 1135 International Journal of Geosciences
has been defined in the valley of the river birrin around the twenties. The fol-lowing map below (Figure 2) describes the geological aspects of the study area and presents the different types of rocks and the geographical delineation of the study area. The kouremale sector is located at the border Mali-Guinea, 150 Km in the South of Bamako the capital of Mali, connected by the national highway number 5. In the town of kouremale, the production of cereals and cotton are the main economic activities of people, yet gold panning is becoming a good way to increase the inhabitants’ incomes [5].
The south birimian belongs to the Precambrian in the vast West African cra-ton located between the shield Man (South) and the dorsal Reguibat (North). The southern Mali geology where the study area is located is made up of biri-mian and volcano-sedimentary rocks affected by a low-grade metamorphism occurred during the orogeny Eburneen (2.1 Ga) and some intrusions appearing during and after the orogeny. The south of Mali is bordered by the Taoudeni ba-sin. According to Geological synthesis of the birimian in Mali, 2006 the birimian rocks are made up fine grained sedimentary and volcanic rocks. The sedimenta-ry sequence is constituted of meta-arenites, metaargilites, metagreywackes and carbonates. The volcanic formation is made up of tuffs, andesites, basalts and dacites. In the north east, the fault Banifing, the most significant within the south of Mali has a left lateral displacement with several parallel shear zones, This structure is 500 Km long. We also have the gold province constituted of Kalana and kodieran. The gold fields of southern Mali are located over an anti-cline oriented north south, which is 150 Km long and 40 Km wide crossed by three faults systems (see Figure 1). Some massive granites [6] and intrusive dolerites appear within this area Identification of the rocks komatiites and
Figure 2. Geological map of Kouremale with the study area (source DNGM).
DOI: 10.4236/ijg.2017.89065 1136 International Journal of Geosciences
lamprophyre in the field of kalana [7]. The intrusive rocks are classified accord-ing to their petrography (characteristics, composition and morphology).
3. Materials and Method
To reach this goal, the processing and interpretation of magnetic data of the stu-died area are required. Then, reliable geochemical and geological information require the understanding of West African craton.
In order to obtain 2D integrated interpretation image of anomaly source by using softwares. The geophysical and geochemical data collection and elabora-tion performed by the company EUREKA GEO as part of the exploration project of Kouremale.
Two magnetometers GSM-19 units, the first is maintained fixed in a defined point all over the duration of the survey, to measure temporal variations of magnetic field at regular time intervals (1 second). The second magnetometer utilized to measure the earth magnetic field variations with respect to the survey lines covering study area. The geographical positioning of the measurements ensured by a GPS composed of two units.
The first is set at a reference point called station basis, with a known coordi-nates, whereas the second displaced at different measuring points of the mag-netic field. The following step of the first task was to correct and process the magnetic data by eliminating the diurnal variations to produce maps for inter-pretation by using Geosoft Oasis and ArcGIS 10.2.1.
The second step is to manage the geochemical data of the soil obtained from the SYSMIN project.
4. Results and Discussion 4.1. Geophysical Map
The data processing results compiled by the software are displayed on maps format such as the geophysical anomalies map (Figure 3). Using of the Th, K, and U anomaly maps proves the existence of these elements via radiometric da-ta, deduce nature of the rocks predominate and alteration type in our study area.
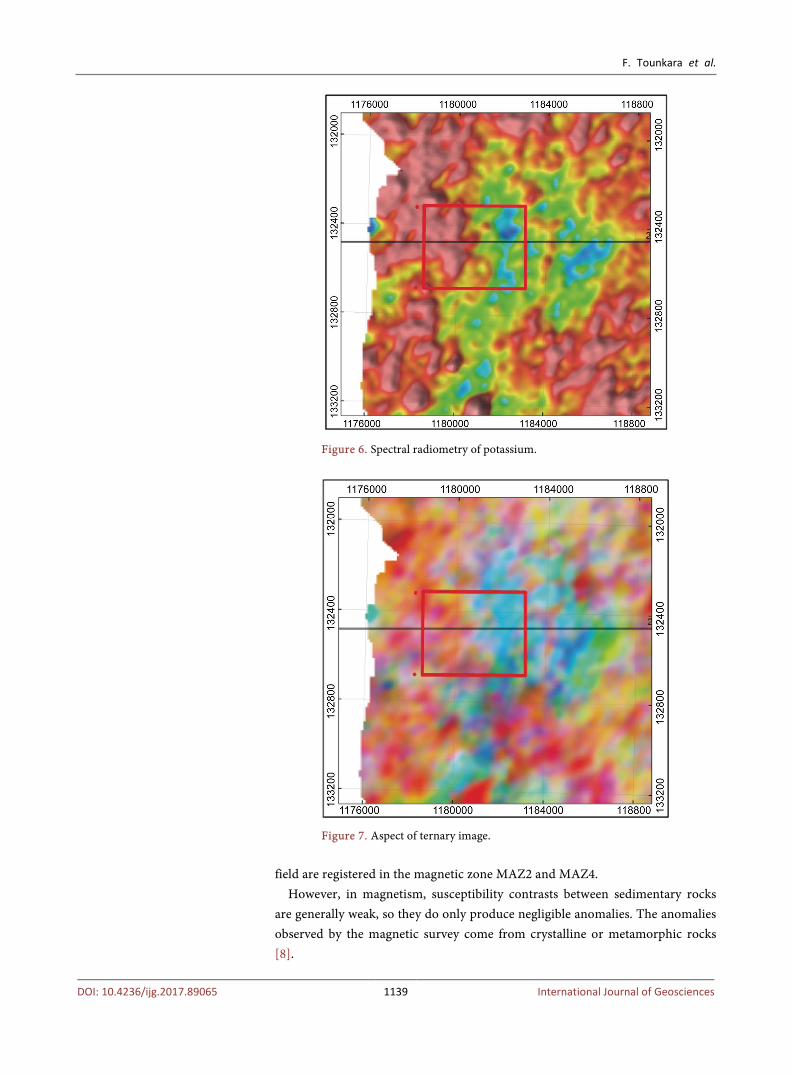
Potassium (i.e. K) anomaly map on (Figure 4), thorium (i.e. Th) anomaly map on (Figure 5), uranium (i.e. U) anomaly map (Figure 6), ternary images map on (Figure 7), after the inspection of the total field map in the sector, it is processed to get a geophysical anomalies map (Figure 3).
There are four magnetic anomalies zones (MAZ) that we can be identified with their coordinates (Table 1).
In fact the measured values of the total field intensity are characterized by a significant variation compared with an average bottom level having an order of magnitude of 326240 nanotestla from green to yellow. The total field intensity oscillations are intense at the MAZ2 and MAZ4 zone and very low at ZAM3 as shows the magnetic relief.
In the MAZ1 zone, we notice in addition to their high intensity, the earth
DOI: 10.4236/ijg.2017.89065 1137 International Journal of Geosciences
Figure 3. Geophysical map showing the magnetic field intensity in a portion of the study area with identification of four magnetic anomalies zones (MAZ1, MAZ2, MAZ3, and MAZ4).
magnetic field variations are relatively complex, because of a high disturbance and irregularities of the magnetic contours are observed. The oscillations define the anomaly having globally an elongated shape towards NE-SW direction.
The magnetic signature of the sector is characterized by the existence of these
DOI: 10.4236/ijg.2017.89065 1138 International Journal of Geosciences
Figure 4. Spectral radiometry of thorium.
Figure 5. Spectral radiometry of uranium.
four zones located respectively in the prospected area of Kouremale. In spite of the low magnetic signatures in the MAZ3, the high variations of the magnetic
DOI: 10.4236/ijg.2017.89065 1139 International Journal of Geosciences
Figure 6. Spectral radiometry of potassium.
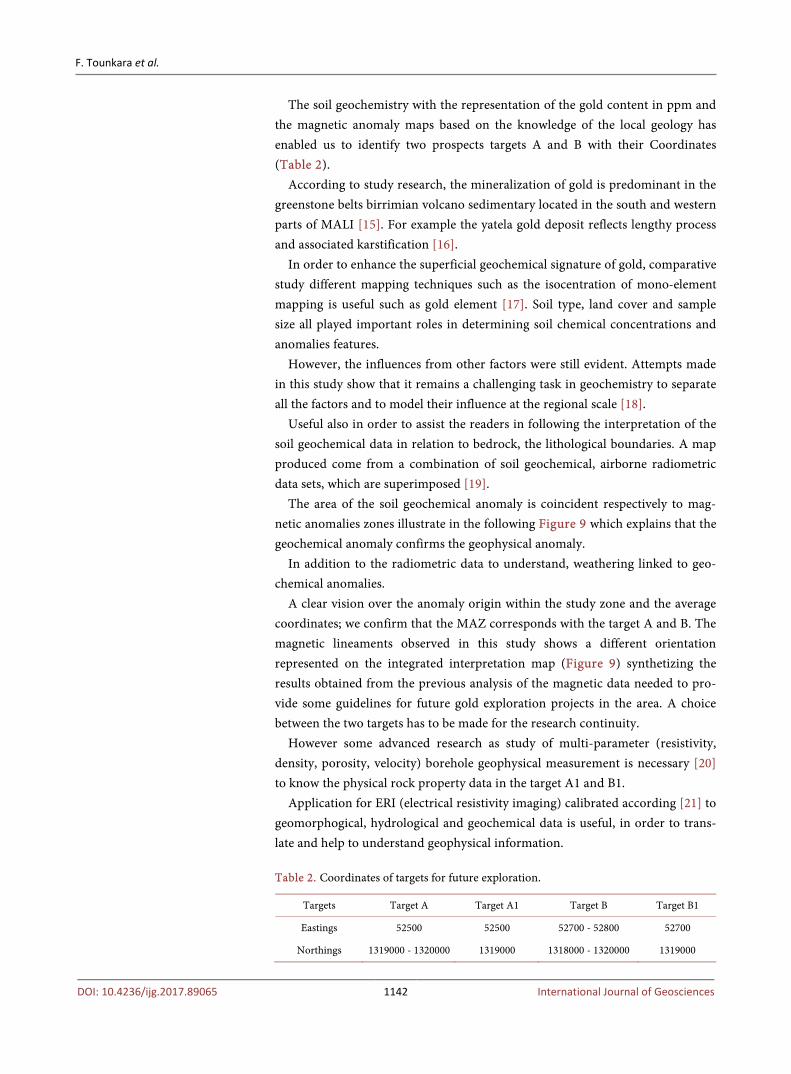
Figure 7. Aspect of ternary image.
field are registered in the magnetic zone MAZ2 and MAZ4.
However, in magnetism, susceptibility contrasts between sedimentary rocks are generally weak, so they do only produce negligible anomalies. The anomalies observed by the magnetic survey come from crystalline or metamorphic rocks [8].
These zones constitute a potential area to be explored due to the convergences
noticed between different anomalies (Figure 8). However, analysis of the Th, K, U anomaly maps proves the existence of these
elements via radiometric data will permit to define some structures and correlate them with those being defined by the magnetic data [9].
The abundance of these gamma-rays will depend on the geology rocks. For example, limestone units are characterised by high values in uranium, whereas shale and grit units are characterised by higher levels of thorium.
In excess of fifty radioactive isotopes occur naturally, three of these isotopes emit gamma-rays of sufficient intensity to be of use during aerial surveying, po-tassium (40K), thorium (232Th) and uranium (238U) [10].
The ternary image, such as illustrated by the (Figure 7) is performed by a primary color assigning to each of the abundance of the radioelements. There-fore, potassium is assigned to red, thorium is assigned to green and uranium is assigned blue. Count rate total count is used to assign an intensity scale for each of these elements (U, Th, K) and the resulting colors. The aspect of the plan in-dicates that the red and green are too high relative to blue depending on the di-mension of study area. Which means high intensity of K and Th compared with U and a very important erosion and there are many saprolithes in the locality of Kouremale.
The different colors on the map correspond closely to some different types of rocks collected and described in the study area [11]. According to geological study, we were able to deduce the nature of the rocks predominate in our study area, so it is acid to intermediate igneous and siliceous clastics.
In general, the important of radiometric surveys is for the discovery of ura-nium deposits but also further note that radiometric surveys can be effectively used for mapping alteration zones [12].
Therefore, potassic alteration often results in the elevated K radiation particu-larly for mafic rock, and then anomalous K/Th ratios along local shear or frac-ture zones (Figure 2) may be indicative of gold-bearing mineralization. For high U/Th ratio within meta-sedimentary units may indicate sulphidization. Varia-tion of U/Th ratios largely reflects the environment condition during the prima-ry diagenesis or a later deformational phase mainly the decrease in Th radiation close to sulfide mineralization seems to be responsible for the elevated U/Th ra-tios [13].
By analyses of aeromagnetic anomalies [14], the relative contents of radioele-ments in rocks are changed in the same hydrothermal processes and partly for the same reasons as the ferromagnetic minerals [14].
DOI: 10.4236/ijg.2017.89065 1141 International Journal of Geosciences
Figure 8. Soil geochemical map of the study area with target A1, B1 and gold content (ppm).
4.2. Soil Geochemistry Map
After the study of magnetic and radiometric maps, soil geochemical map of the study area is on (Figure 8). The gold samples taken at ground level from 10 to 30 cm deep. Those gold values (ppm) are presented on map.
The distribution of gold in soil samples explains that, the area has a high con-centration of the gold content (1500 ppm) and an average concentration of the gold content (92 ppm). The average coordinate of target point A1 and B1 is also presented on the geochemical soil map and useful to correlate with geophysical maps.
DOI: 10.4236/ijg.2017.89065 1142 International Journal of Geosciences
The soil geochemistry with the representation of the gold content in ppm and the magnetic anomaly maps based on the knowledge of the local geology has enabled us to identify two prospects targets A and B with their Coordinates (Table 2).
According to study research, the mineralization of gold is predominant in the greenstone belts birrimian volcano sedimentary located in the south and western parts of MALI [15]. For example the yatela gold deposit reflects lengthy process and associated karstification [16].
In order to enhance the superficial geochemical signature of gold, comparative study different mapping techniques such as the isocentration of mono-element mapping is useful such as gold element [17]. Soil type, land cover and sample size all played important roles in determining soil chemical concentrations and anomalies features.
However, the influences from other factors were still evident. Attempts made in this study show that it remains a challenging task in geochemistry to separate all the factors and to model their influence at the regional scale [18].
Useful also in order to assist the readers in following the interpretation of the soil geochemical data in relation to bedrock, the lithological boundaries. A map produced come from a combination of soil geochemical, airborne radiometric data sets, which are superimposed [19].
The area of the soil geochemical anomaly is coincident respectively to mag-netic anomalies zones illustrate in the following Figure 9 which explains that the geochemical anomaly confirms the geophysical anomaly.
In addition to the radiometric data to understand, weathering linked to geo-chemical anomalies.
A clear vision over the anomaly origin within the study zone and the average coordinates; we confirm that the MAZ corresponds with the target A and B. The magnetic lineaments observed in this study shows a different orientation represented on the integrated interpretation map (Figure 9) synthetizing the results obtained from the previous analysis of the magnetic data needed to pro-vide some guidelines for future gold exploration projects in the area. A choice between the two targets has to be made for the research continuity.
However some advanced research as study of multi-parameter (resistivity, density, porosity, velocity) borehole geophysical measurement is necessary [20] to know the physical rock property data in the target A1 and B1.
Application for ERI (electrical resistivity imaging) calibrated according [21] to geomorphogical, hydrological and geochemical data is useful, in order to trans-late and help to understand geophysical information. Table 2. Coordinates of targets for future exploration.
DOI: 10.4236/ijg.2017.89065 1143 International Journal of Geosciences
Figure 9. 2D integrated interpretation map showing two potential targets A and B of gold anomaly.
To know the origin of magnetic anomalies, its extension and its amplitude
being a major structural element requires in-depth study of the electrical proper-ties of the crust of the surrounding basin [22], and the fractional anomaly sepa-ration procedure are the important methods and techniques [23]. However, all primary gold deposit, prospects and showings that we studied in West Africa can be classified as orogenic type gold deposits [24].
5. Conclusions
As a conclusion, detecting the anomalies’ sources location in the vast territory such as Kouremale area is to target high anomaly.
According to the 2D integrated interpretation image coming from the combi-nation of the different maps (Figure 9), and referring to the geological informa-tion verified on the field, we have judged target B to be the best gold anomaly source in vast territory such as Kouremale.
The delimitation of the space of the target B from the geophysical and geo-chemical information confirms the existence of limited, restricted, and potential anomaly.
DOI: 10.4236/ijg.2017.89065 1144 International Journal of Geosciences
This is confirmed by the gold content registered on the field. Therefore, the geochemical anomaly confirmed the magnetic anomaly. However, our field knowledge allowed specifying target B. The distribution of the radioelements re-flects the geochemistry and mineralogy of bedrock and regolith materials. K, U and Th precipitate late in the igneous and volcanic crystallization sequence, usually observed on the field, even if the geochemical anomaly confirms for geophysical anomaly.
However, investigation of the geophysical and geochemical properties of rocks is essential for gold mineral assessment.
Acknowledgements
This study research has been financially supported by the Minister of Mines of Mali under (SYSMIN PROJECT 2002), that we would like to thank sincerely. Special thanks to my supervisor in state key laboratory of geological processes and mineral resources, China University of Geosciences, Wuhan. Thanks also all colleagues from National School of Engineers Abderhamane Baba TOURE of MALI for their advice.
References [1] Kusnir, I. (1999) Gold in Mali. Acta Montanistica Slovaca, 4, 311
[2] Feybess, G. (2006) Notice explicative de la carte géologique de la republique du Mali à 1/200000. [Explanatory Note of the Geological Map of the Republic of Mali at 1/200, 000.] Unpublished Report.
[3] Ibrahima Ballo, K.A.A.H., Guindo, B., Sanogo, L., Ouologuem, Y., Daou, G. and Traore, A. (2015) The Syama and Tabakoroni Goldfiefd, Mali. Ore Geology Re-views, 78, 578-585.
[4] Bassot J.P, Meloux, J. and Traore, H. (1981) Géologie du Mali. Unpublished Report, 17, 18.
[5] Teschner, B.A (2014) Orpaillage Pays for Everything: How Artisanal Mining Sup-ported Rural Institutions Following Mali’s Coup d’etat. Futures, 62, 141.
[6] Feybesse (2006) Geological Synthesis of the Malian Birimian Edition Sysmin.
[7] Sangaré, S. (1994) Les facteurs pétrogénitiques de l‟aurification dans la zone de Kalana (sud du Mali). [The Petrogenic Factors of Aurification in the Area of Kalana (Southern Mali).] Unpublished Report.
[8] Mooney and Bleifurs (1953) Geophysique pour les geologies. [Geophysics for Geol-ogists.] Tome2.
[9] Foulger, G.R. and Pierce, C. (2002) Geological Methods in Geology, 13.
[10] Ugalde, H.A., PGW, S.A., Reford, S.W., Paterson, Grant & Watson Limited, Ales-sandro Colla Scintrex Ltd (2000) Radiometry and Magnetism: On the Usefulness of High-Resolution Airborne Magnetic and Radiometric Data in an Area of Sedimen-tary Cover: Calama West, Northern Chile. Summary, 3.
[11] Kearey and Brookes (1991) A “Typical” Ternary Diagram to Show the Distribution of Uranium, Thorium and Potassium (x10-4) in Selected Rock Types.
[12] Denith, M. and Mudge, S.T. (2014) Geophysics for the Mineral Exploration. 438.
[13] Airo, M.L. (2001) Aeromagnetic and Aeroradiometric Response to Hydrothermal Alteration. Surveys in Geophysics, 23, 273-302.
DOI: 10.4236/ijg.2017.89065 1145 International Journal of Geosciences
[14] Mainguy, C. (2010) Natural Resources and Development: The Gold Sector in Mali. Ore Geology Reviews, 36, 123-131.
[15] Dunbar, P. and Sangare (2010) Technical Review of the Yanfoliala Gold Concession Mali, West Africa. 34.
[16] Stevenson, M.G., Mc Cullagh, M.J. and Cuss, R. (2000) The Application of GIS in the Interpretation of Radiometric and Electromagnetic Surveys to Mapping Geo-logical and Environmental Features. 2-4.
[17] Reis, A.P. (2001) Soil Geochemical Propecting for Gold at Marrancos (Northern Portugal).
[18] Jordan, C. (2007) Using GIS and Statistics to Study Influences of Geology on Prob-ability Features of Surface Soil Geochemistry in Northern Ireland.
[19] Sadeghi, M. (2014) Analysis and Mapping of Soil Geochemical Anomalies Implica-tions for Bedrock Mapping and Gold Exploration in Giyani Area, South Africa. Journal of Geochemical Exploration, 154, 180-193.
[20] Mwenifumbo, C.J., Elliott, B.E., Jefferson, C.W., Bernius, G.R. and Pflug, K.A. (2003) Physical Rock Properties from the Athabasca Group: Designing Geophysical Exploration Models for Unconformity Uranium Deposit. Journal of Applied Geo-physics, 119.
[21] Zarroca, M., Lineaires, R., Patricio, C., Lopez, V., Roque, C. and Rodriguez, R. (2014) Application of Electrical Resistivity Imaging ERI to Tailings Dam Project for Artisanal and Small-Scale gold Mining in Zaruna-Pprtovelo, Ecuador.
[22] Van Ngoc, P., Boyer, D. and Le Mouel, J.-L. (2000) Nouveaux arguments sur l’origine de l’anomalie magnétique du basin parisien (AMBP) d ‘après les proprietes electriques de la croute. [New Arguments about the Origin of the Paris Basin Magnetic Anomaly (PBMA) from the Electrical Properties of the Crust.] Earth and Planetary Sciences, 331, 443-449. https://doi.org/10.1016/S1251-8050(00)01439-7
[23] Quentin Masurel, N.T., Mille, J., Ulrich, S., Hein, K.A.A., Hanssen, E., Kaisin, J. and Tessougue, S. (2015) The Yatela Gold Deposit in Mali, West Africa the Final Prod-uct of Long-Lived History of Hydrothermal Alteration and Weathering. Journal of African Earth Sciences, 86.
[24] Beziat, D., Dubois, M., Debat, P., Nikiema, S., Salvi, S. and Tollon, F. (2008) Gold Metallogeny in the Birimian Craton of Burkina Faso (West Africa). Journal of Afri-can Earth Sciences, 50, 215-233.
Submit or recommend next manuscript to SCIRP and we will provide best service for you:
Accepting pre-submission inquiries through Email, Facebook, LinkedIn, Twitter, etc. A wide selection of journals (inclusive of 9 subjects, more than 200 journals) Providing 24-hour high-quality service User-friendly online submission system Fair and swift peer-review system Efficient typesetting and proofreading procedure Display of the result of downloads and visits, as well as the number of cited articles Maximum dissemination of your research work
Submit your manuscript at: http://papersubmission.scirp.org/ Or contact [email protected]


![Loca Phenomena [Autosaved]](https://static.documents.pub/doc/80x56/55cf96c8550346d0338dc1cd/loca-phenomena-autosaved.jpg)


